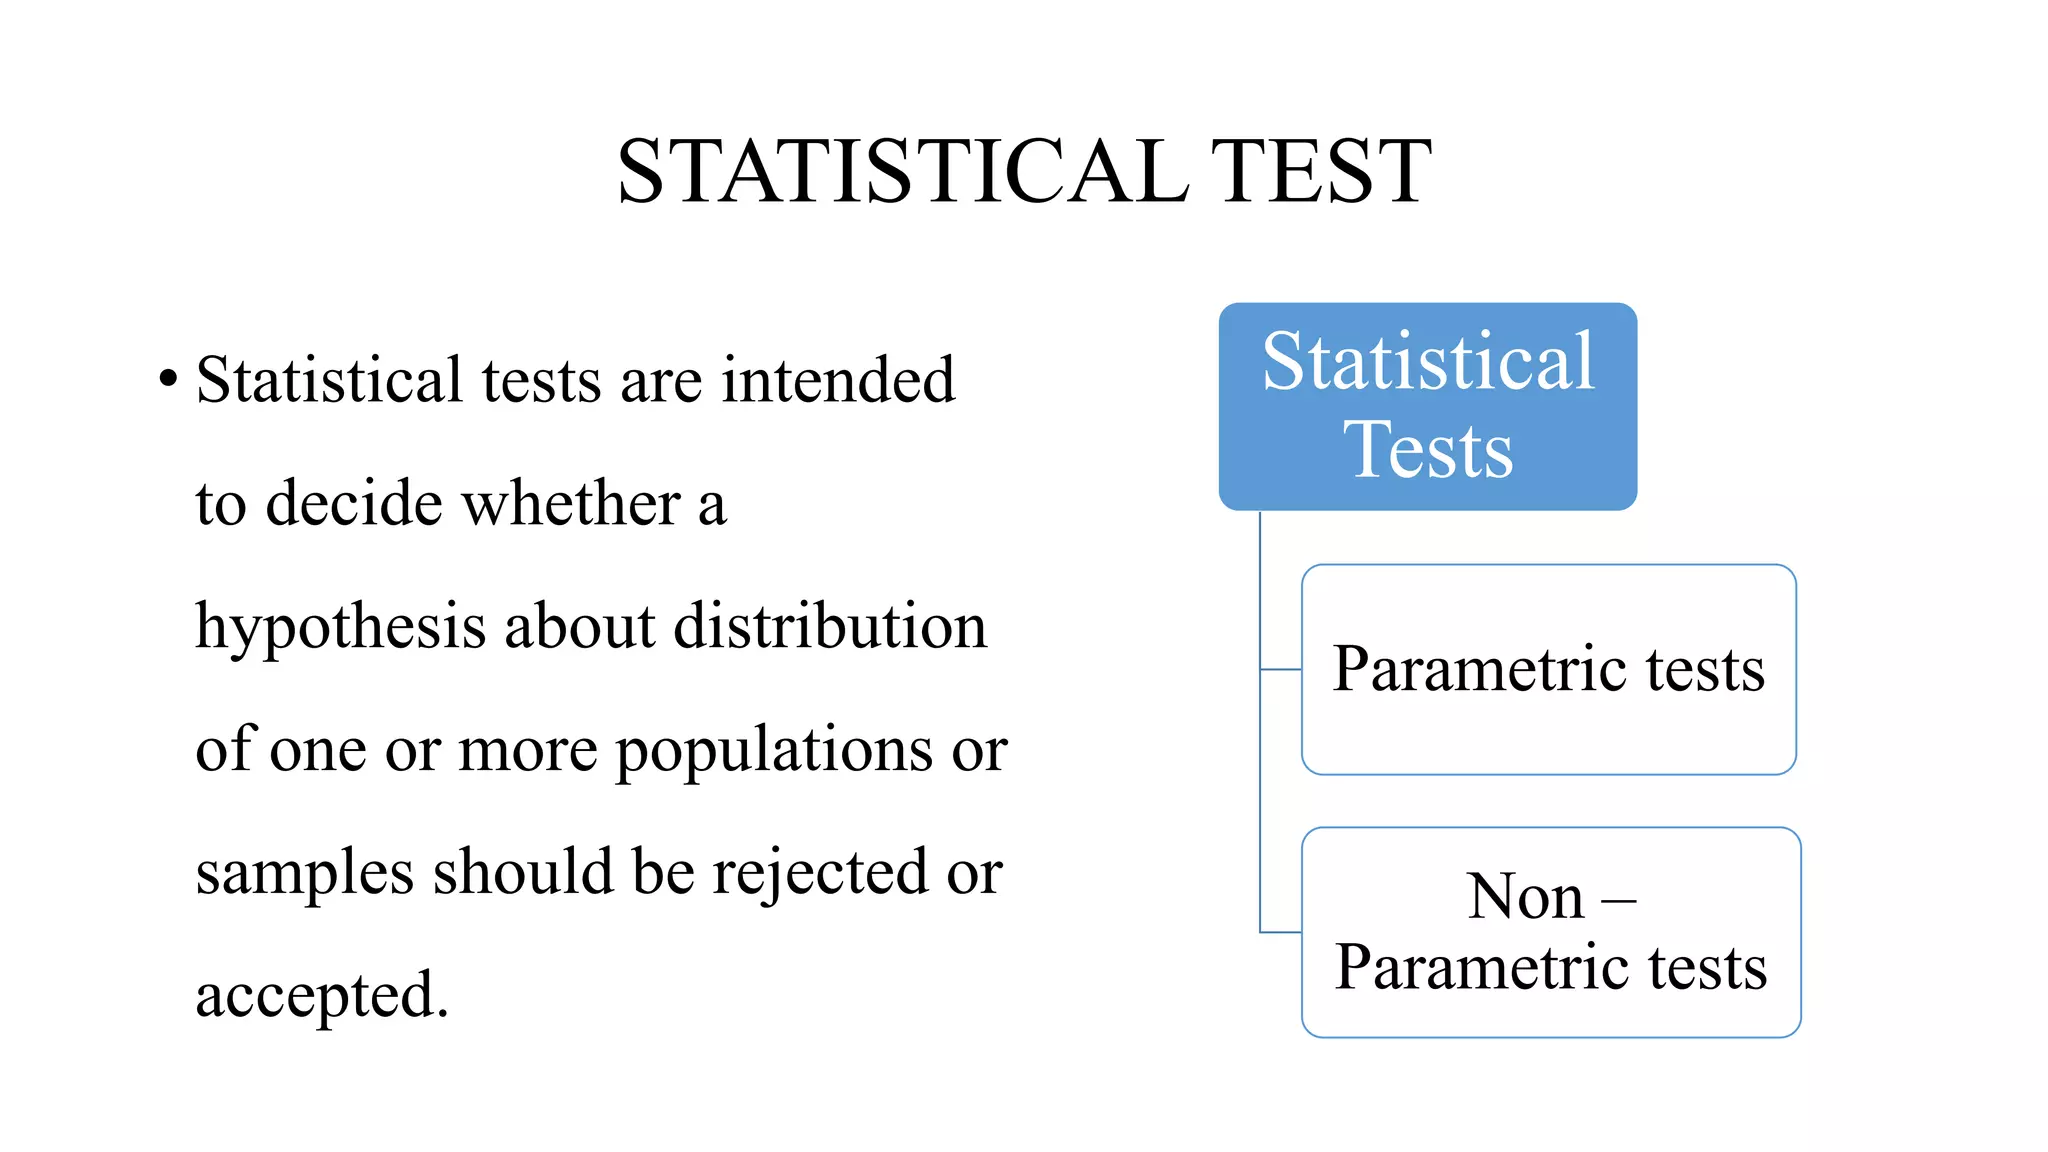
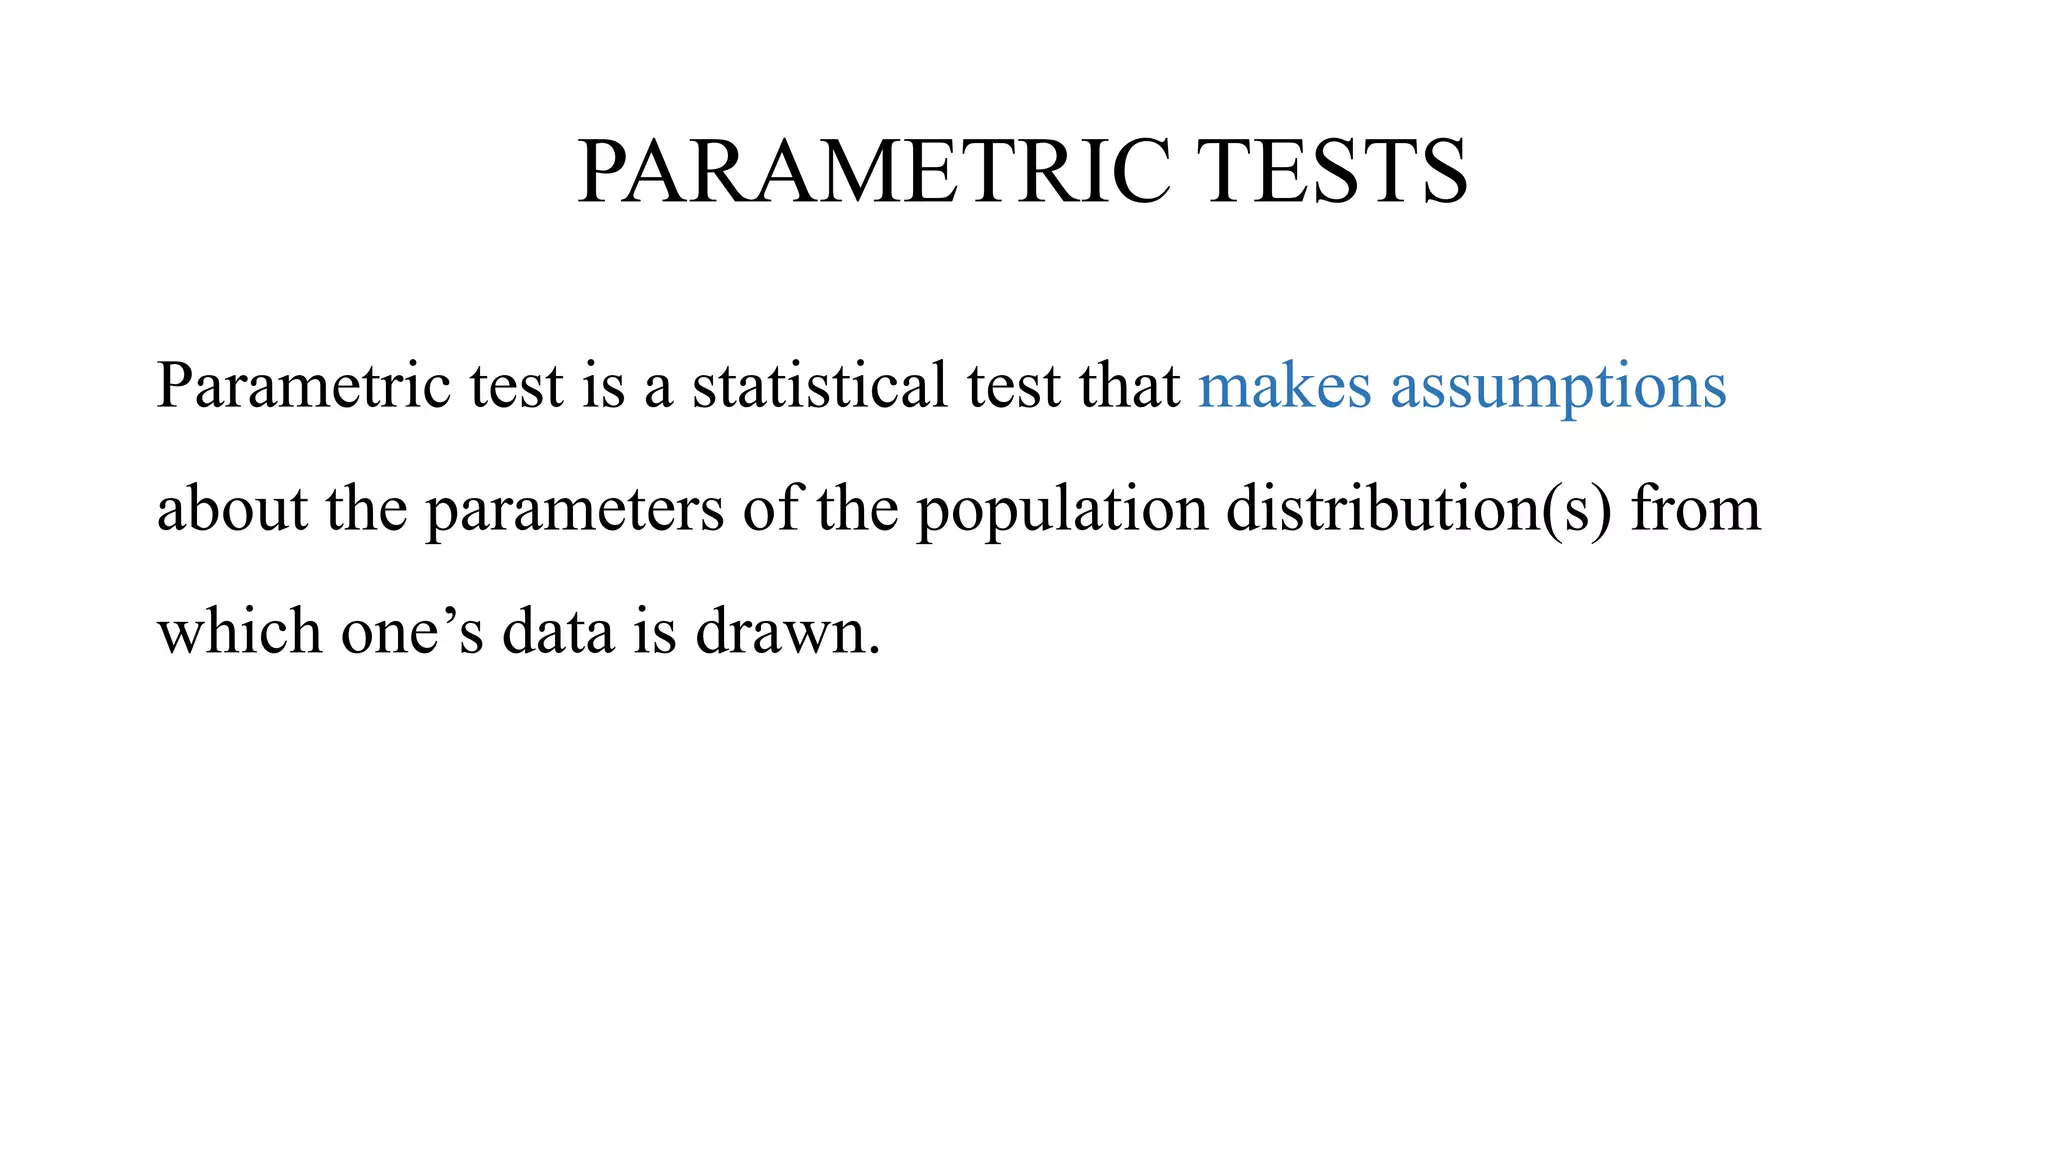
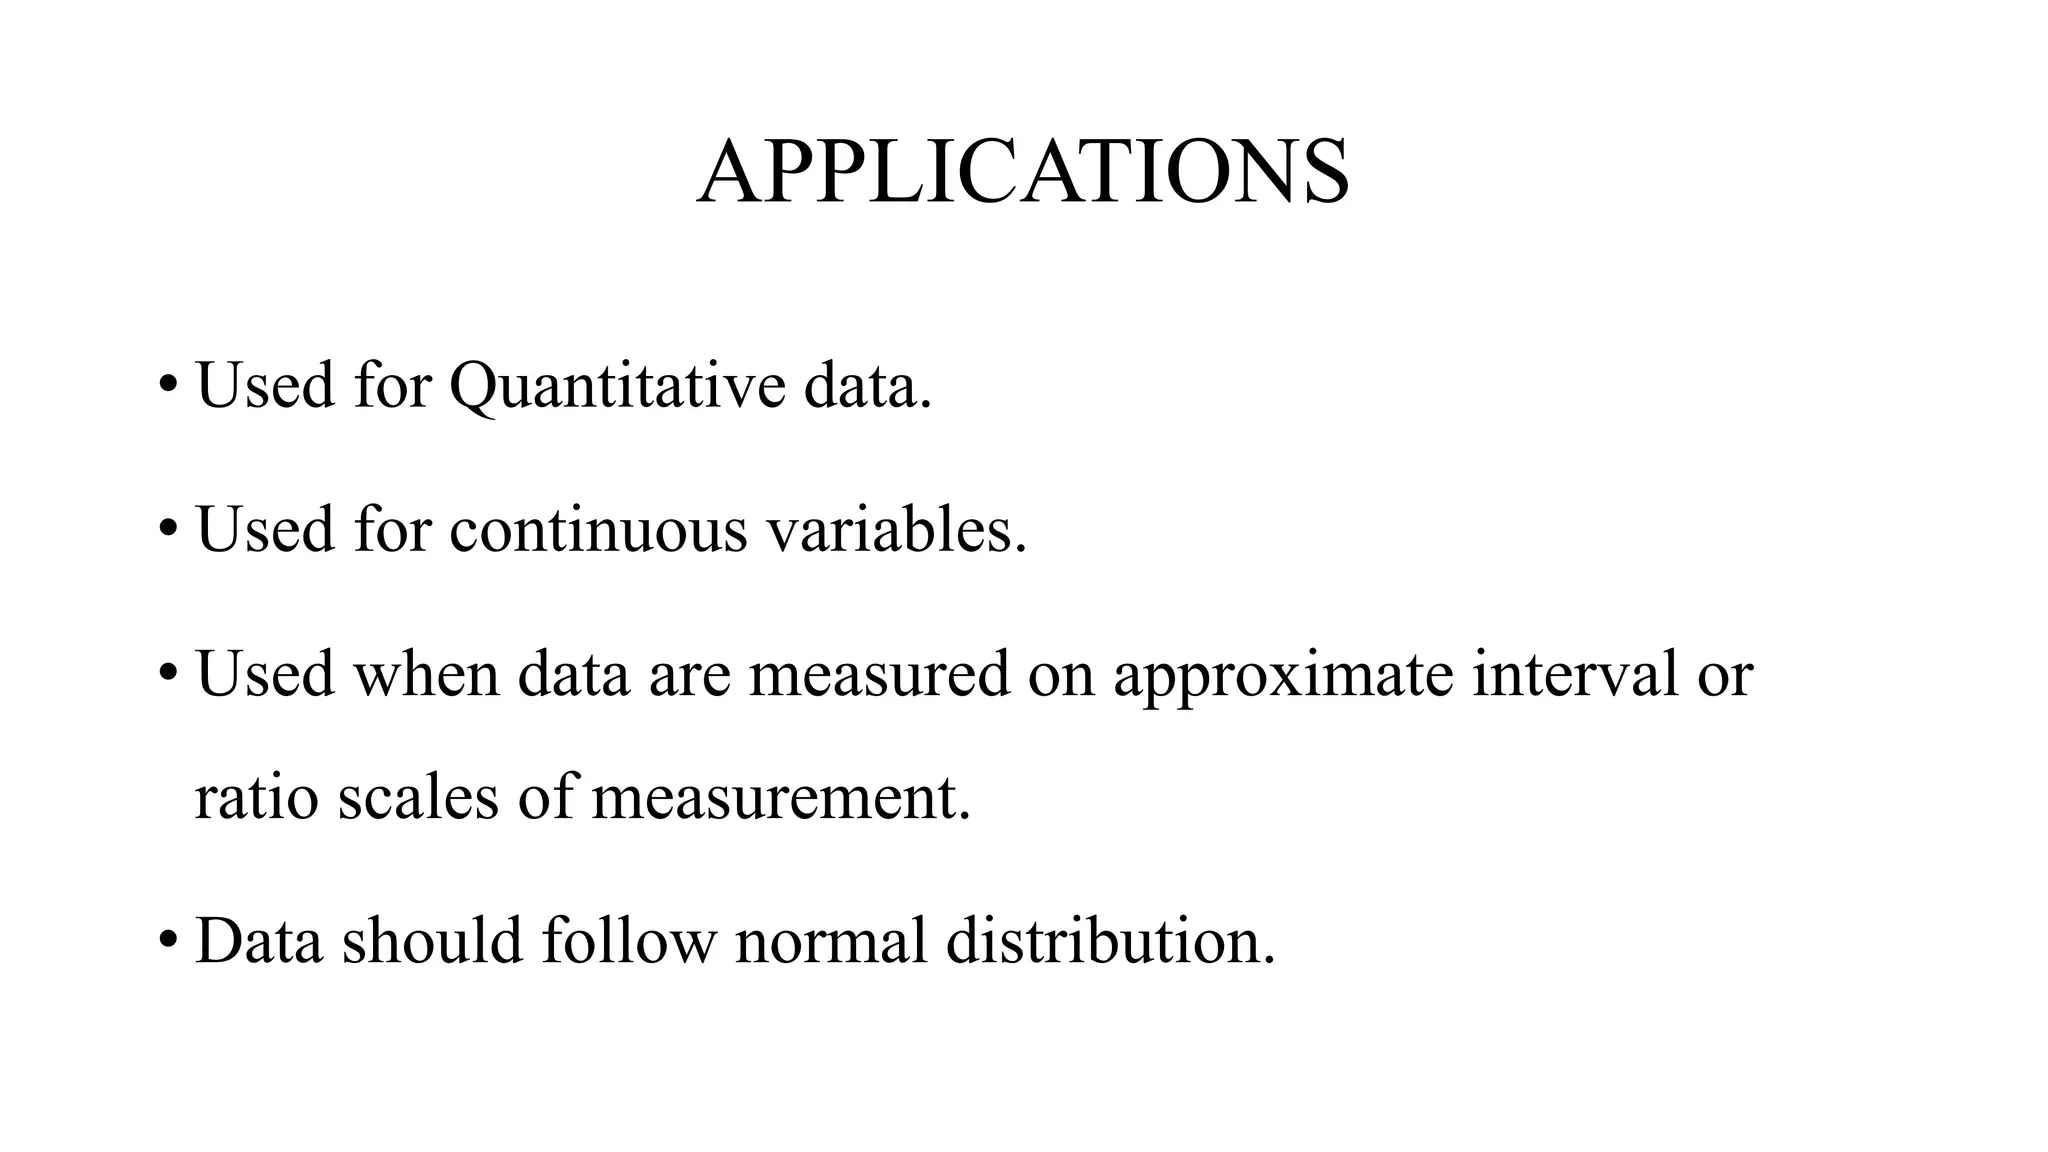
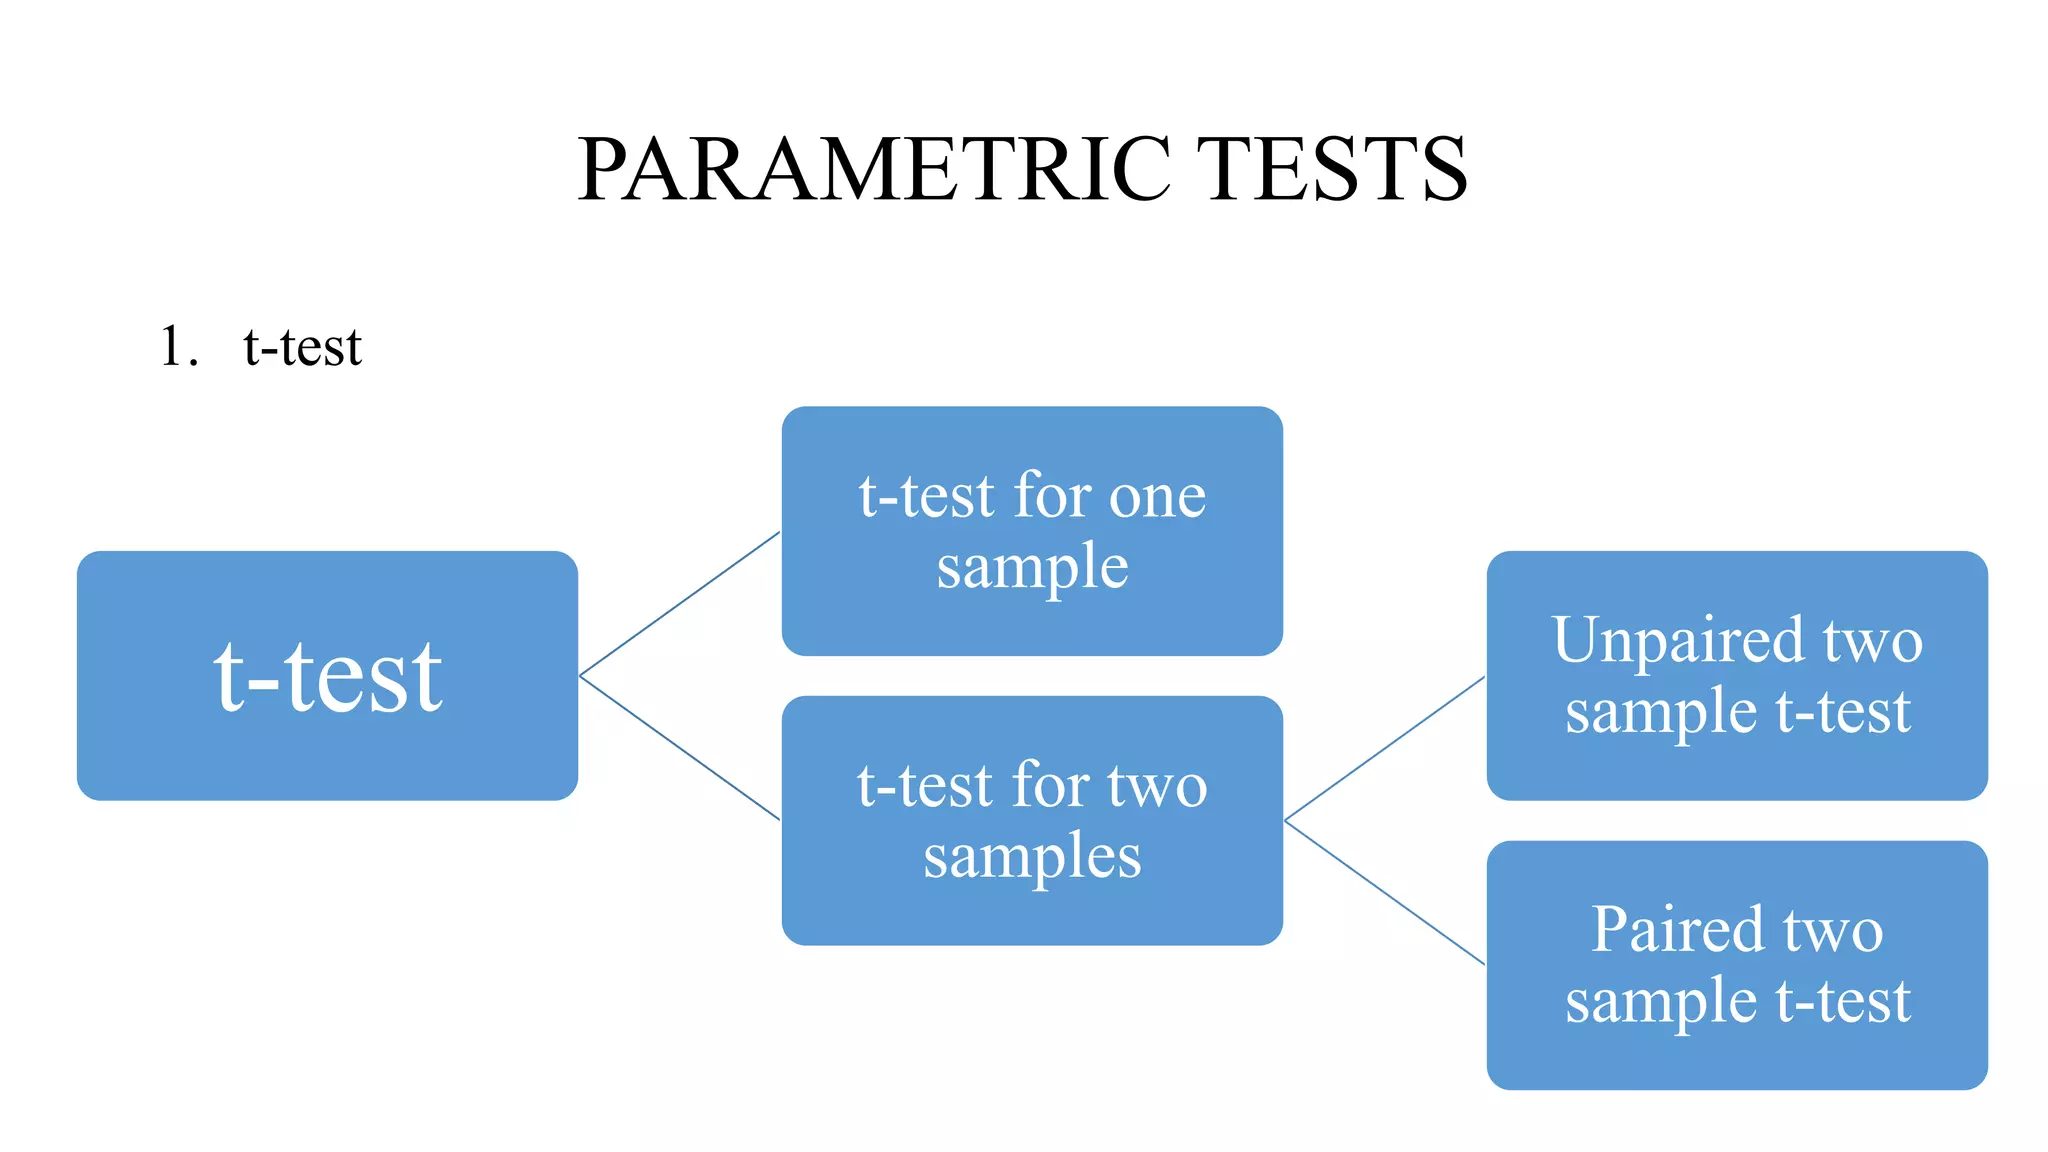
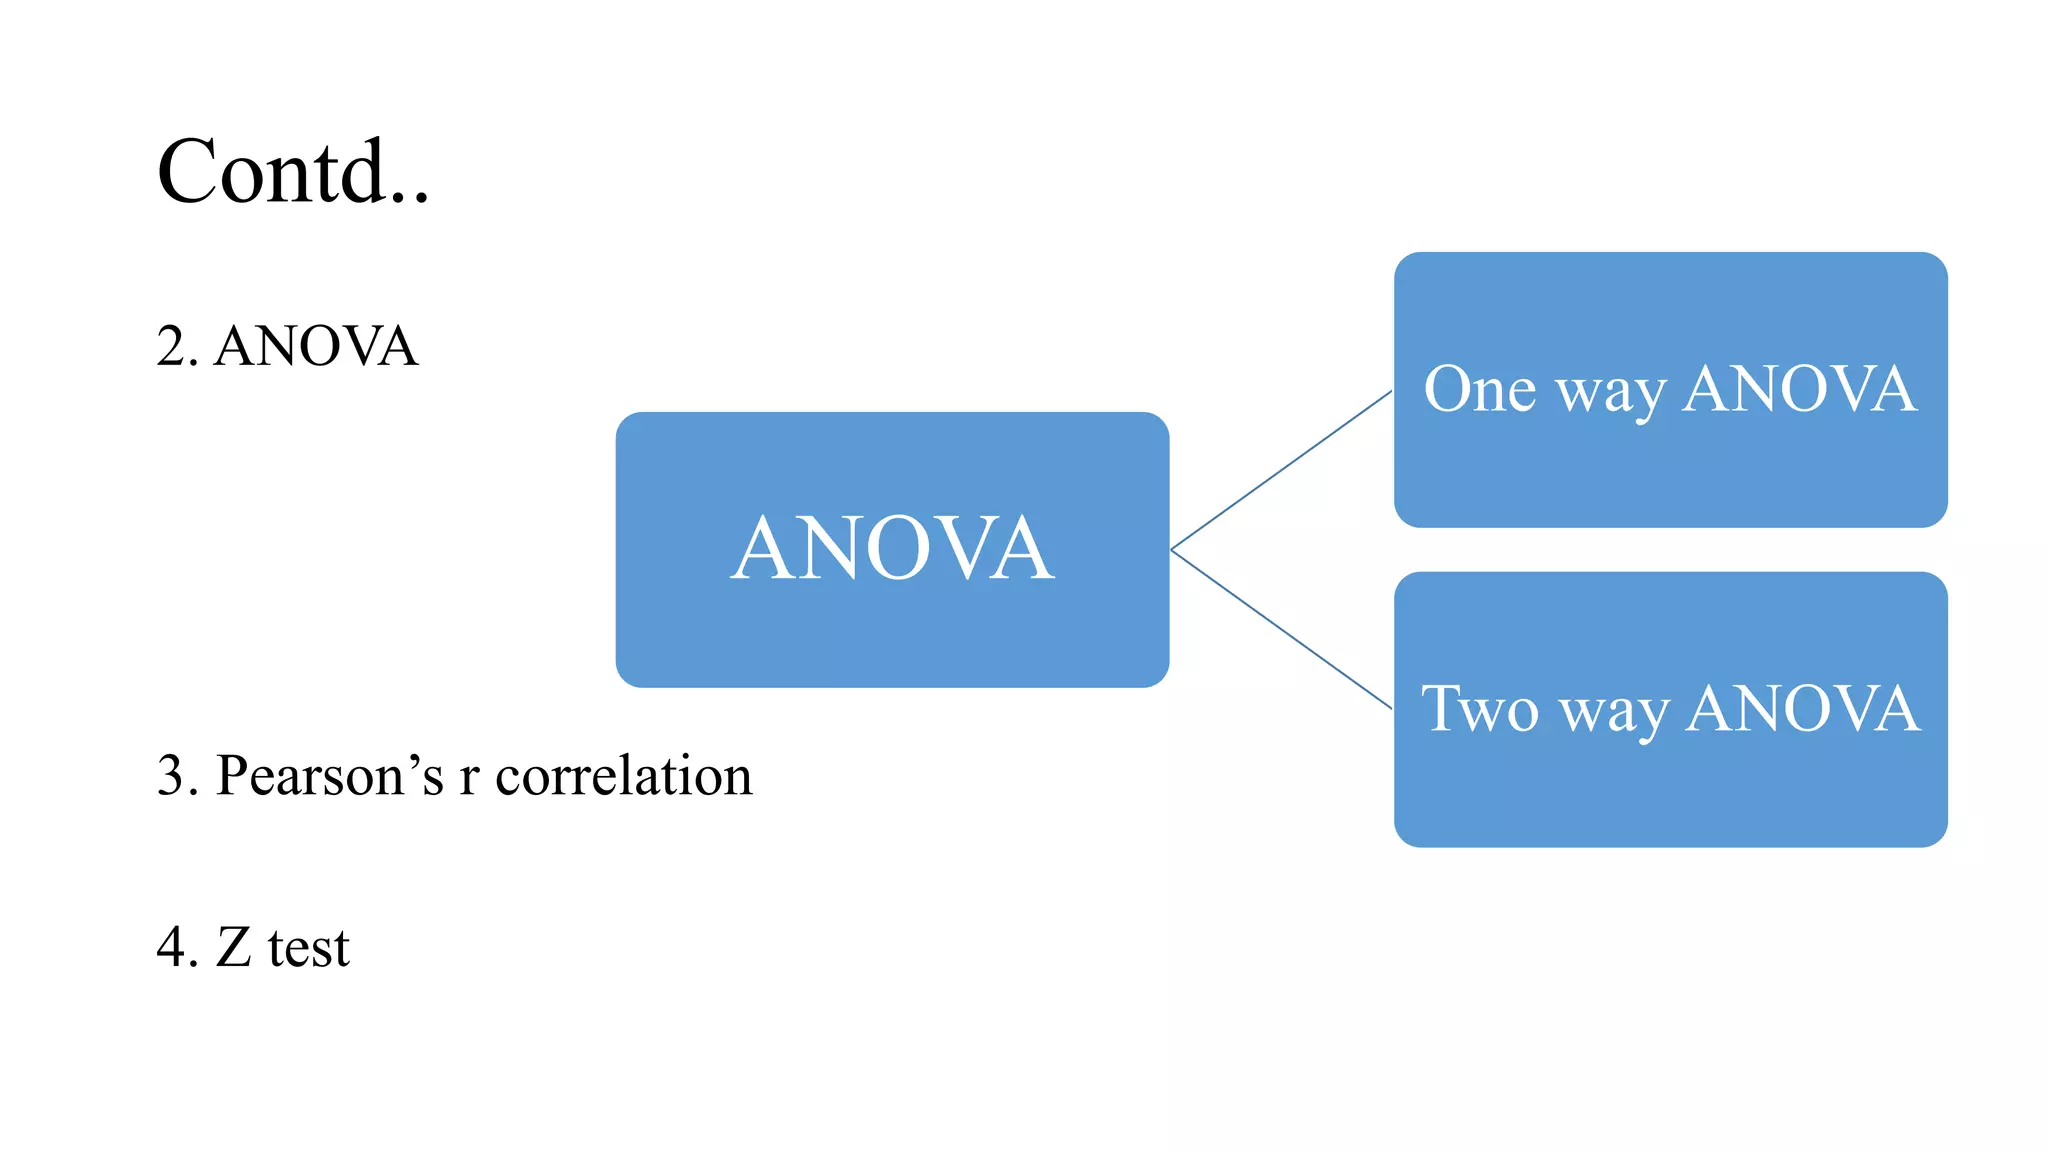
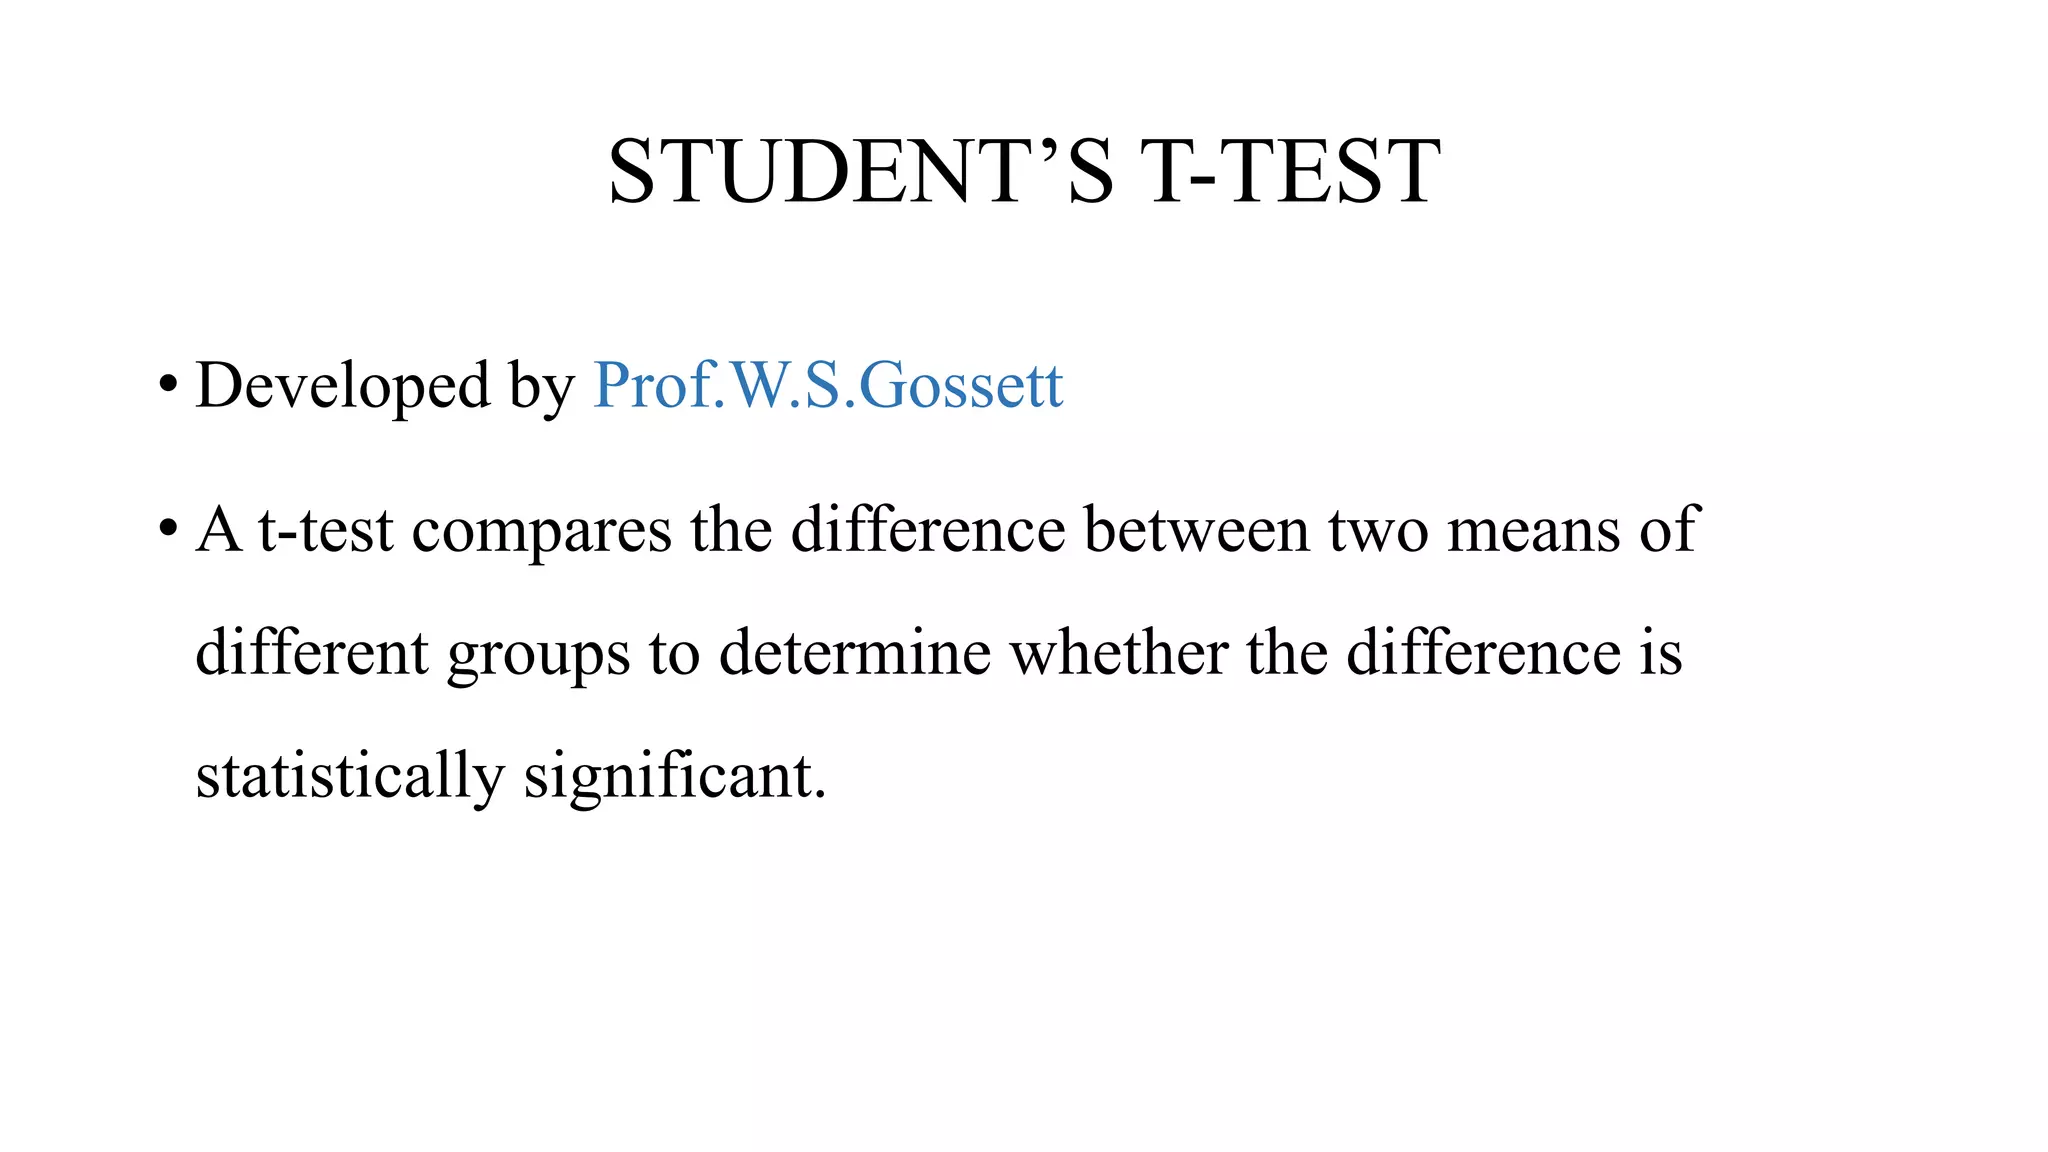
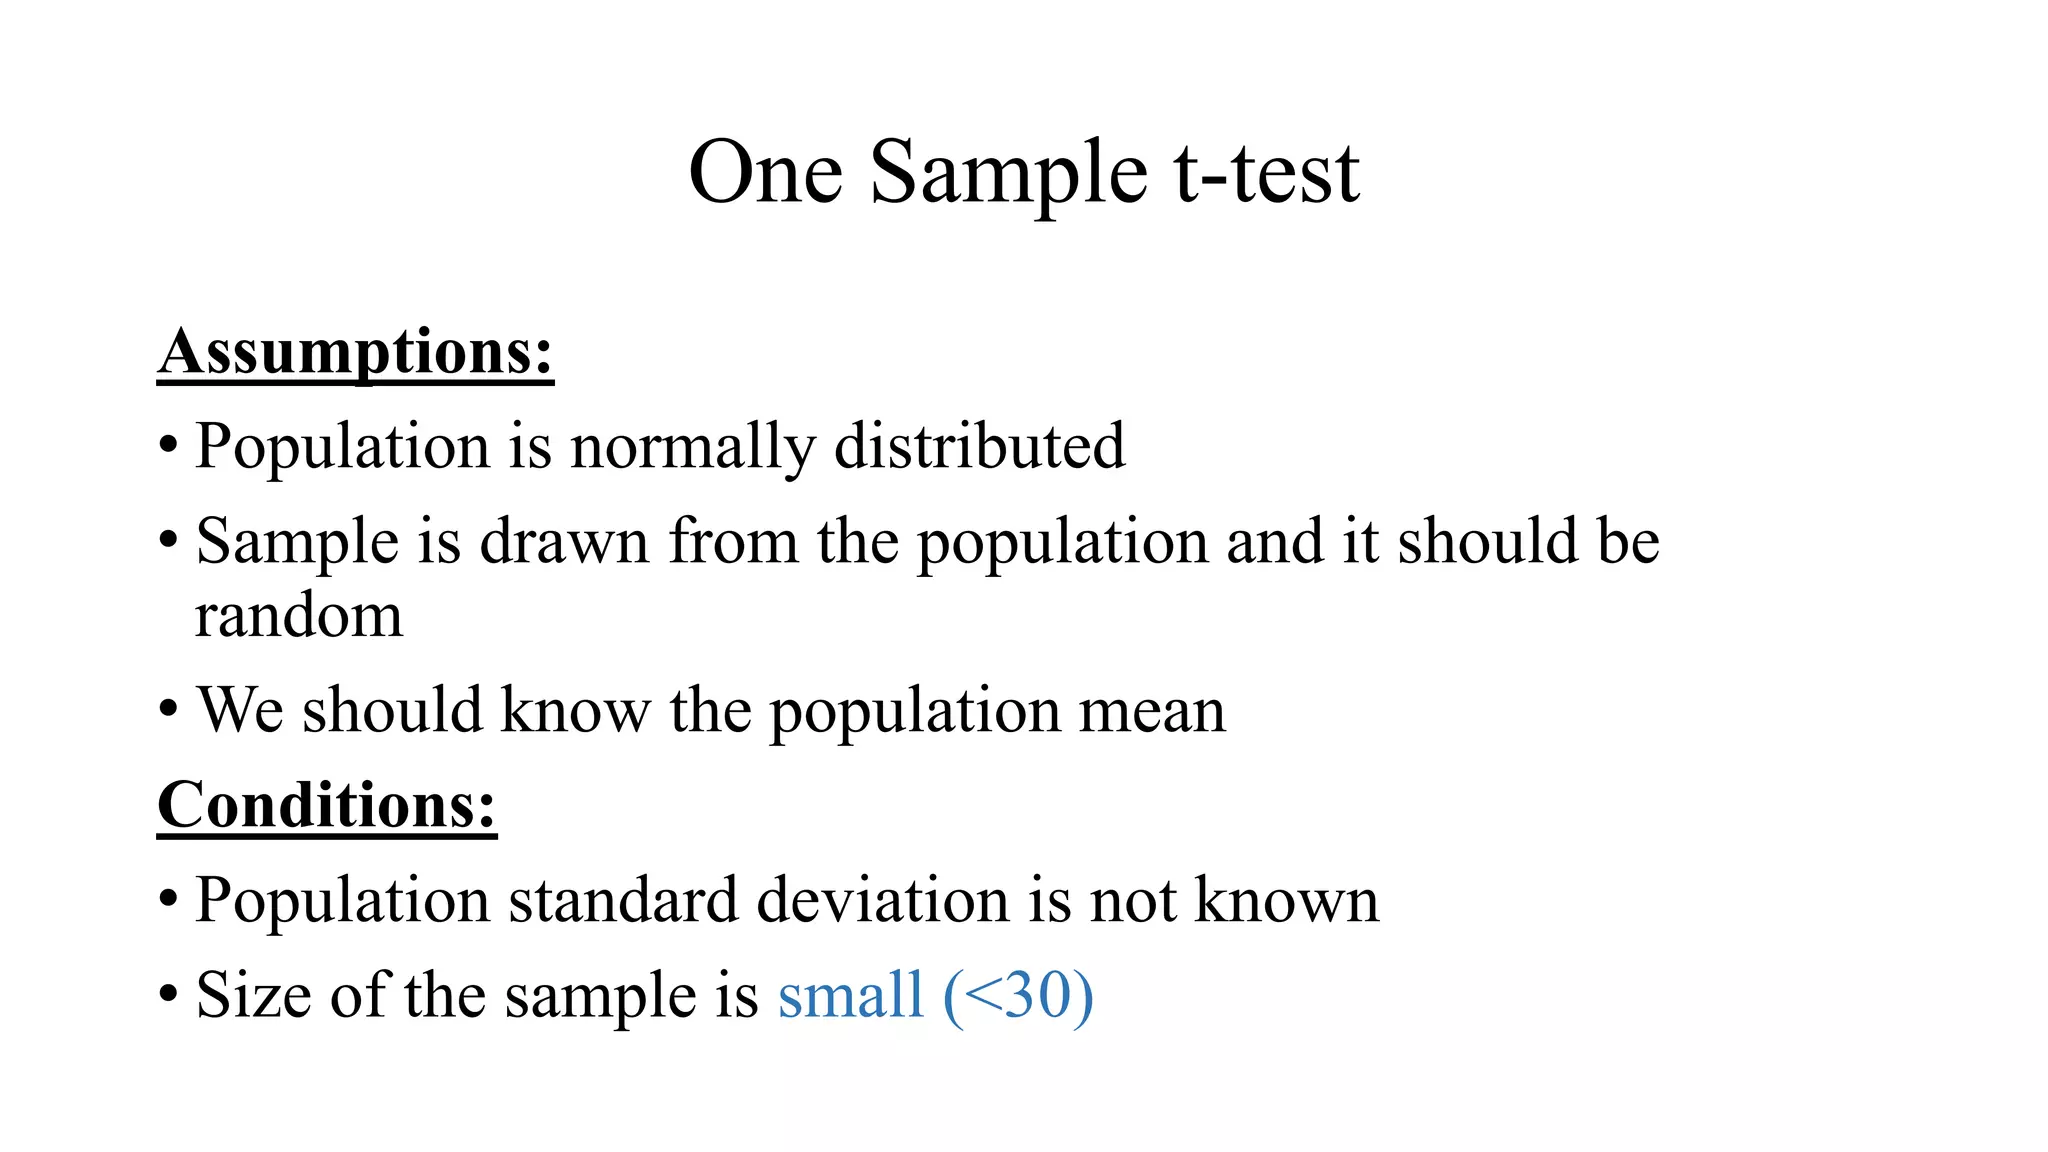
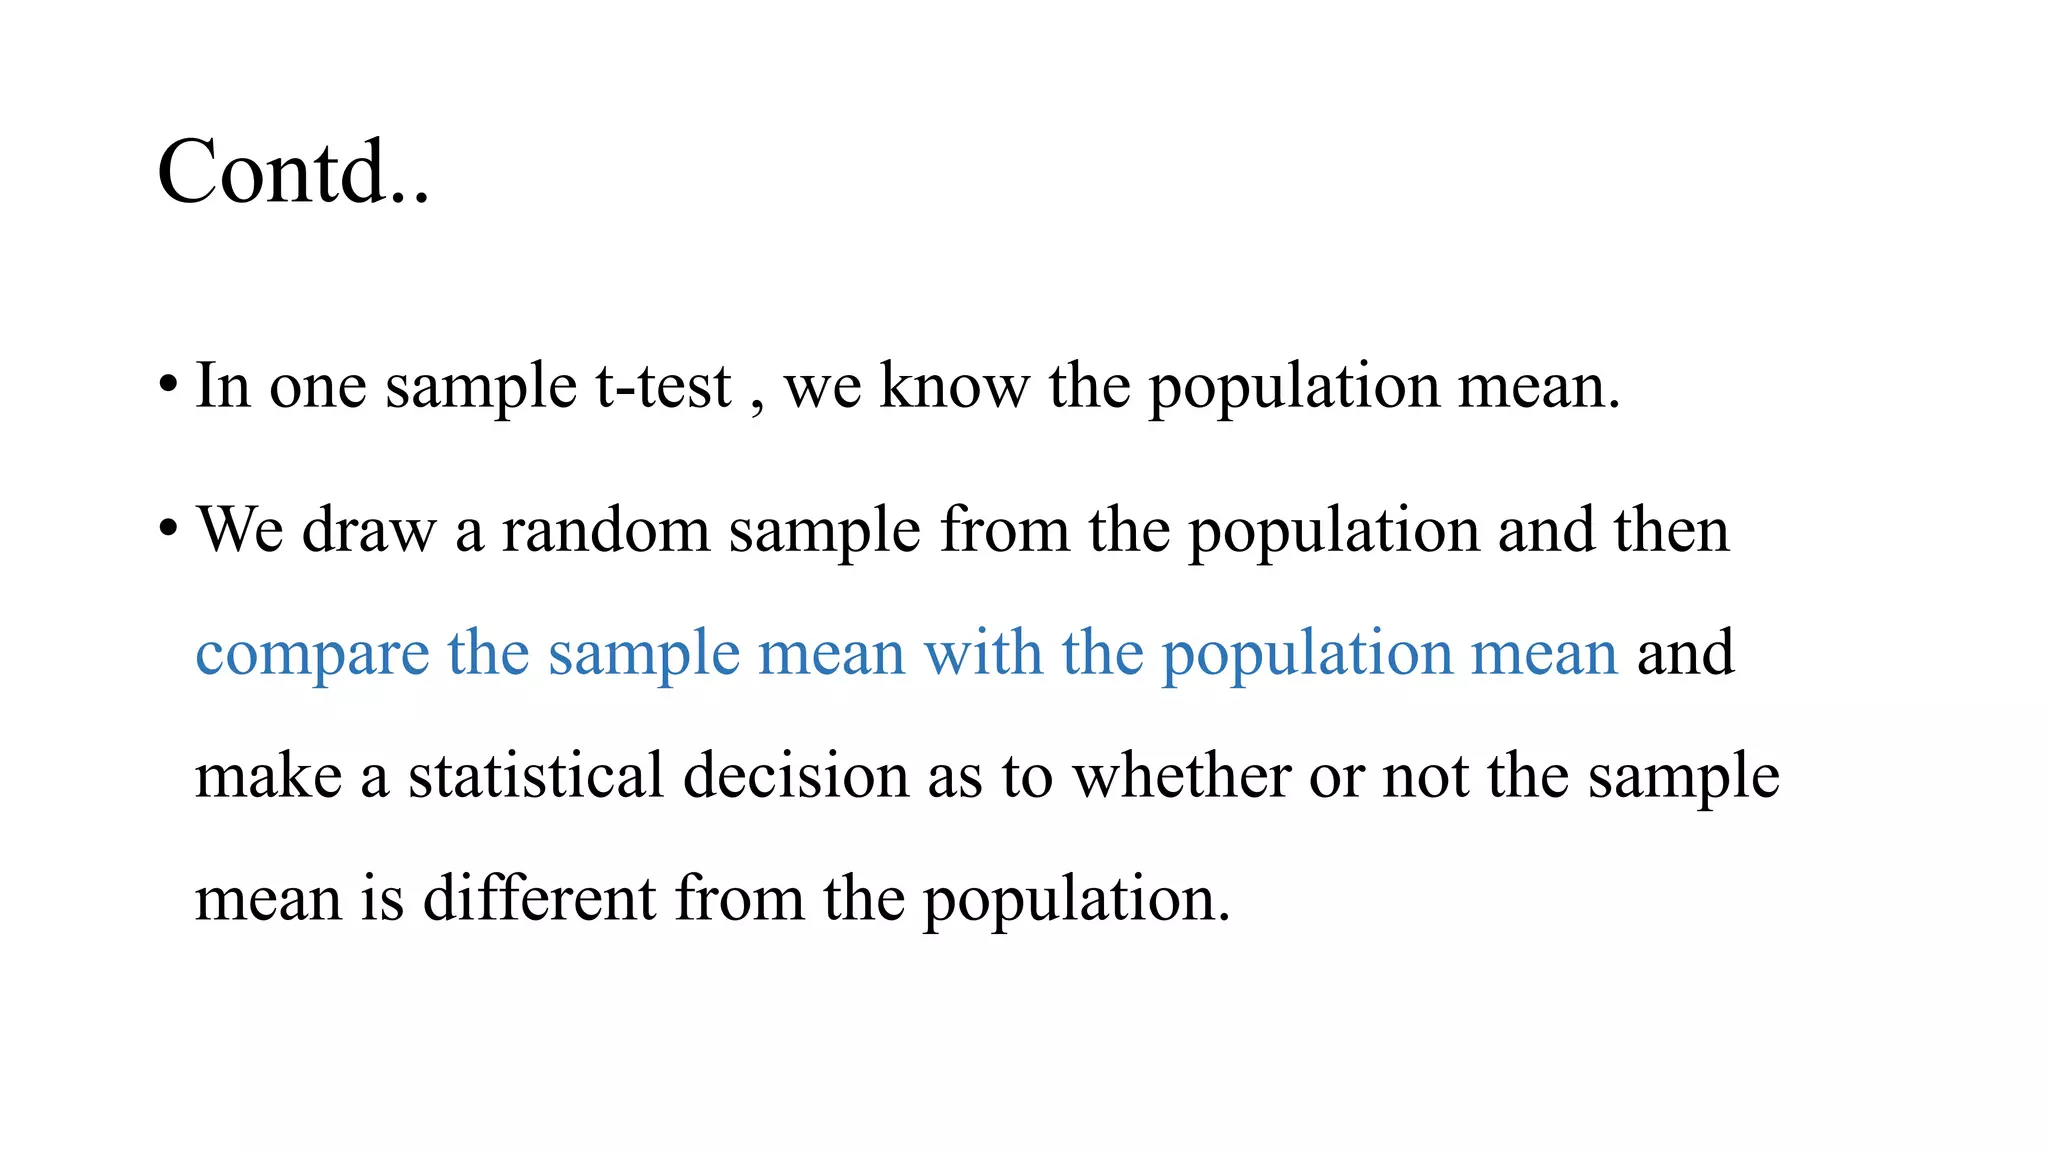
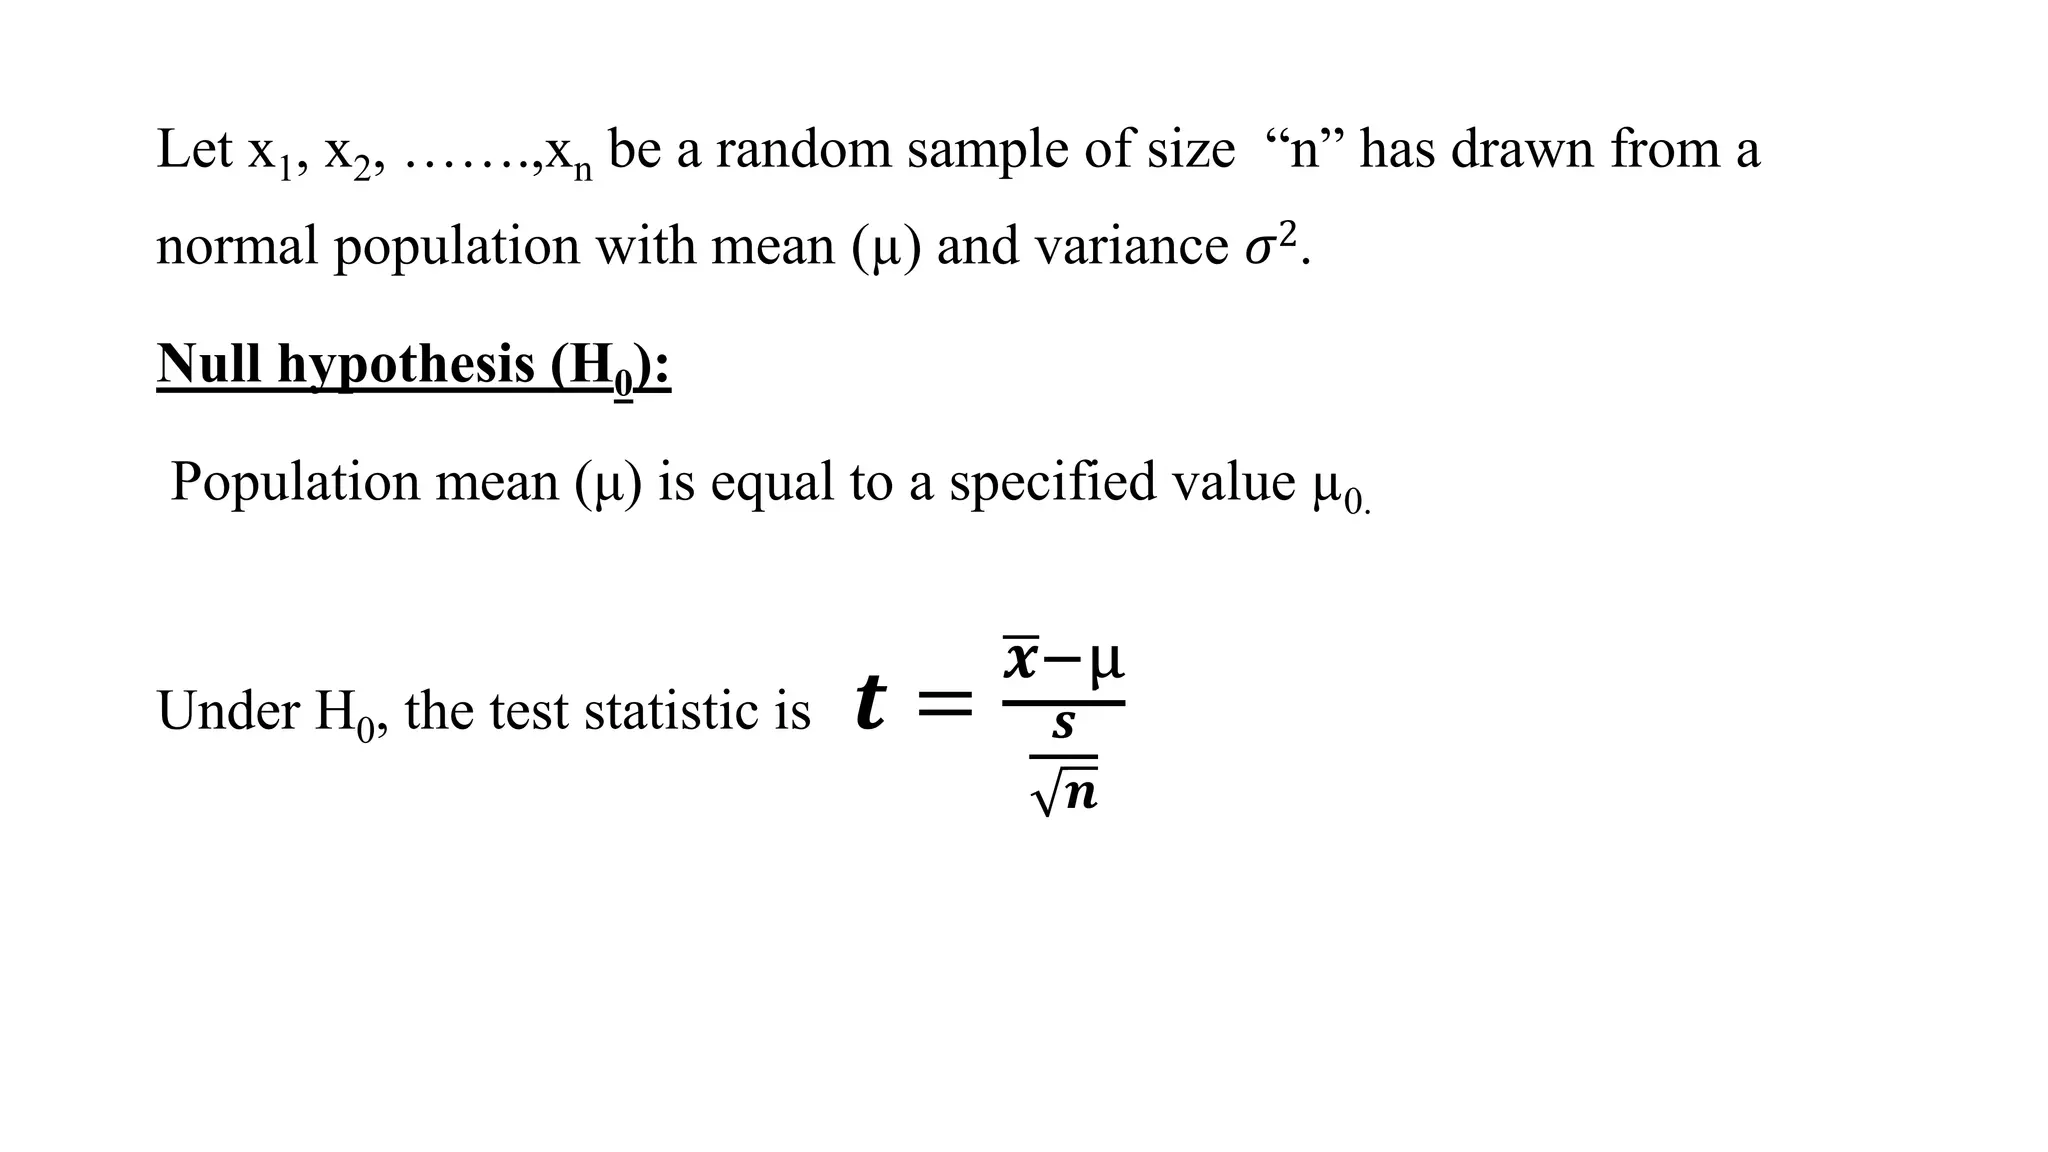
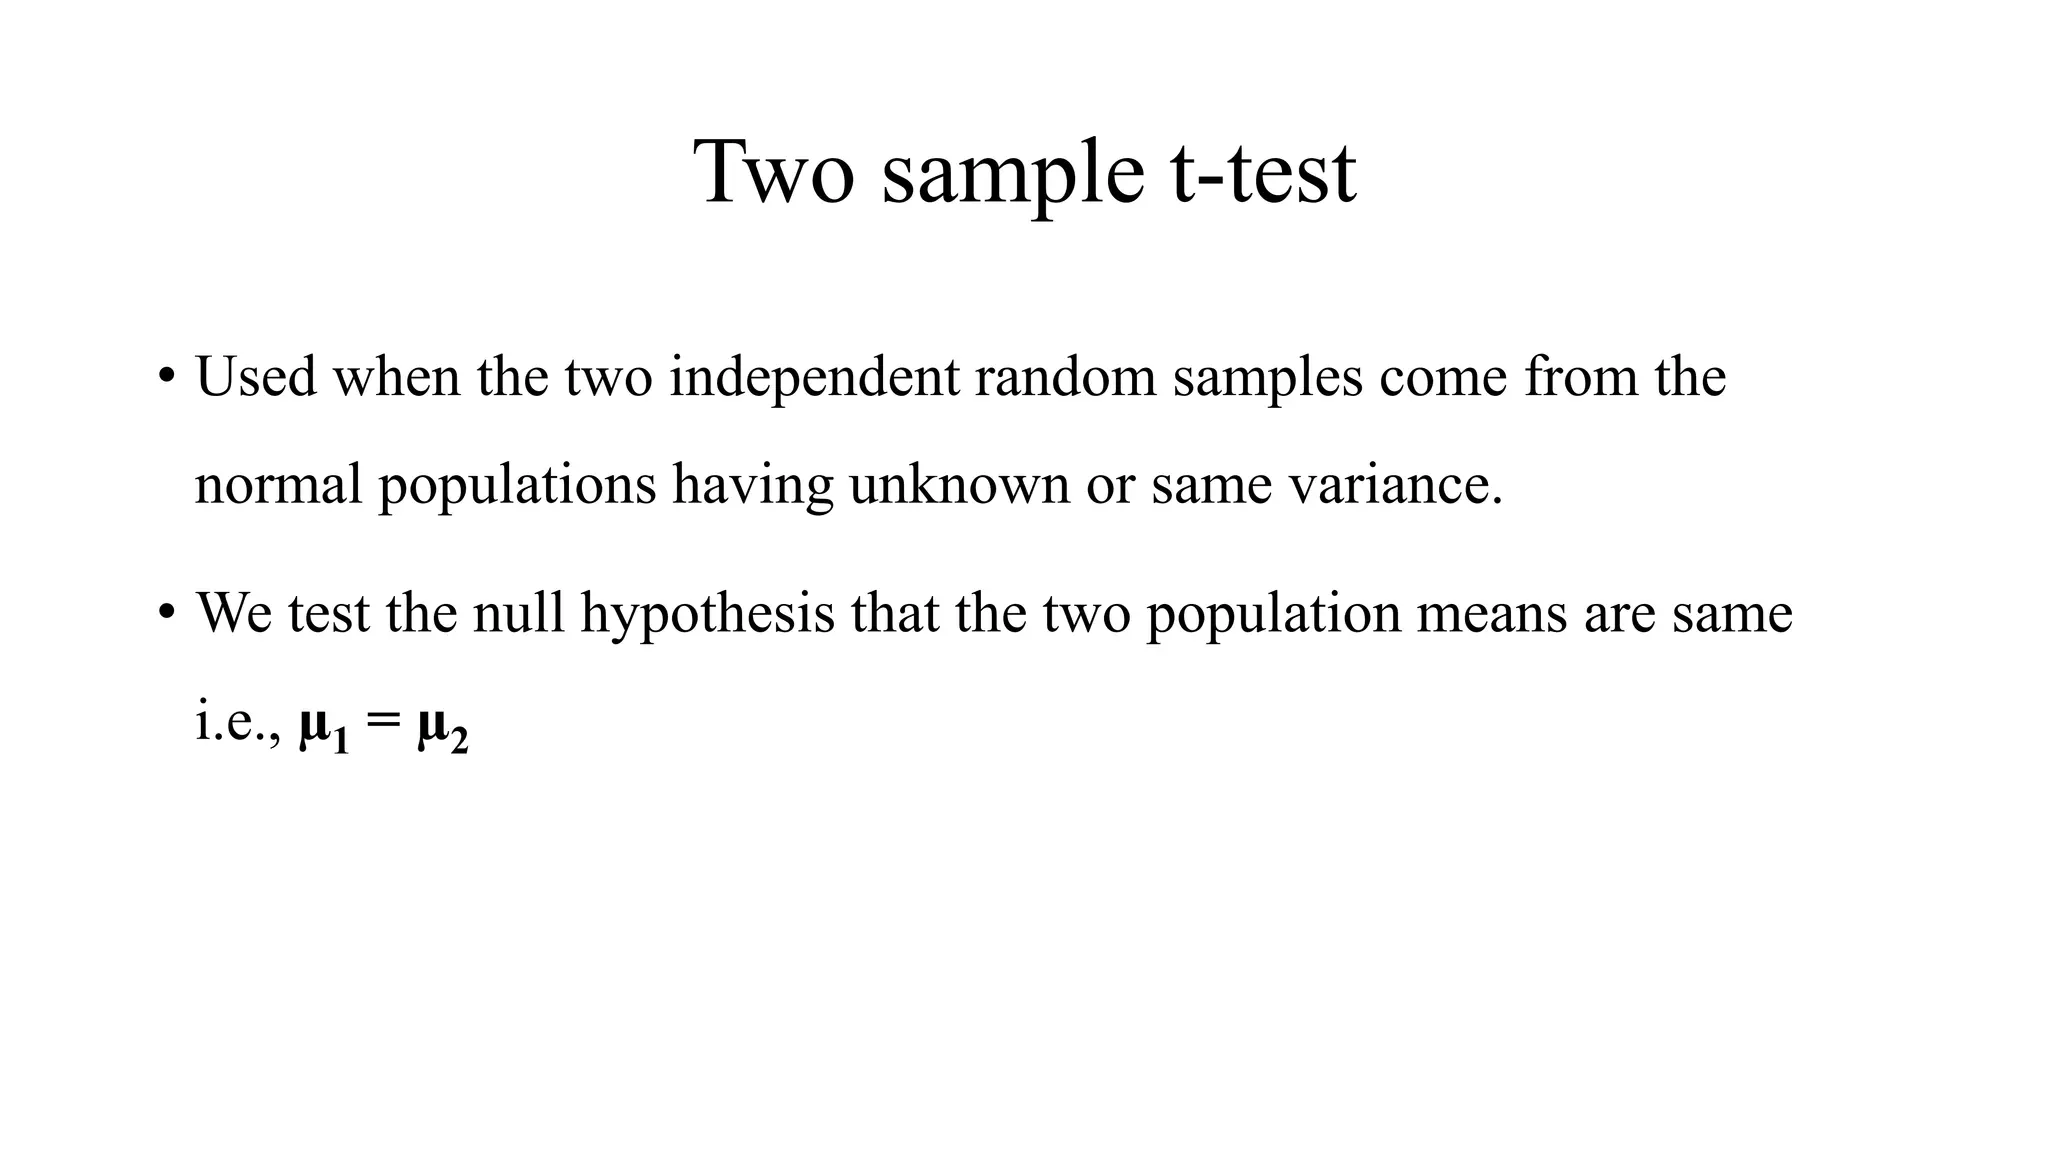
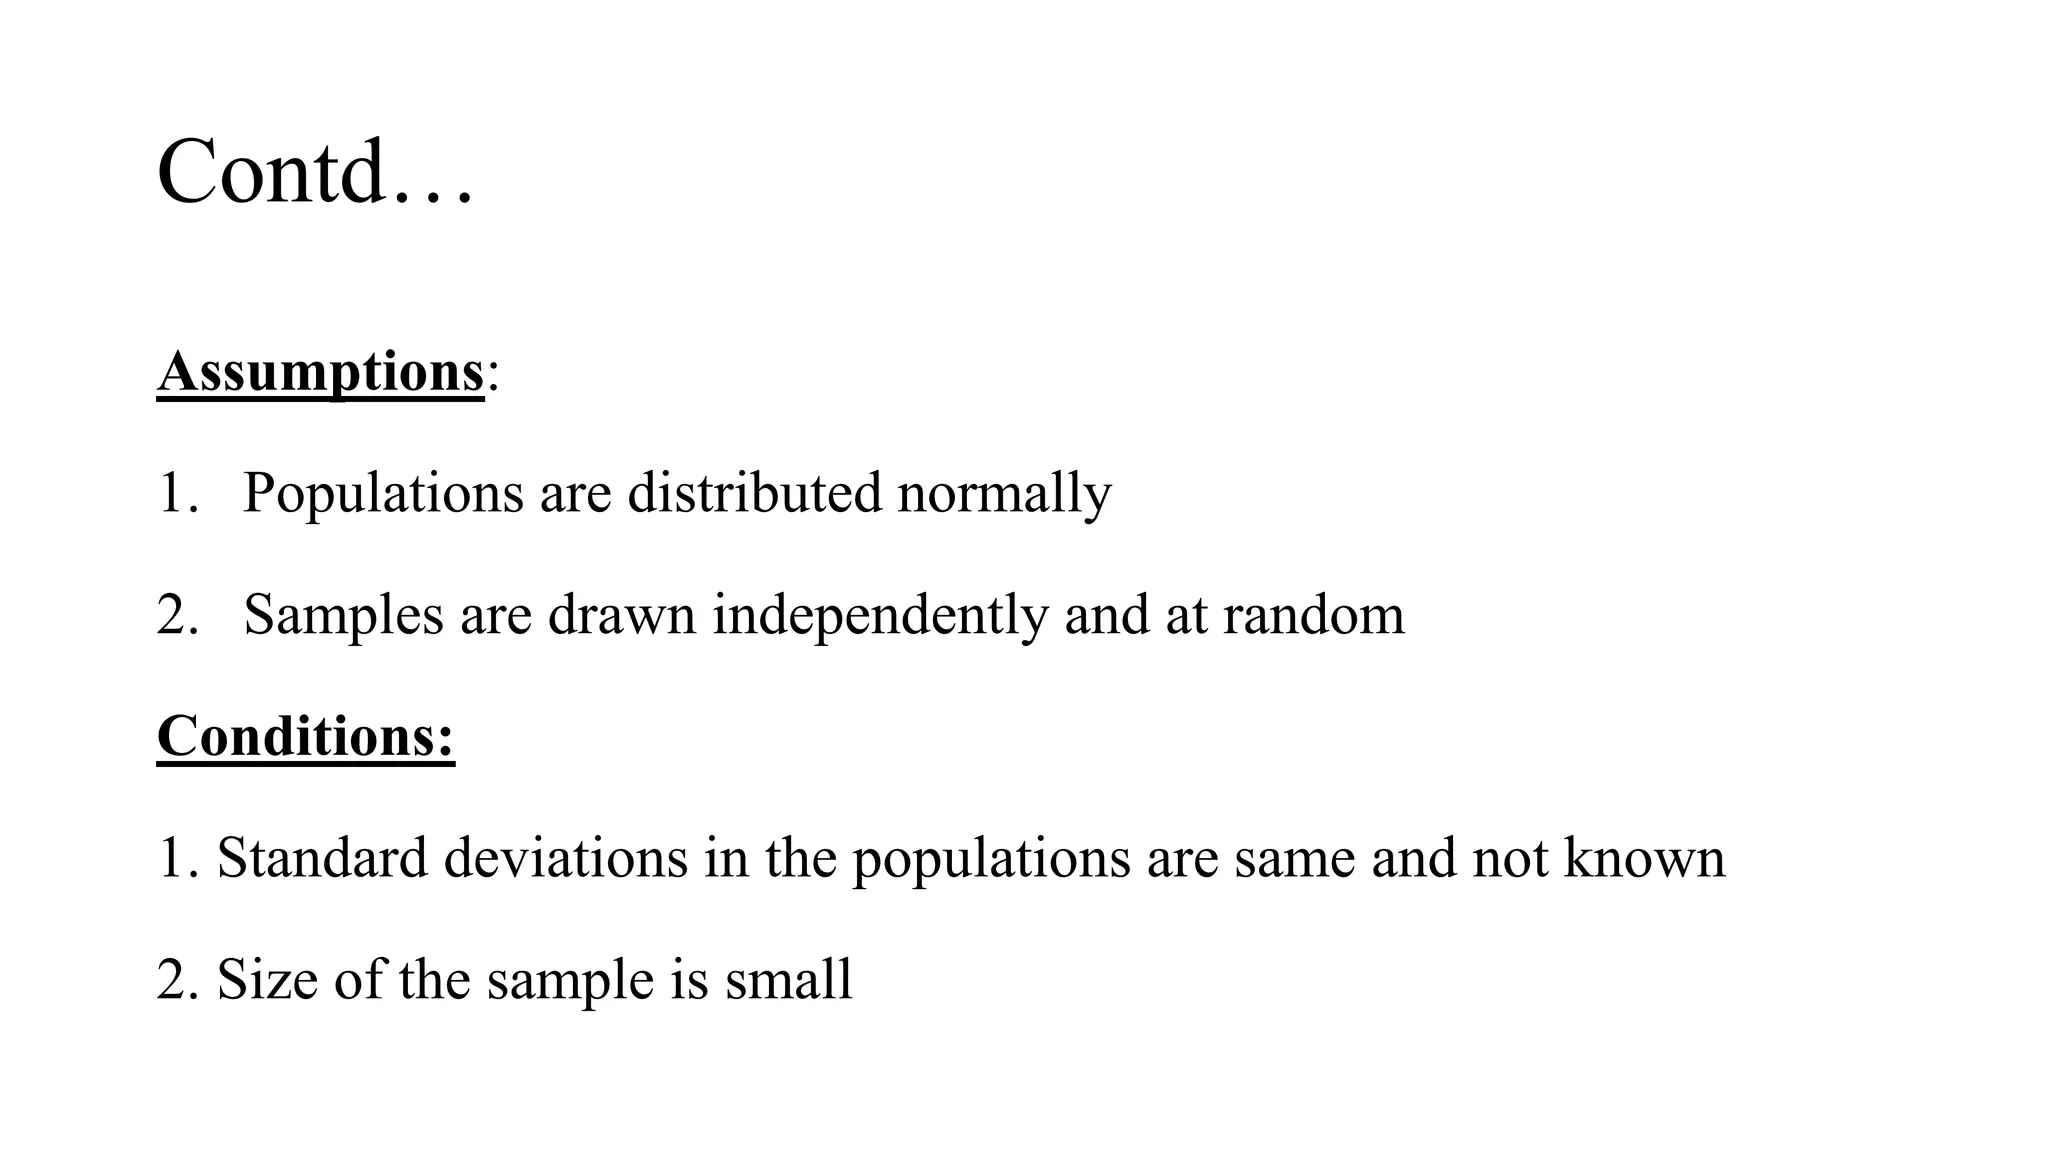
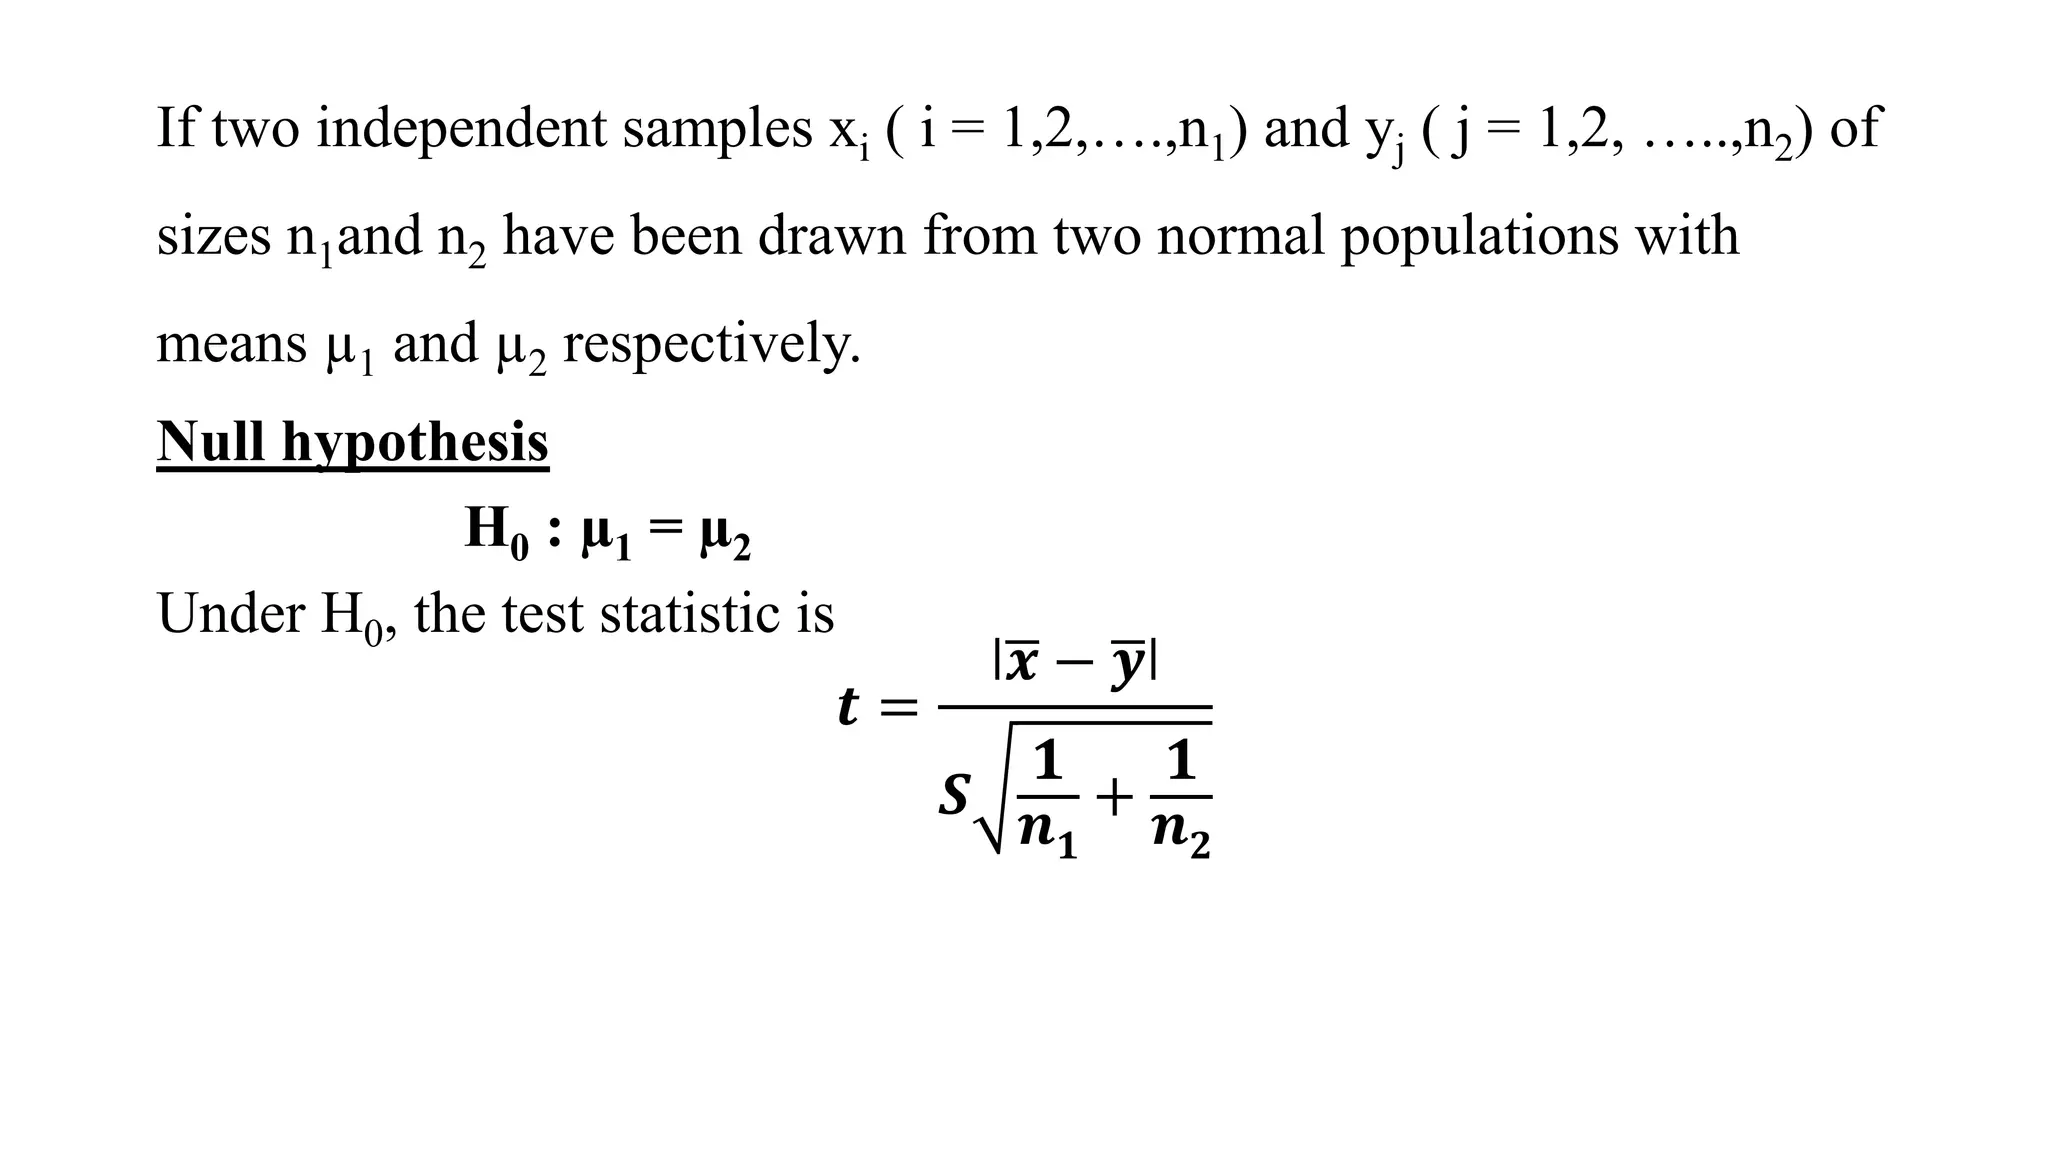
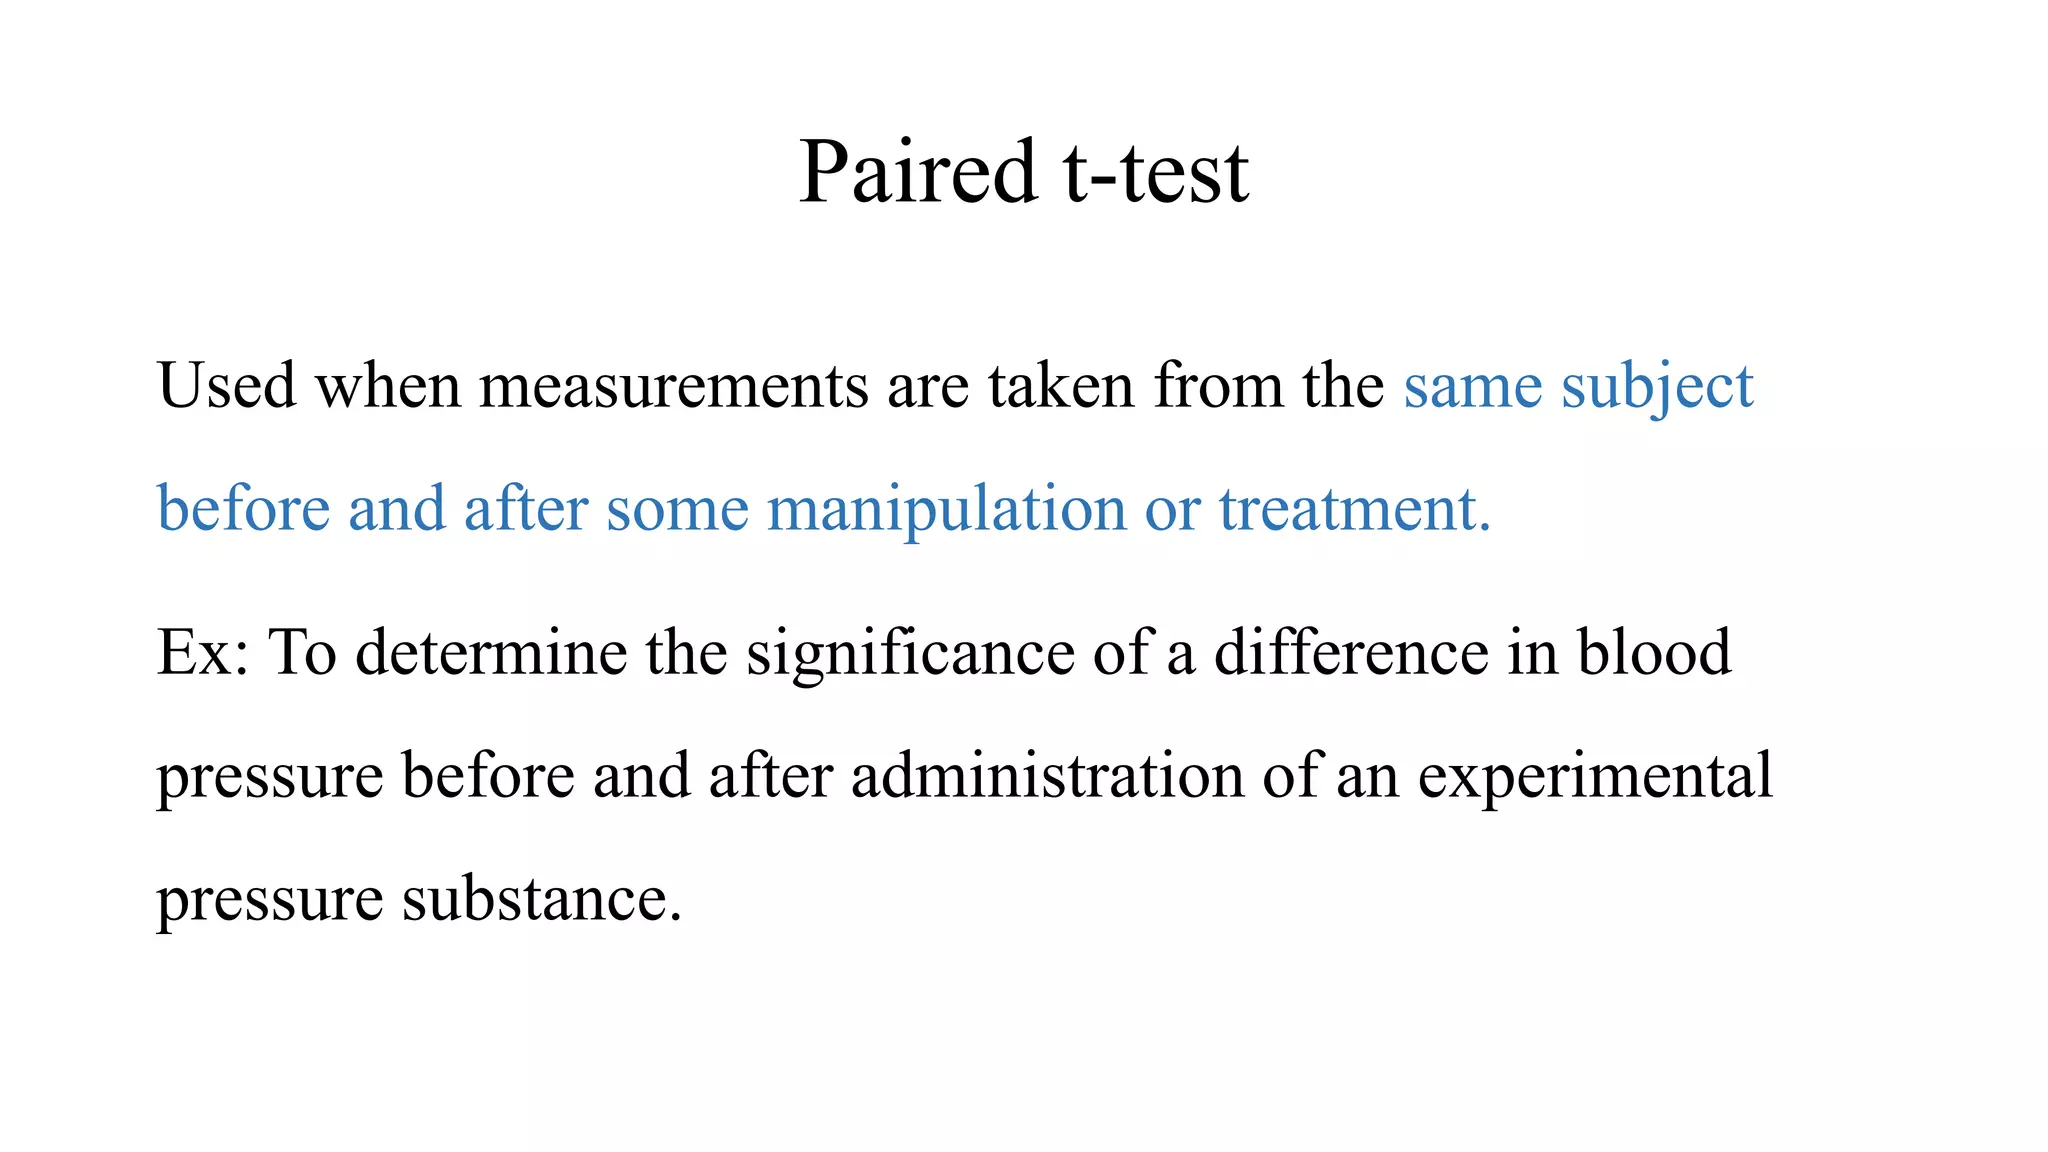
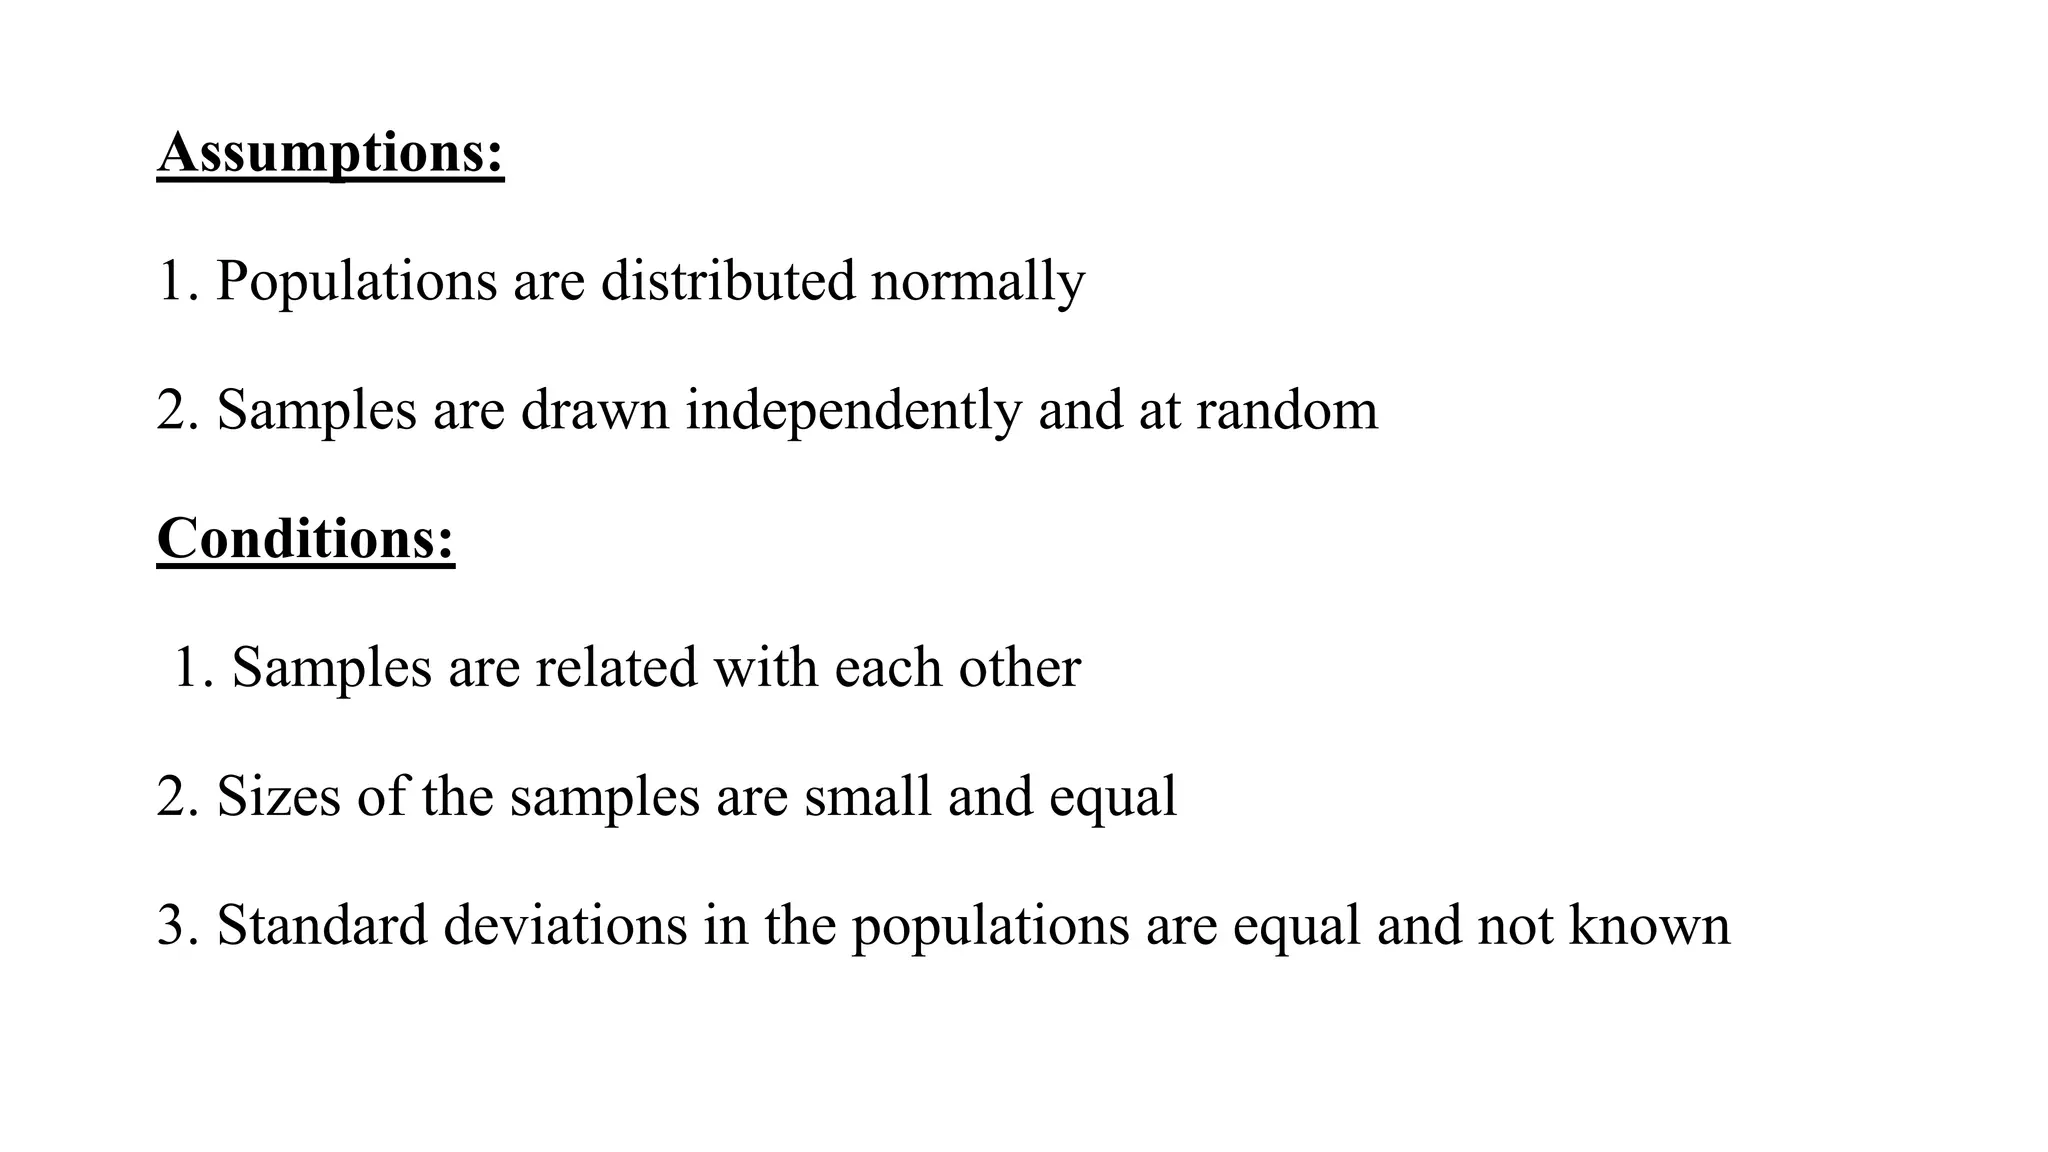
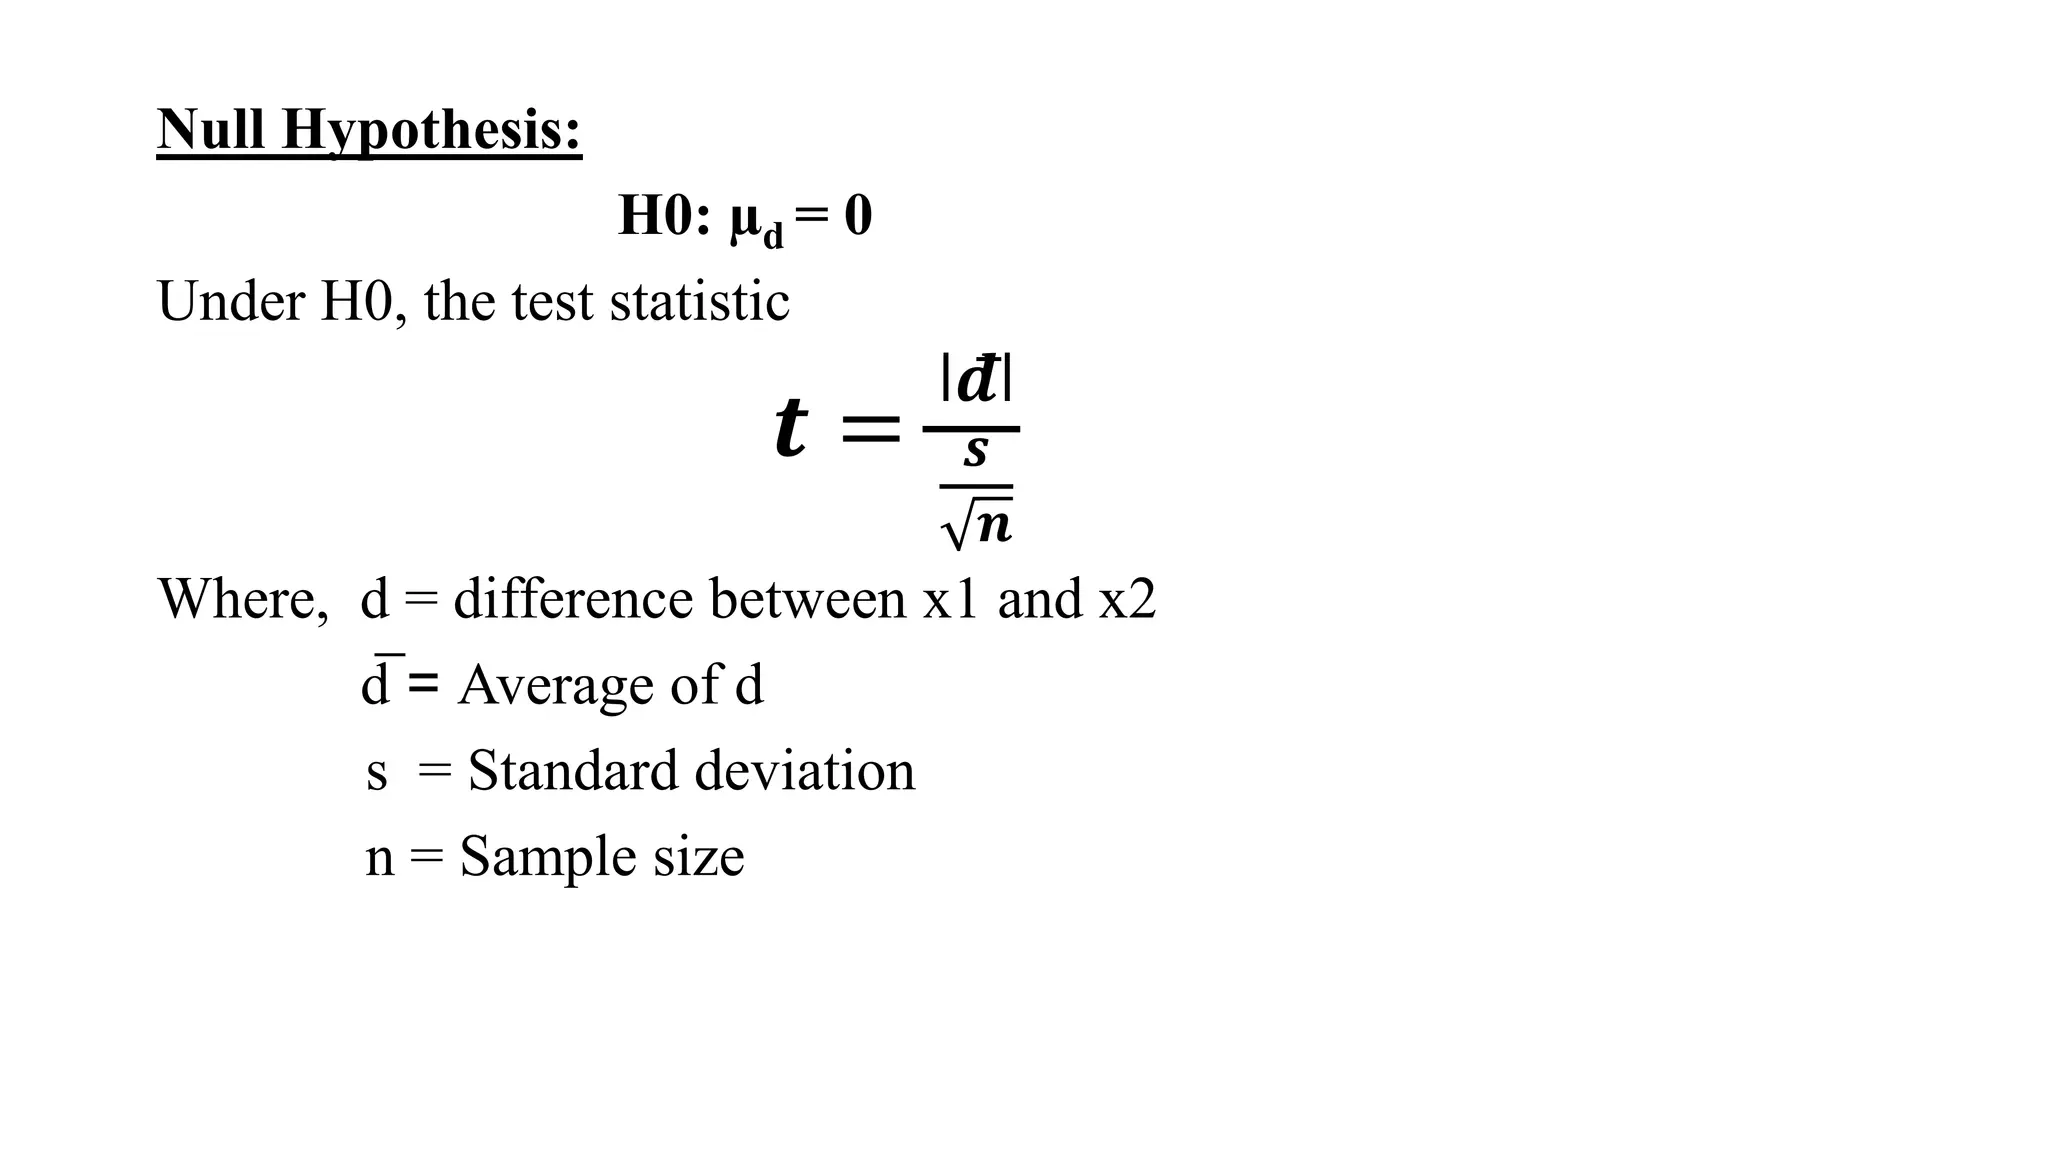
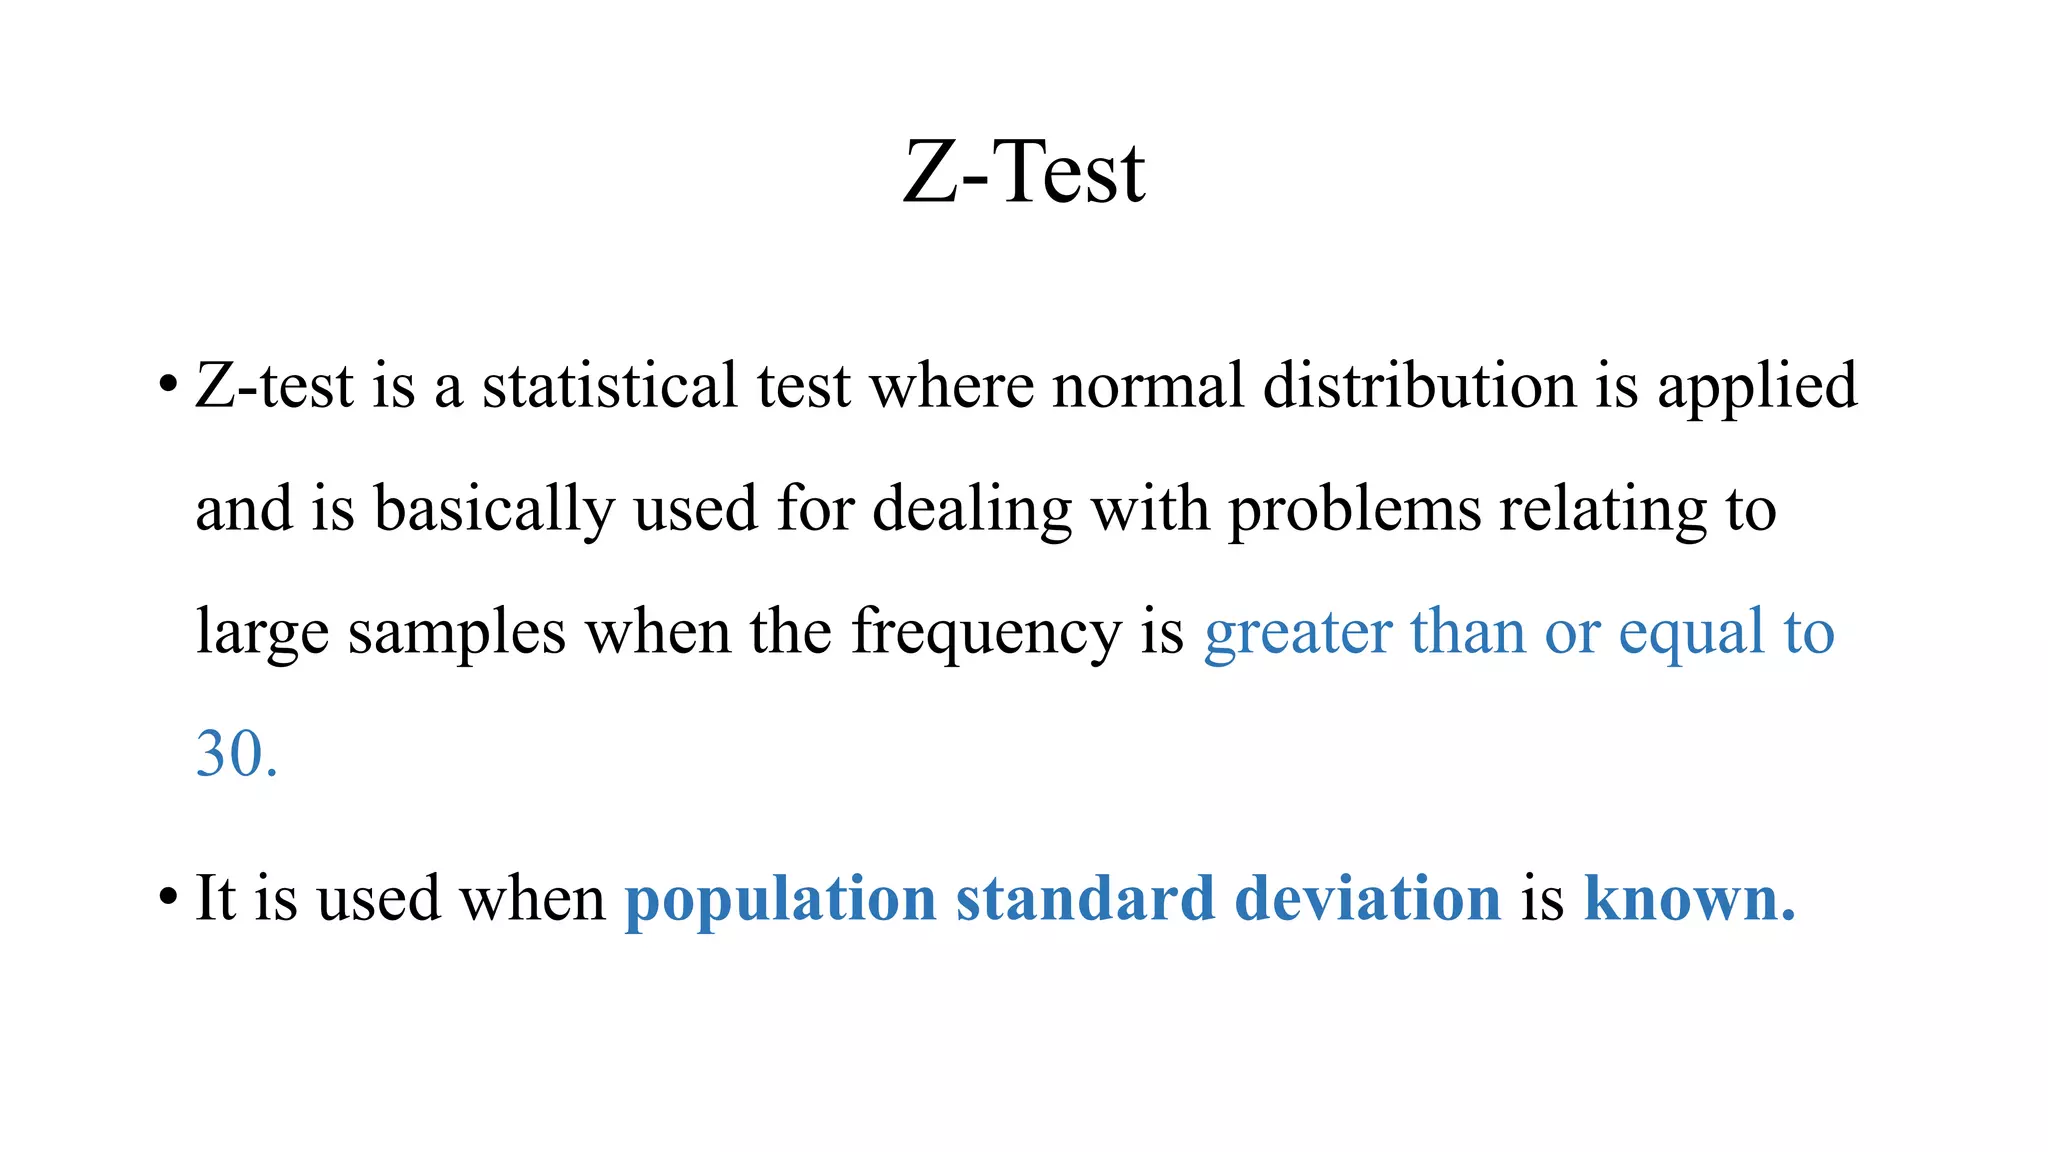
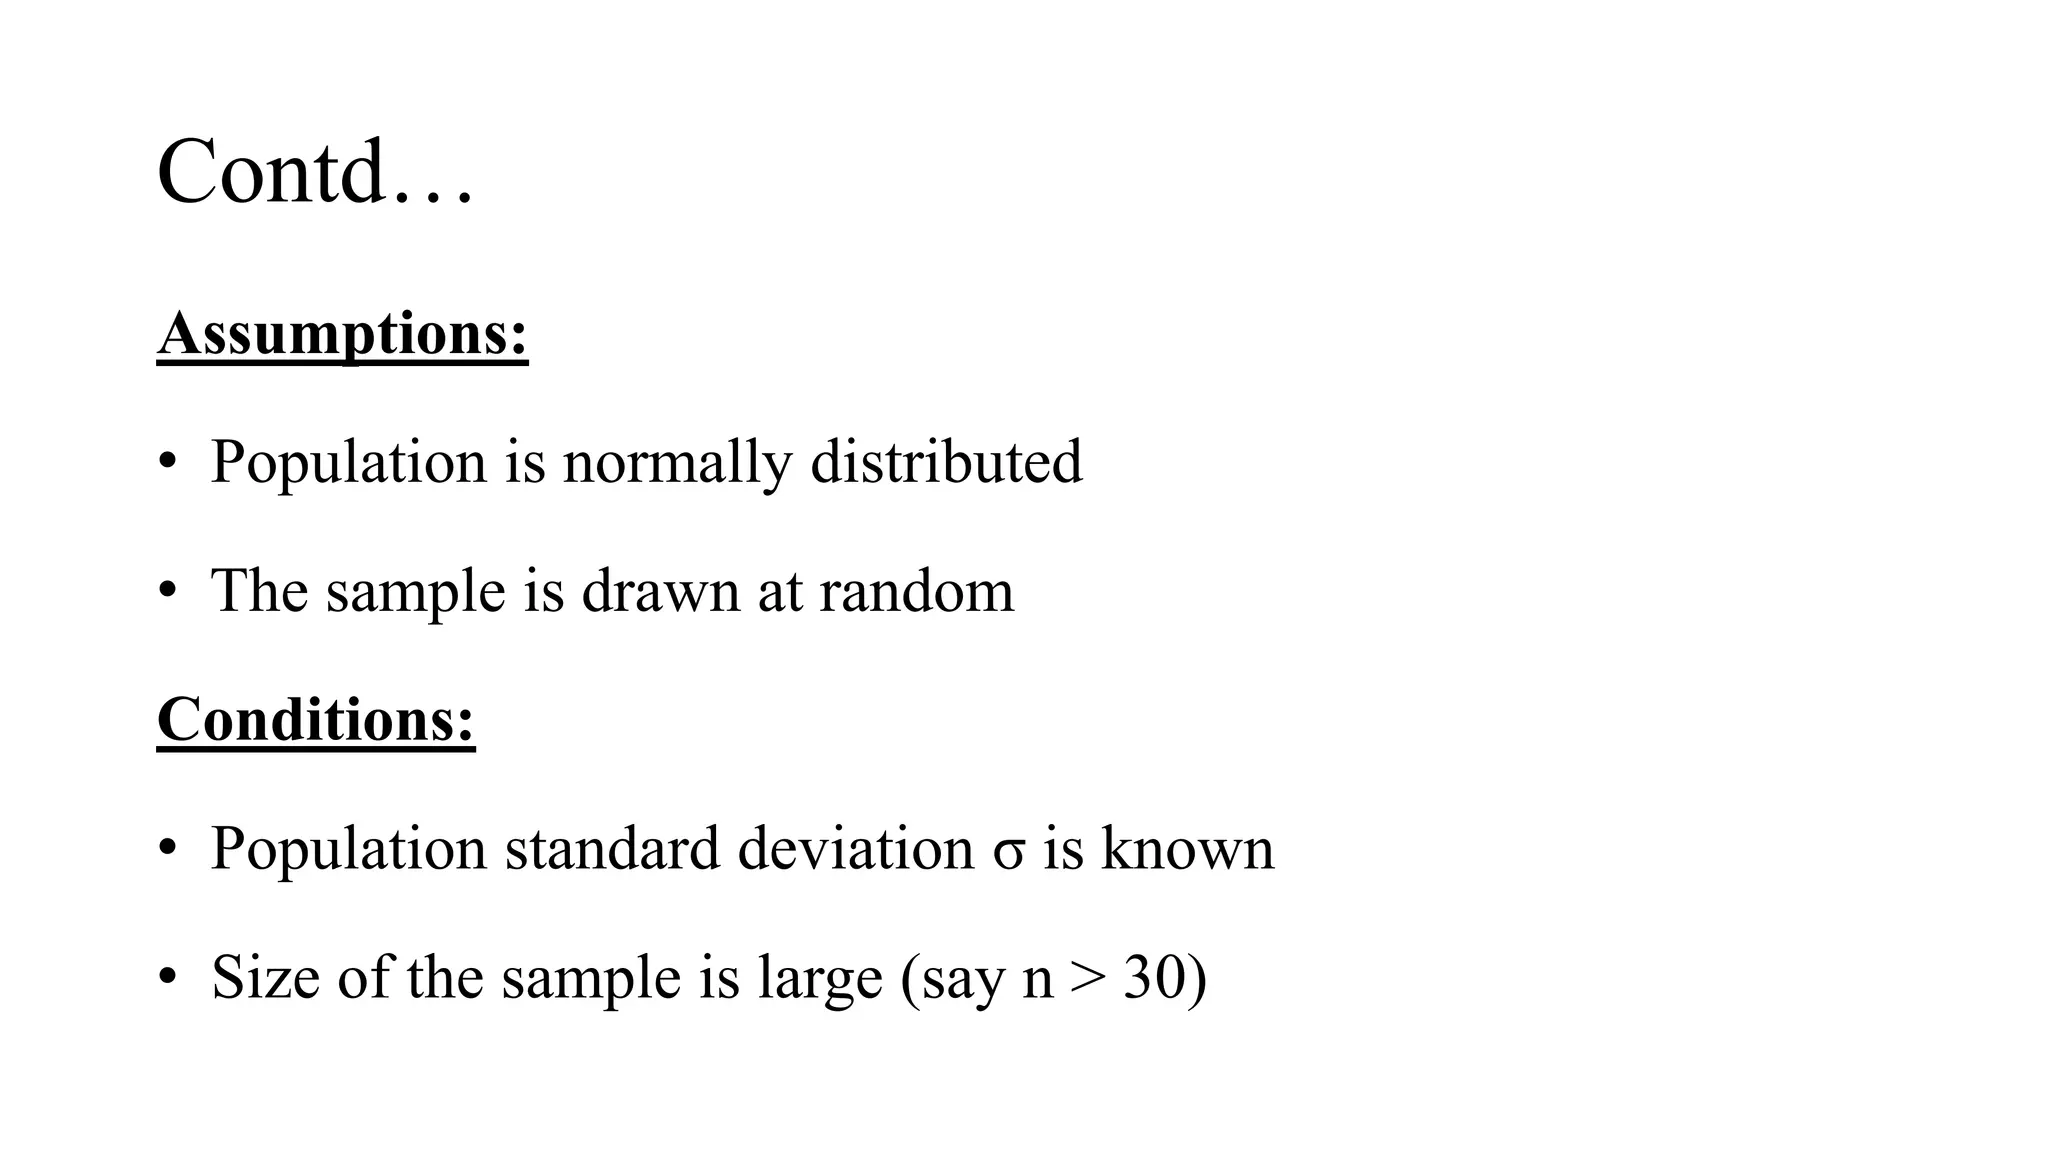
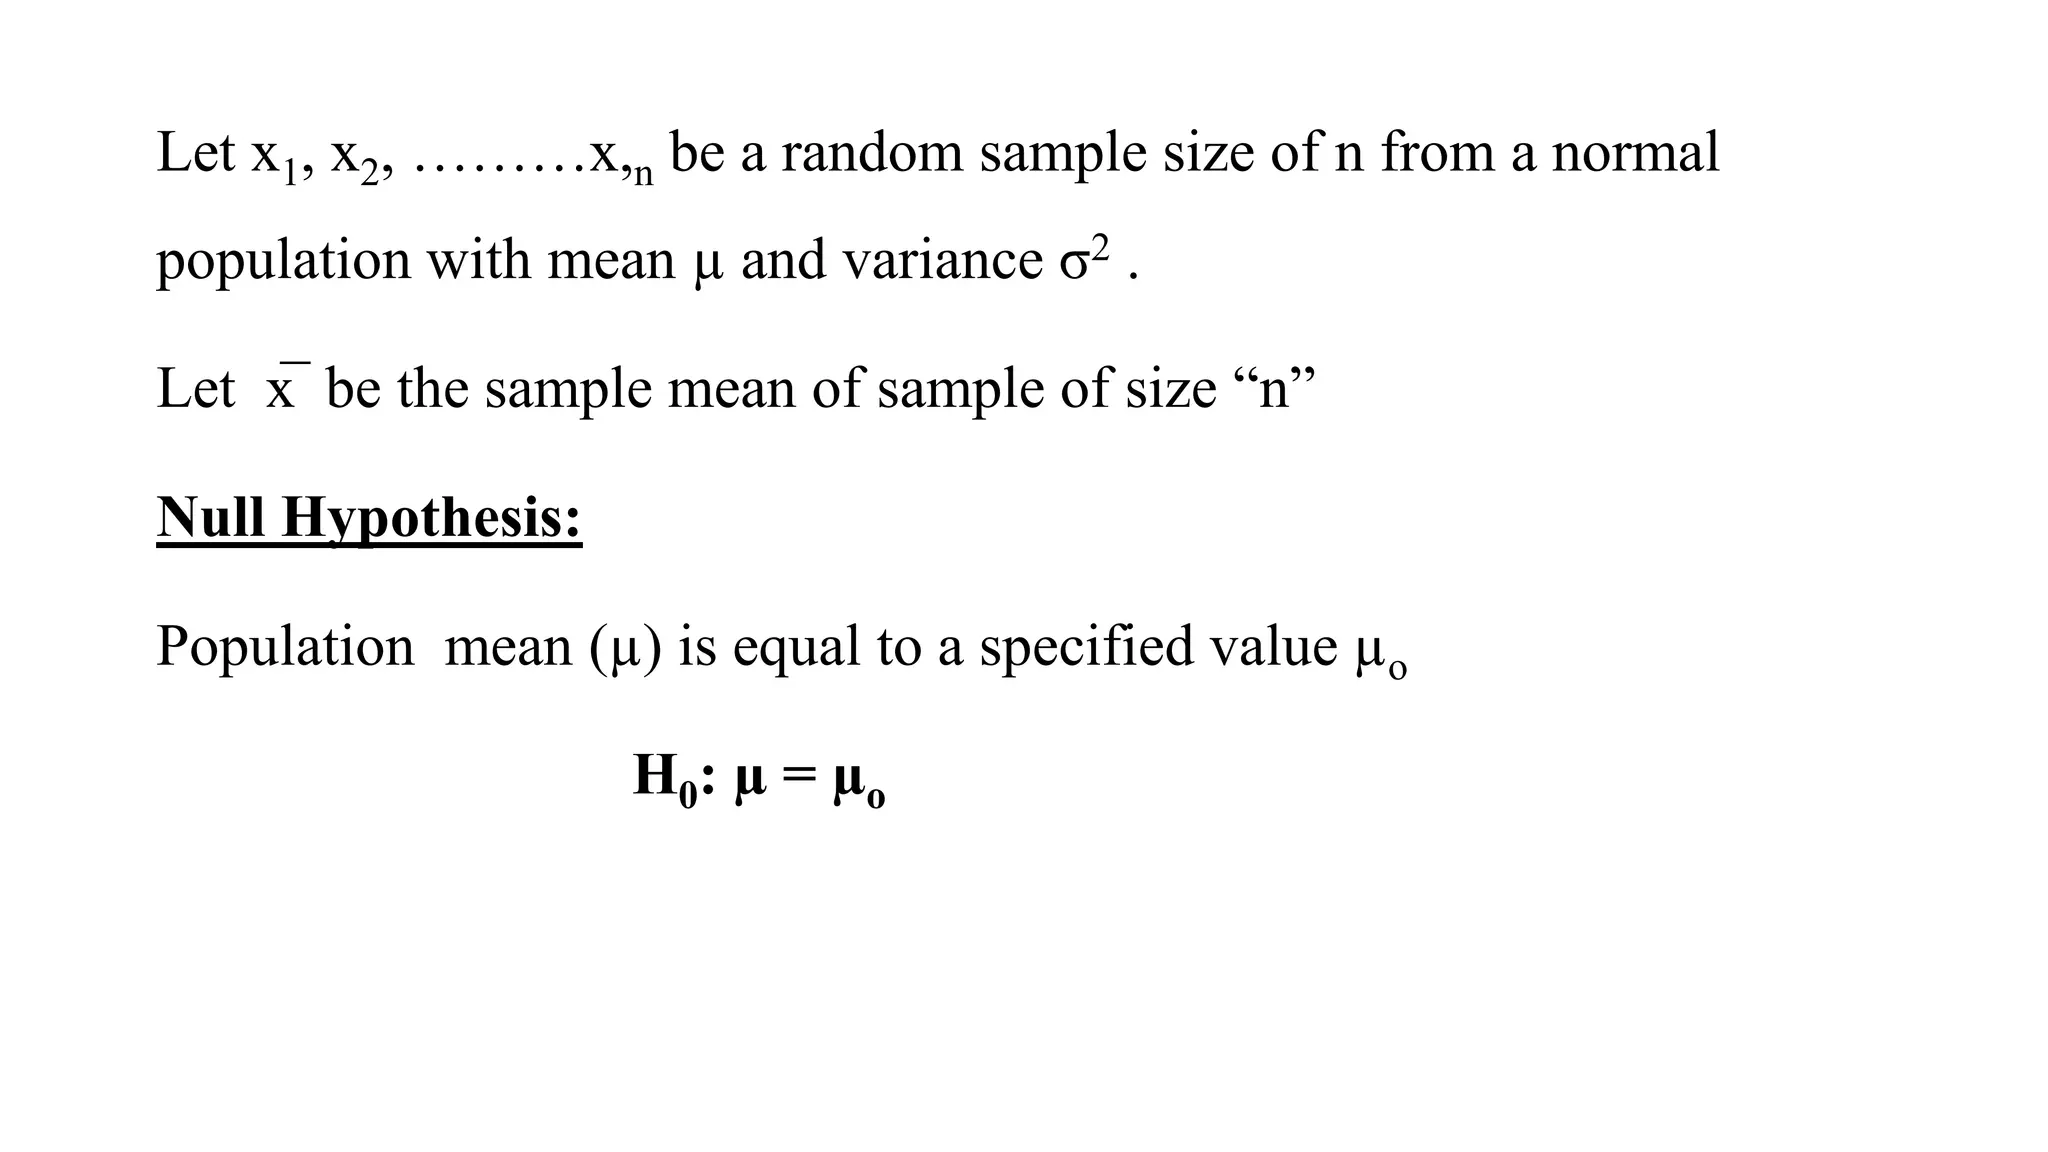
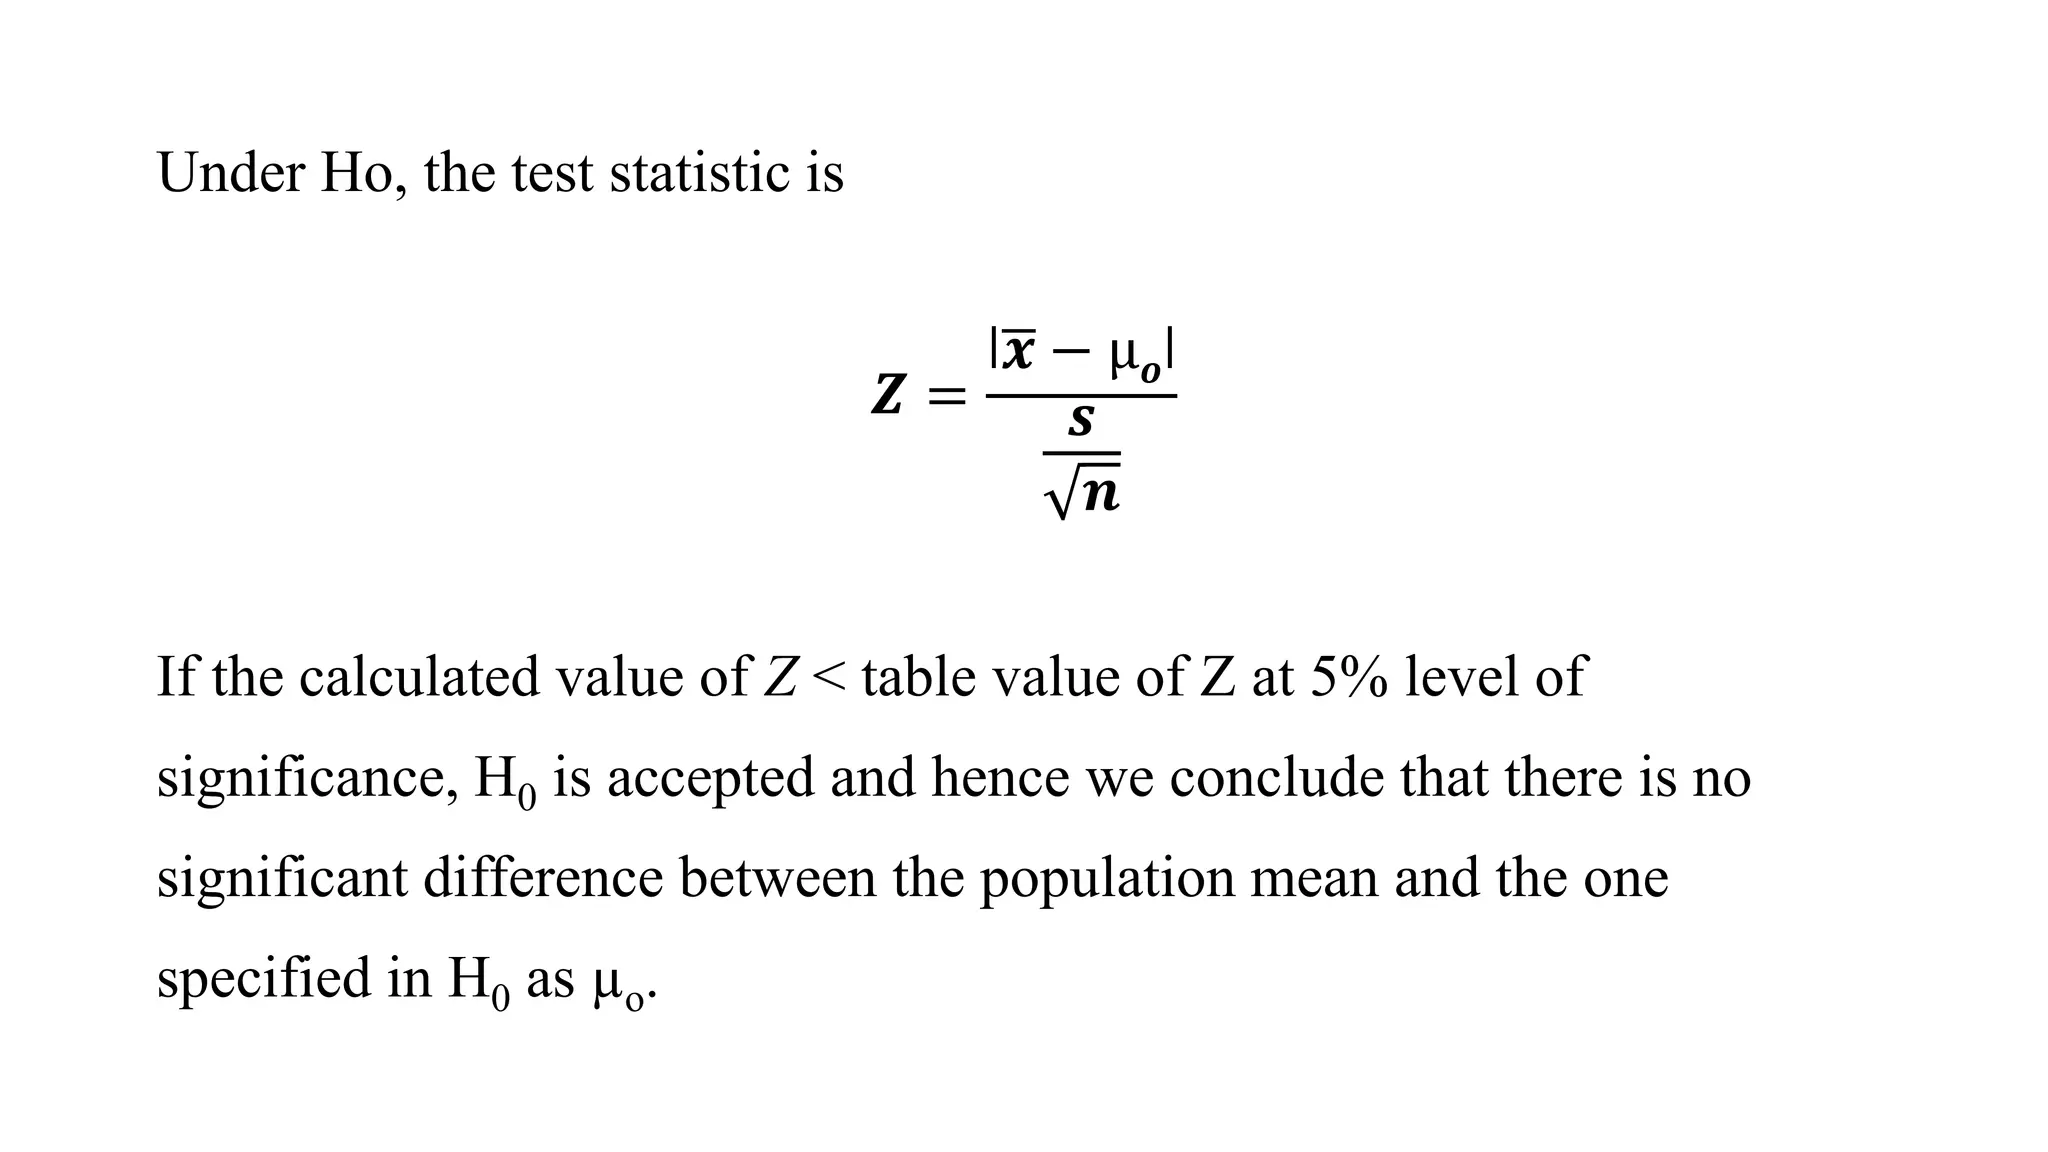
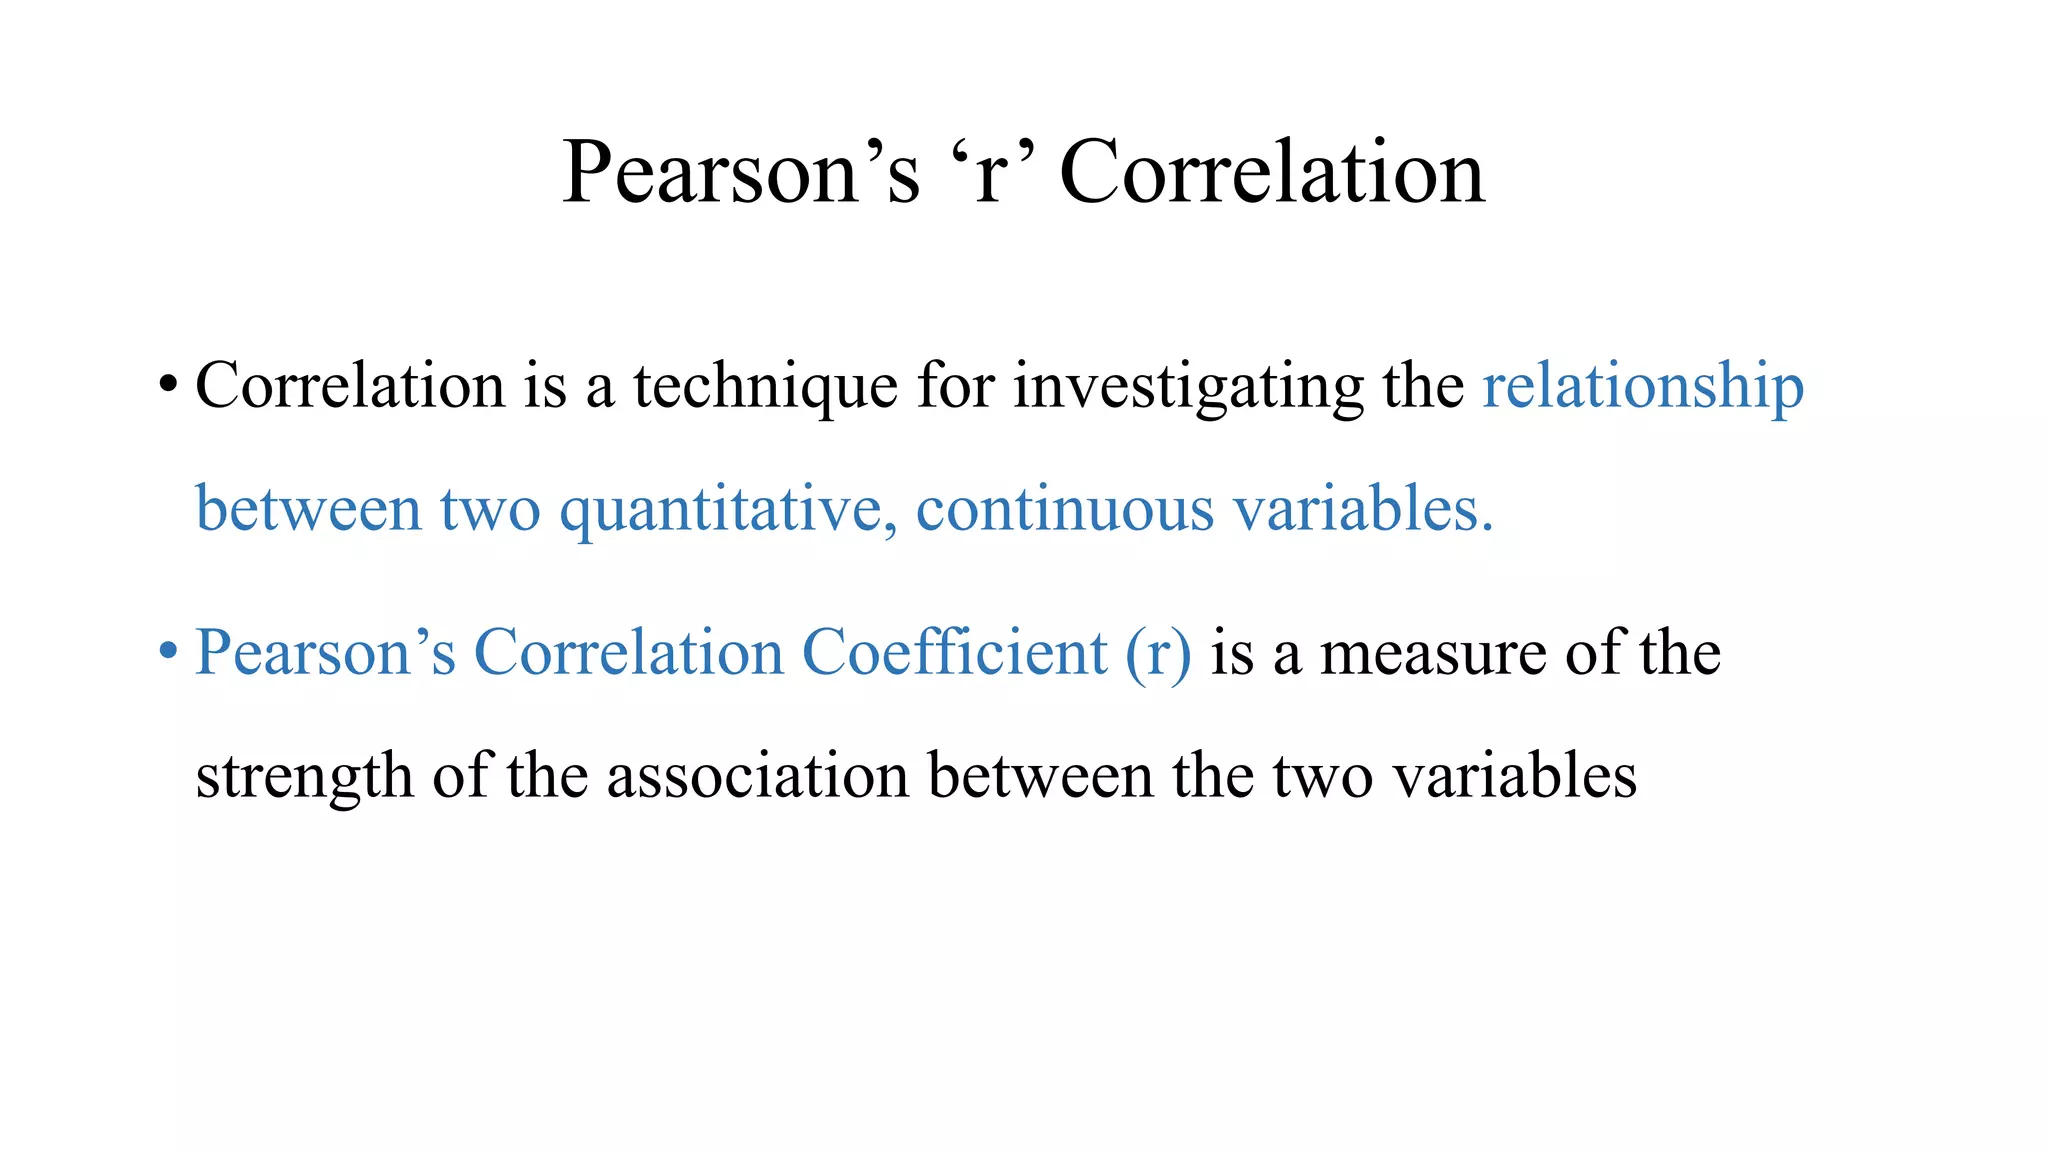
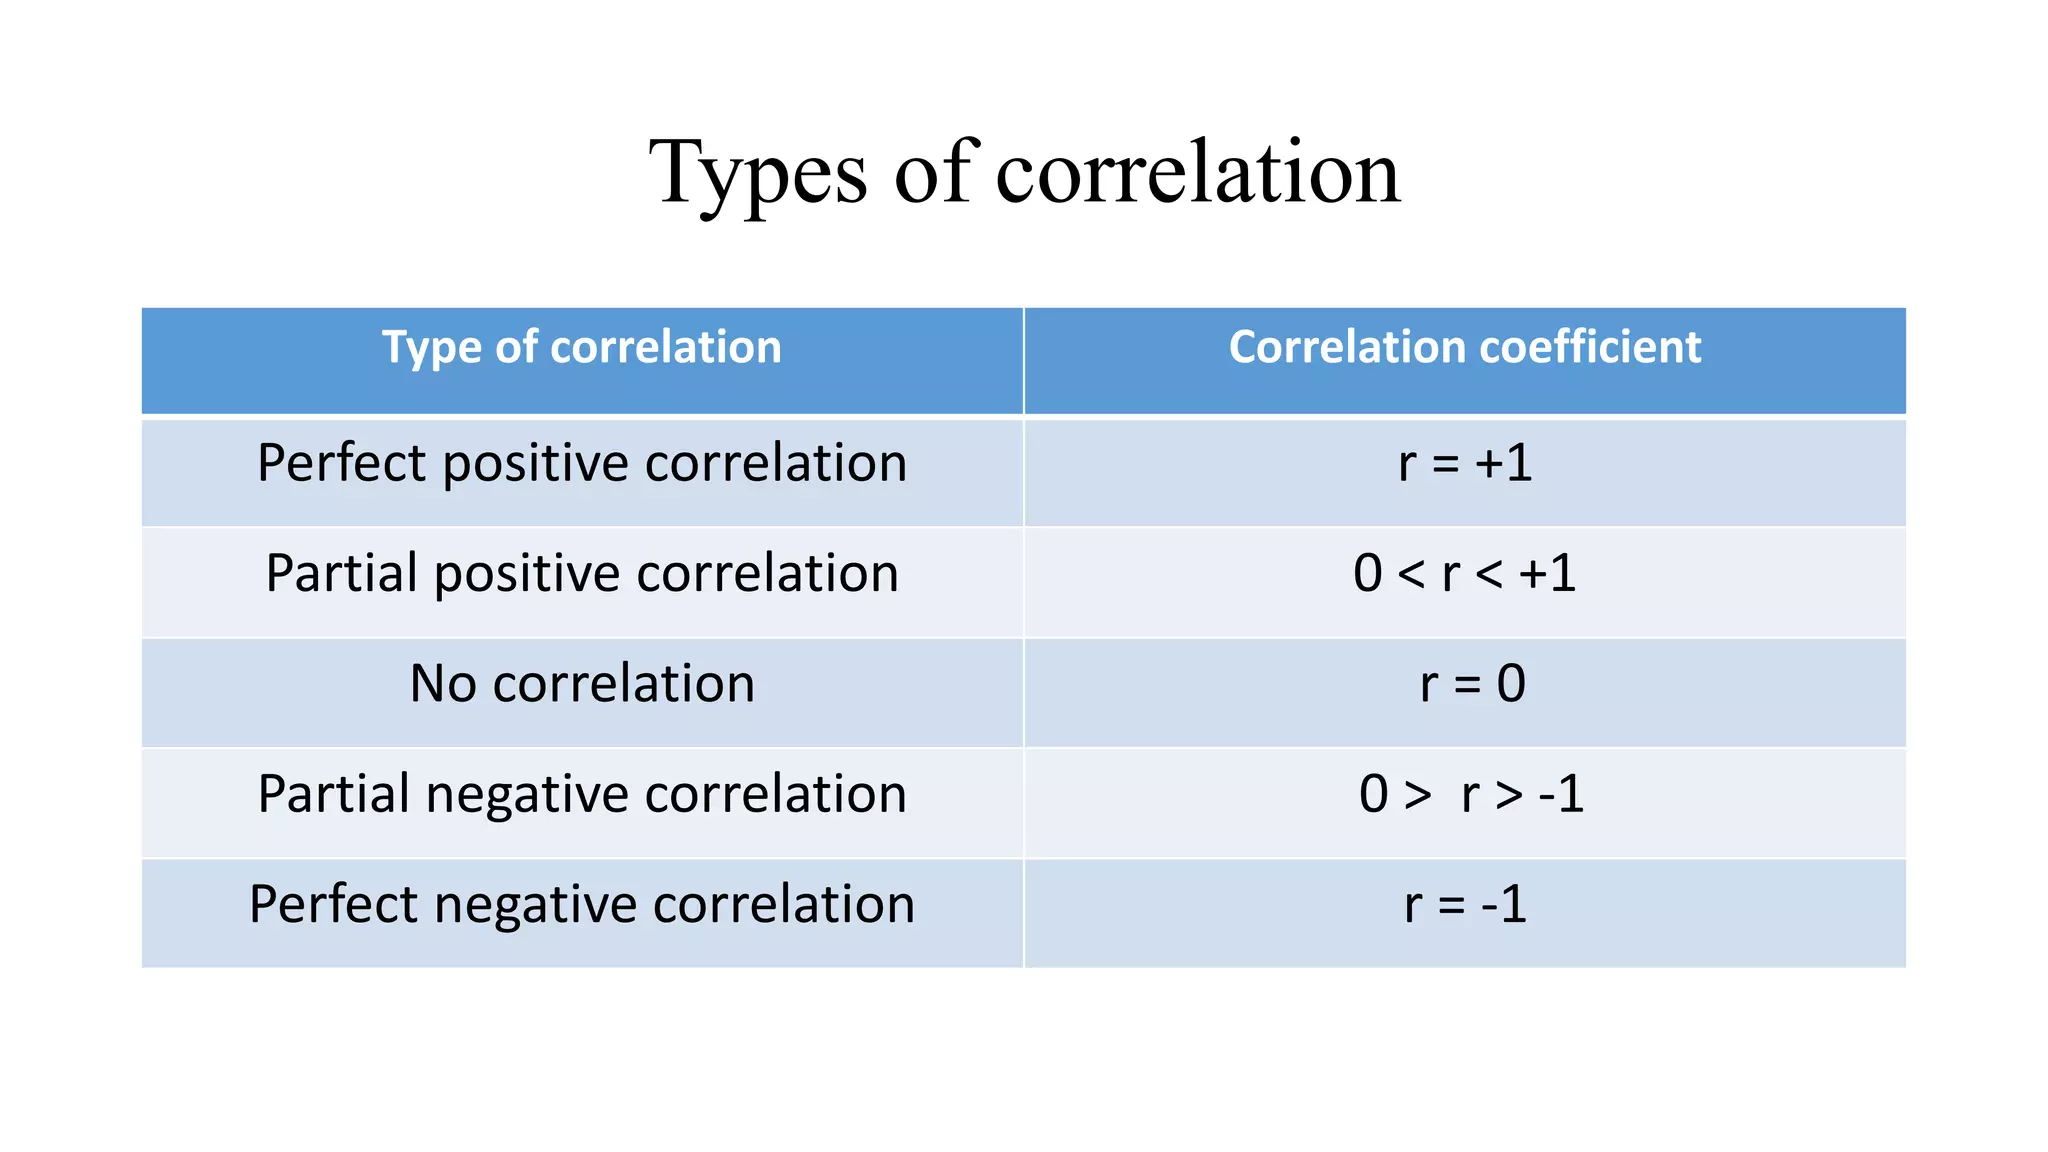
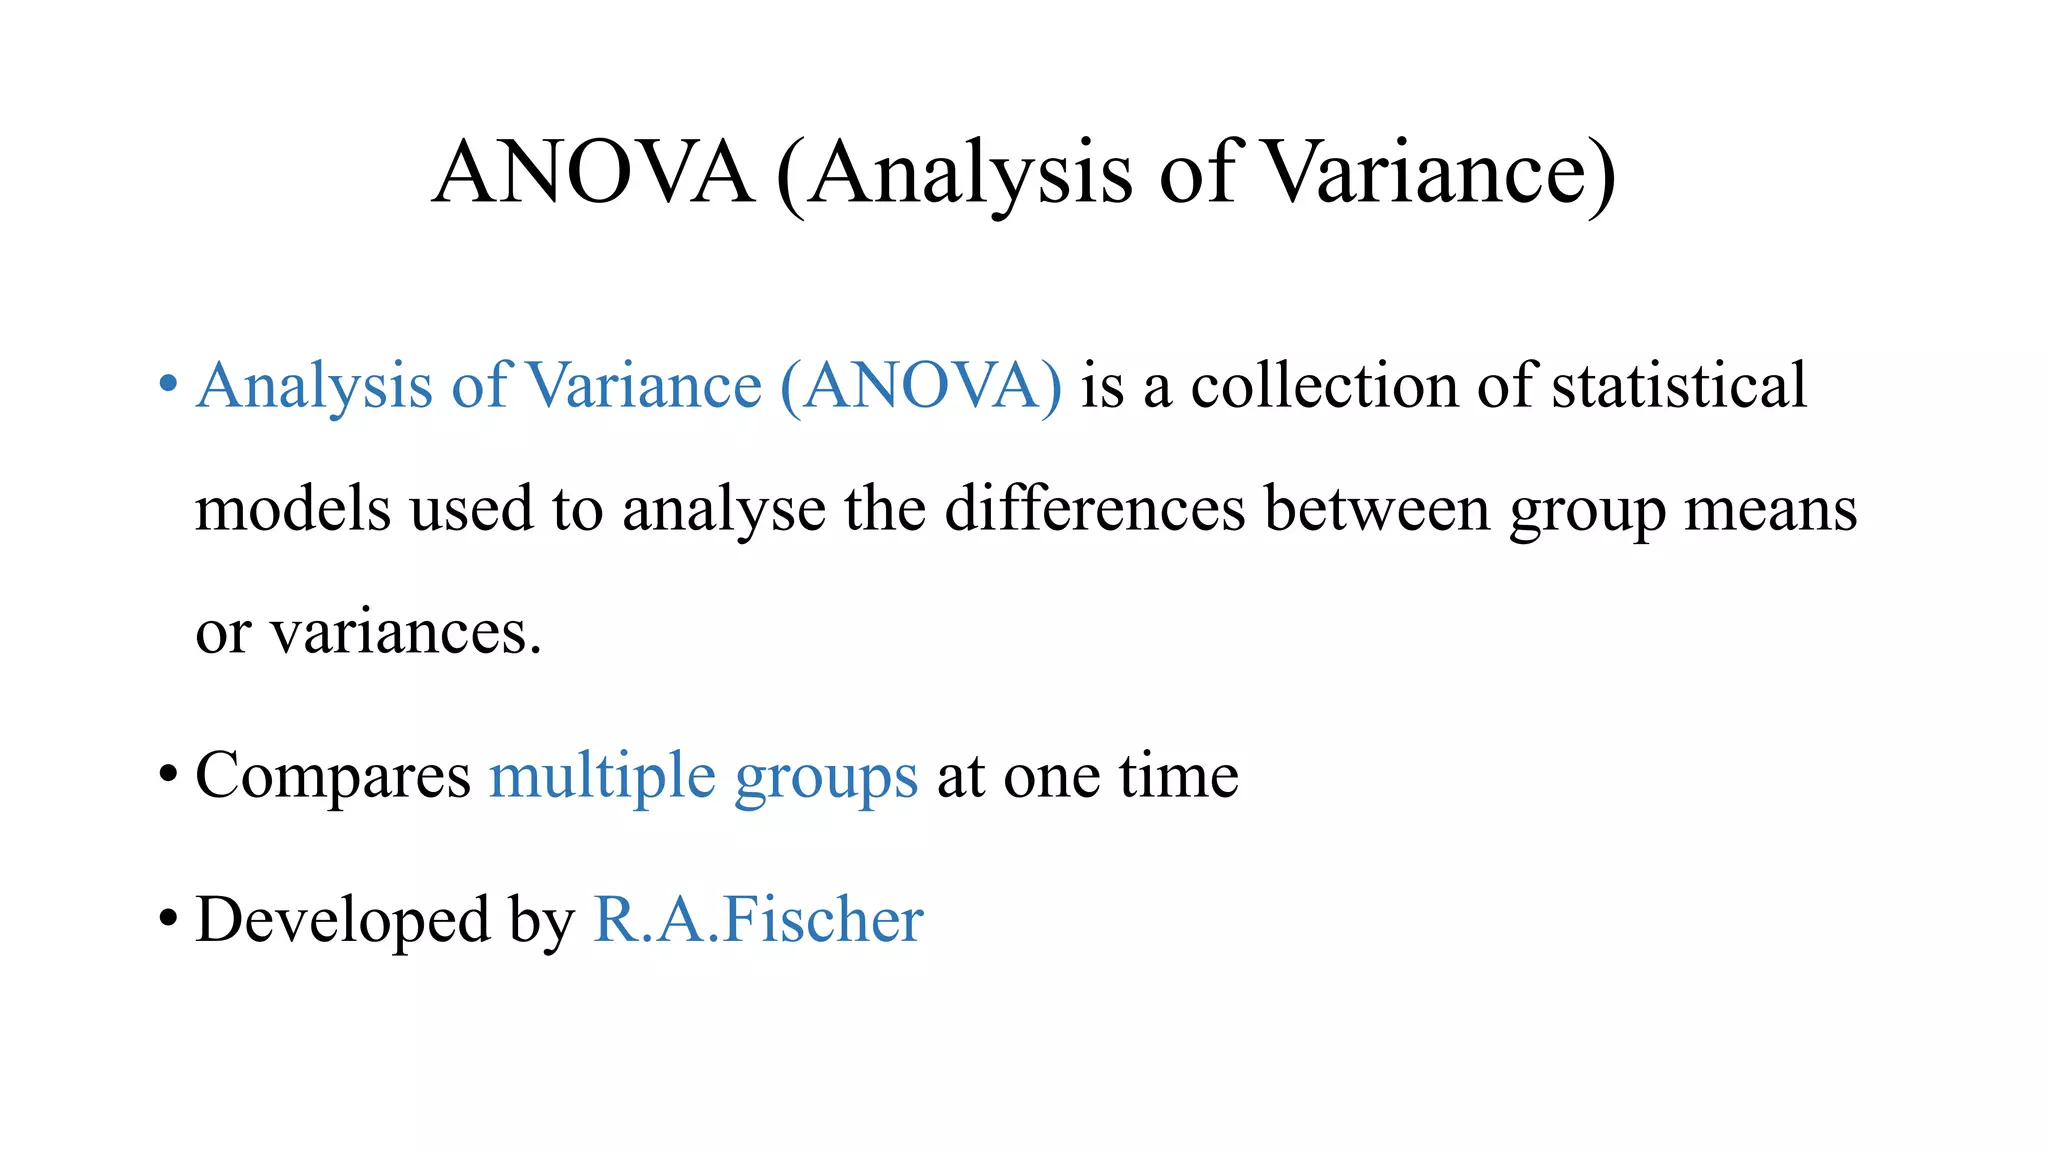
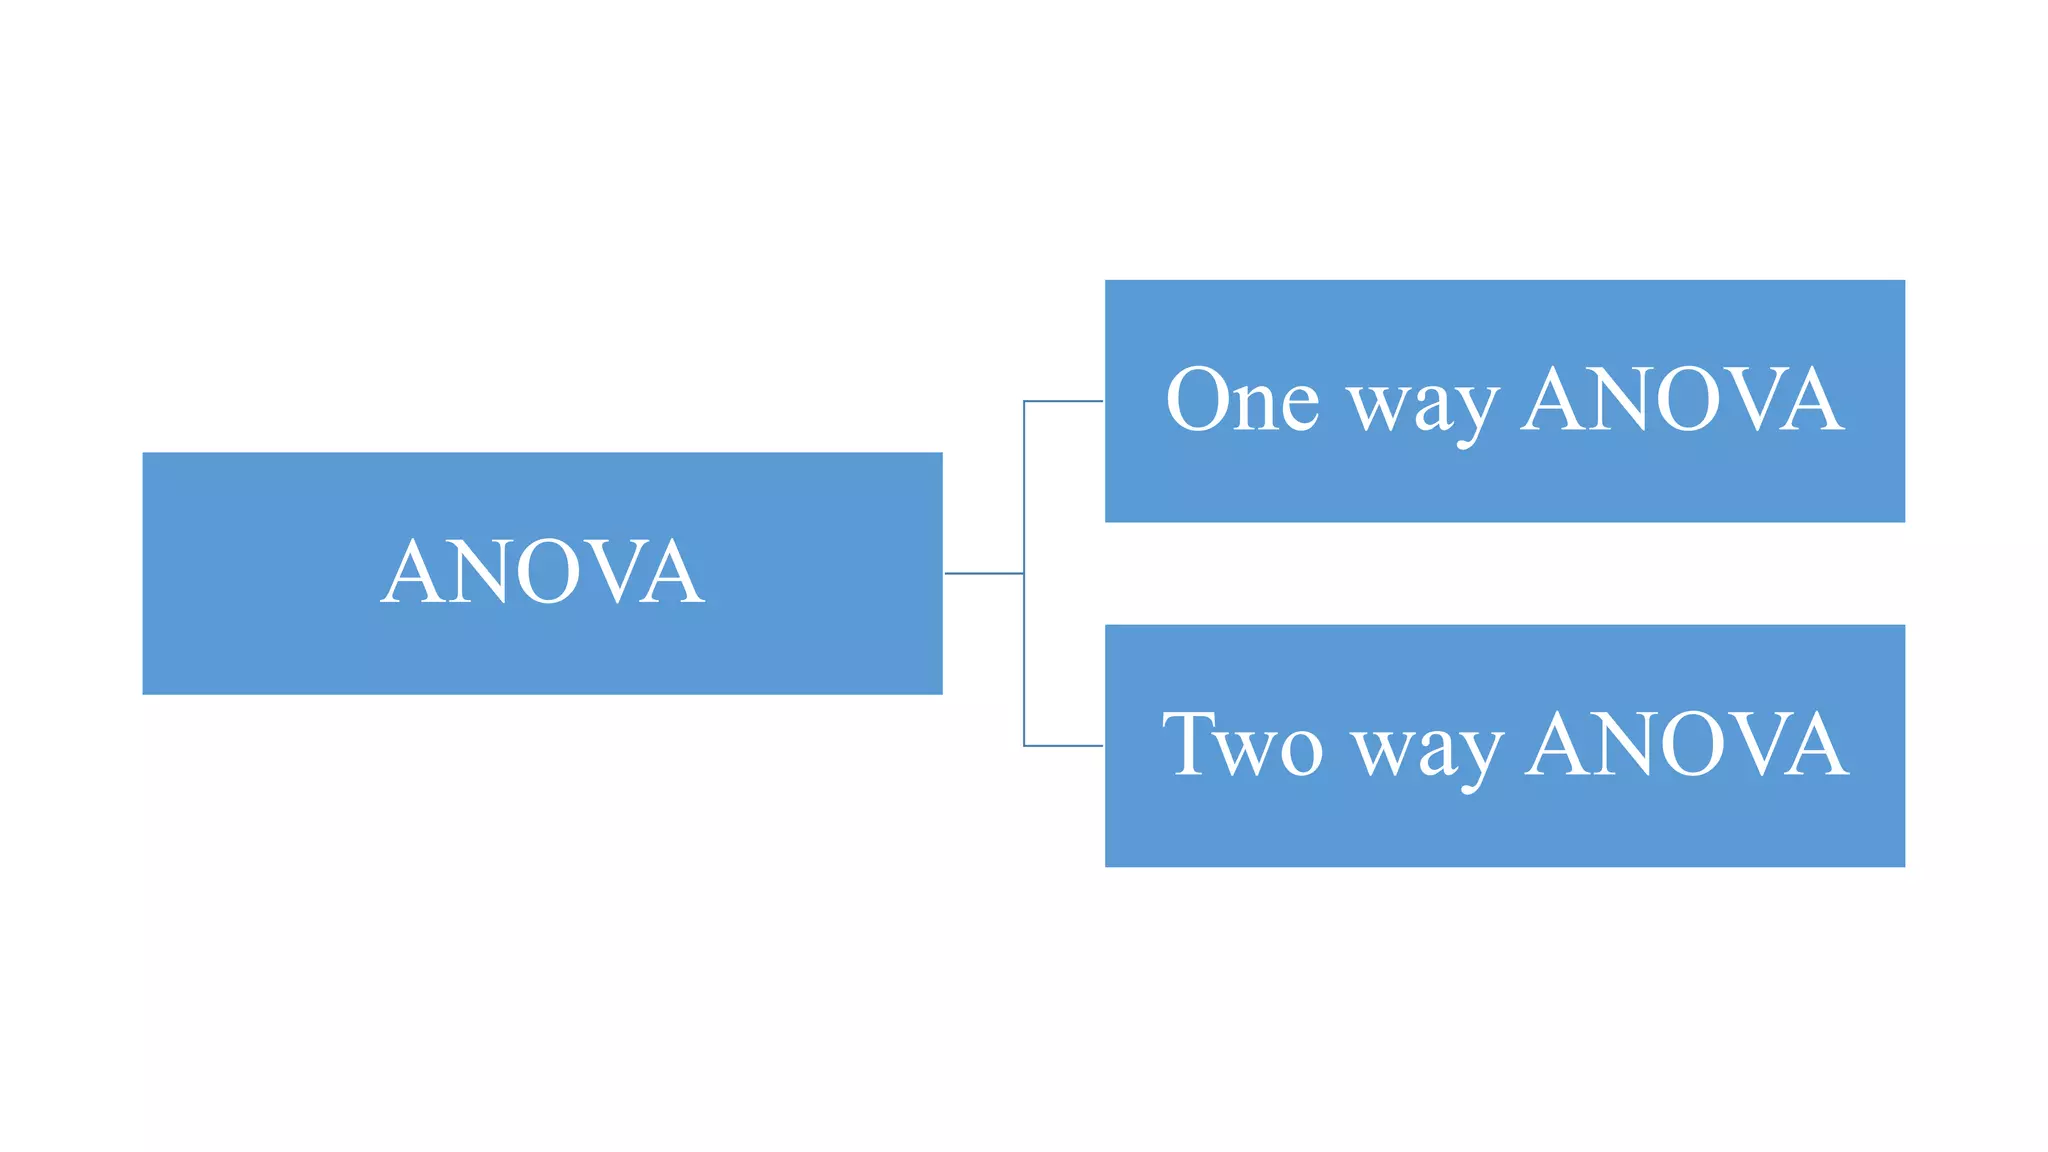
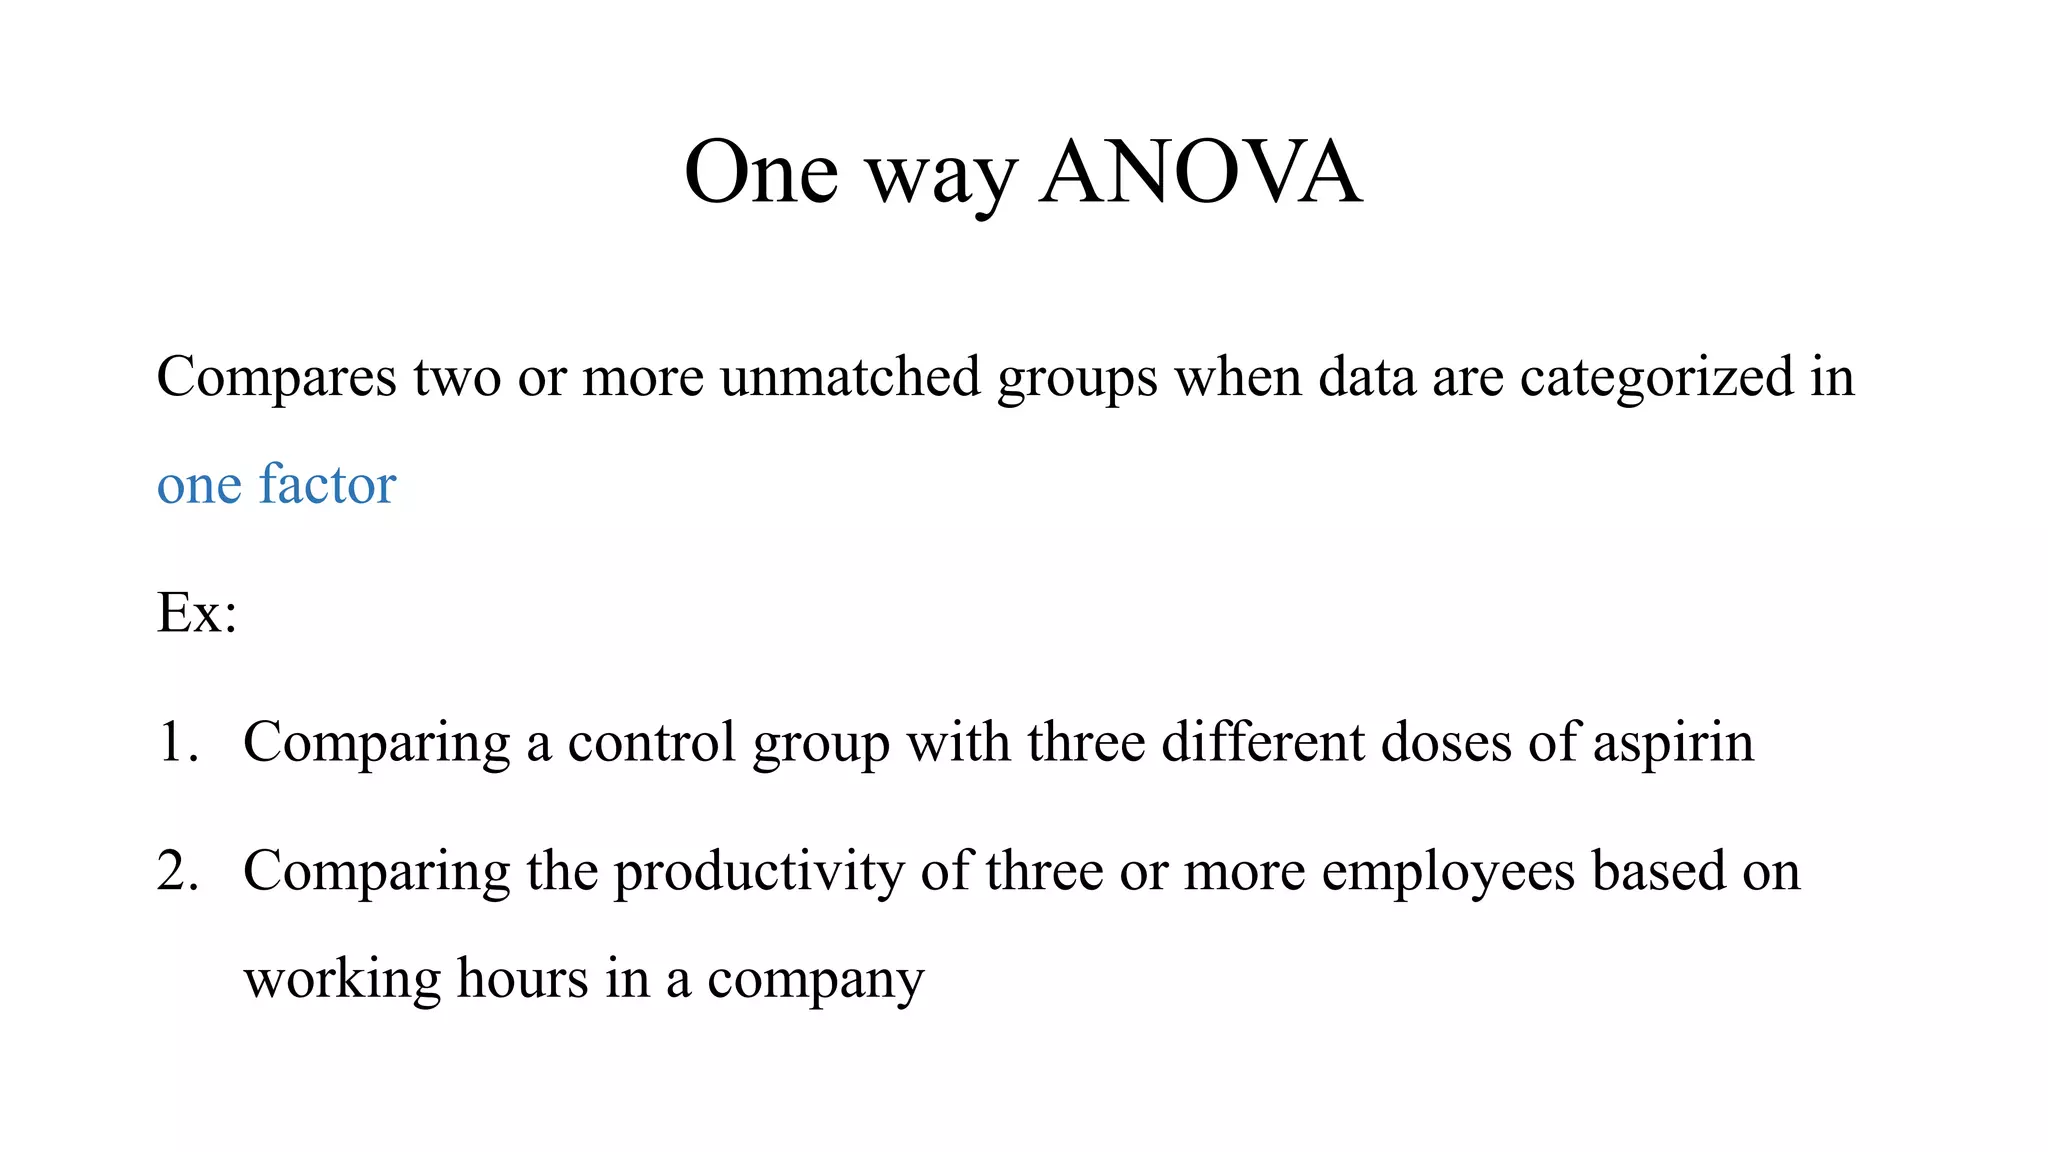
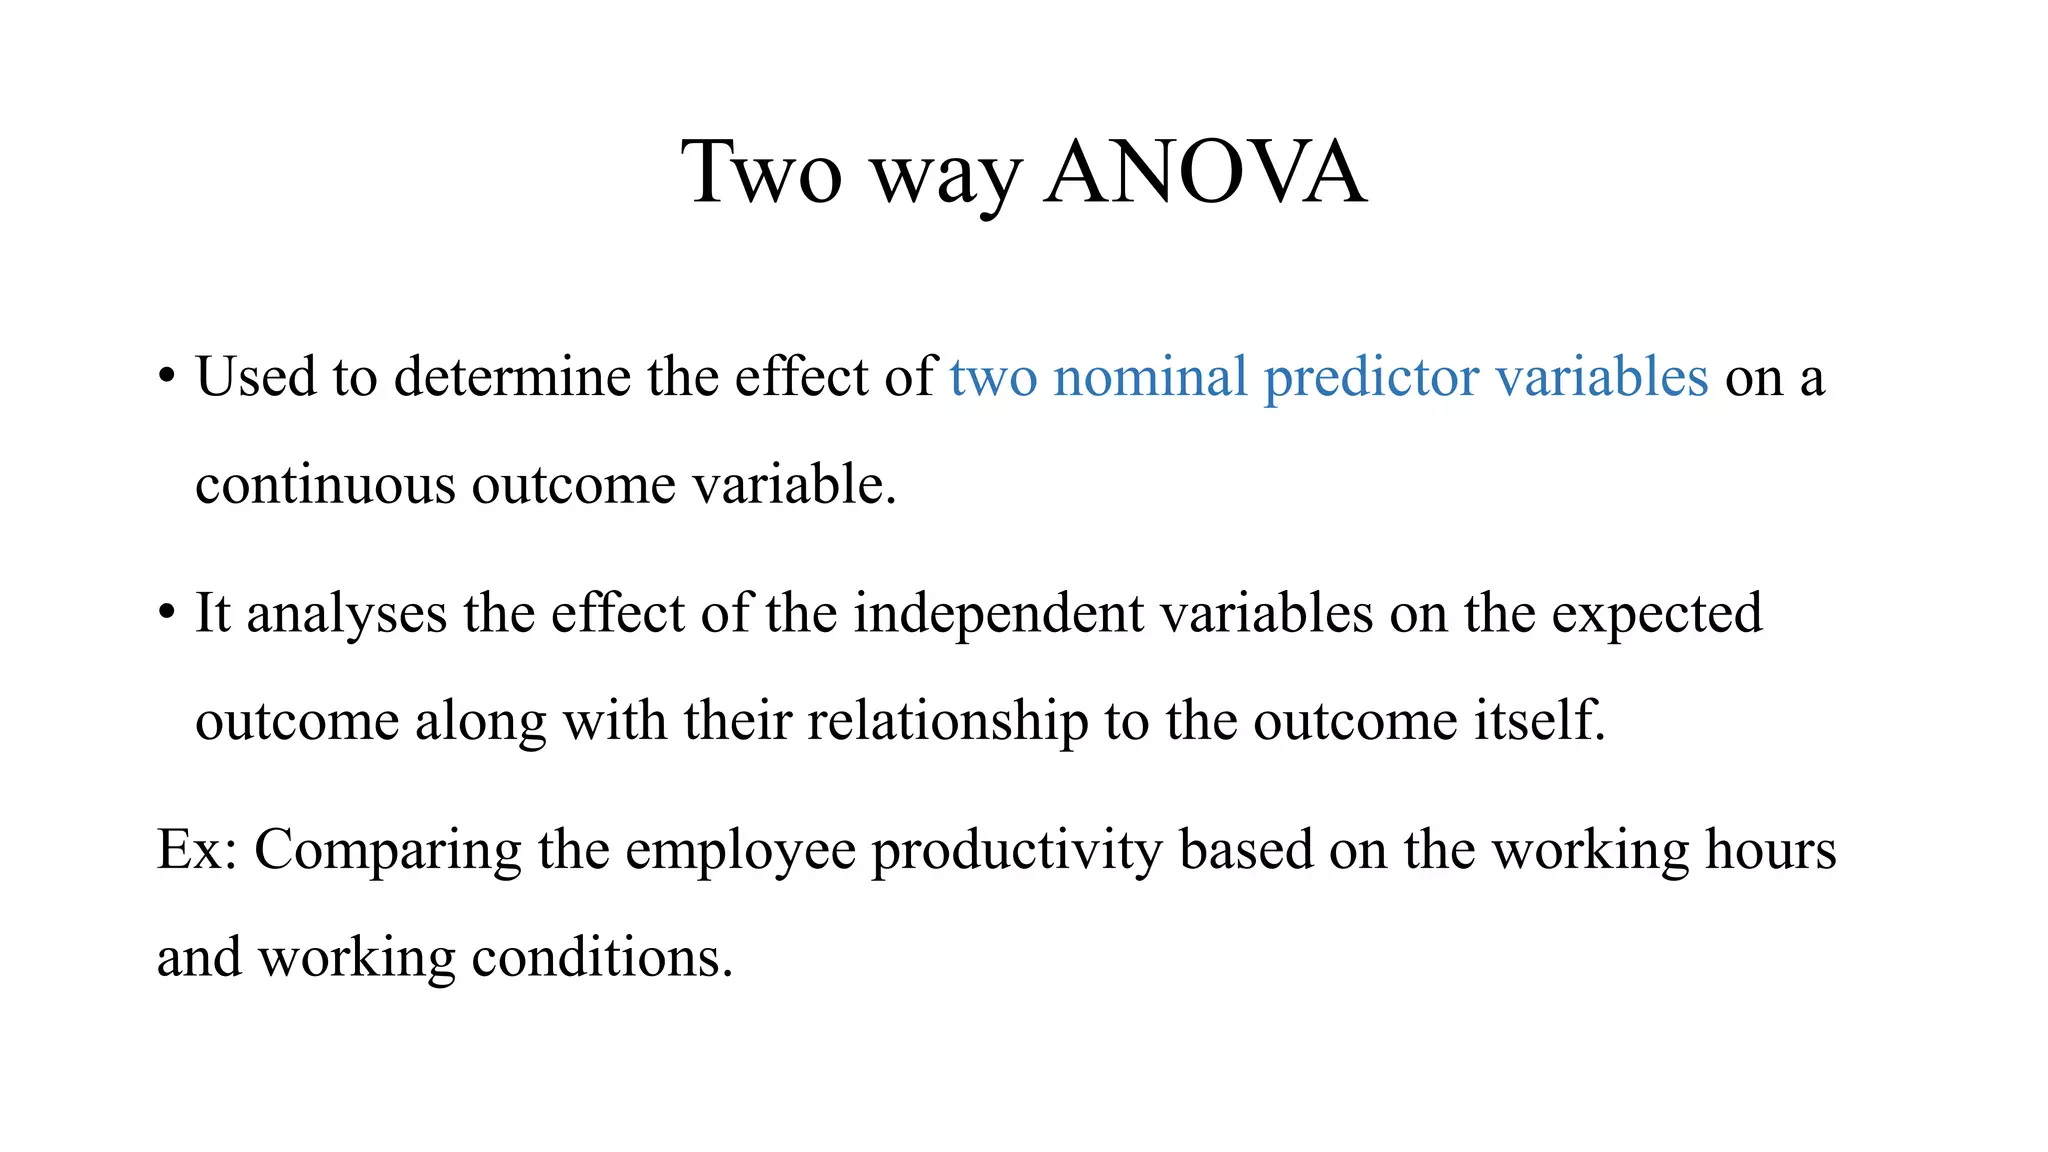
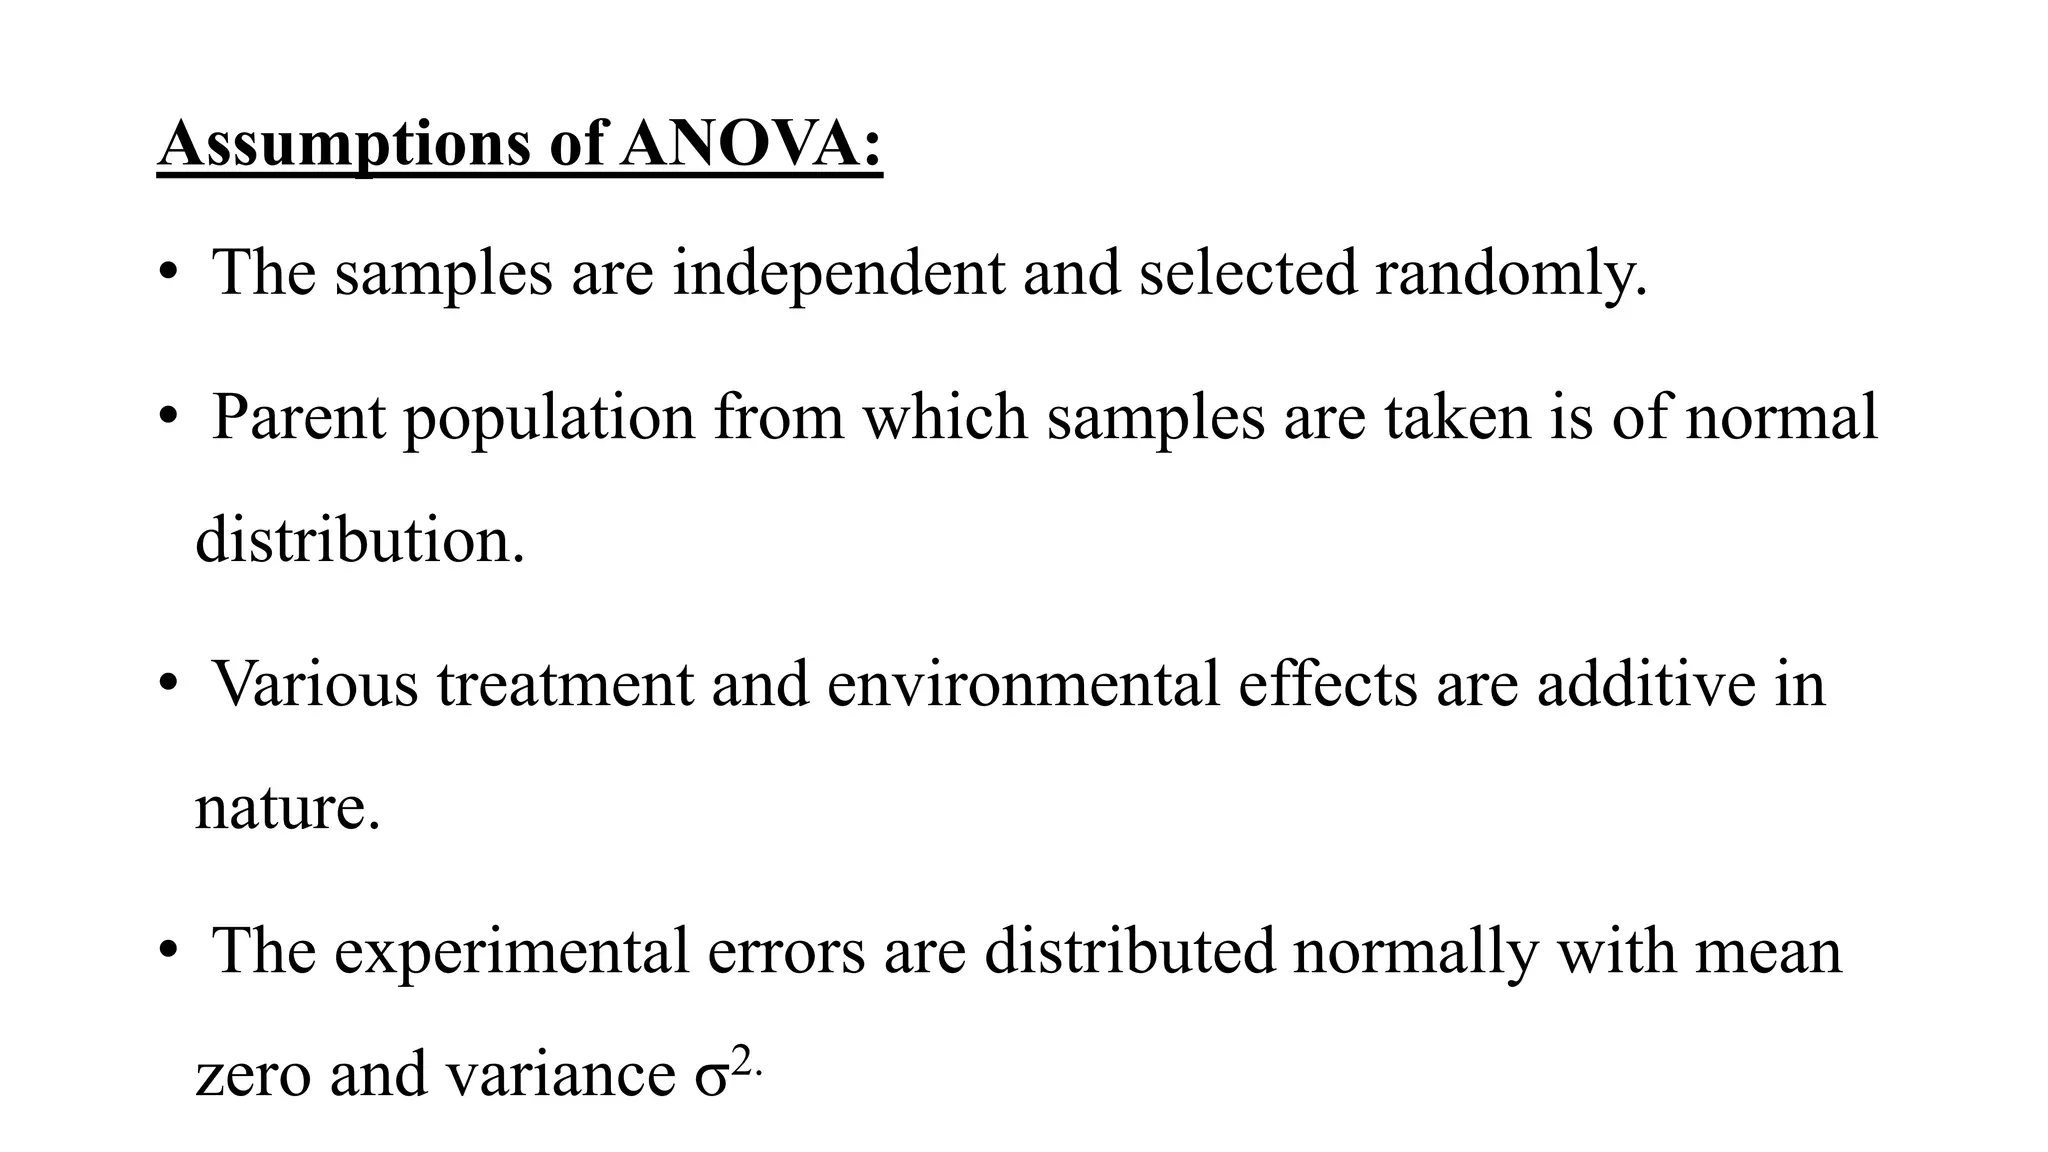
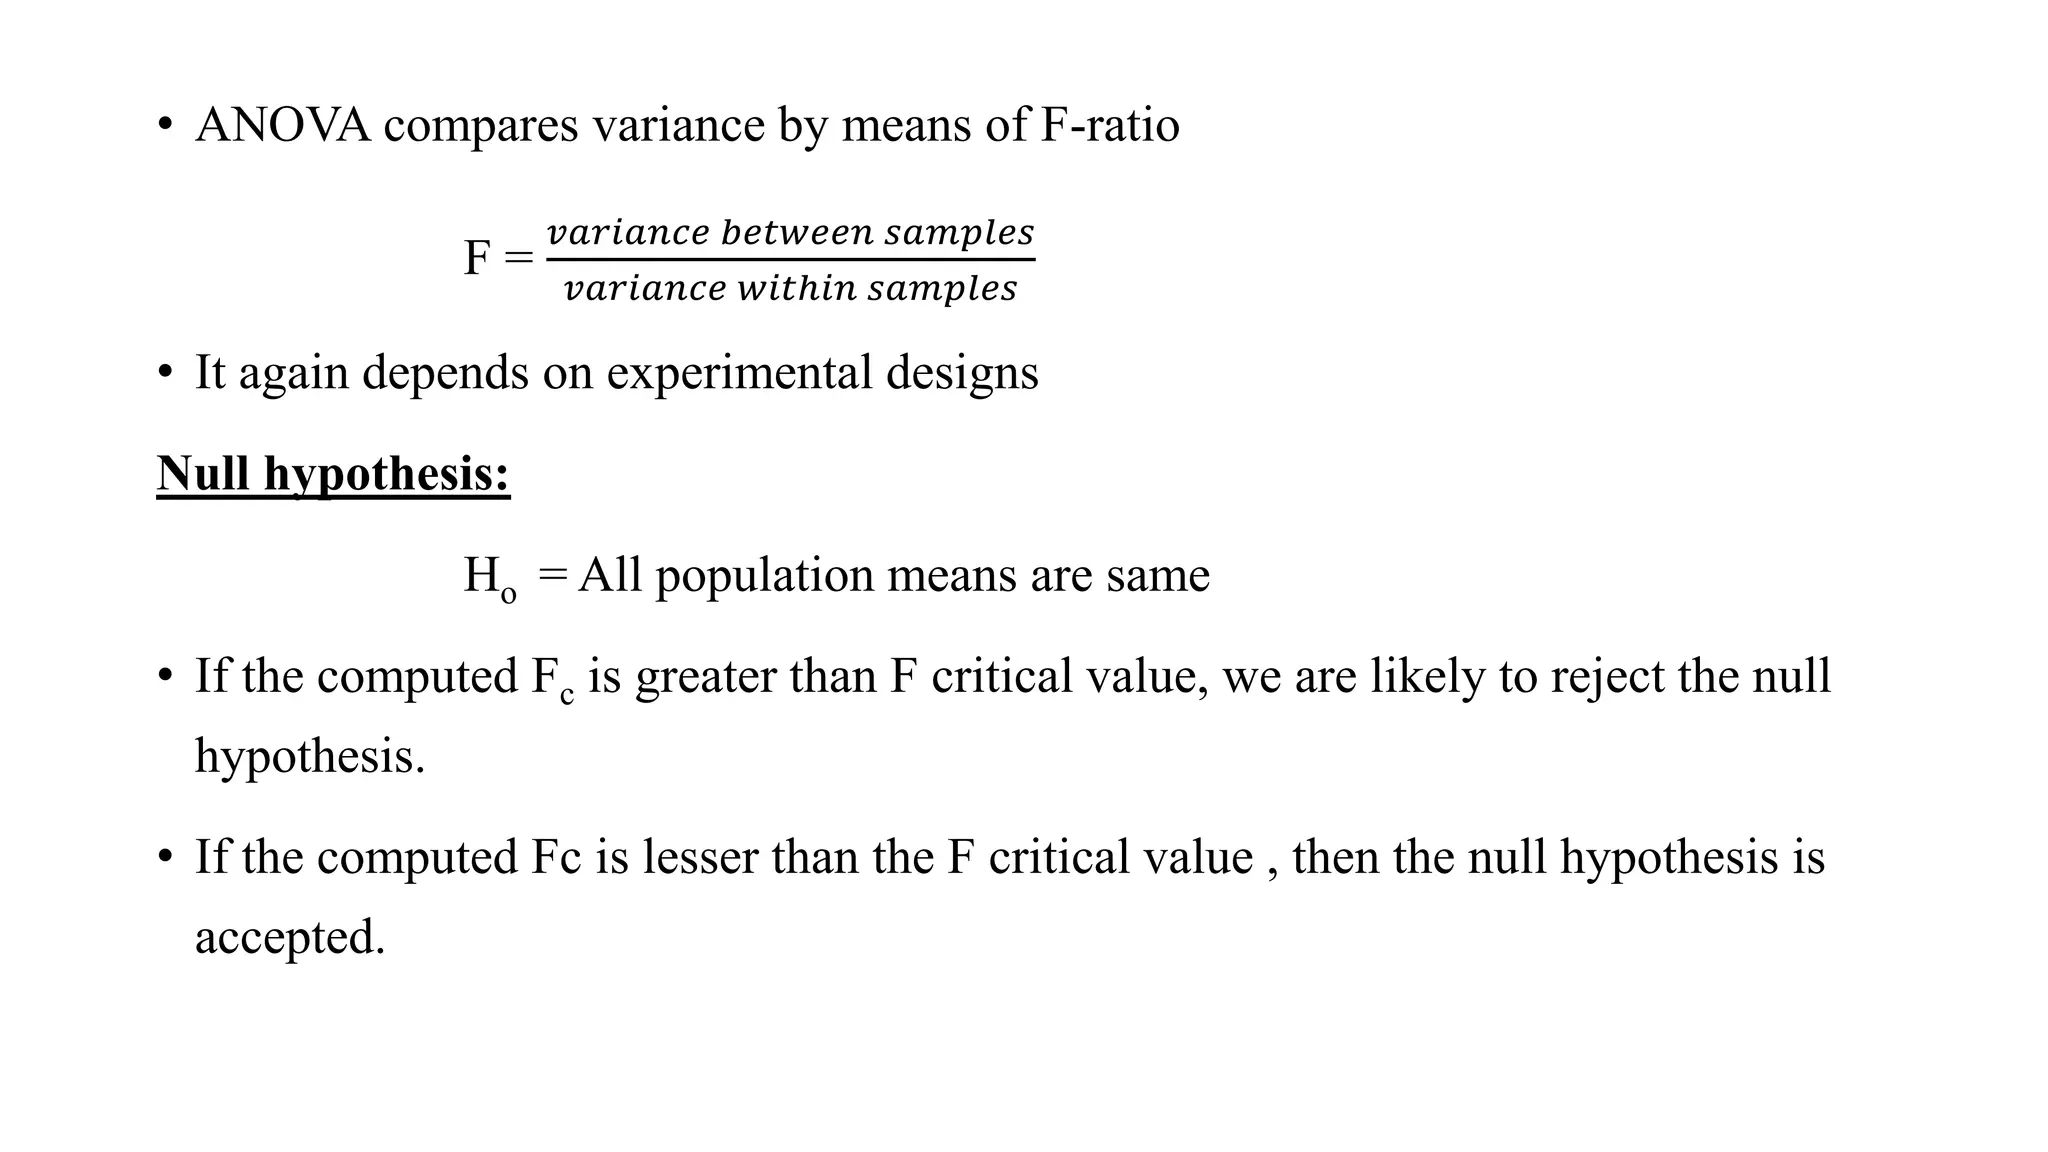
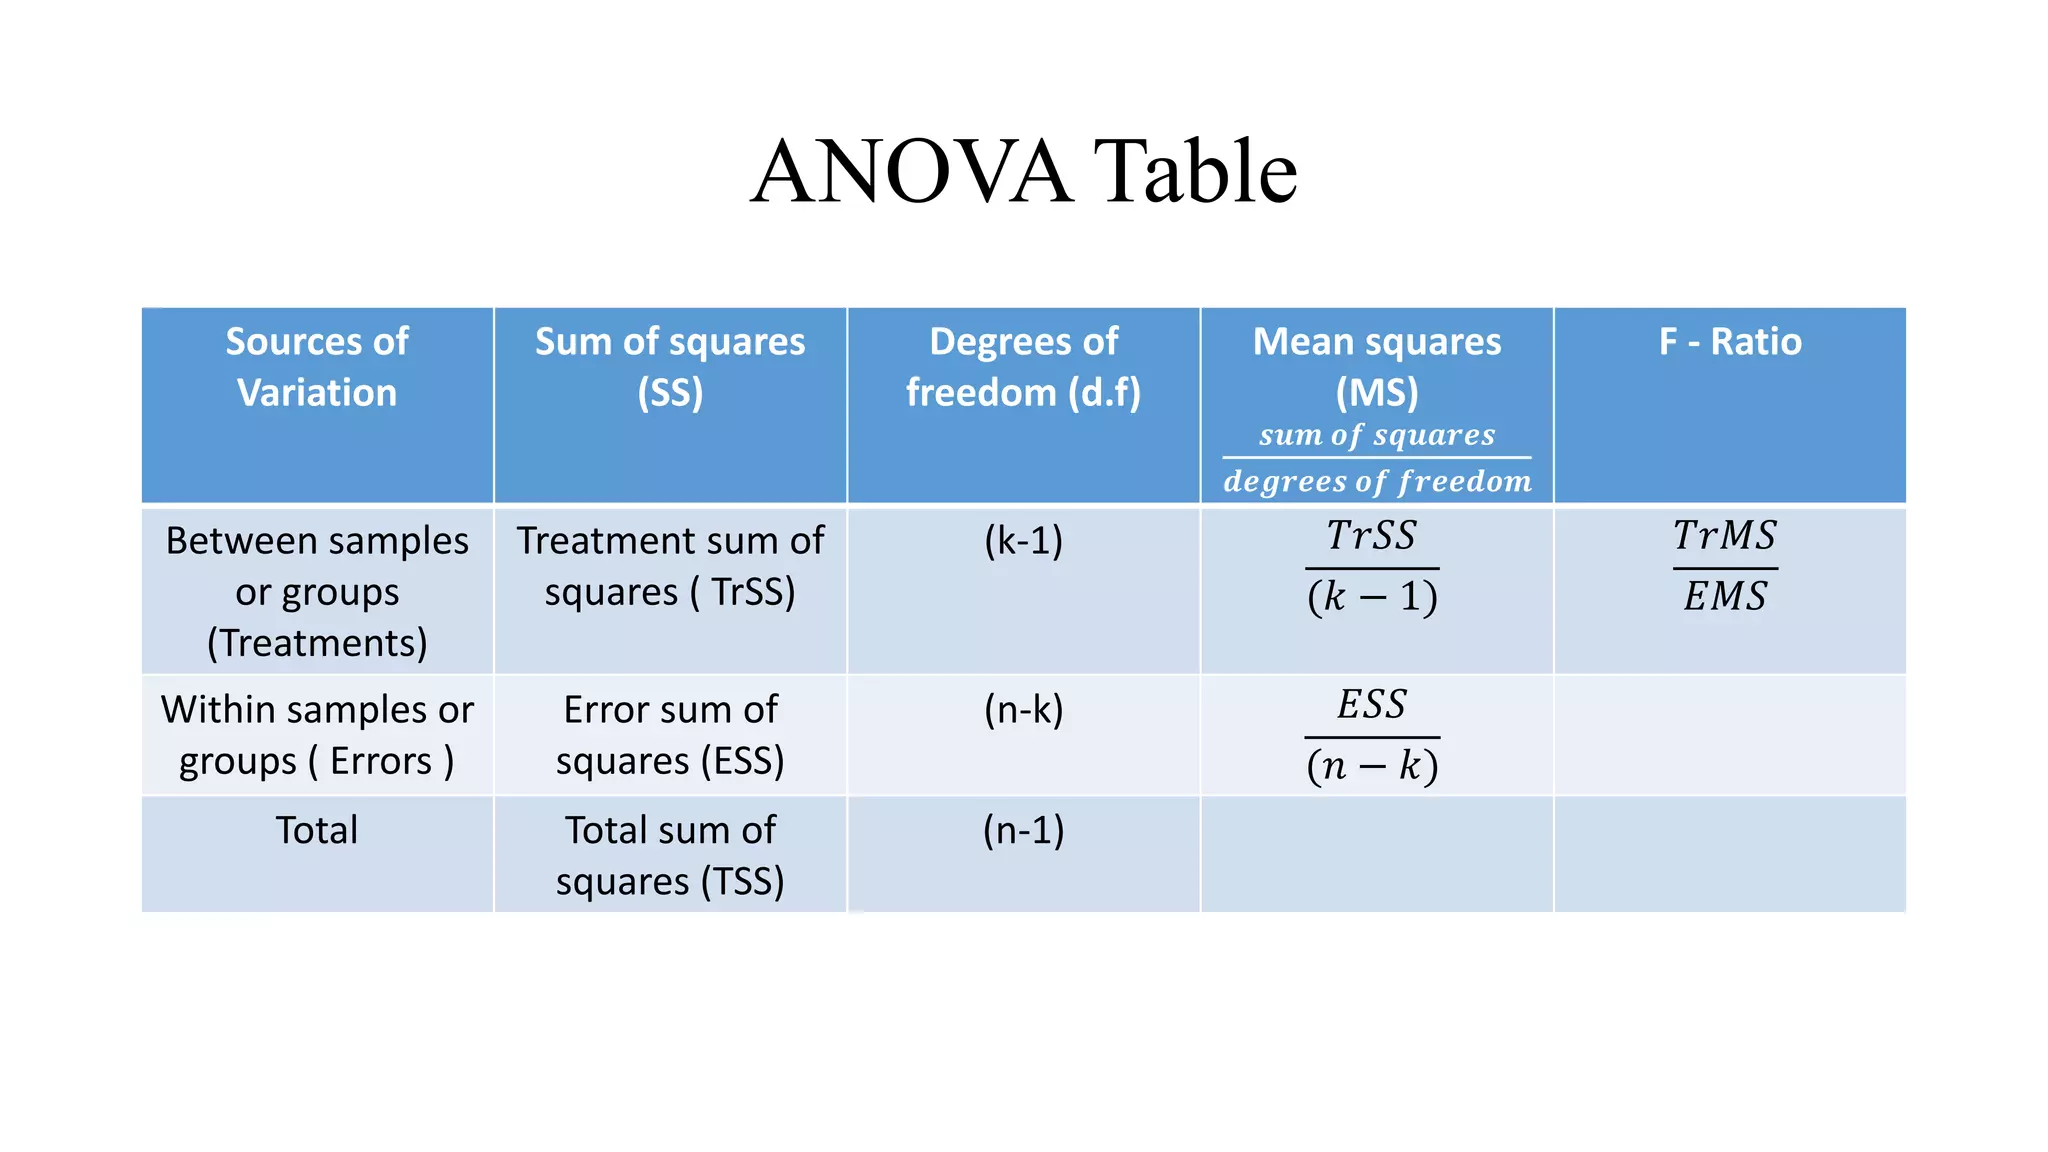
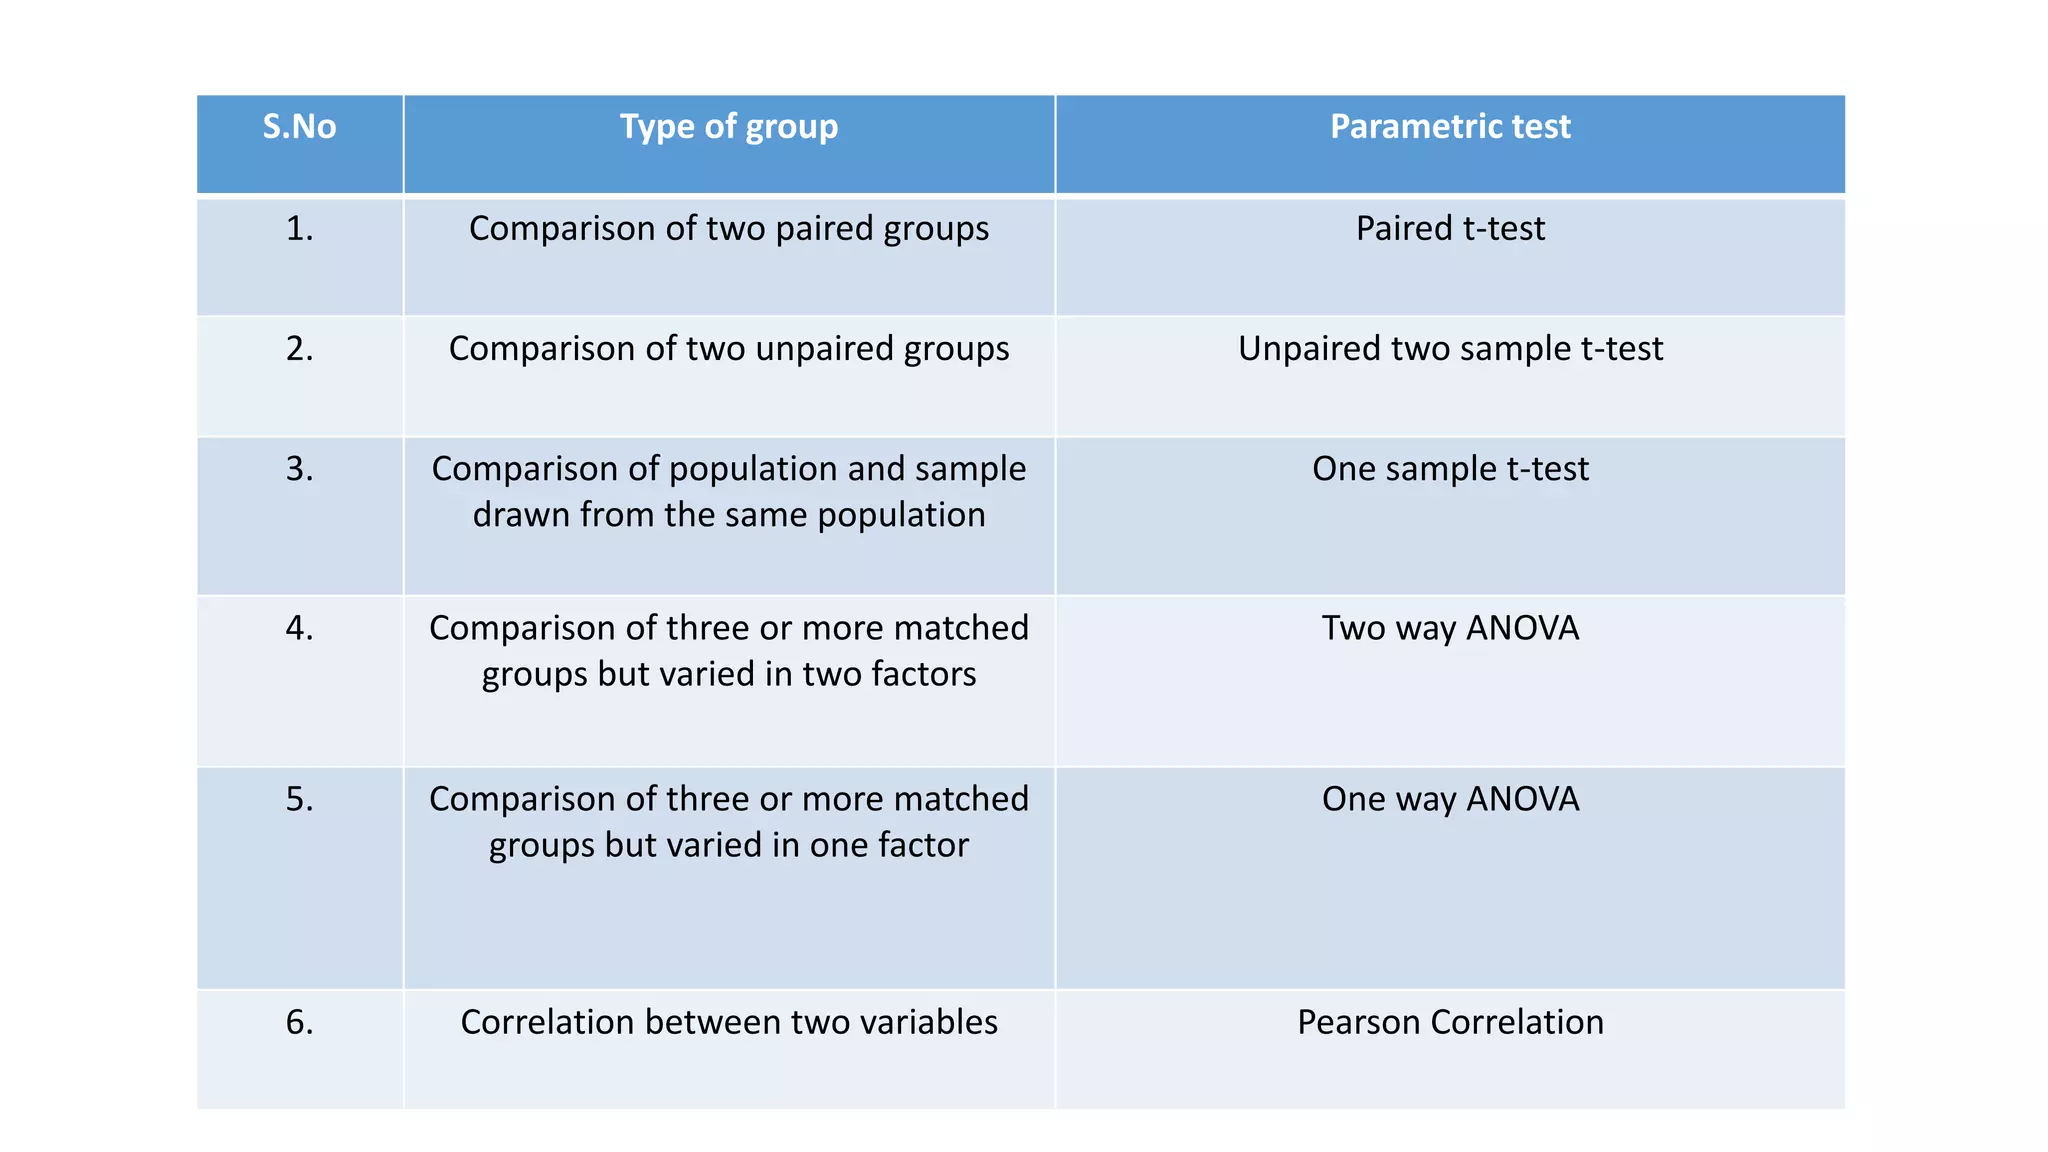
PARAMETRIC TESTS
STATISTICAL TEST
• Statistical tests are intended
to decide whether a
hypothesis about distribution
of one or more populations or
samples should be rejected or
accepted.
Statistical
Tests
Parametric tests
Non –
Parametric tests
PARAMETRIC TESTS
Parametric test is a statistical test that makes assumptions
about the parameters of the population distribution(s) from
which one’s data is drawn.
APPLICATIONS
• Used for Quantitative data.
• Used for continuous variables.
• Used when data are measured on approximate interval or
ratio scales of measurement.
• Data should follow normal distribution.
PARAMETRIC TESTS
1. t-test
t-test
t-test for one
sample
t-test for two
samples
Unpaired two
sample t-test
Paired two
sample t-test
Contd..
2. ANOVA
3. Pearson’s r correlation
4. Z test
ANOVA
One way ANOVA
Two way ANOVA
STUDENT’S T-TEST
• Developed by Prof.W.S.Gossett
• A t-test compares the difference between two means of
different groups to determine whether the difference is
statistically significant.
One Sample t-test
Assumptions:
• Population is normally distributed
• Sample is drawn from the population and it should be
random
• We should know the population mean
Conditions:
• Population standard deviation is not known
• Size of the sample is small (<30)
Contd..
• In one sample t-test , we know the population mean.
• We draw a random sample from the population and then
compare the sample mean with the population mean and
make a statistical decision as to whether or not the sample
mean is different from the population.
Let x1, x2, …….,xn be a random sample of size “n” has drawn from a
normal population with mean (µ) and variance 𝜎2.
Null hypothesis (H0):
Population mean (μ) is equal to a specified value µ0.
Under H0, the test statistic is 𝒕 =
𝒙−µ
𝒔
𝒏
Two sample t-test
• Used when the two independent random samples come from the
normal populations having unknown or same variance.
• We test the null hypothesis that the two population means are same
i.e., µ1 = µ2
Contd…
Assumptions:
1. Populations are distributed normally
2. Samples are drawn independently and at random
Conditions:
1. Standard deviations in the populations are same and not known
2. Size of the sample is small
If two independent samples xi ( i = 1,2,….,n1) and yj ( j = 1,2, …..,n2) of
sizes n1and n2 have been drawn from two normal populations with
means µ1 and µ2 respectively.
Null hypothesis
H0 : µ1 = µ2
Under H0, the test statistic is
𝒕 =
ǀ 𝒙 − 𝒚ǀ
𝑺
𝟏
𝒏 𝟏
+
𝟏
𝒏 𝟐
Paired t-test
Used when measurements are taken from the same subject
before and after some manipulation or treatment.
Ex: To determine the significance of a difference in blood
pressure before and after administration of an experimental
pressure substance.
Assumptions:
1. Populations are distributed normally
2. Samples are drawn independently and at random
Conditions:
1. Samples are related with each other
2. Sizes of the samples are small and equal
3. Standard deviations in the populations are equal and not known
Null Hypothesis:
H0: µd = 0
Under H0, the test statistic
𝒕 =
ǀ𝒅̅ǀ
𝒔
𝒏
Where, d = difference between x1 and x2
d̅ = Average of d
s = Standard deviation
n = Sample size
Z-Test
• Z-test is a statistical test where normal distribution is applied
and is basically used for dealing with problems relating to
large samples when the frequency is greater than or equal to
30.
• It is used when population standard deviation is known.
Contd…
Assumptions:
• Population is normally distributed
• The sample is drawn at random
Conditions:
• Population standard deviation σ is known
• Size of the sample is large (say n > 30)
Let x1, x2, ………x,n be a random sample size of n from a normal
population with mean µ and variance σ2 .
Let x̅ be the sample mean of sample of size “n”
Null Hypothesis:
Population mean (µ) is equal to a specified value µο
H0: µ = µο
Under Hο, the test statistic is
𝒁 =
ǀ 𝒙 − µ 𝝄ǀ
𝒔
𝒏
If the calculated value of Z < table value of Z at 5% level of
significance, H0 is accepted and hence we conclude that there is no
significant difference between the population mean and the one
specified in H0 as µο.
Pearson’s ‘r’ Correlation
• Correlation is a technique for investigating the relationship
between two quantitative, continuous variables.
• Pearson’s Correlation Coefficient (r) is a measure of the
strength of the association between the two variables
Types of correlation
Type of correlation Correlation coefficient
Perfect positive correlation r = +1
Partial positive correlation 0 < r < +1
No correlation r = 0
Partial negative correlation 0 > r > -1
Perfect negative correlation r = -1
ANOVA (Analysis of Variance)
• Analysis of Variance (ANOVA) is a collection of statistical
models used to analyse the differences between group means
or variances.
• Compares multiple groups at one time
• Developed by R.A.Fischer
ANOVA
One way ANOVA
Two way ANOVA
One way ANOVA
Compares two or more unmatched groups when data are categorized in
one factor
Ex:
1. Comparing a control group with three different doses of aspirin
2. Comparing the productivity of three or more employees based on
working hours in a company
Two way ANOVA
• Used to determine the effect of two nominal predictor variables on a
continuous outcome variable.
• It analyses the effect of the independent variables on the expected
outcome along with their relationship to the outcome itself.
Ex: Comparing the employee productivity based on the working hours
and working conditions.
Assumptions of ANOVA:
• The samples are independent and selected randomly.
• Parent population from which samples are taken is of normal
distribution.
• Various treatment and environmental effects are additive in
nature.
• The experimental errors are distributed normally with mean
zero and variance σ2.
• ANOVA compares variance by means of F-ratio
F =
𝑣𝑎𝑟𝑖𝑎𝑛𝑐𝑒 𝑏𝑒𝑡𝑤𝑒𝑒𝑛 𝑠𝑎𝑚𝑝𝑙𝑒𝑠
𝑣𝑎𝑟𝑖𝑎𝑛𝑐𝑒 𝑤𝑖𝑡ℎ𝑖𝑛 𝑠𝑎𝑚𝑝𝑙𝑒𝑠
• It again depends on experimental designs
Null hypothesis:
Hο = All population means are same
• If the computed Fc is greater than F critical value, we are likely to reject the null
hypothesis.
• If the computed Fc is lesser than the F critical value , then the null hypothesis is
accepted.
ANOVA Table
Sources of
Variation
Sum of squares
(SS)
Degrees of
freedom (d.f)
Mean squares
(MS)
𝒔𝒖𝒎 𝒐𝒇 𝒔𝒒𝒖𝒂𝒓𝒆𝒔
𝒅̅𝒆𝒈𝒓𝒆𝒆𝒔 𝒐𝒇 𝒇𝒓𝒆𝒆𝒅̅𝒐𝒎
F - Ratio
Between samples
or groups
(Treatments)
Treatment sum of
squares ( TrSS)
(k-1) 𝑇𝑟𝑆𝑆
(𝑘 − 1)
𝑇𝑟𝑀𝑆
𝐸𝑀𝑆
Within samples or
groups ( Errors )
Error sum of
squares (ESS)
(n-k) 𝐸𝑆𝑆
(𝑛 − 𝑘)
Total Total sum of
squares (TSS)
(n-1)
S.No Type of group Parametric test
1. Comparison of two paired groups Paired t-test
2. Comparison of two unpaired groups Unpaired two sample t-test
3. Comparison of population and sample
drawn from the same population
One sample t-test
4. Comparison of three or more matched
groups but varied in two factors
Two way ANOVA
5. Comparison of three or more matched
groups but varied in one factor
One way ANOVA
6. Correlation between two variables Pearson Correlation
Parametric tests

Parametric tests

  • 1.
  • 2.
    STATISTICAL TEST • Statisticaltests are intended to decide whether a hypothesis about distribution of one or more populations or samples should be rejected or accepted. Statistical Tests Parametric tests Non – Parametric tests
  • 3.
    PARAMETRIC TESTS Parametric testis a statistical test that makes assumptions about the parameters of the population distribution(s) from which one’s data is drawn.
  • 4.
    APPLICATIONS • Used forQuantitative data. • Used for continuous variables. • Used when data are measured on approximate interval or ratio scales of measurement. • Data should follow normal distribution.
  • 5.
    PARAMETRIC TESTS 1. t-test t-test t-testfor one sample t-test for two samples Unpaired two sample t-test Paired two sample t-test
  • 6.
    Contd.. 2. ANOVA 3. Pearson’sr correlation 4. Z test ANOVA One way ANOVA Two way ANOVA
  • 7.
    STUDENT’S T-TEST • Developedby Prof.W.S.Gossett • A t-test compares the difference between two means of different groups to determine whether the difference is statistically significant.
  • 8.
    One Sample t-test Assumptions: •Population is normally distributed • Sample is drawn from the population and it should be random • We should know the population mean Conditions: • Population standard deviation is not known • Size of the sample is small (<30)
  • 9.
    Contd.. • In onesample t-test , we know the population mean. • We draw a random sample from the population and then compare the sample mean with the population mean and make a statistical decision as to whether or not the sample mean is different from the population.
  • 10.
    Let x1, x2,…….,xn be a random sample of size “n” has drawn from a normal population with mean (µ) and variance 𝜎2. Null hypothesis (H0): Population mean (μ) is equal to a specified value µ0. Under H0, the test statistic is 𝒕 = 𝒙−µ 𝒔 𝒏
  • 11.
    Two sample t-test •Used when the two independent random samples come from the normal populations having unknown or same variance. • We test the null hypothesis that the two population means are same i.e., µ1 = µ2
  • 12.
    Contd… Assumptions: 1. Populations aredistributed normally 2. Samples are drawn independently and at random Conditions: 1. Standard deviations in the populations are same and not known 2. Size of the sample is small
  • 13.
    If two independentsamples xi ( i = 1,2,….,n1) and yj ( j = 1,2, …..,n2) of sizes n1and n2 have been drawn from two normal populations with means µ1 and µ2 respectively. Null hypothesis H0 : µ1 = µ2 Under H0, the test statistic is 𝒕 = ǀ 𝒙 − 𝒚ǀ 𝑺 𝟏 𝒏 𝟏 + 𝟏 𝒏 𝟐
  • 14.
    Paired t-test Used whenmeasurements are taken from the same subject before and after some manipulation or treatment. Ex: To determine the significance of a difference in blood pressure before and after administration of an experimental pressure substance.
  • 15.
    Assumptions: 1. Populations aredistributed normally 2. Samples are drawn independently and at random Conditions: 1. Samples are related with each other 2. Sizes of the samples are small and equal 3. Standard deviations in the populations are equal and not known
  • 16.
    Null Hypothesis: H0: µd= 0 Under H0, the test statistic 𝒕 = ǀ𝒅̅ǀ 𝒔 𝒏 Where, d = difference between x1 and x2 d̅ = Average of d s = Standard deviation n = Sample size
  • 17.
    Z-Test • Z-test isa statistical test where normal distribution is applied and is basically used for dealing with problems relating to large samples when the frequency is greater than or equal to 30. • It is used when population standard deviation is known.
  • 18.
    Contd… Assumptions: • Population isnormally distributed • The sample is drawn at random Conditions: • Population standard deviation σ is known • Size of the sample is large (say n > 30)
  • 19.
    Let x1, x2,………x,n be a random sample size of n from a normal population with mean µ and variance σ2 . Let x̅ be the sample mean of sample of size “n” Null Hypothesis: Population mean (µ) is equal to a specified value µο H0: µ = µο
  • 20.
    Under Hο, thetest statistic is 𝒁 = ǀ 𝒙 − µ 𝝄ǀ 𝒔 𝒏 If the calculated value of Z < table value of Z at 5% level of significance, H0 is accepted and hence we conclude that there is no significant difference between the population mean and the one specified in H0 as µο.
  • 21.
    Pearson’s ‘r’ Correlation •Correlation is a technique for investigating the relationship between two quantitative, continuous variables. • Pearson’s Correlation Coefficient (r) is a measure of the strength of the association between the two variables
  • 22.
    Types of correlation Typeof correlation Correlation coefficient Perfect positive correlation r = +1 Partial positive correlation 0 < r < +1 No correlation r = 0 Partial negative correlation 0 > r > -1 Perfect negative correlation r = -1
  • 23.
    ANOVA (Analysis ofVariance) • Analysis of Variance (ANOVA) is a collection of statistical models used to analyse the differences between group means or variances. • Compares multiple groups at one time • Developed by R.A.Fischer
  • 24.
  • 25.
    One way ANOVA Comparestwo or more unmatched groups when data are categorized in one factor Ex: 1. Comparing a control group with three different doses of aspirin 2. Comparing the productivity of three or more employees based on working hours in a company
  • 26.
    Two way ANOVA •Used to determine the effect of two nominal predictor variables on a continuous outcome variable. • It analyses the effect of the independent variables on the expected outcome along with their relationship to the outcome itself. Ex: Comparing the employee productivity based on the working hours and working conditions.
  • 27.
    Assumptions of ANOVA: •The samples are independent and selected randomly. • Parent population from which samples are taken is of normal distribution. • Various treatment and environmental effects are additive in nature. • The experimental errors are distributed normally with mean zero and variance σ2.
  • 28.
    • ANOVA comparesvariance by means of F-ratio F = 𝑣𝑎𝑟𝑖𝑎𝑛𝑐𝑒 𝑏𝑒𝑡𝑤𝑒𝑒𝑛 𝑠𝑎𝑚𝑝𝑙𝑒𝑠 𝑣𝑎𝑟𝑖𝑎𝑛𝑐𝑒 𝑤𝑖𝑡ℎ𝑖𝑛 𝑠𝑎𝑚𝑝𝑙𝑒𝑠 • It again depends on experimental designs Null hypothesis: Hο = All population means are same • If the computed Fc is greater than F critical value, we are likely to reject the null hypothesis. • If the computed Fc is lesser than the F critical value , then the null hypothesis is accepted.
  • 29.
    ANOVA Table Sources of Variation Sumof squares (SS) Degrees of freedom (d.f) Mean squares (MS) 𝒔𝒖𝒎 𝒐𝒇 𝒔𝒒𝒖𝒂𝒓𝒆𝒔 𝒅̅𝒆𝒈𝒓𝒆𝒆𝒔 𝒐𝒇 𝒇𝒓𝒆𝒆𝒅̅𝒐𝒎 F - Ratio Between samples or groups (Treatments) Treatment sum of squares ( TrSS) (k-1) 𝑇𝑟𝑆𝑆 (𝑘 − 1) 𝑇𝑟𝑀𝑆 𝐸𝑀𝑆 Within samples or groups ( Errors ) Error sum of squares (ESS) (n-k) 𝐸𝑆𝑆 (𝑛 − 𝑘) Total Total sum of squares (TSS) (n-1)
  • 30.
    S.No Type ofgroup Parametric test 1. Comparison of two paired groups Paired t-test 2. Comparison of two unpaired groups Unpaired two sample t-test 3. Comparison of population and sample drawn from the same population One sample t-test 4. Comparison of three or more matched groups but varied in two factors Two way ANOVA 5. Comparison of three or more matched groups but varied in one factor One way ANOVA 6. Correlation between two variables Pearson Correlation

Editor's Notes

  • #9 One sample t-test is a statistical procedure that is used to know the population mean and the known value of the population mean. In one sample t-test, we know the population mean. We draw a random sample from the population and then compare the sample mean with population mean and make a statistical decision as to whether or not the sample mean is different from the population mean. In one sample t-test, sample size should be less than 30.
  • #11 Now we compare calculated value with table value at certain level of significance ( generally at 5% ). If absolute value of ‘t’ obtained is greater than table value then reject the null hypothesis and if it is less than table value , the null hypothesis may be accepted.