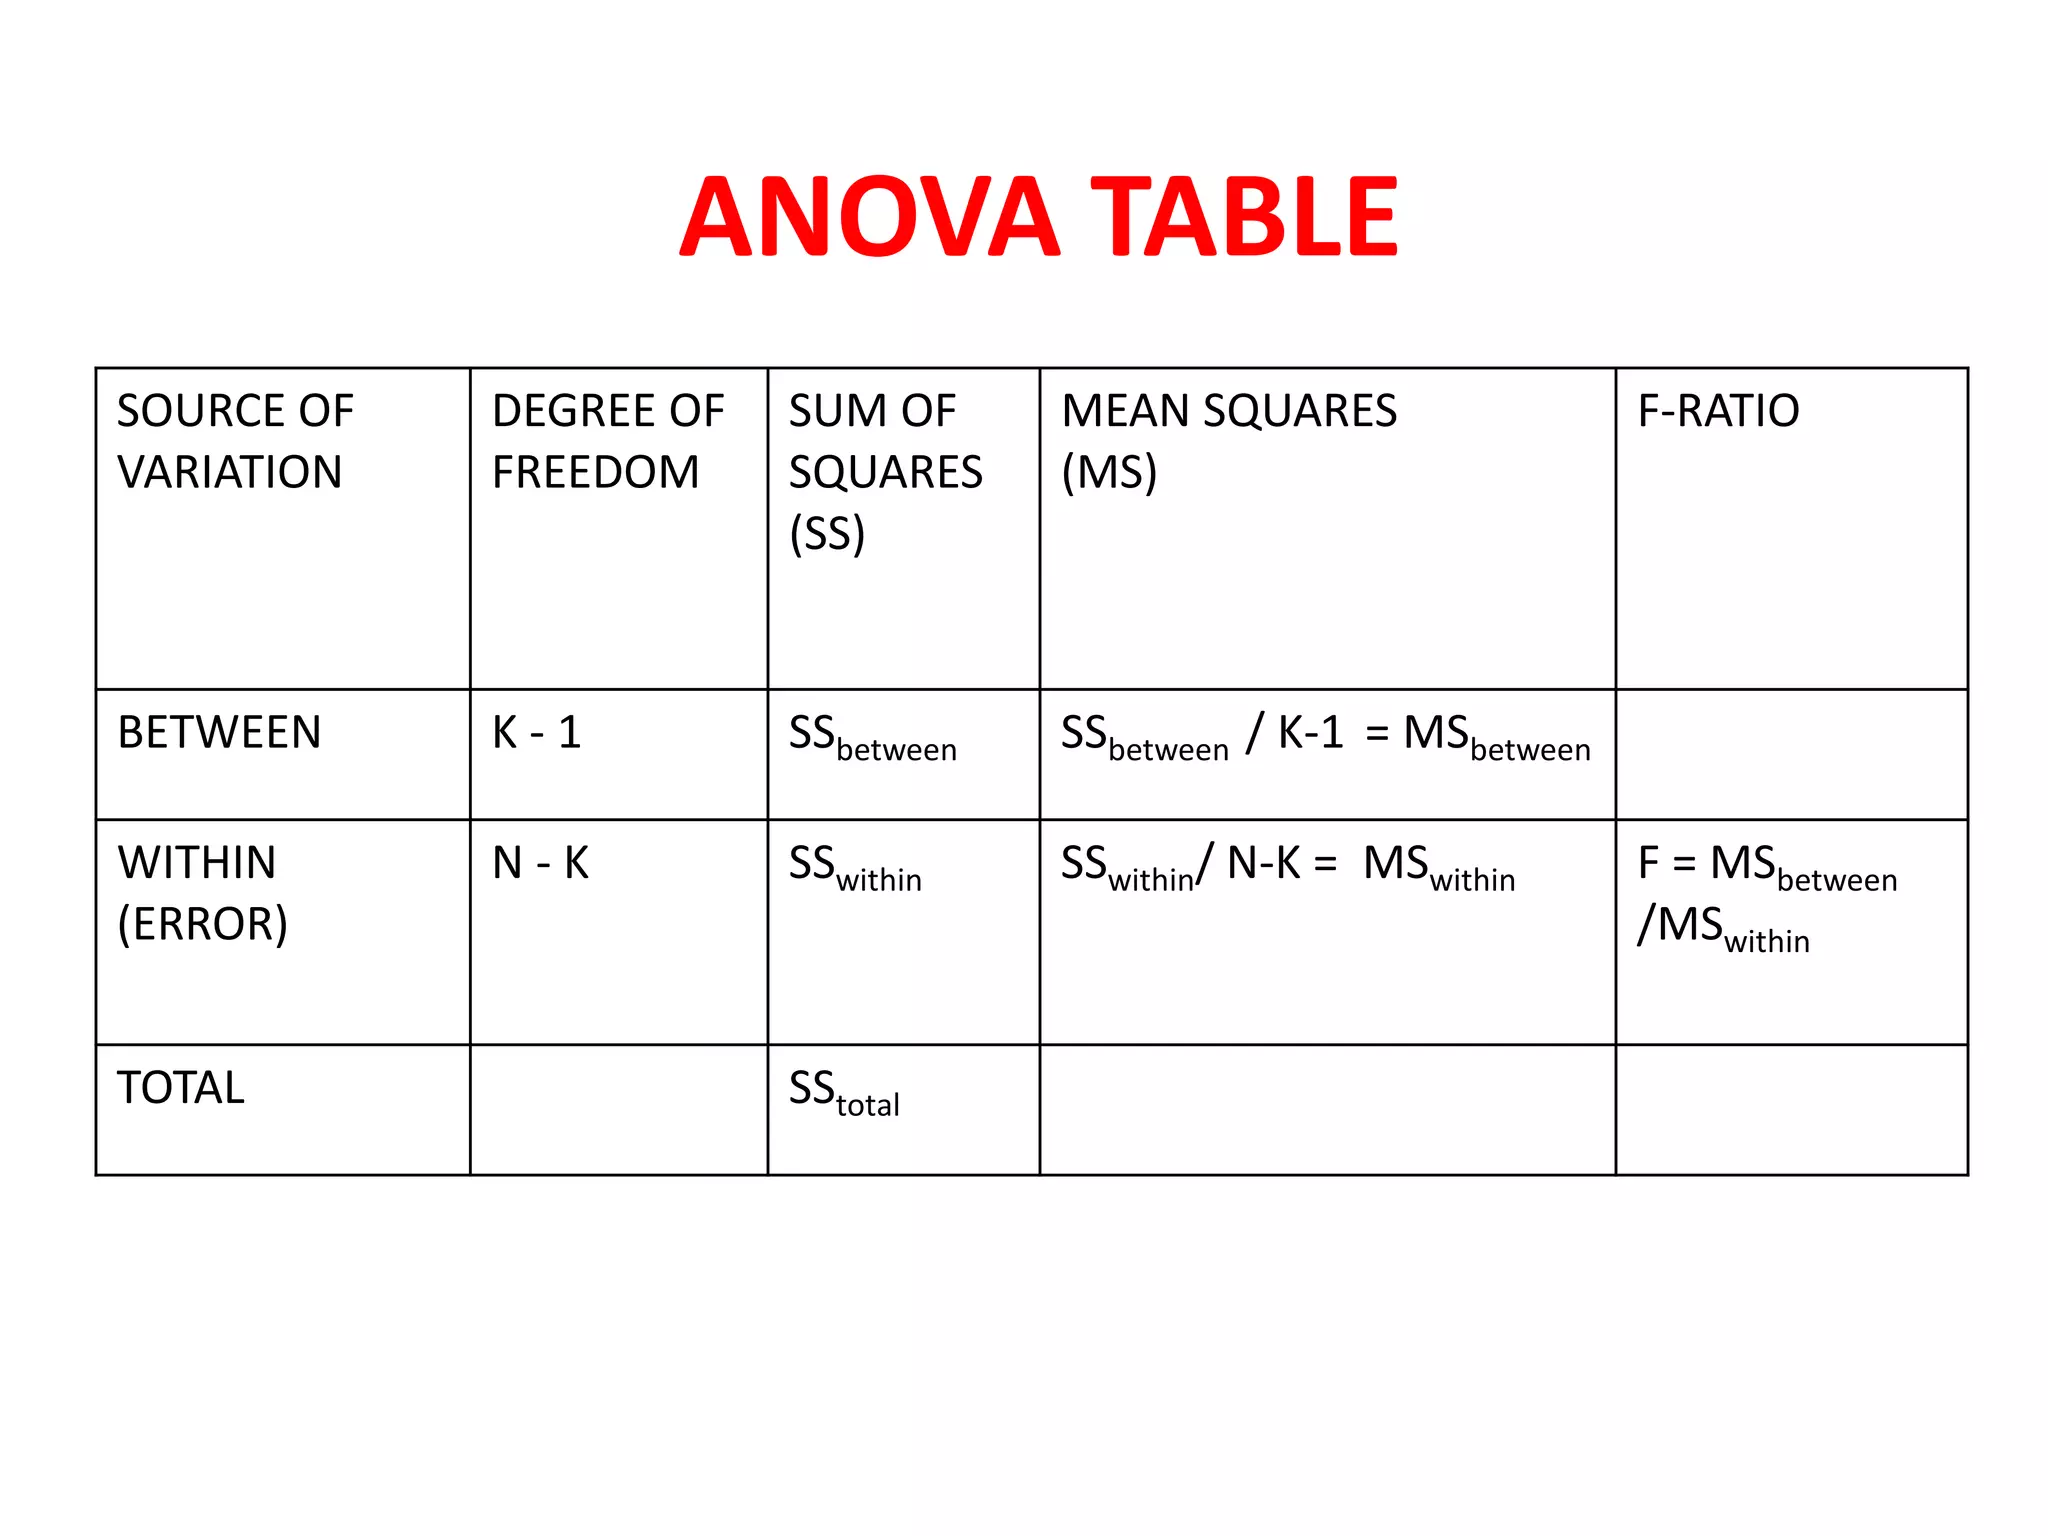
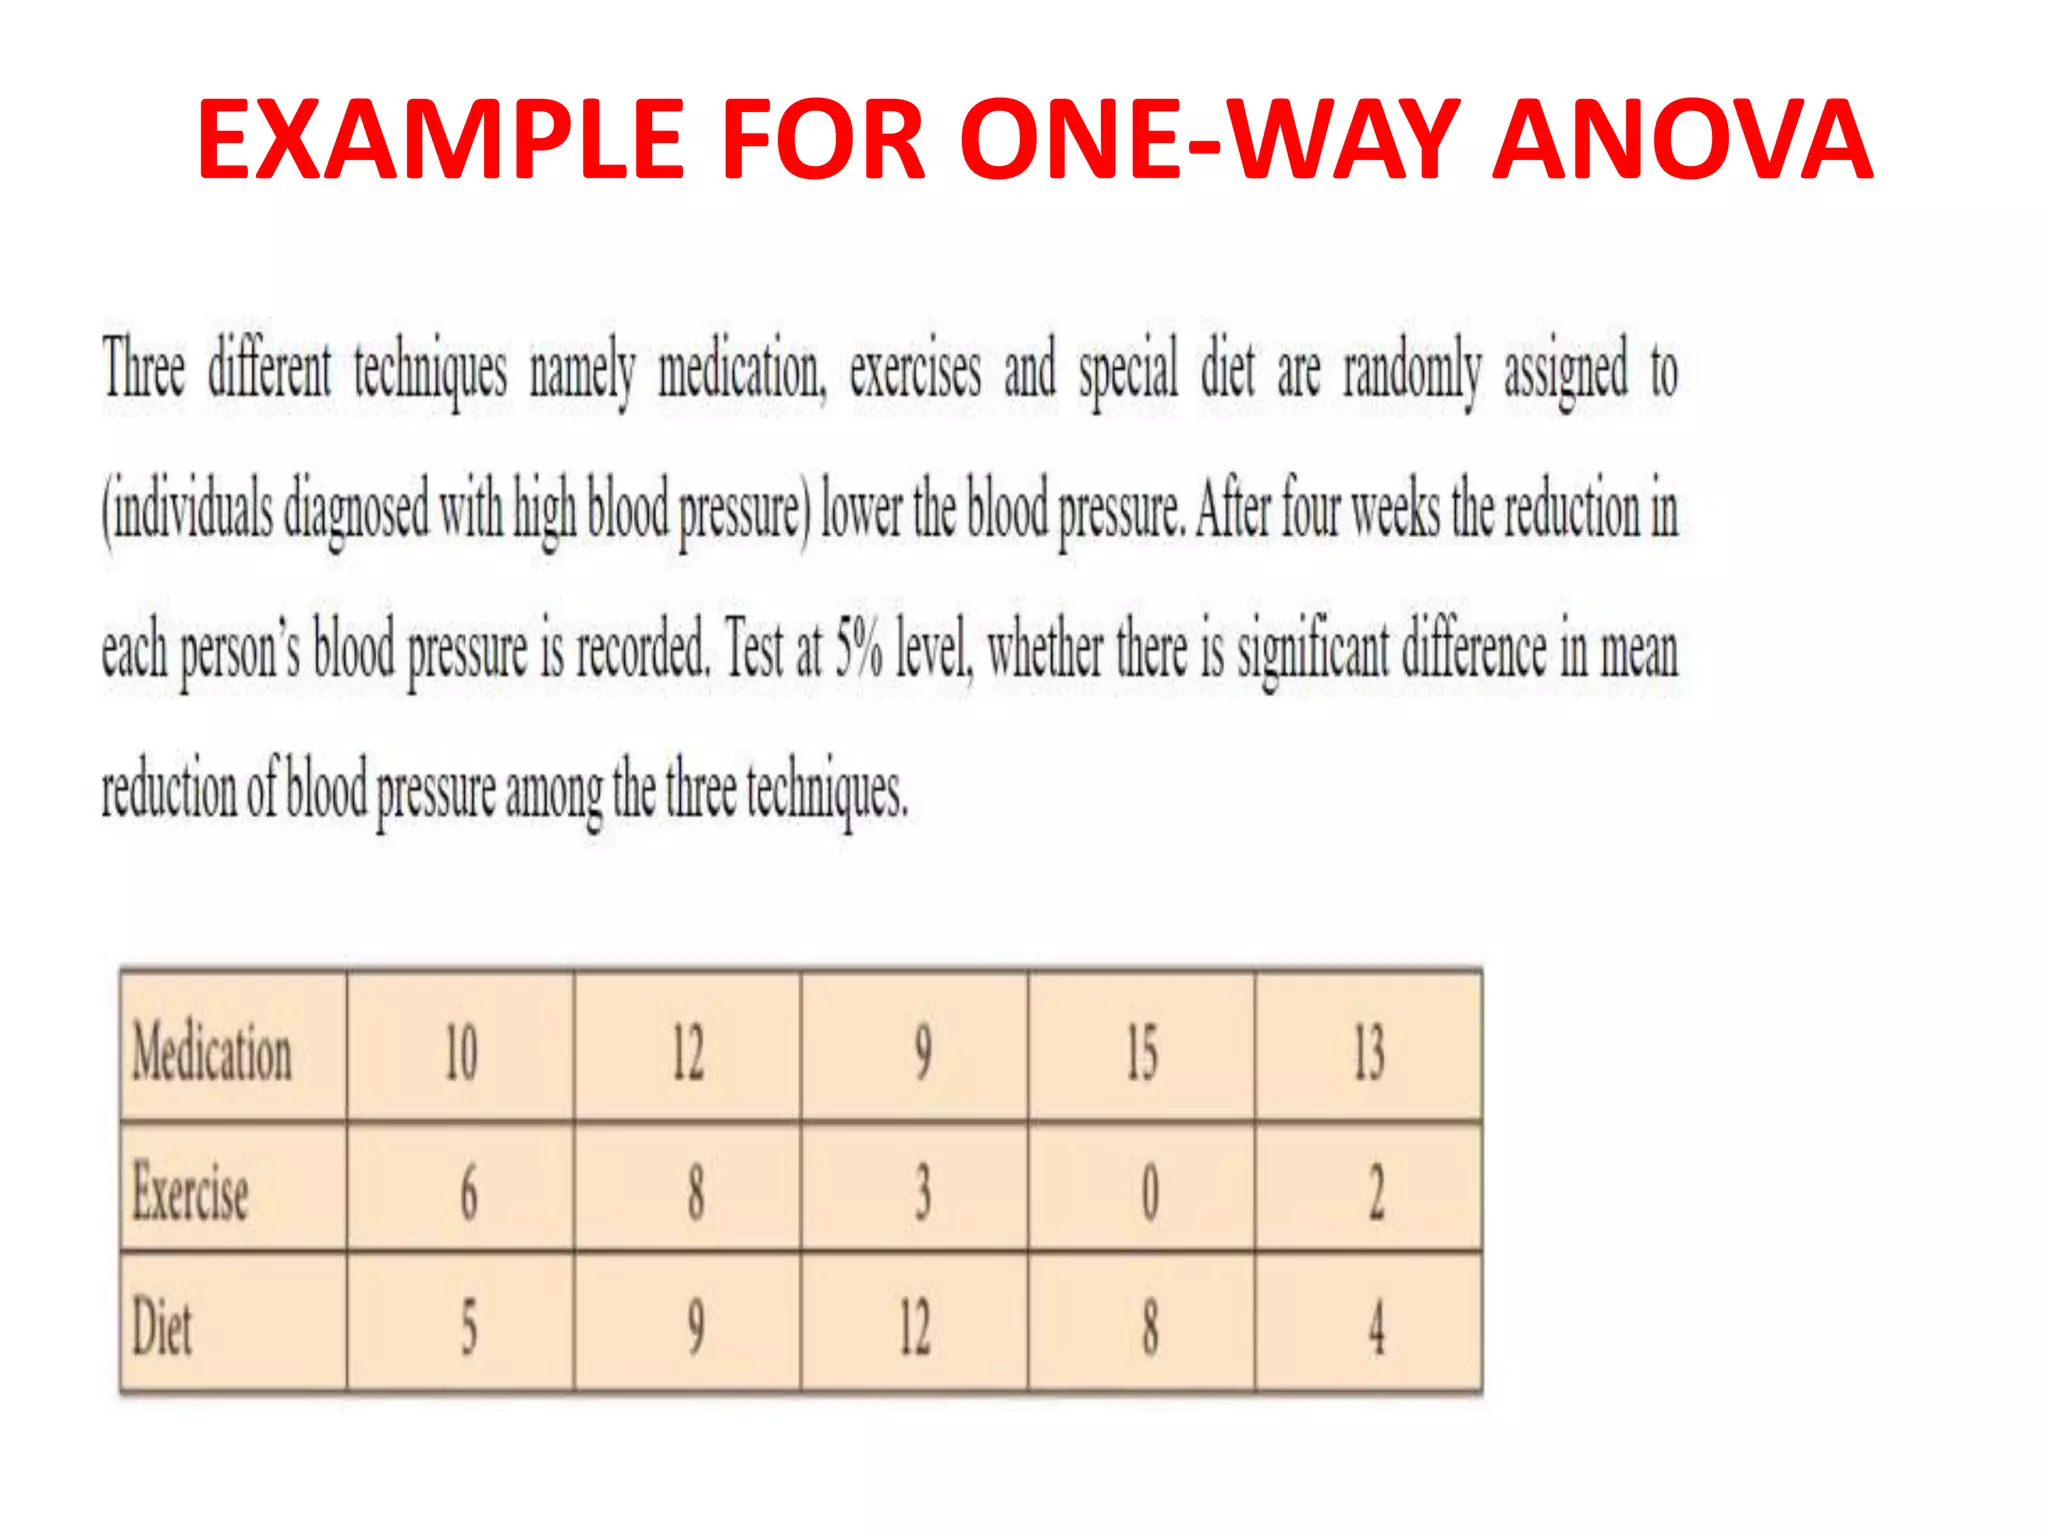
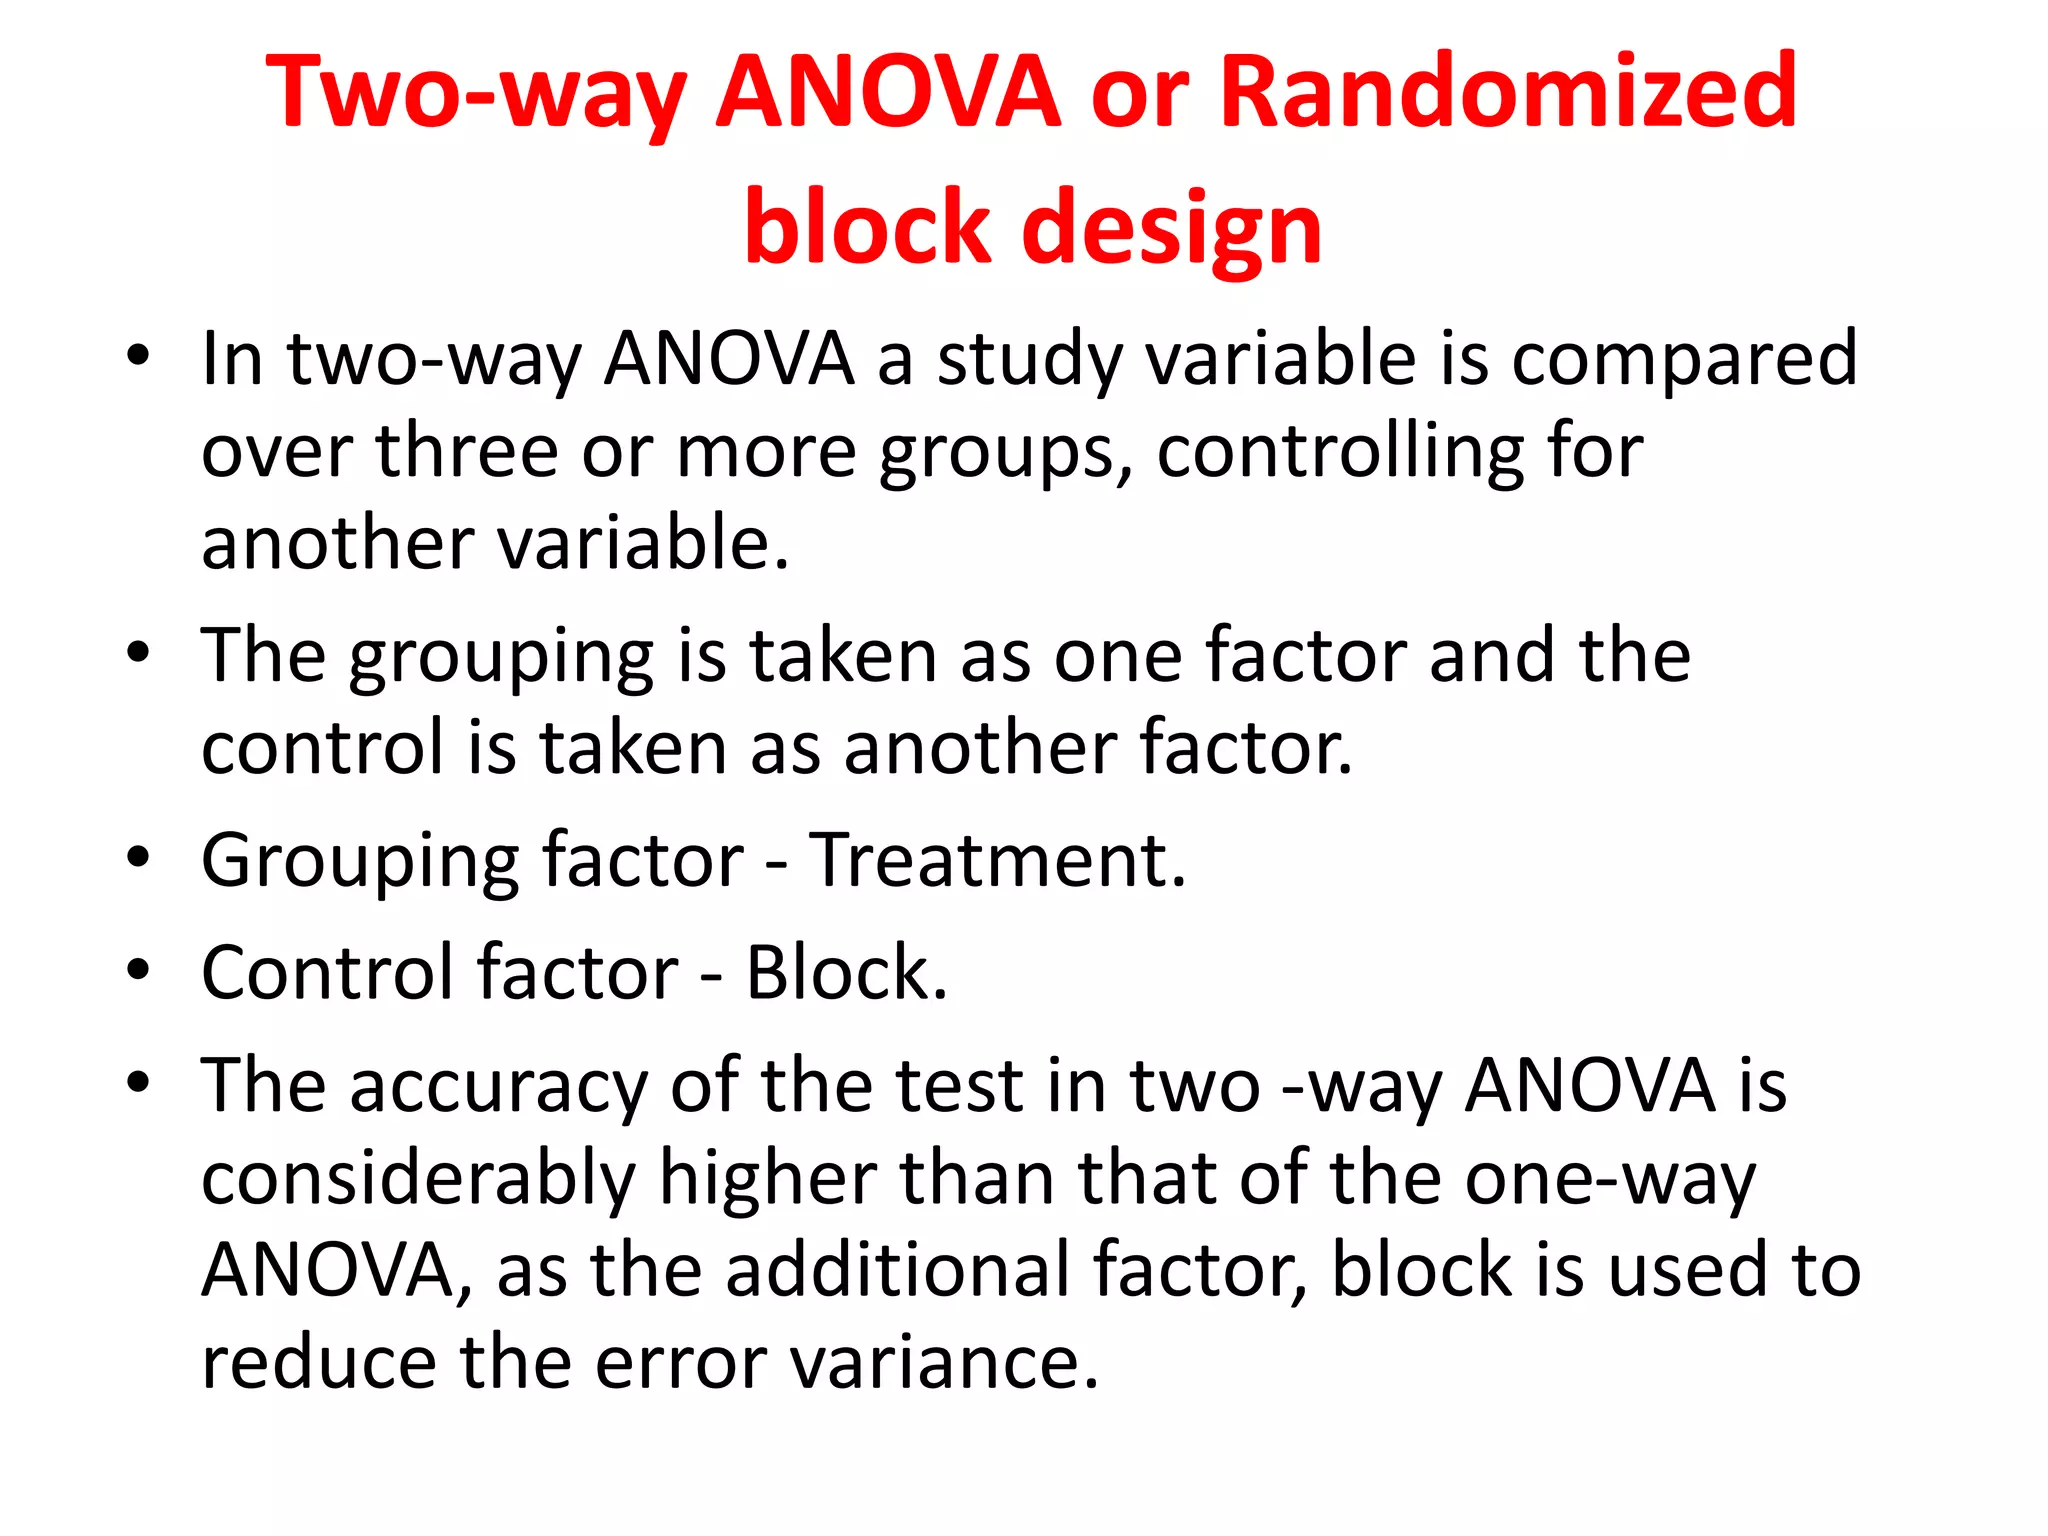
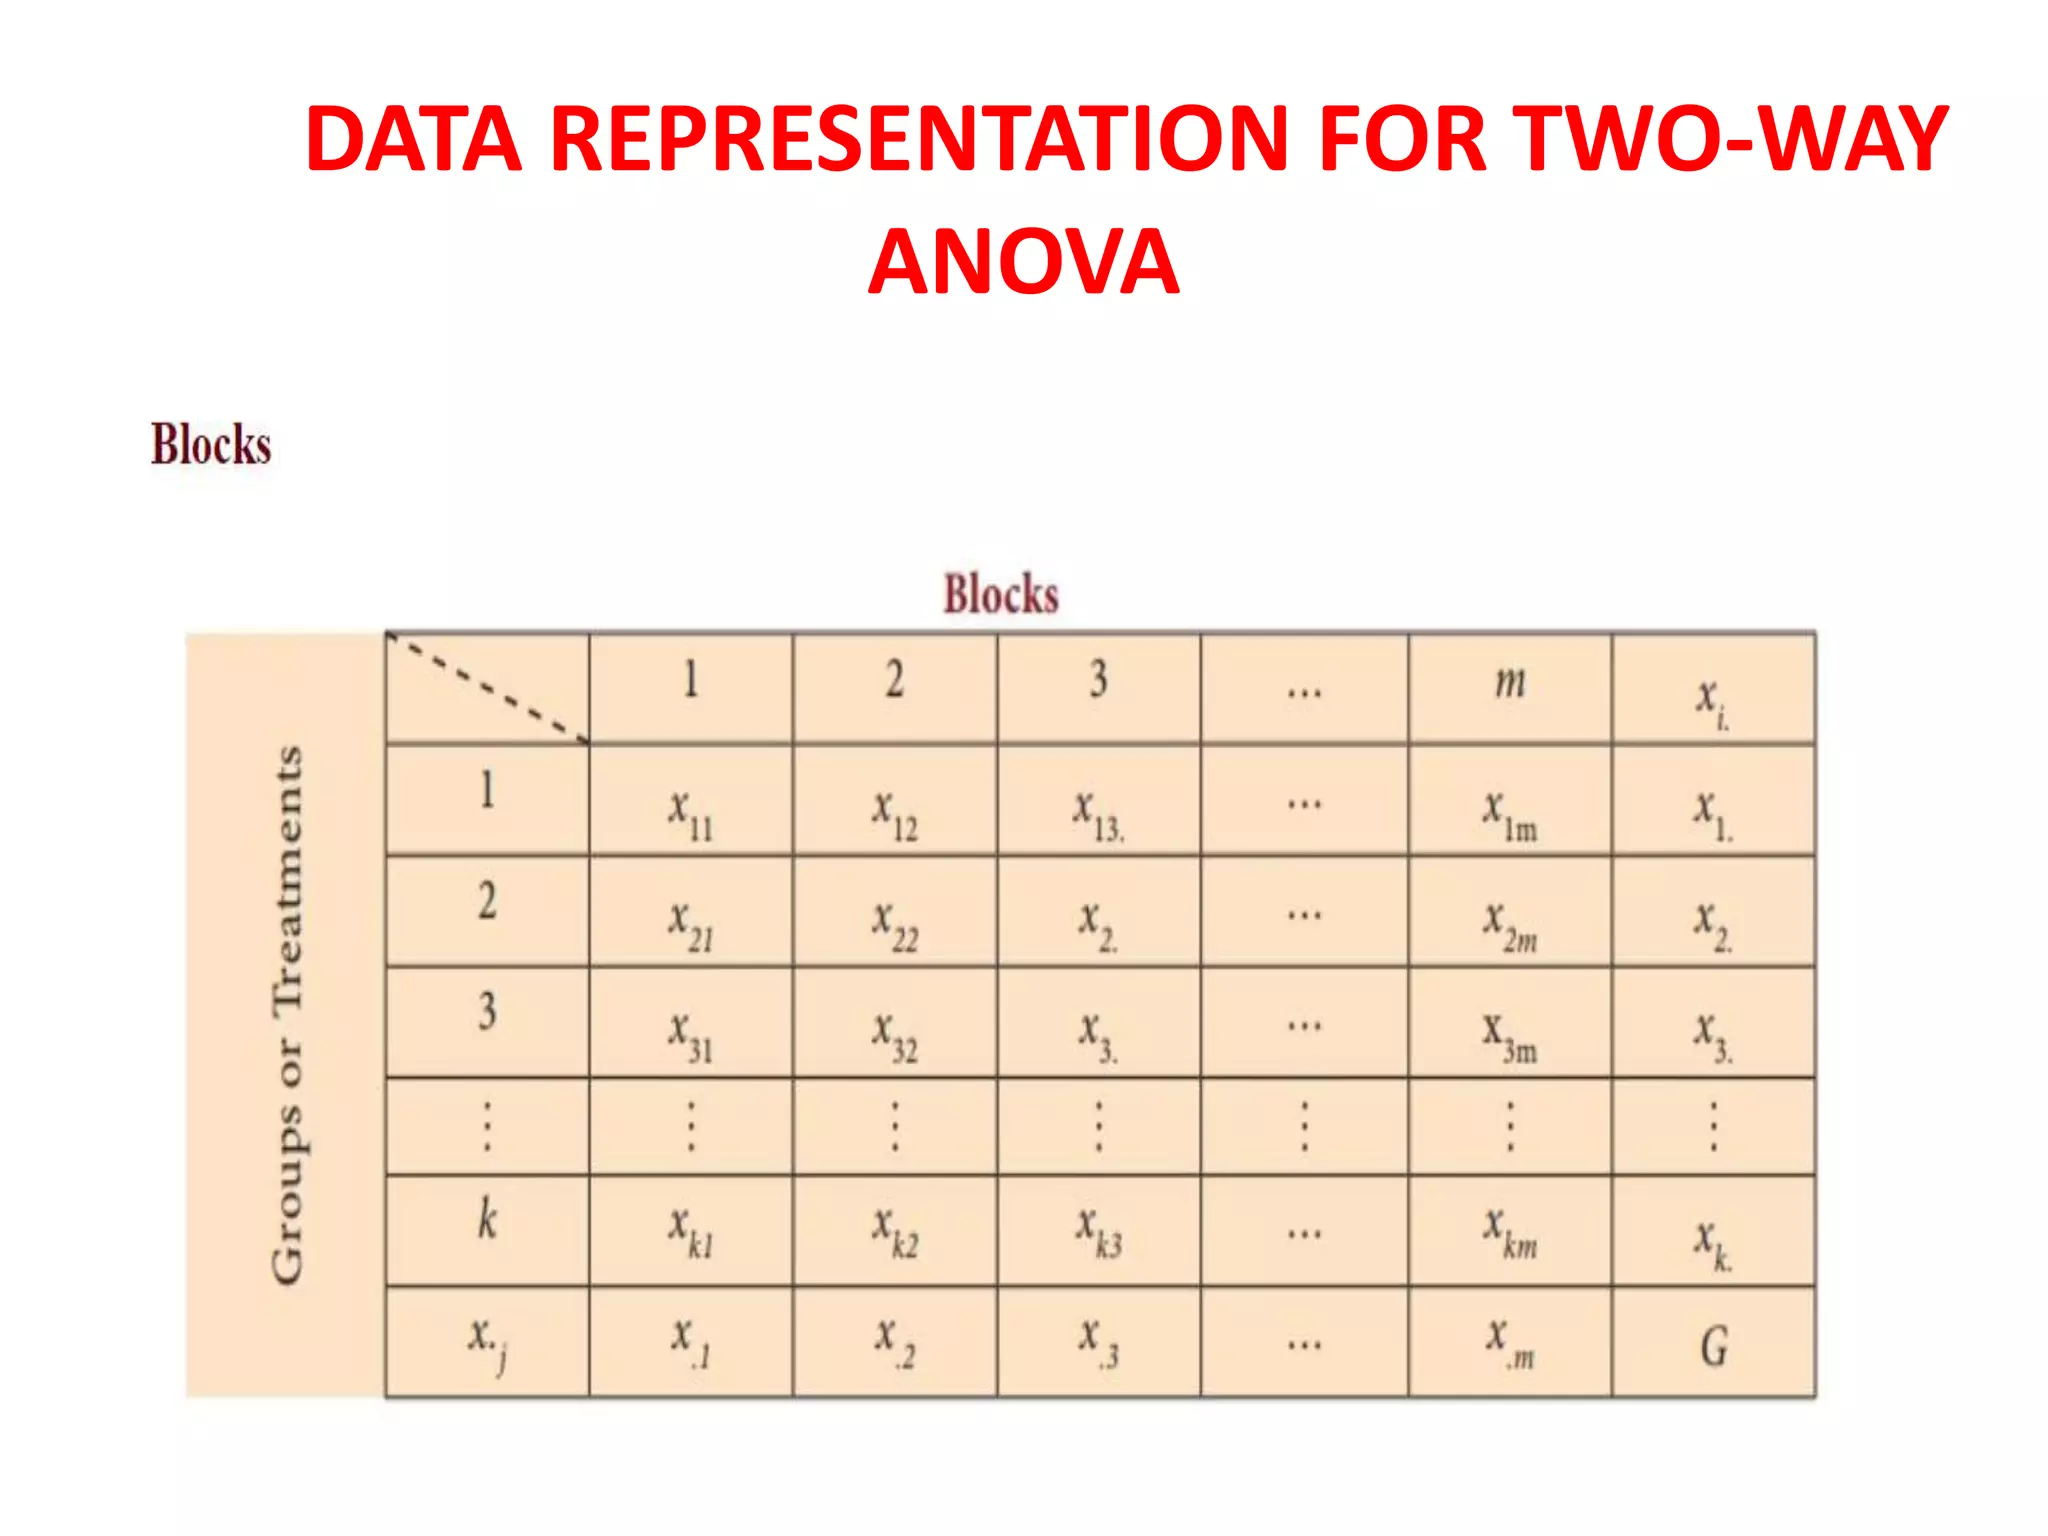
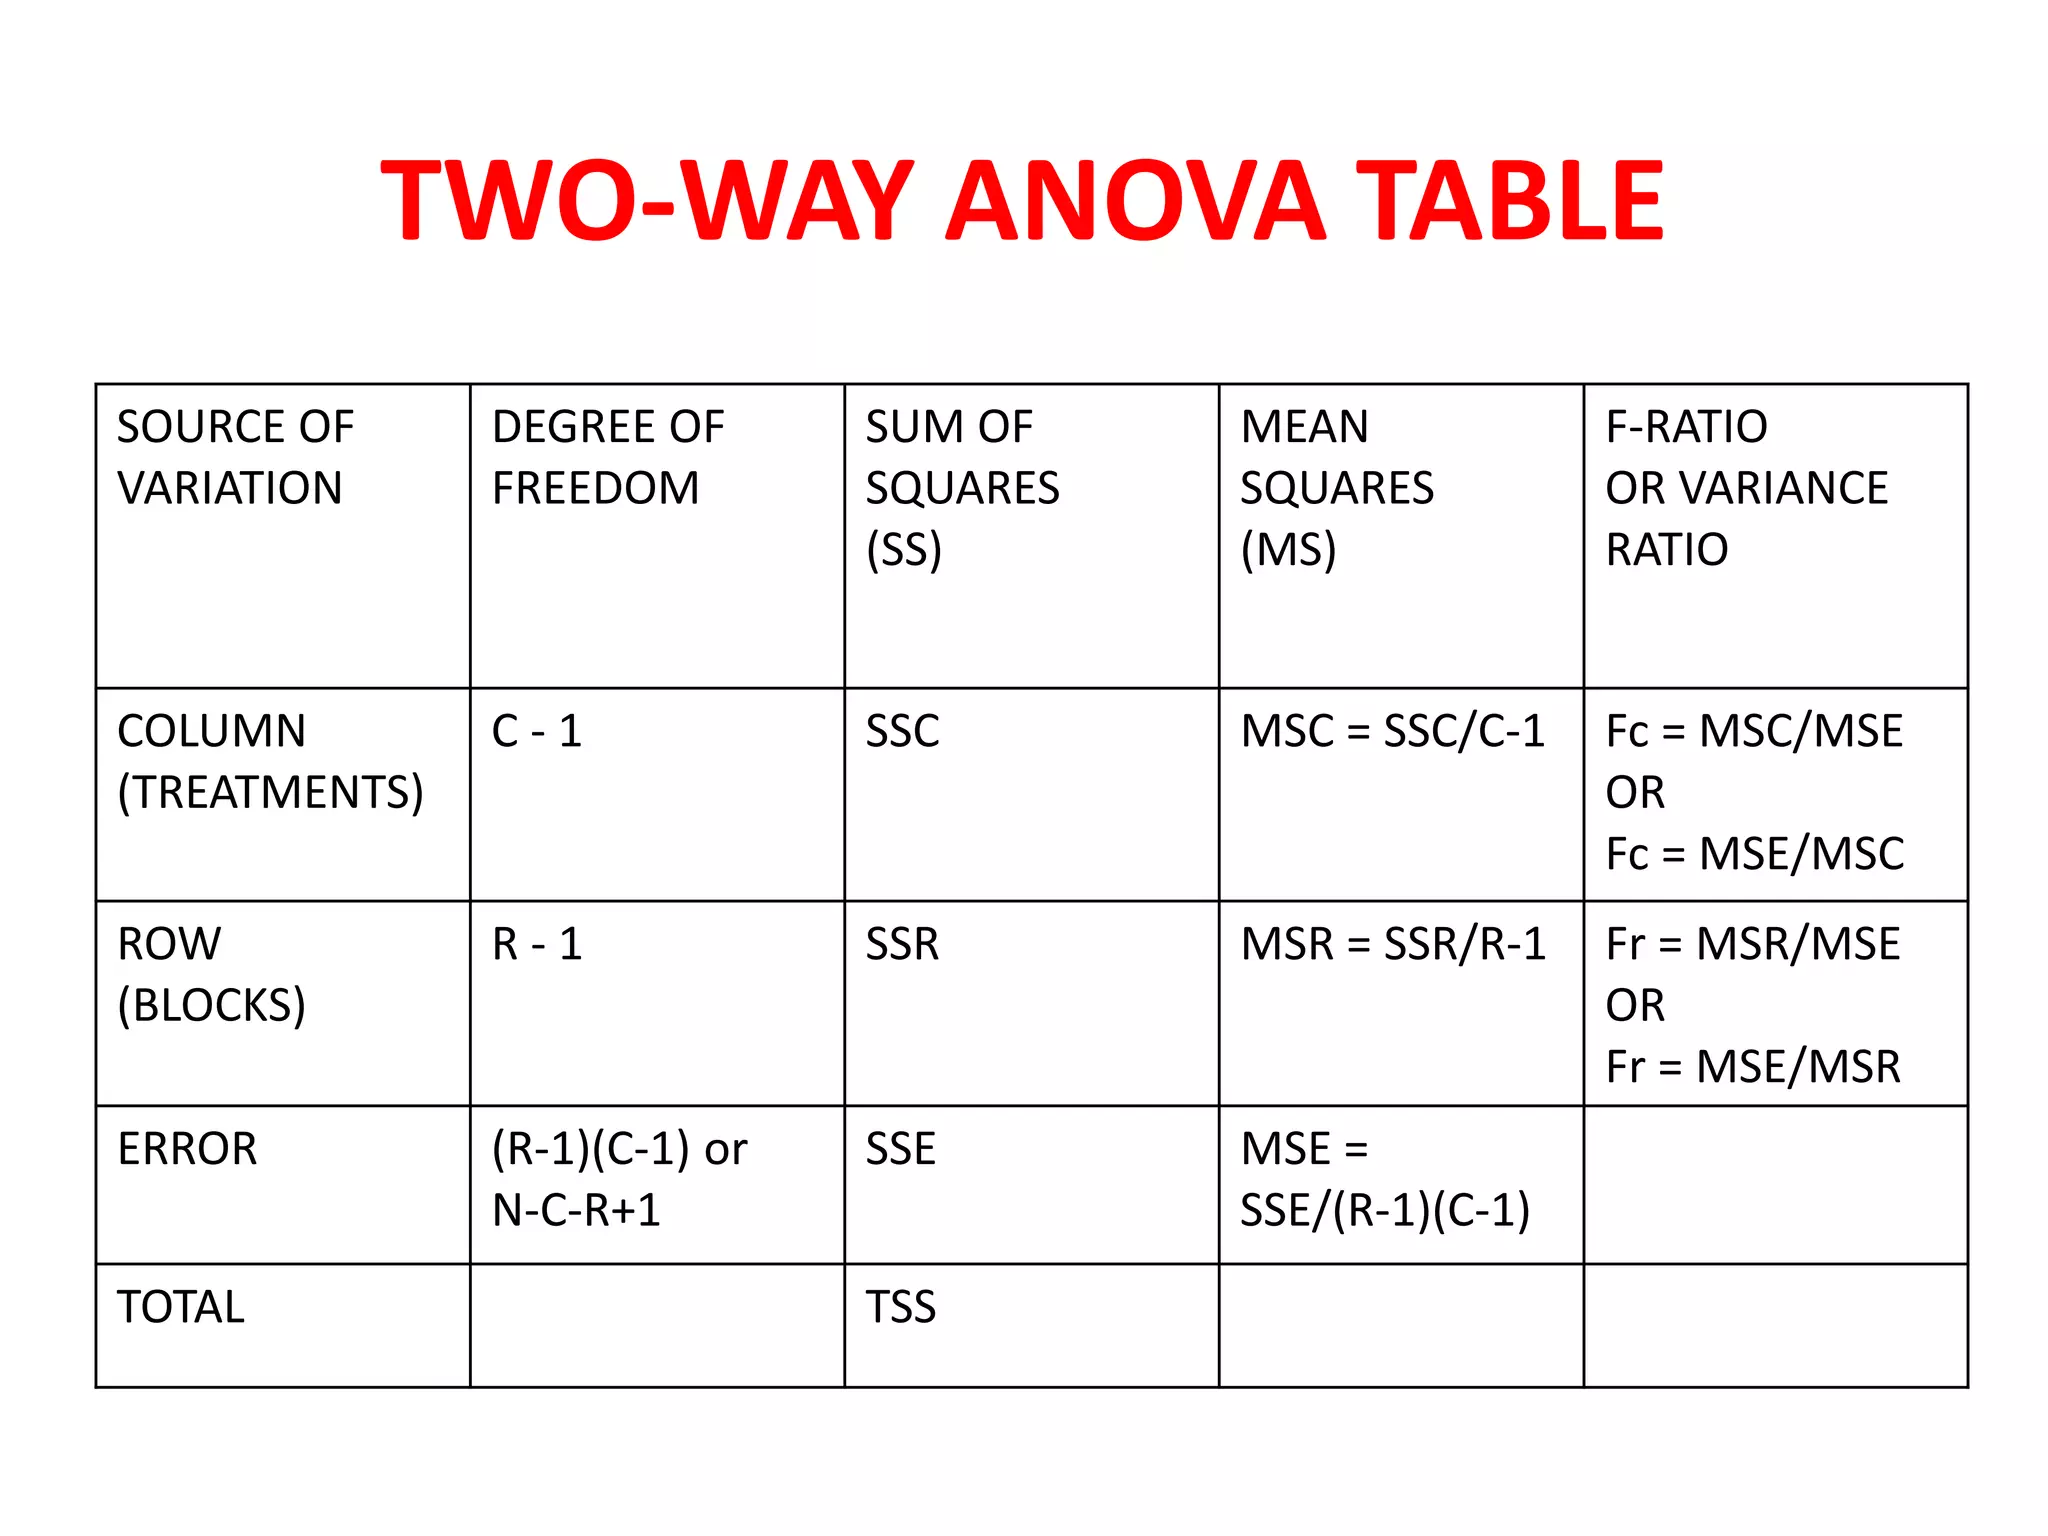
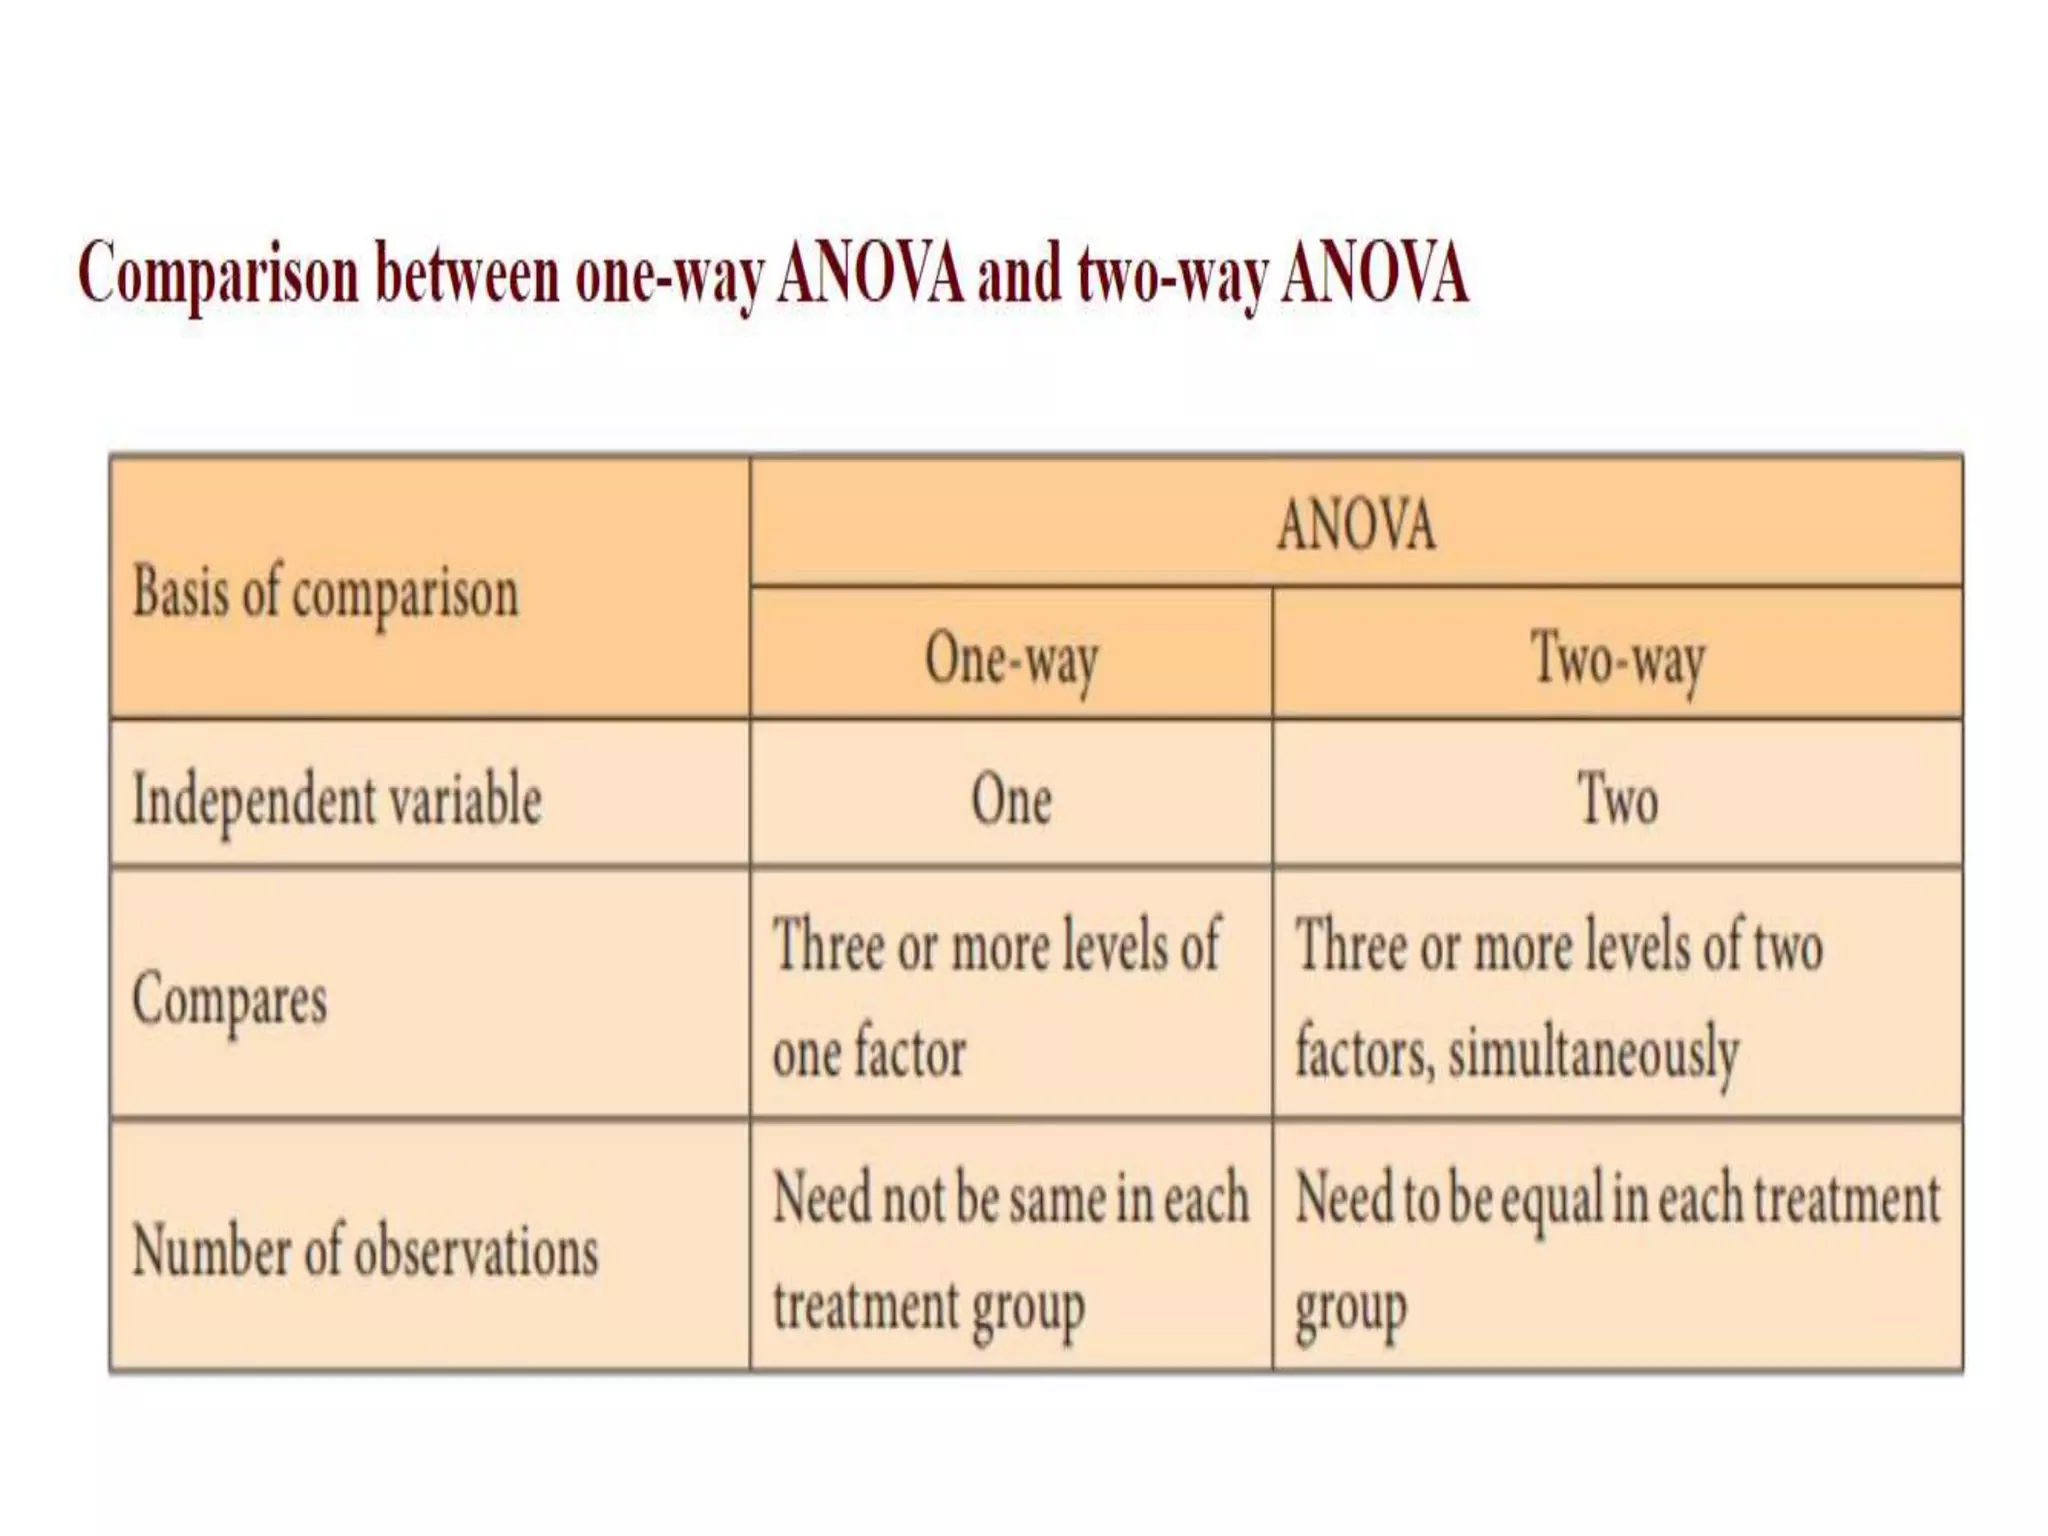
BIOINSTRUMENTATION AND
RESEARCH METHODOLOGY
UNIT IV – BIOSTATISTICS
TOPIC: ANOVA – ONE WAY & TWO WAY
ABARNA M P
II – M.Sc., BIOTECHNOLOGY
21PBT810
ANALYSIS OF VARIANCE (ANOVA)
• Powerful statistical tool for tests of significance.
• The test of significance using t-distribution is an
adequate procedure only for testing the
significance of the difference between two
sample means.
• When we have three or more samples to consider
at a time, an alternative procedure is needed for
testing the hypothesis that all the samples are
drawn from the same population i.e., they have
the same means.
• PURPOSE OF ANOVA: To test the homogeneity of
several means.
• ANOVA – A hypothesis testing procedure that is
used to evaluate the mean differences between
two or more treatments (or) populations.
• Invented by R.A. FISHER – Fisher’s ANOVA.
• Similar to t-test and z-test – used to compare
means and also the relative variance between
them.
• It is used to test the statistical significance of the
relationship between a dependent variable (Y)
and a single or multiple independent variable (X).
• Helps to figure out if the null hypothesis has to be
rejected or accepted.
TERMS USED IN ANOVA
• DEGREE OF FREEDOM (DF) – The number of
independent conclusions that can be drawn from
the data.
• SSfactor – It measures the variation of each group
mean to the overall mean across all groups.
• Sserror – It measures the variation of each
observation within each factor level to the mean
of the level.
• Main effect – The effect where the performance
of one variable considered in isolation by
neglecting other variables in the study.
• Interaction – This effect occurs where the effect of
one variable is different across levels of one or more
other variables.
• Mean square error (MSE) – Divide the sum of
squares of the residual error by the degrees of
freedom.
• F- test – The null hypothesis that the category means
are equal in the population is tested by F statistic
based on the ratio of mean square related to X and
MSE.
• P – value – It is the smallest level of significance that
would lead to rejection of the null hypothesis (H0).
ASSUMPTIONS FOR ANOVA TEST
• The observations follow normal distribution.
• The samples are independent.
• The population variances are equal and
unknown.
STEPS INVOLVED IN ANOVA
CALCULATION
• Establish the hypothesis.
• Find out the mean.
• Calculation of SStotal , Ssbetween and Sswithin
(SStotal - Ssbetween)
• ANOVA table
• Conclusion and Interpretation.
SOURCE OF
VARIATION
DEGREE OF
FREEDOM
SUM OF
SQUARES
(SS)
MEAN SQUARES
(MS)
F-RATIO
BETWEEN K - 1 SSbetween SSbetween / K-1 = MSbetween
WITHIN
(ERROR)
N - K SSwithin SSwithin/ N-K = MSwithin F = MSbetween
/MSwithin
TOTAL SStotal
ANOVA TABLE
EXAMPLE
• The following data represent the gain in
weight (in kg) of a species of edible fish
cultured in 4 diet formulations (D1, D2, D3
and D4) for a period of 3 months. Analyze
these data for significant difference among
the diet formulations in terms of gain in
weight.
D1 D2 D3 D4
4 8 5 1
5 7 7 4
1 9 8 1
3 6 6 3
2 10 9 1
TYPES OF ANOVA
• One-way ANOVA or Completely
randomized design
• Two-way ANOVA or Randomized block
design
• Three-way ANOVA or Latin square design
One-way ANOVA or Completely
randomized design
• The effect of one factor on the mean is tested.
• It is based on independent random samples drawn
from k – different levels of a factor, also called
treatments.
• The total variation in the observations can be split
into the following two components
• (i) variation between the levels or the variation due
to different bases of classification, commonly known
as treatments.
• (ii) The variation within the treatments i.e. inherent
variation among the observations within levels.
SOURCE OF
VARIATION
DEGREE OF
FREEDOM
SUM OF
SQUARES
(SS)
MEAN SQUARES
(MS)
F-RATIO
OR VARIANCE
RATIO
BETWEEN
COLUMNS
C - 1 SSC MSC = SSC / C-1
WITHIN
COLUMNS
(ERROR)
N - C SSE MSE = SSE / N-C F = MSC / MSE
OR
F = MSE / MSC
TOTAL TSS
ONE-WAY ANOVA TABLE
EXAMPLE FOR ONE-WAY ANOVA
Merits and Demerits of One-Way
ANOVA
• Merits
Layout is very simple and easy to
understand.
Gives maximum degrees of freedom for
error.
• Demerits
Population variances of experimental units
for different treatments need to be equal.
Verification of normality assumption may
be difficult.
Two-way ANOVA or Randomized
block design
• In two-way ANOVA a study variable is compared
over three or more groups, controlling for
another variable.
• The grouping is taken as one factor and the
control is taken as another factor.
• Grouping factor - Treatment.
• Control factor - Block.
• The accuracy of the test in two -way ANOVA is
considerably higher than that of the one-way
ANOVA, as the additional factor, block is used to
reduce the error variance.
• The total variation present in the
observations can be split into the following
three components:
• (i) The variation between treatments (groups)
• (ii) The variation between blocks.
• (ii) The variation inherent within a particular
setting or combination of treatment and
block.
DATA REPRESENTATION FOR TWO-WAY
ANOVA
SOURCE OF
VARIATION
DEGREE OF
FREEDOM
SUM OF
SQUARES
(SS)
MEAN
SQUARES
(MS)
F-RATIO
OR VARIANCE
RATIO
COLUMN
(TREATMENTS)
C - 1 SSC MSC = SSC/C-1 Fc = MSC/MSE
OR
Fc = MSE/MSC
ROW
(BLOCKS)
R - 1 SSR MSR = SSR/R-1 Fr = MSR/MSE
OR
Fr = MSE/MSR
ERROR (R-1)(C-1) or
N-C-R+1
SSE MSE =
SSE/(R-1)(C-1)
TOTAL TSS
TWO-WAY ANOVA TABLE
EXAMPLE FOR TWO-WAY ANOVA
Merits and Demerits of two-way
ANOVA
• Merits
Any number of blocks and treatments can be used.
Number of units in each block should be equal.
It is the most used design in view of the smaller total
sample size since we are studying two variable at a
time.
• Demerits
If the number of treatments is large enough, then it
becomes difficult to maintain the homogeneity of
the blocks.
If there is a missing value, it cannot be ignored. It
has to be replaced with some function of the existing
values and certain adjustments have to be made in
the analysis. This makes the analysis slightly complex.
THANK YOU

Anova - One way and two way

  • 1.
    BIOINSTRUMENTATION AND RESEARCH METHODOLOGY UNITIV – BIOSTATISTICS TOPIC: ANOVA – ONE WAY & TWO WAY ABARNA M P II – M.Sc., BIOTECHNOLOGY 21PBT810
  • 2.
    ANALYSIS OF VARIANCE(ANOVA) • Powerful statistical tool for tests of significance. • The test of significance using t-distribution is an adequate procedure only for testing the significance of the difference between two sample means. • When we have three or more samples to consider at a time, an alternative procedure is needed for testing the hypothesis that all the samples are drawn from the same population i.e., they have the same means. • PURPOSE OF ANOVA: To test the homogeneity of several means.
  • 3.
    • ANOVA –A hypothesis testing procedure that is used to evaluate the mean differences between two or more treatments (or) populations. • Invented by R.A. FISHER – Fisher’s ANOVA. • Similar to t-test and z-test – used to compare means and also the relative variance between them. • It is used to test the statistical significance of the relationship between a dependent variable (Y) and a single or multiple independent variable (X). • Helps to figure out if the null hypothesis has to be rejected or accepted.
  • 4.
    TERMS USED INANOVA • DEGREE OF FREEDOM (DF) – The number of independent conclusions that can be drawn from the data. • SSfactor – It measures the variation of each group mean to the overall mean across all groups. • Sserror – It measures the variation of each observation within each factor level to the mean of the level. • Main effect – The effect where the performance of one variable considered in isolation by neglecting other variables in the study.
  • 5.
    • Interaction –This effect occurs where the effect of one variable is different across levels of one or more other variables. • Mean square error (MSE) – Divide the sum of squares of the residual error by the degrees of freedom. • F- test – The null hypothesis that the category means are equal in the population is tested by F statistic based on the ratio of mean square related to X and MSE. • P – value – It is the smallest level of significance that would lead to rejection of the null hypothesis (H0).
  • 6.
    ASSUMPTIONS FOR ANOVATEST • The observations follow normal distribution. • The samples are independent. • The population variances are equal and unknown.
  • 7.
    STEPS INVOLVED INANOVA CALCULATION • Establish the hypothesis. • Find out the mean. • Calculation of SStotal , Ssbetween and Sswithin (SStotal - Ssbetween) • ANOVA table • Conclusion and Interpretation.
  • 8.
    SOURCE OF VARIATION DEGREE OF FREEDOM SUMOF SQUARES (SS) MEAN SQUARES (MS) F-RATIO BETWEEN K - 1 SSbetween SSbetween / K-1 = MSbetween WITHIN (ERROR) N - K SSwithin SSwithin/ N-K = MSwithin F = MSbetween /MSwithin TOTAL SStotal ANOVA TABLE
  • 9.
    EXAMPLE • The followingdata represent the gain in weight (in kg) of a species of edible fish cultured in 4 diet formulations (D1, D2, D3 and D4) for a period of 3 months. Analyze these data for significant difference among the diet formulations in terms of gain in weight. D1 D2 D3 D4 4 8 5 1 5 7 7 4 1 9 8 1 3 6 6 3 2 10 9 1
  • 10.
    TYPES OF ANOVA •One-way ANOVA or Completely randomized design • Two-way ANOVA or Randomized block design • Three-way ANOVA or Latin square design
  • 11.
    One-way ANOVA orCompletely randomized design • The effect of one factor on the mean is tested. • It is based on independent random samples drawn from k – different levels of a factor, also called treatments. • The total variation in the observations can be split into the following two components • (i) variation between the levels or the variation due to different bases of classification, commonly known as treatments. • (ii) The variation within the treatments i.e. inherent variation among the observations within levels.
  • 13.
    SOURCE OF VARIATION DEGREE OF FREEDOM SUMOF SQUARES (SS) MEAN SQUARES (MS) F-RATIO OR VARIANCE RATIO BETWEEN COLUMNS C - 1 SSC MSC = SSC / C-1 WITHIN COLUMNS (ERROR) N - C SSE MSE = SSE / N-C F = MSC / MSE OR F = MSE / MSC TOTAL TSS ONE-WAY ANOVA TABLE
  • 14.
  • 15.
    Merits and Demeritsof One-Way ANOVA • Merits Layout is very simple and easy to understand. Gives maximum degrees of freedom for error. • Demerits Population variances of experimental units for different treatments need to be equal. Verification of normality assumption may be difficult.
  • 16.
    Two-way ANOVA orRandomized block design • In two-way ANOVA a study variable is compared over three or more groups, controlling for another variable. • The grouping is taken as one factor and the control is taken as another factor. • Grouping factor - Treatment. • Control factor - Block. • The accuracy of the test in two -way ANOVA is considerably higher than that of the one-way ANOVA, as the additional factor, block is used to reduce the error variance.
  • 17.
    • The totalvariation present in the observations can be split into the following three components: • (i) The variation between treatments (groups) • (ii) The variation between blocks. • (ii) The variation inherent within a particular setting or combination of treatment and block.
  • 18.
  • 19.
    SOURCE OF VARIATION DEGREE OF FREEDOM SUMOF SQUARES (SS) MEAN SQUARES (MS) F-RATIO OR VARIANCE RATIO COLUMN (TREATMENTS) C - 1 SSC MSC = SSC/C-1 Fc = MSC/MSE OR Fc = MSE/MSC ROW (BLOCKS) R - 1 SSR MSR = SSR/R-1 Fr = MSR/MSE OR Fr = MSE/MSR ERROR (R-1)(C-1) or N-C-R+1 SSE MSE = SSE/(R-1)(C-1) TOTAL TSS TWO-WAY ANOVA TABLE
  • 20.
  • 21.
    Merits and Demeritsof two-way ANOVA • Merits Any number of blocks and treatments can be used. Number of units in each block should be equal. It is the most used design in view of the smaller total sample size since we are studying two variable at a time. • Demerits If the number of treatments is large enough, then it becomes difficult to maintain the homogeneity of the blocks. If there is a missing value, it cannot be ignored. It has to be replaced with some function of the existing values and certain adjustments have to be made in the analysis. This makes the analysis slightly complex.
  • 23.