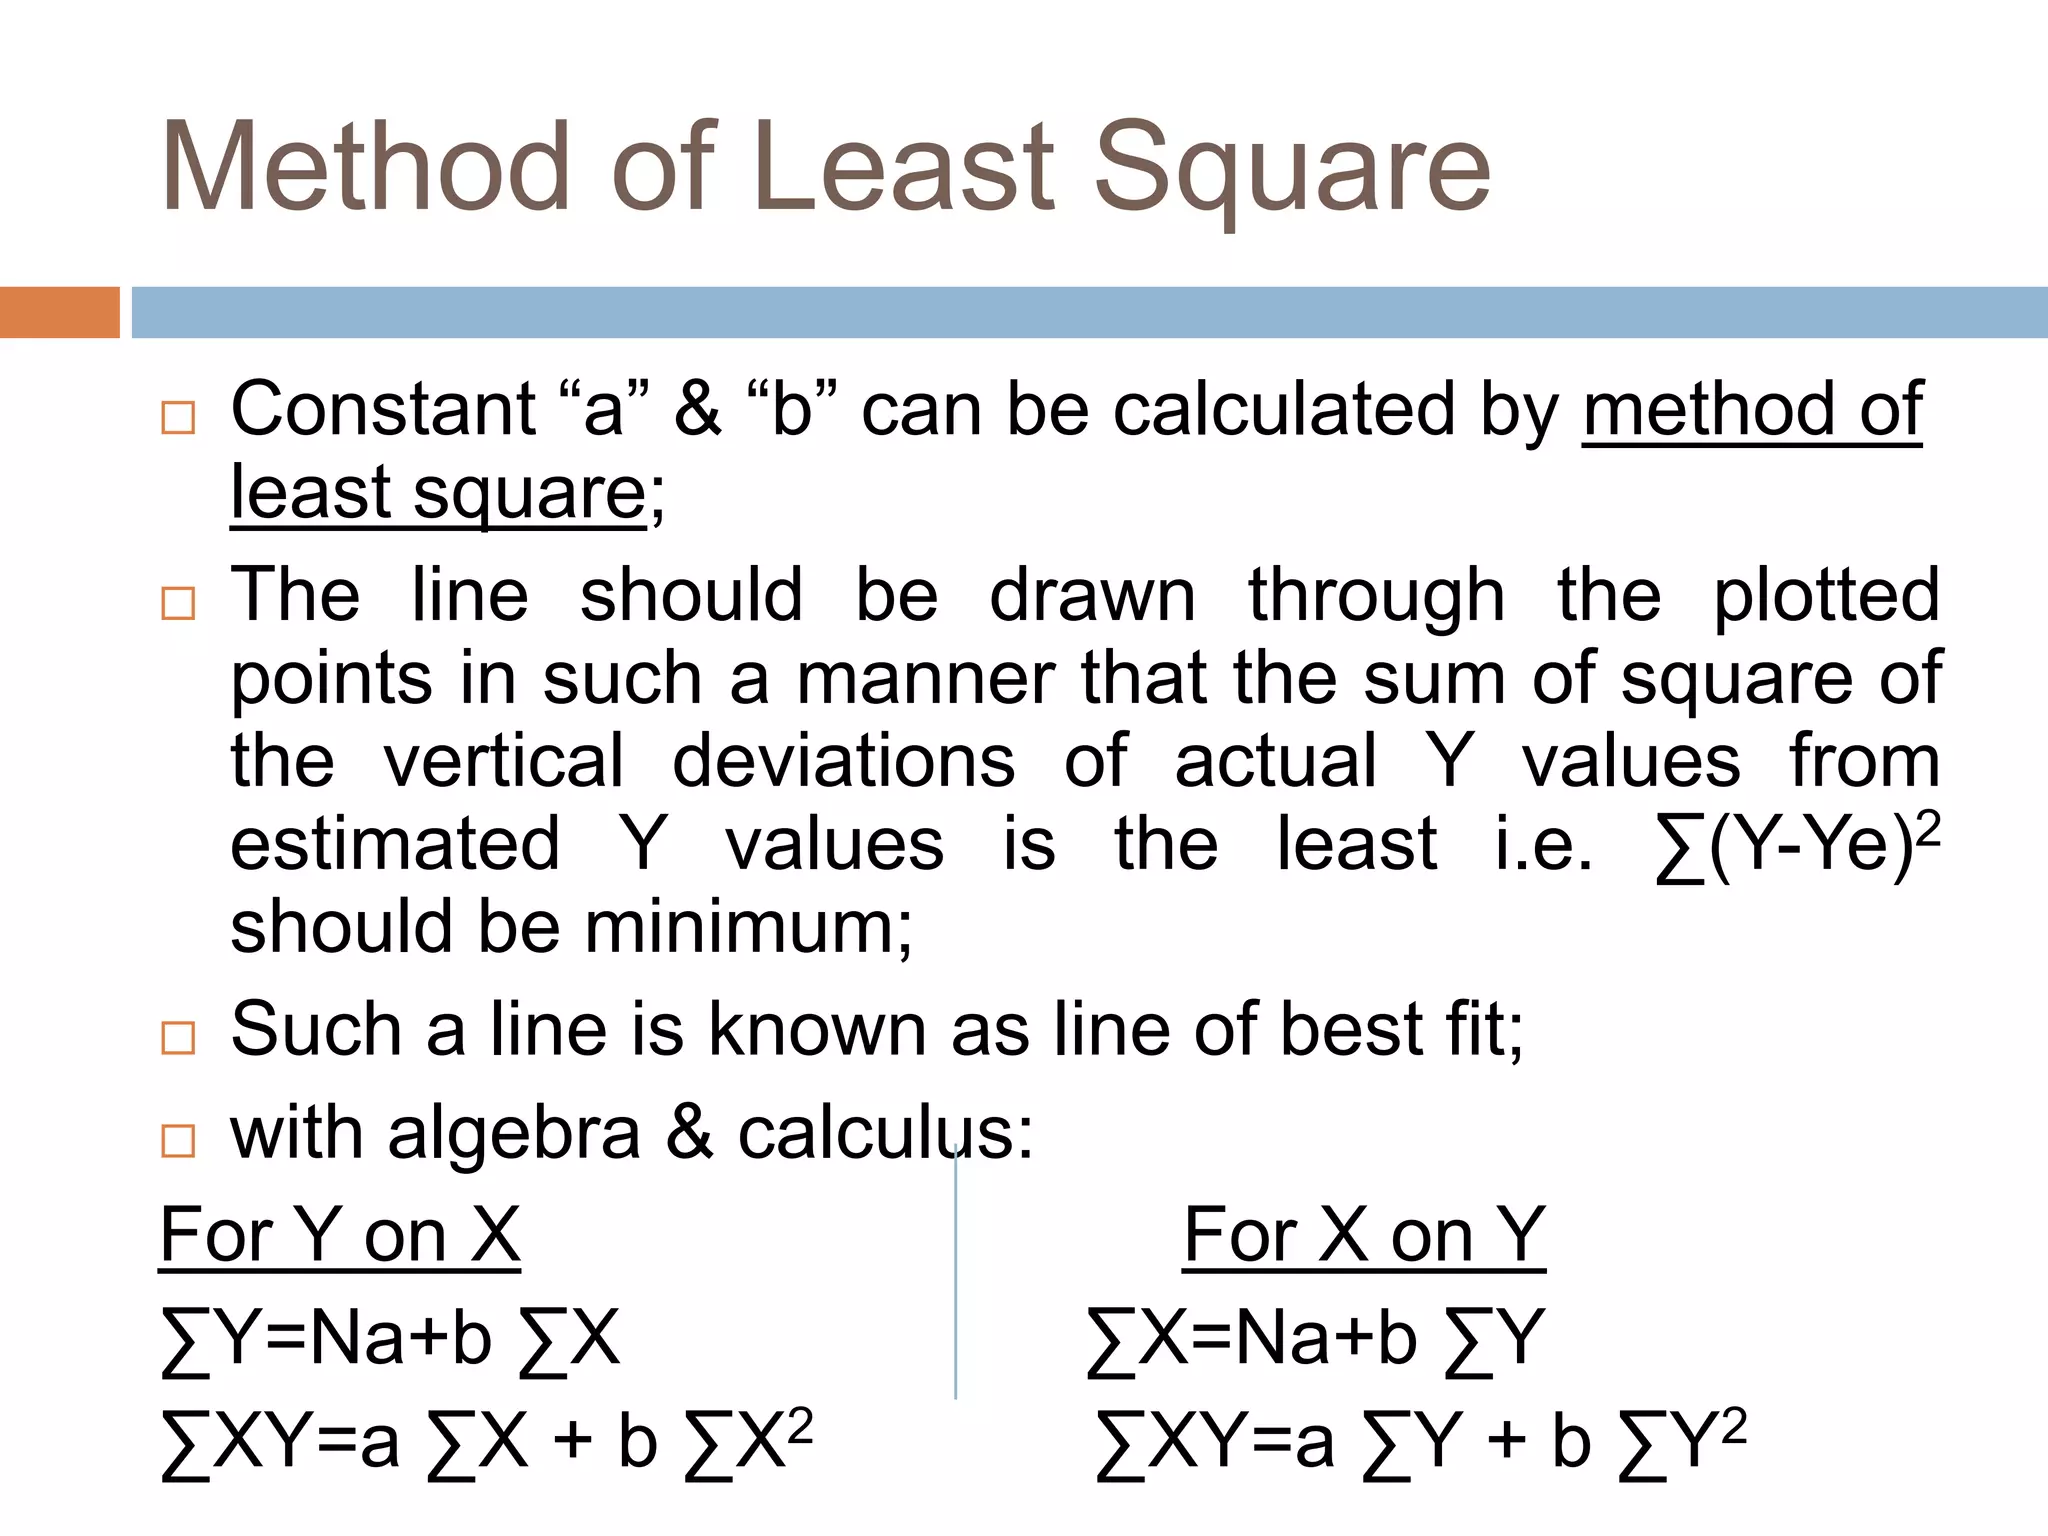
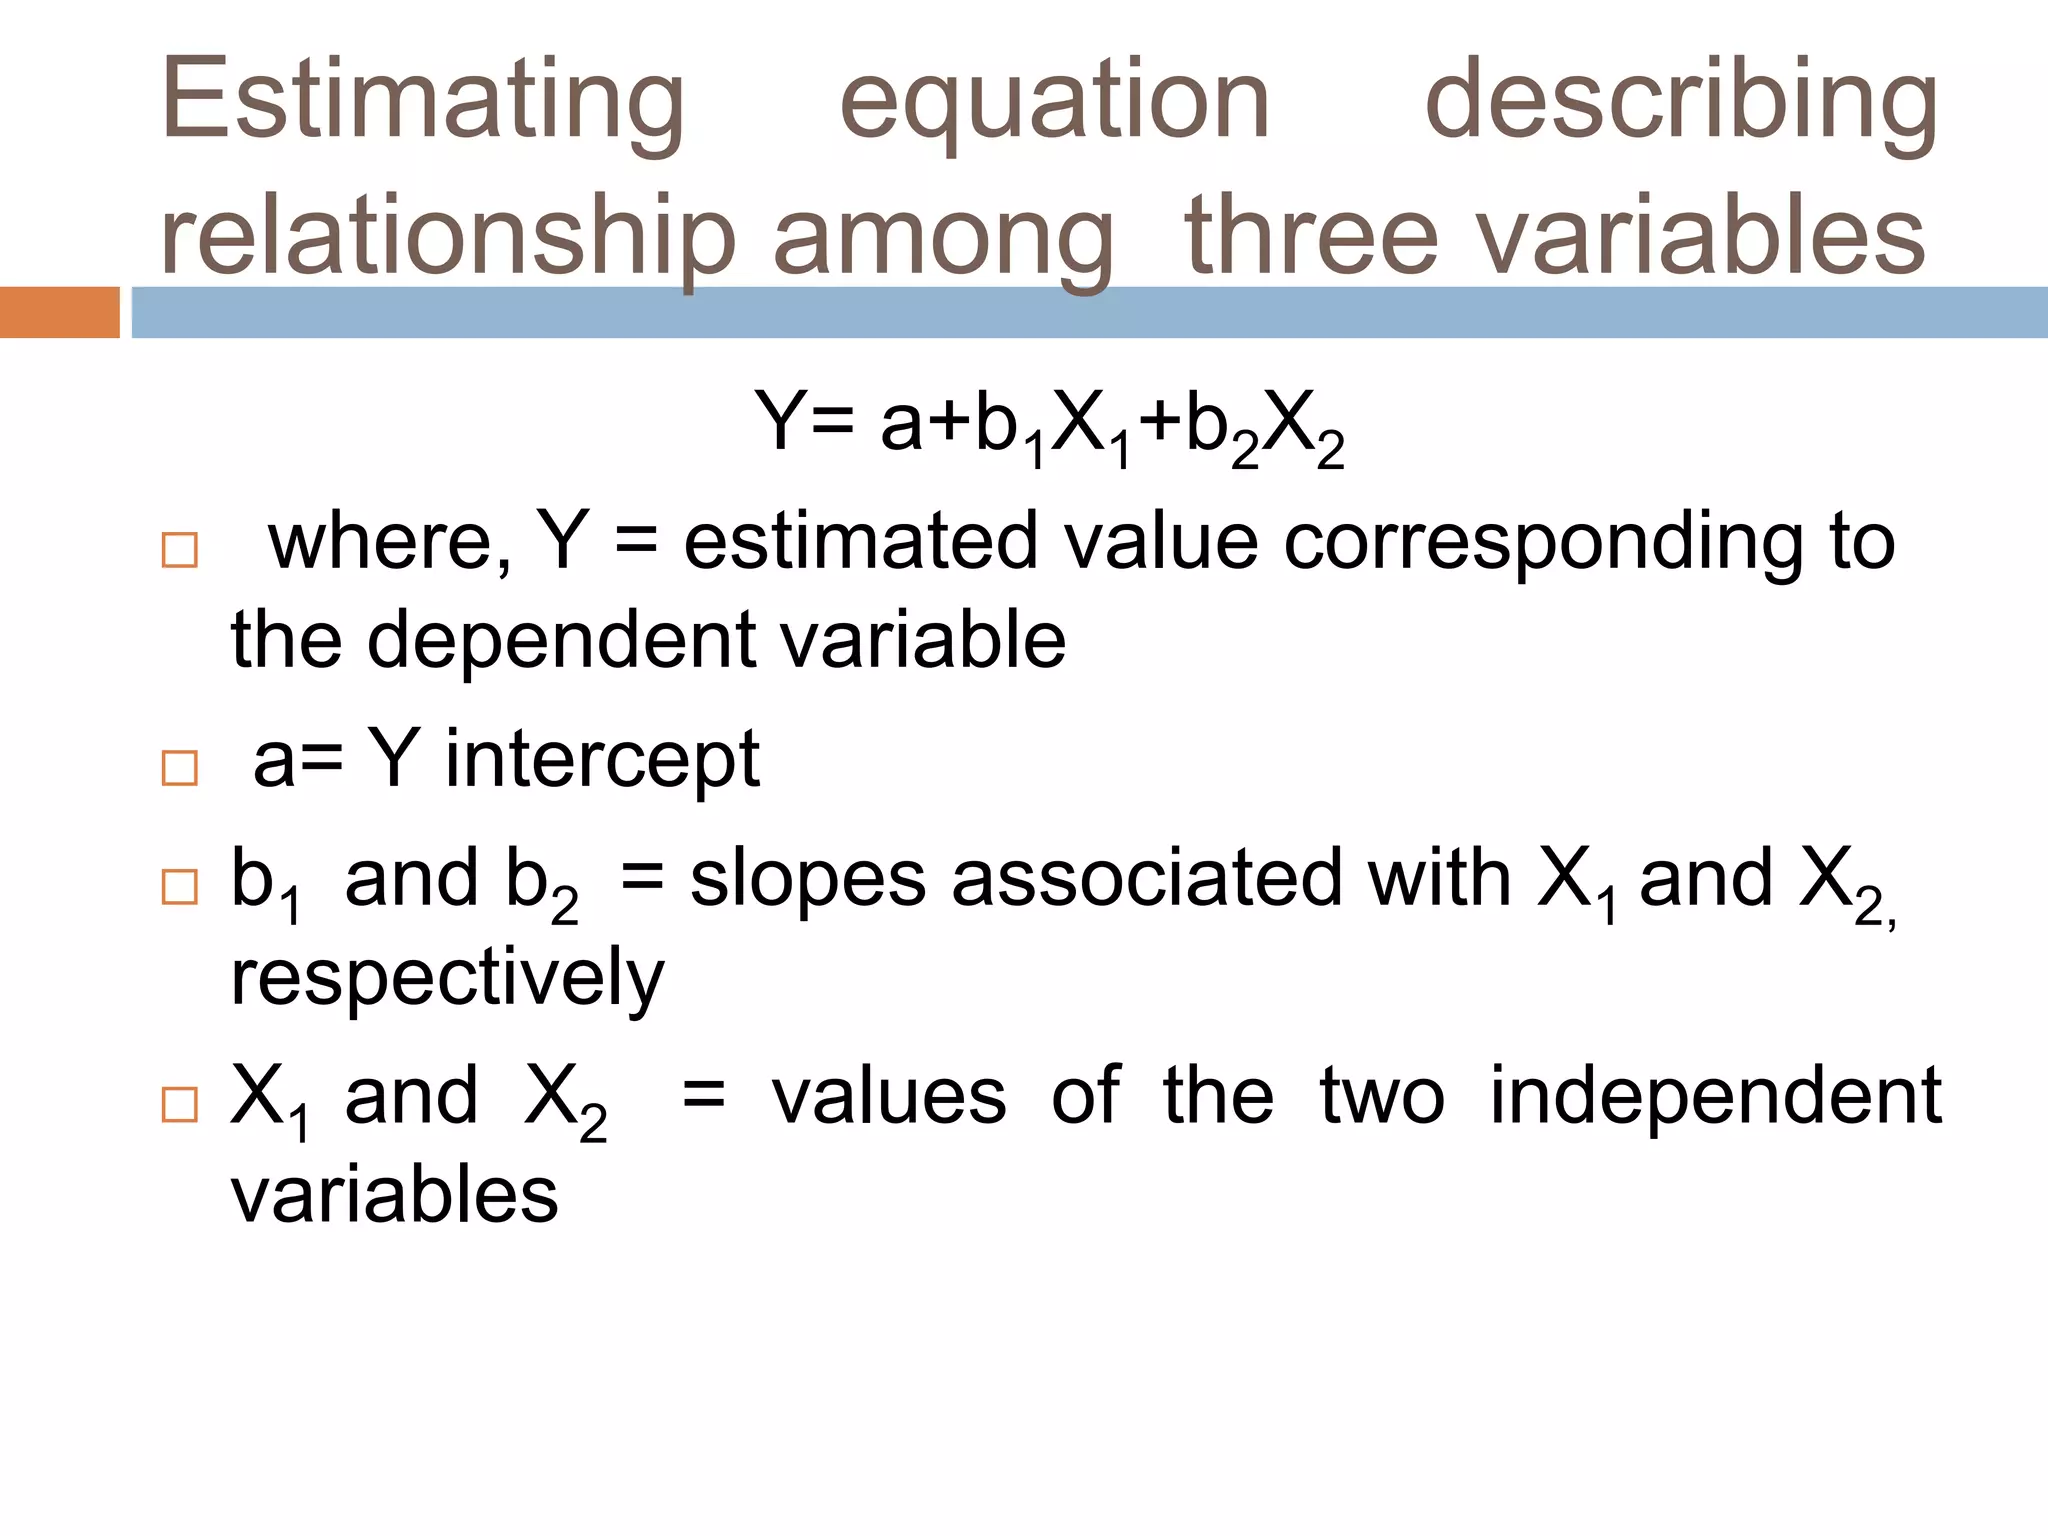
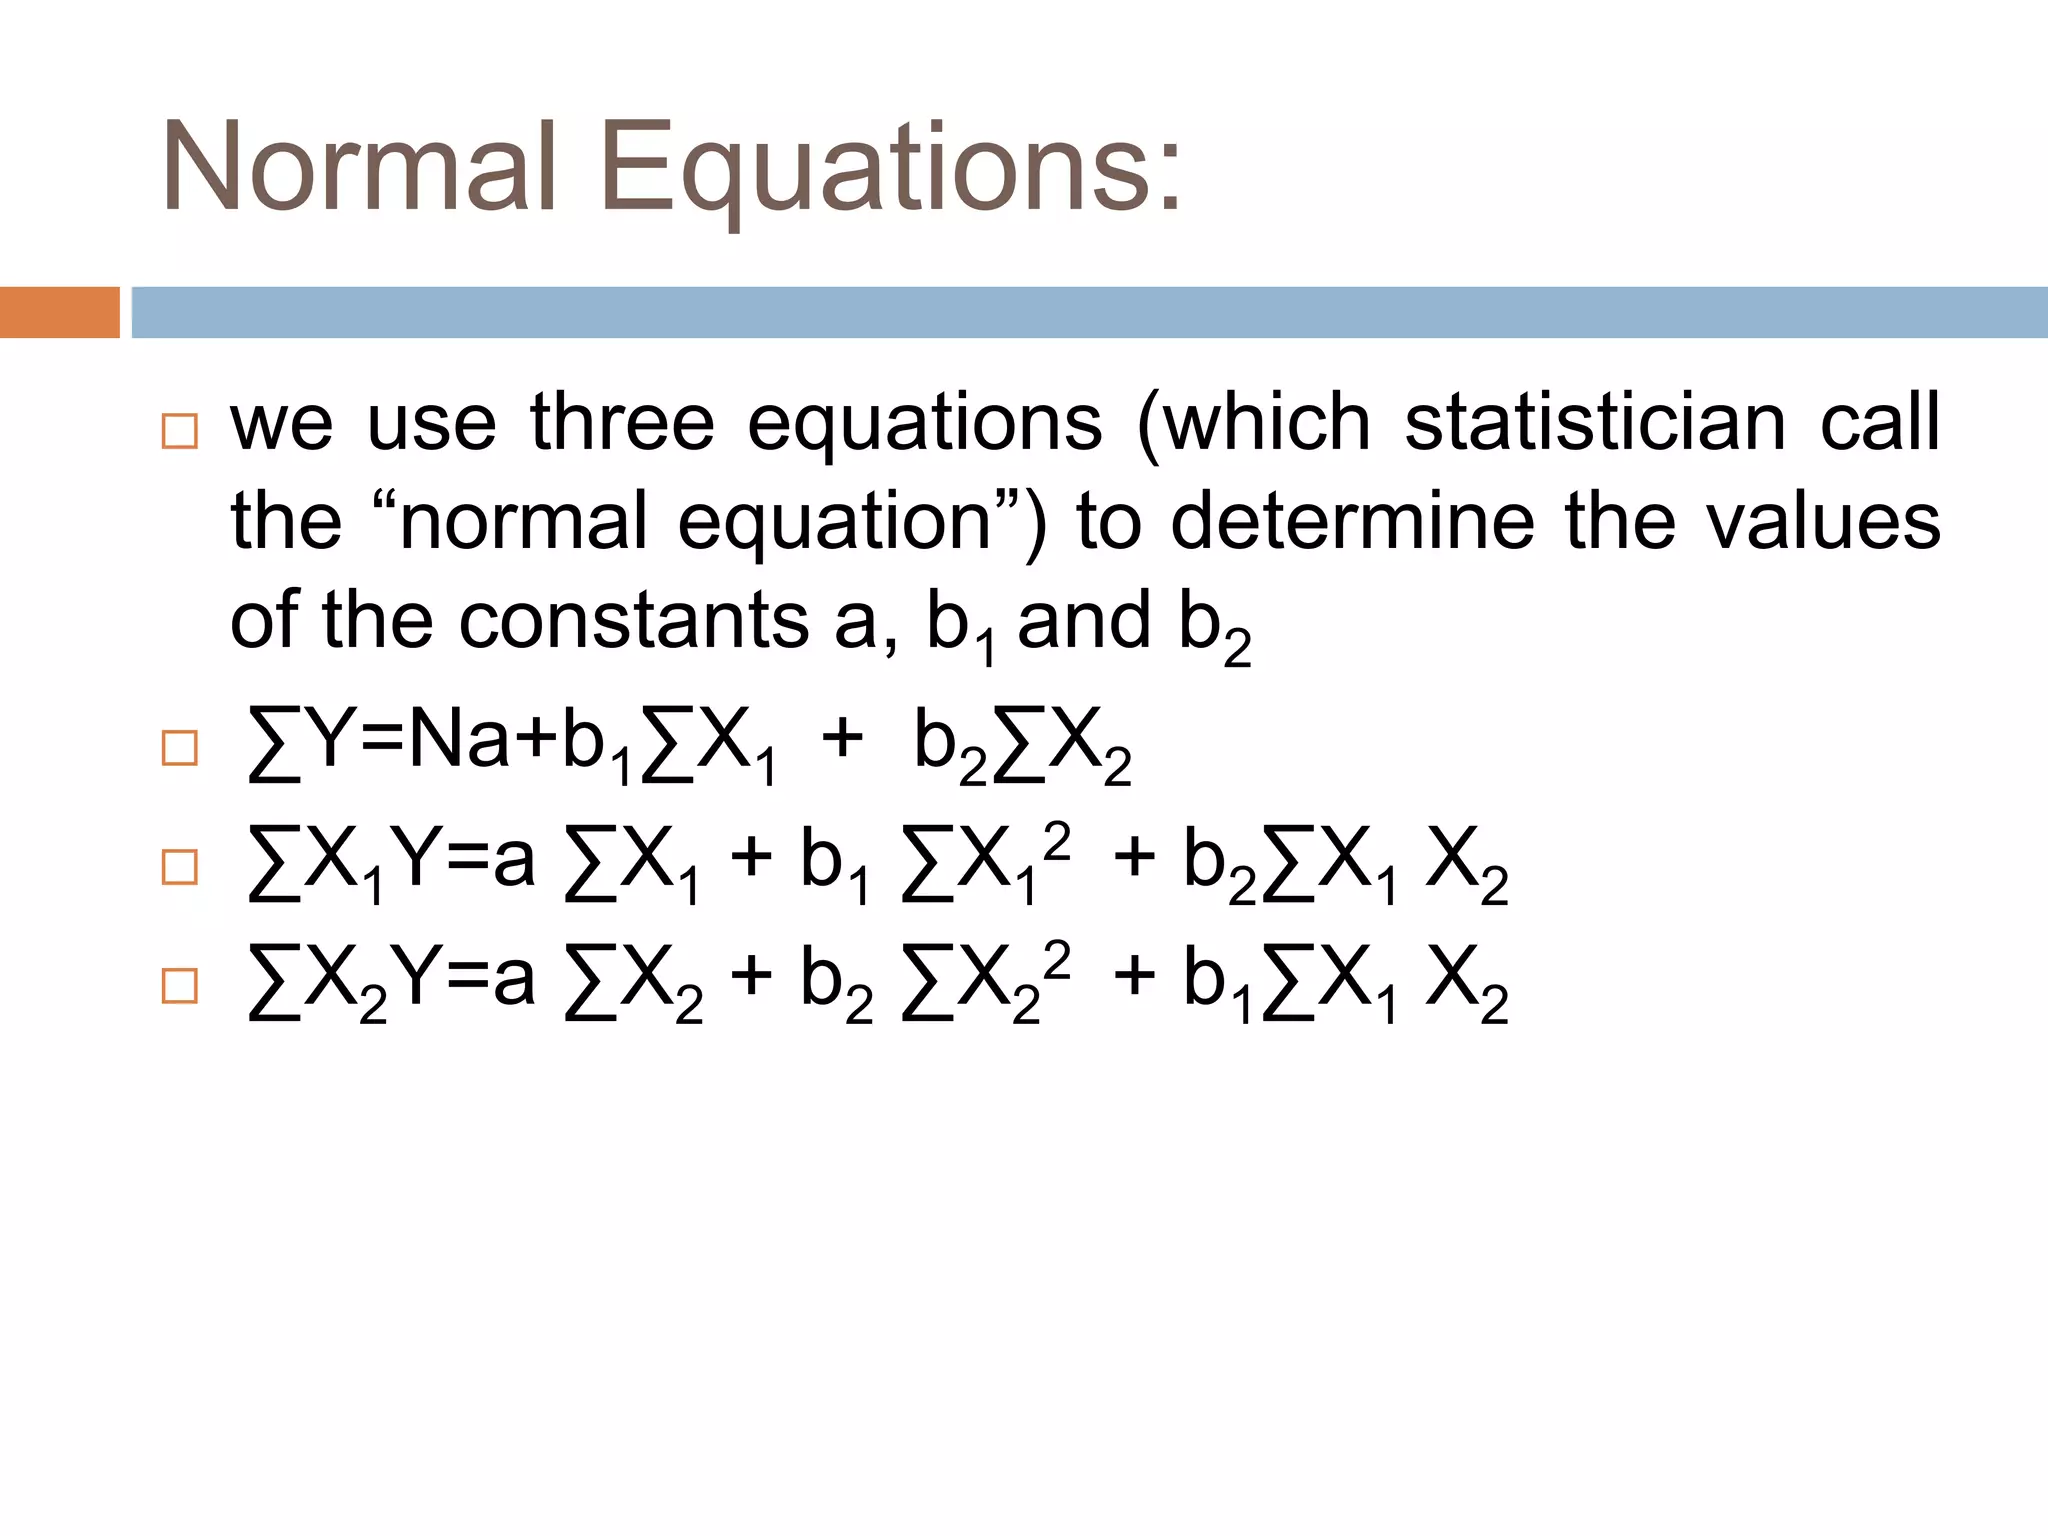
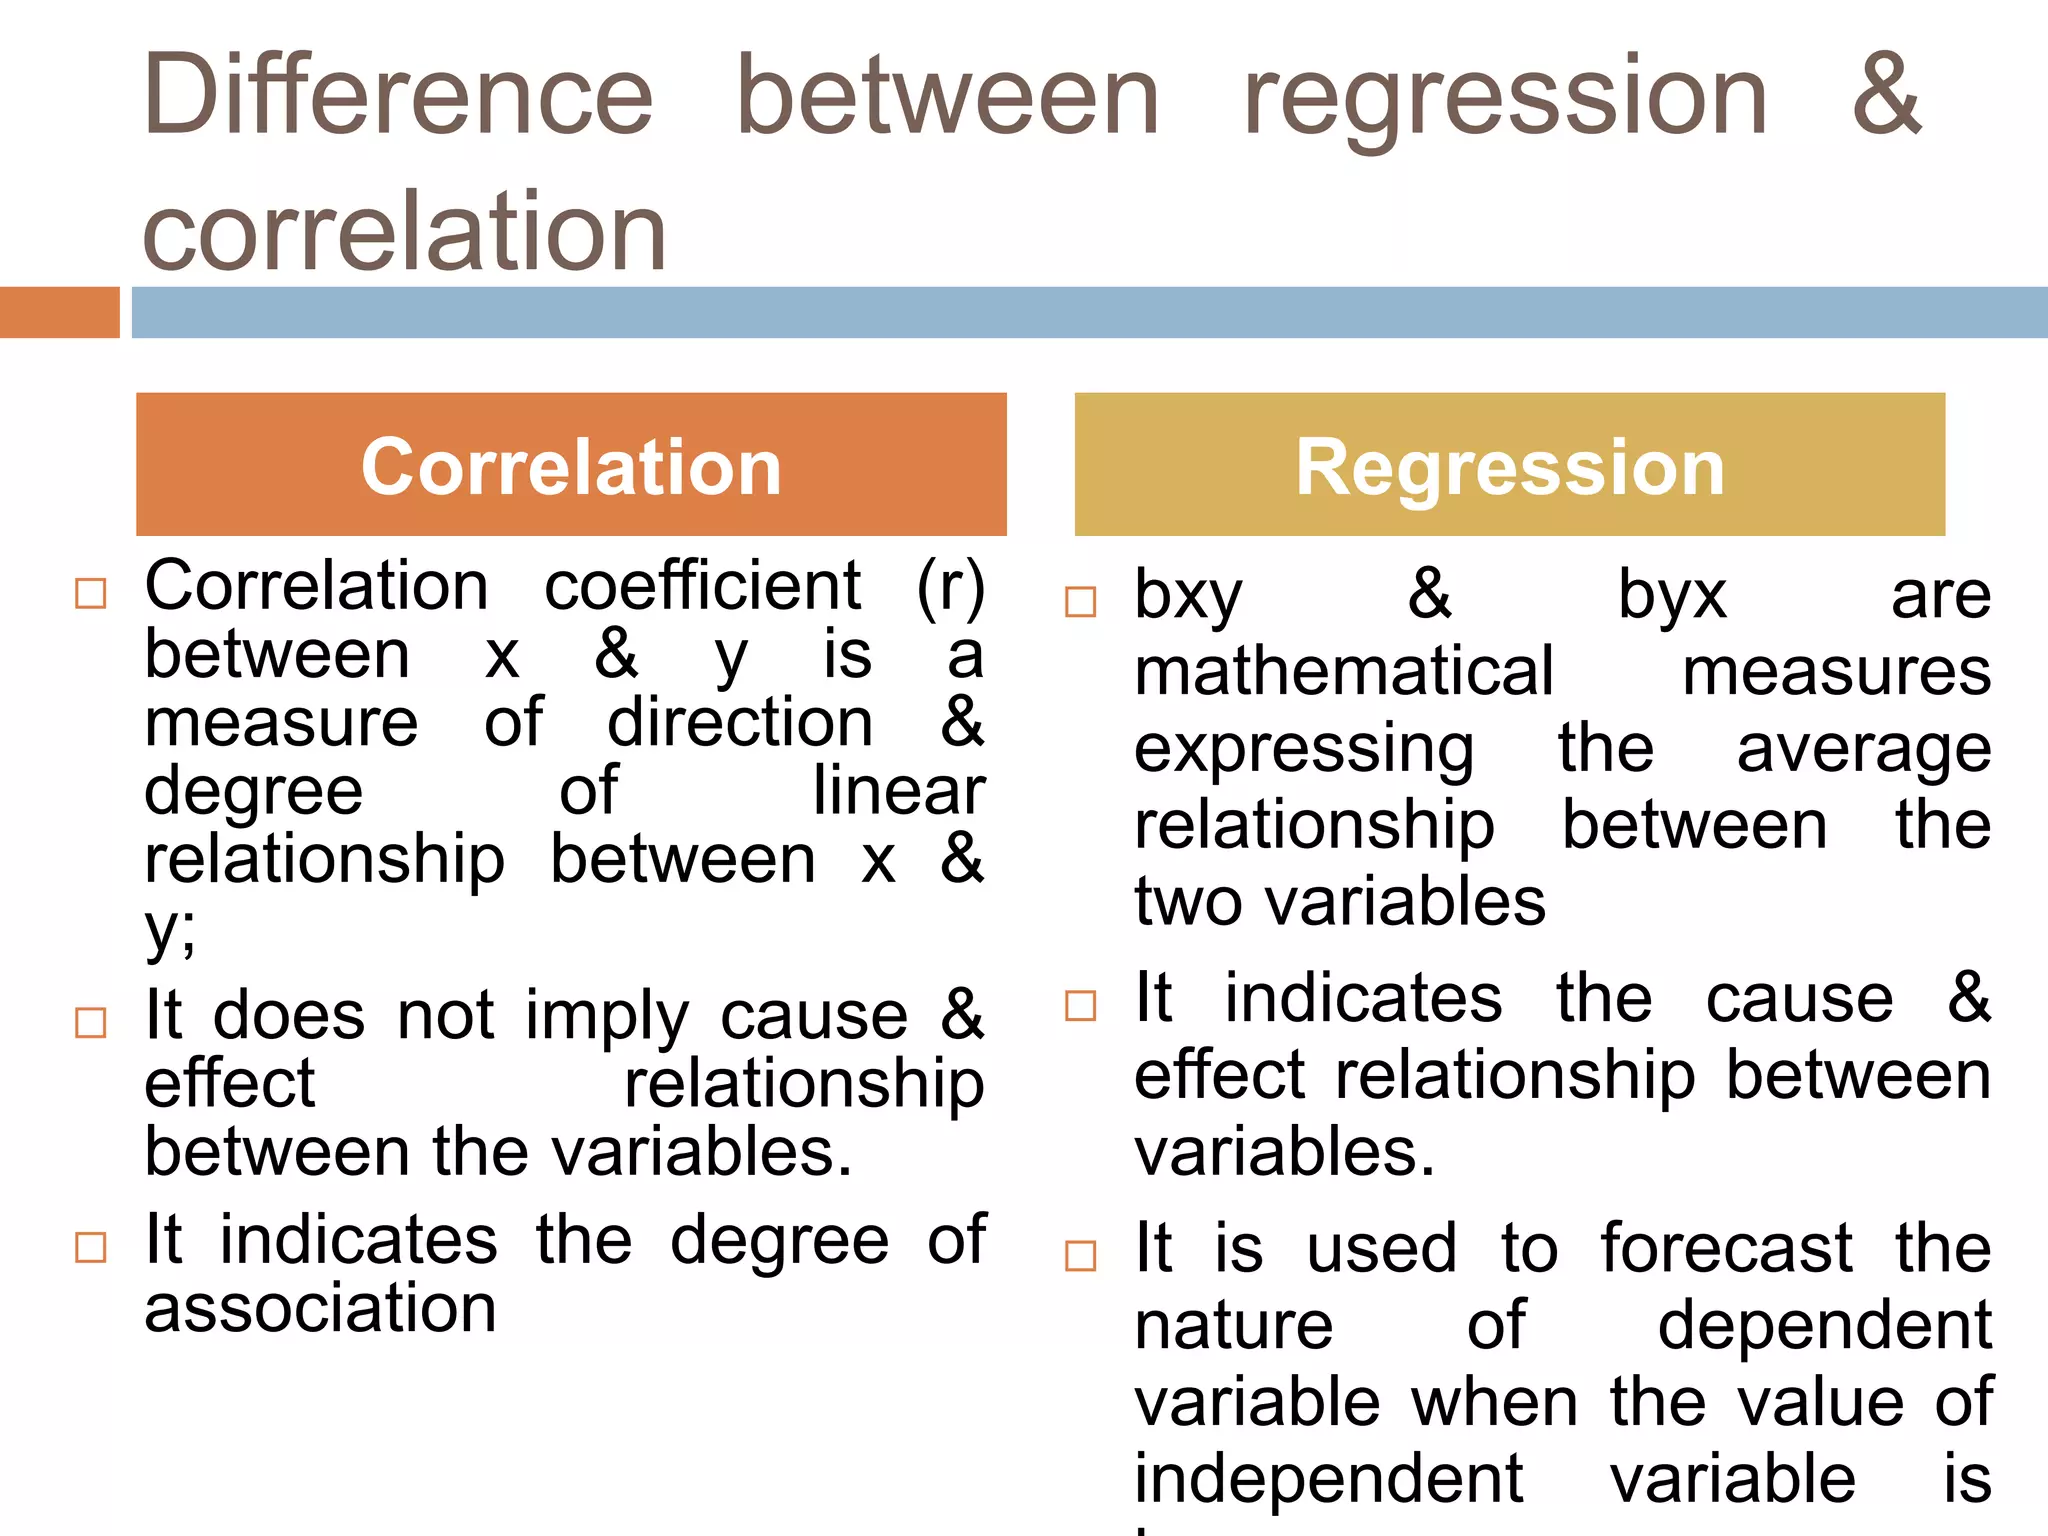
UNIT III
REGRESSION
Meaning
 The dictionary meaning of regression is “the
act of returning or going back”;
 First used in 1877 by Francis Galton;
 Regression is the statistical tool with the help
of which we are in a position to estimate
(predict) the unknown values of one variable
from the known values of another variable;
 It helps to find out average probable change
in one variable given a certain amount of
change in another;
Importance
Regression lines
 For two variables X and Y, we will have two
regression lines:
1. Regression line X on Y gives values of Y for
given values of X;
2. Regression line Y on X gives values of X for
given values of Y;
Regression Equation
 Regression equations are algebraic expressions
of regression lines;
Y on X
Regression equation expressed as
Y=a+bX
Y is dependent variable
X is independent variable
„a‟ & „b‟ are constants/parameters of line
„a‟ determines the level of fitted line (i.e. distance of
line above or below origin)
„b‟ determines the slope of line (i.e change in Y for
unit change in X)
 Regression equations are algebraic expressions
of regression lines;
X on Y
Regression equation expressed as
X=a+bY
X is dependent variable
Y is independent variable
„a‟ & „b‟ are constants/parameters of line
„a‟ determines the level of fitted line (i.e. distance of
line above or below origin)
„b‟ determines the slope of line (i.e change in Y for
unit change in X)
Method of Least Square
 Constant “a” & “b” can be calculated by method of
least square;
 The line should be drawn through the plotted
points in such a manner that the sum of square of
the vertical deviations of actual Y values from
estimated Y values is the least i.e. ∑(Y-Ye)2
should be minimum;
 Such a line is known as line of best fit;
 with algebra & calculus:
For Y on X For X on Y
∑Y=Na+b ∑X ∑X=Na+b ∑Y
∑XY=a ∑X + b ∑X2 ∑XY=a ∑Y + b ∑Y2
Multiple Regression
 When we use more than one independent
variable to estimate the dependent variable in
order to increase the accuracy of the estimate;
the process is called multiple regression
analysis.
 It is based on the same assumptions &
procedure that are encountered using simple
regression.
 The principal advantage of multiple regression
is that it allows us to use more of the
information available to us to estimate the
Estimating equation describing
relationship among three variables
Y= a+b1X1+b2X2
 where, Y = estimated value corresponding to
the dependent variable
 a= Y intercept
 b1 and b2 = slopes associated with X1 and X2,
respectively
 X1 and X2 = values of the two independent
variables
Normal Equations:
 we use three equations (which statistician call
the “normal equation”) to determine the values
of the constants a, b1 and b2
 ∑Y=Na+b1∑X1 + b2∑X2
 ∑X1Y=a ∑X1 + b1 ∑X1
2 + b2∑X1 X2
 ∑X2Y=a ∑X2 + b2 ∑X2
2 + b1∑X1 X2
Difference between regression &
correlation
 Correlation coefficient (r)
between x & y is a
measure of direction &
degree of linear
relationship between x &
y;
 It does not imply cause &
effect relationship
between the variables.
 It indicates the degree of
association
 bxy & byx are
mathematical measures
expressing the average
relationship between the
two variables
 It indicates the cause &
effect relationship between
variables.
 It is used to forecast the
nature of dependent
variable when the value of
independent variable is
Correlation Regression

Regression

  • 1.
  • 2.
    Meaning  The dictionarymeaning of regression is “the act of returning or going back”;  First used in 1877 by Francis Galton;  Regression is the statistical tool with the help of which we are in a position to estimate (predict) the unknown values of one variable from the known values of another variable;  It helps to find out average probable change in one variable given a certain amount of change in another;
  • 3.
  • 4.
    Regression lines  Fortwo variables X and Y, we will have two regression lines: 1. Regression line X on Y gives values of Y for given values of X; 2. Regression line Y on X gives values of X for given values of Y;
  • 5.
    Regression Equation  Regressionequations are algebraic expressions of regression lines; Y on X Regression equation expressed as Y=a+bX Y is dependent variable X is independent variable „a‟ & „b‟ are constants/parameters of line „a‟ determines the level of fitted line (i.e. distance of line above or below origin) „b‟ determines the slope of line (i.e change in Y for unit change in X)
  • 6.
     Regression equationsare algebraic expressions of regression lines; X on Y Regression equation expressed as X=a+bY X is dependent variable Y is independent variable „a‟ & „b‟ are constants/parameters of line „a‟ determines the level of fitted line (i.e. distance of line above or below origin) „b‟ determines the slope of line (i.e change in Y for unit change in X)
  • 7.
    Method of LeastSquare  Constant “a” & “b” can be calculated by method of least square;  The line should be drawn through the plotted points in such a manner that the sum of square of the vertical deviations of actual Y values from estimated Y values is the least i.e. ∑(Y-Ye)2 should be minimum;  Such a line is known as line of best fit;  with algebra & calculus: For Y on X For X on Y ∑Y=Na+b ∑X ∑X=Na+b ∑Y ∑XY=a ∑X + b ∑X2 ∑XY=a ∑Y + b ∑Y2
  • 8.
    Multiple Regression  Whenwe use more than one independent variable to estimate the dependent variable in order to increase the accuracy of the estimate; the process is called multiple regression analysis.  It is based on the same assumptions & procedure that are encountered using simple regression.  The principal advantage of multiple regression is that it allows us to use more of the information available to us to estimate the
  • 9.
    Estimating equation describing relationshipamong three variables Y= a+b1X1+b2X2  where, Y = estimated value corresponding to the dependent variable  a= Y intercept  b1 and b2 = slopes associated with X1 and X2, respectively  X1 and X2 = values of the two independent variables
  • 10.
    Normal Equations:  weuse three equations (which statistician call the “normal equation”) to determine the values of the constants a, b1 and b2  ∑Y=Na+b1∑X1 + b2∑X2  ∑X1Y=a ∑X1 + b1 ∑X1 2 + b2∑X1 X2  ∑X2Y=a ∑X2 + b2 ∑X2 2 + b1∑X1 X2
  • 11.
    Difference between regression& correlation  Correlation coefficient (r) between x & y is a measure of direction & degree of linear relationship between x & y;  It does not imply cause & effect relationship between the variables.  It indicates the degree of association  bxy & byx are mathematical measures expressing the average relationship between the two variables  It indicates the cause & effect relationship between variables.  It is used to forecast the nature of dependent variable when the value of independent variable is Correlation Regression