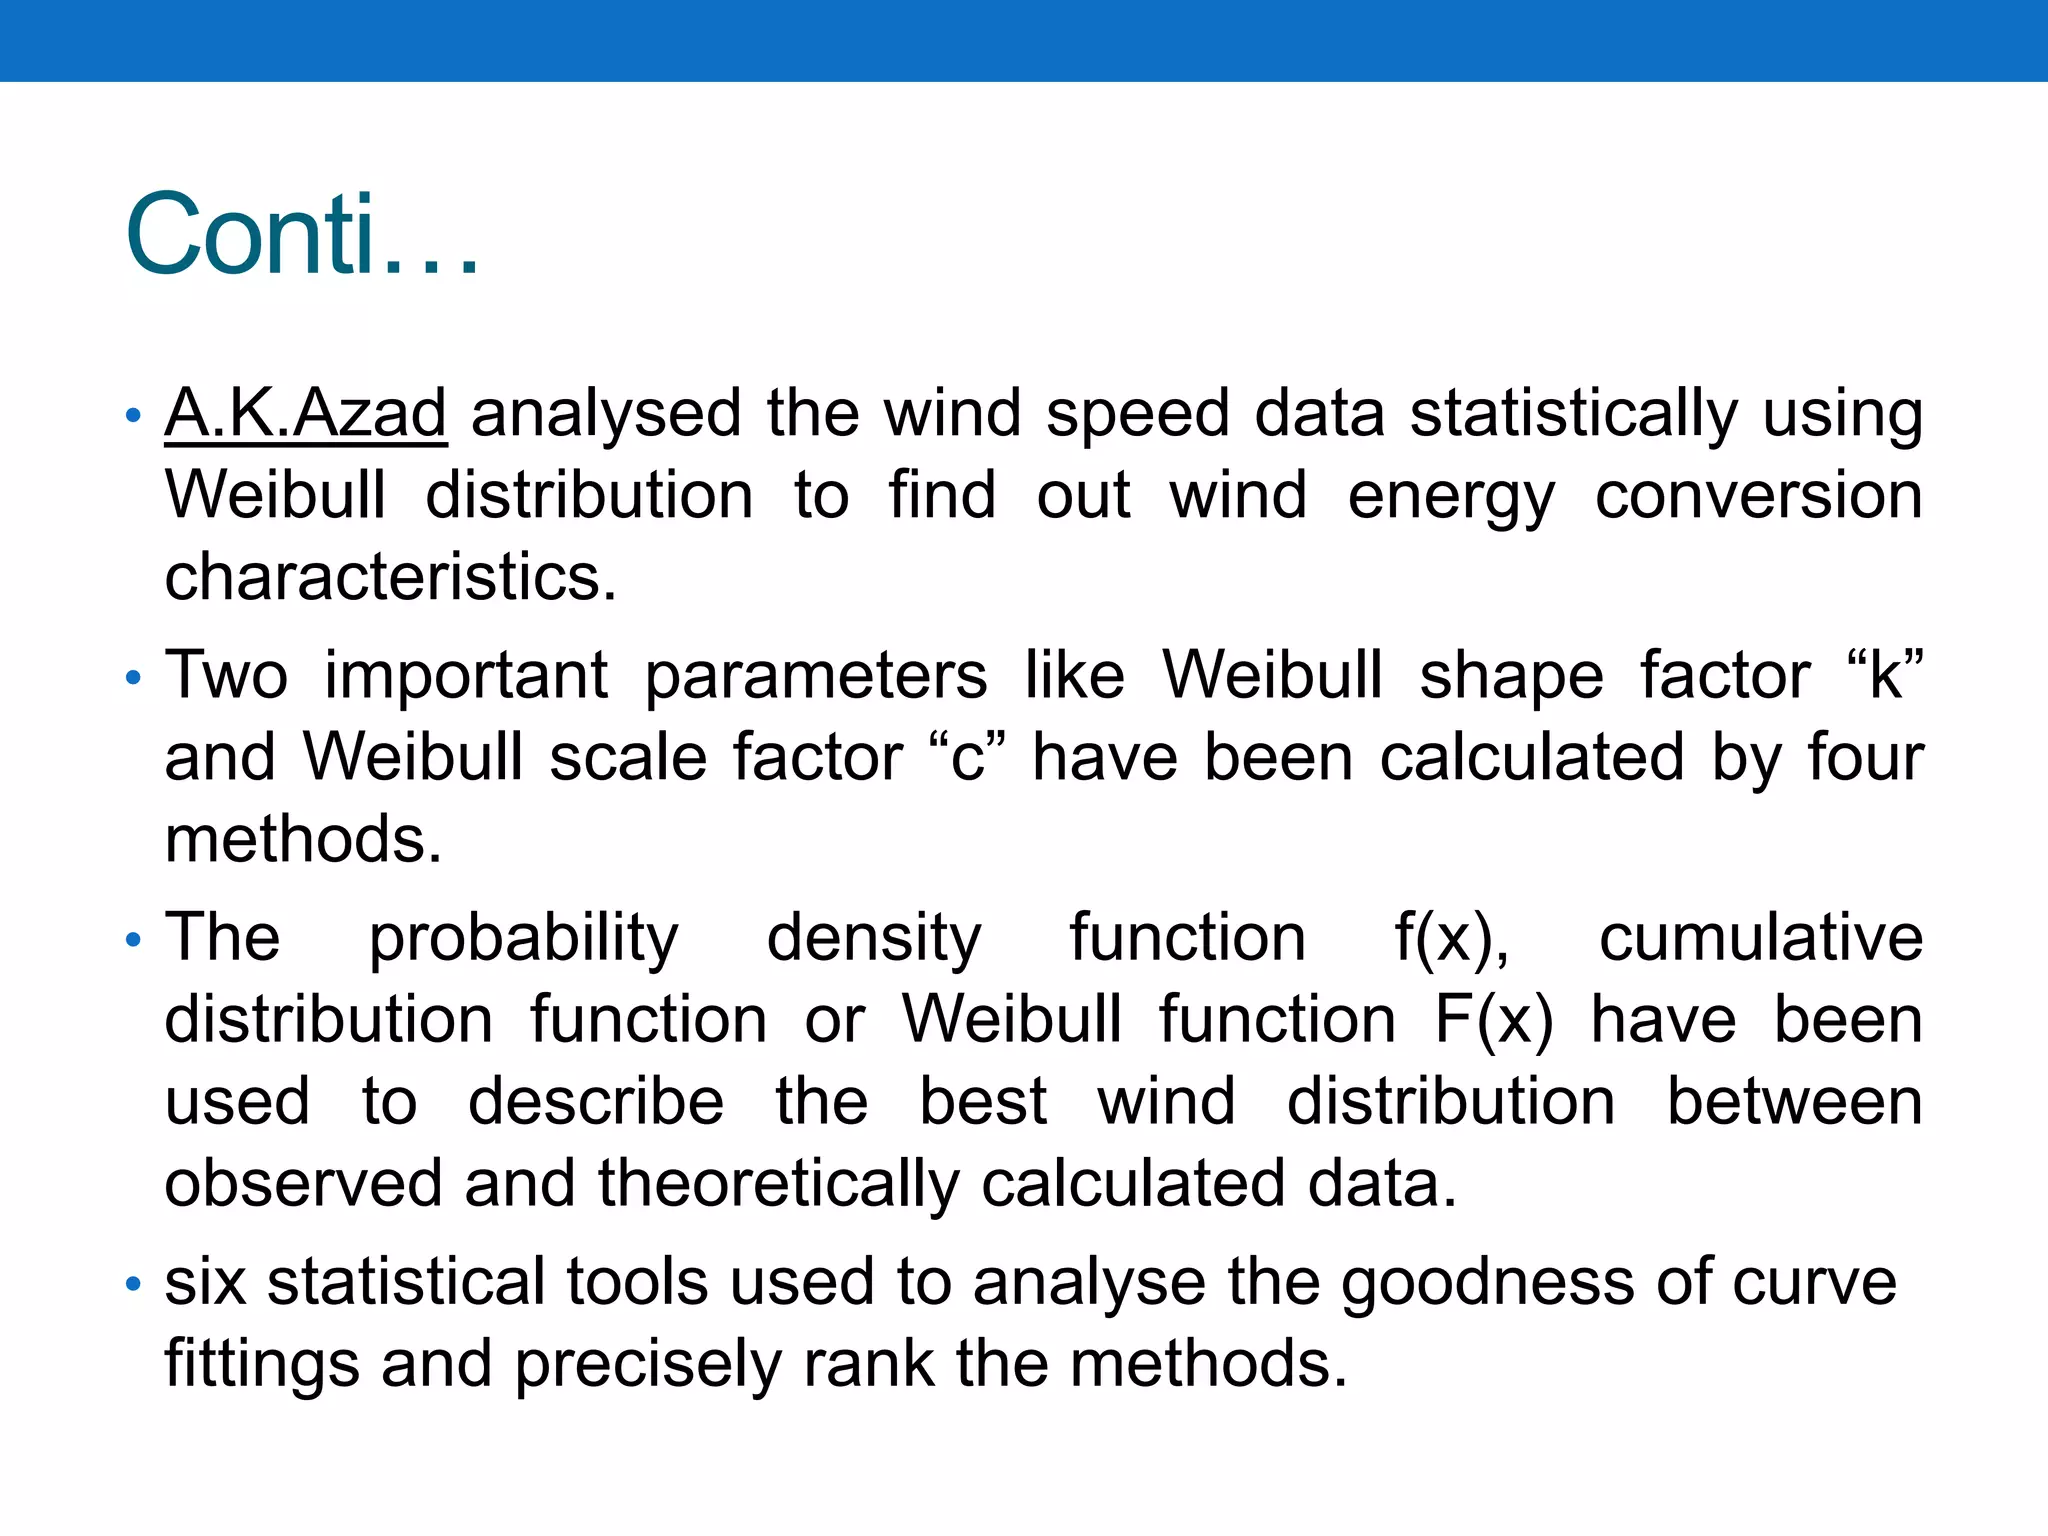
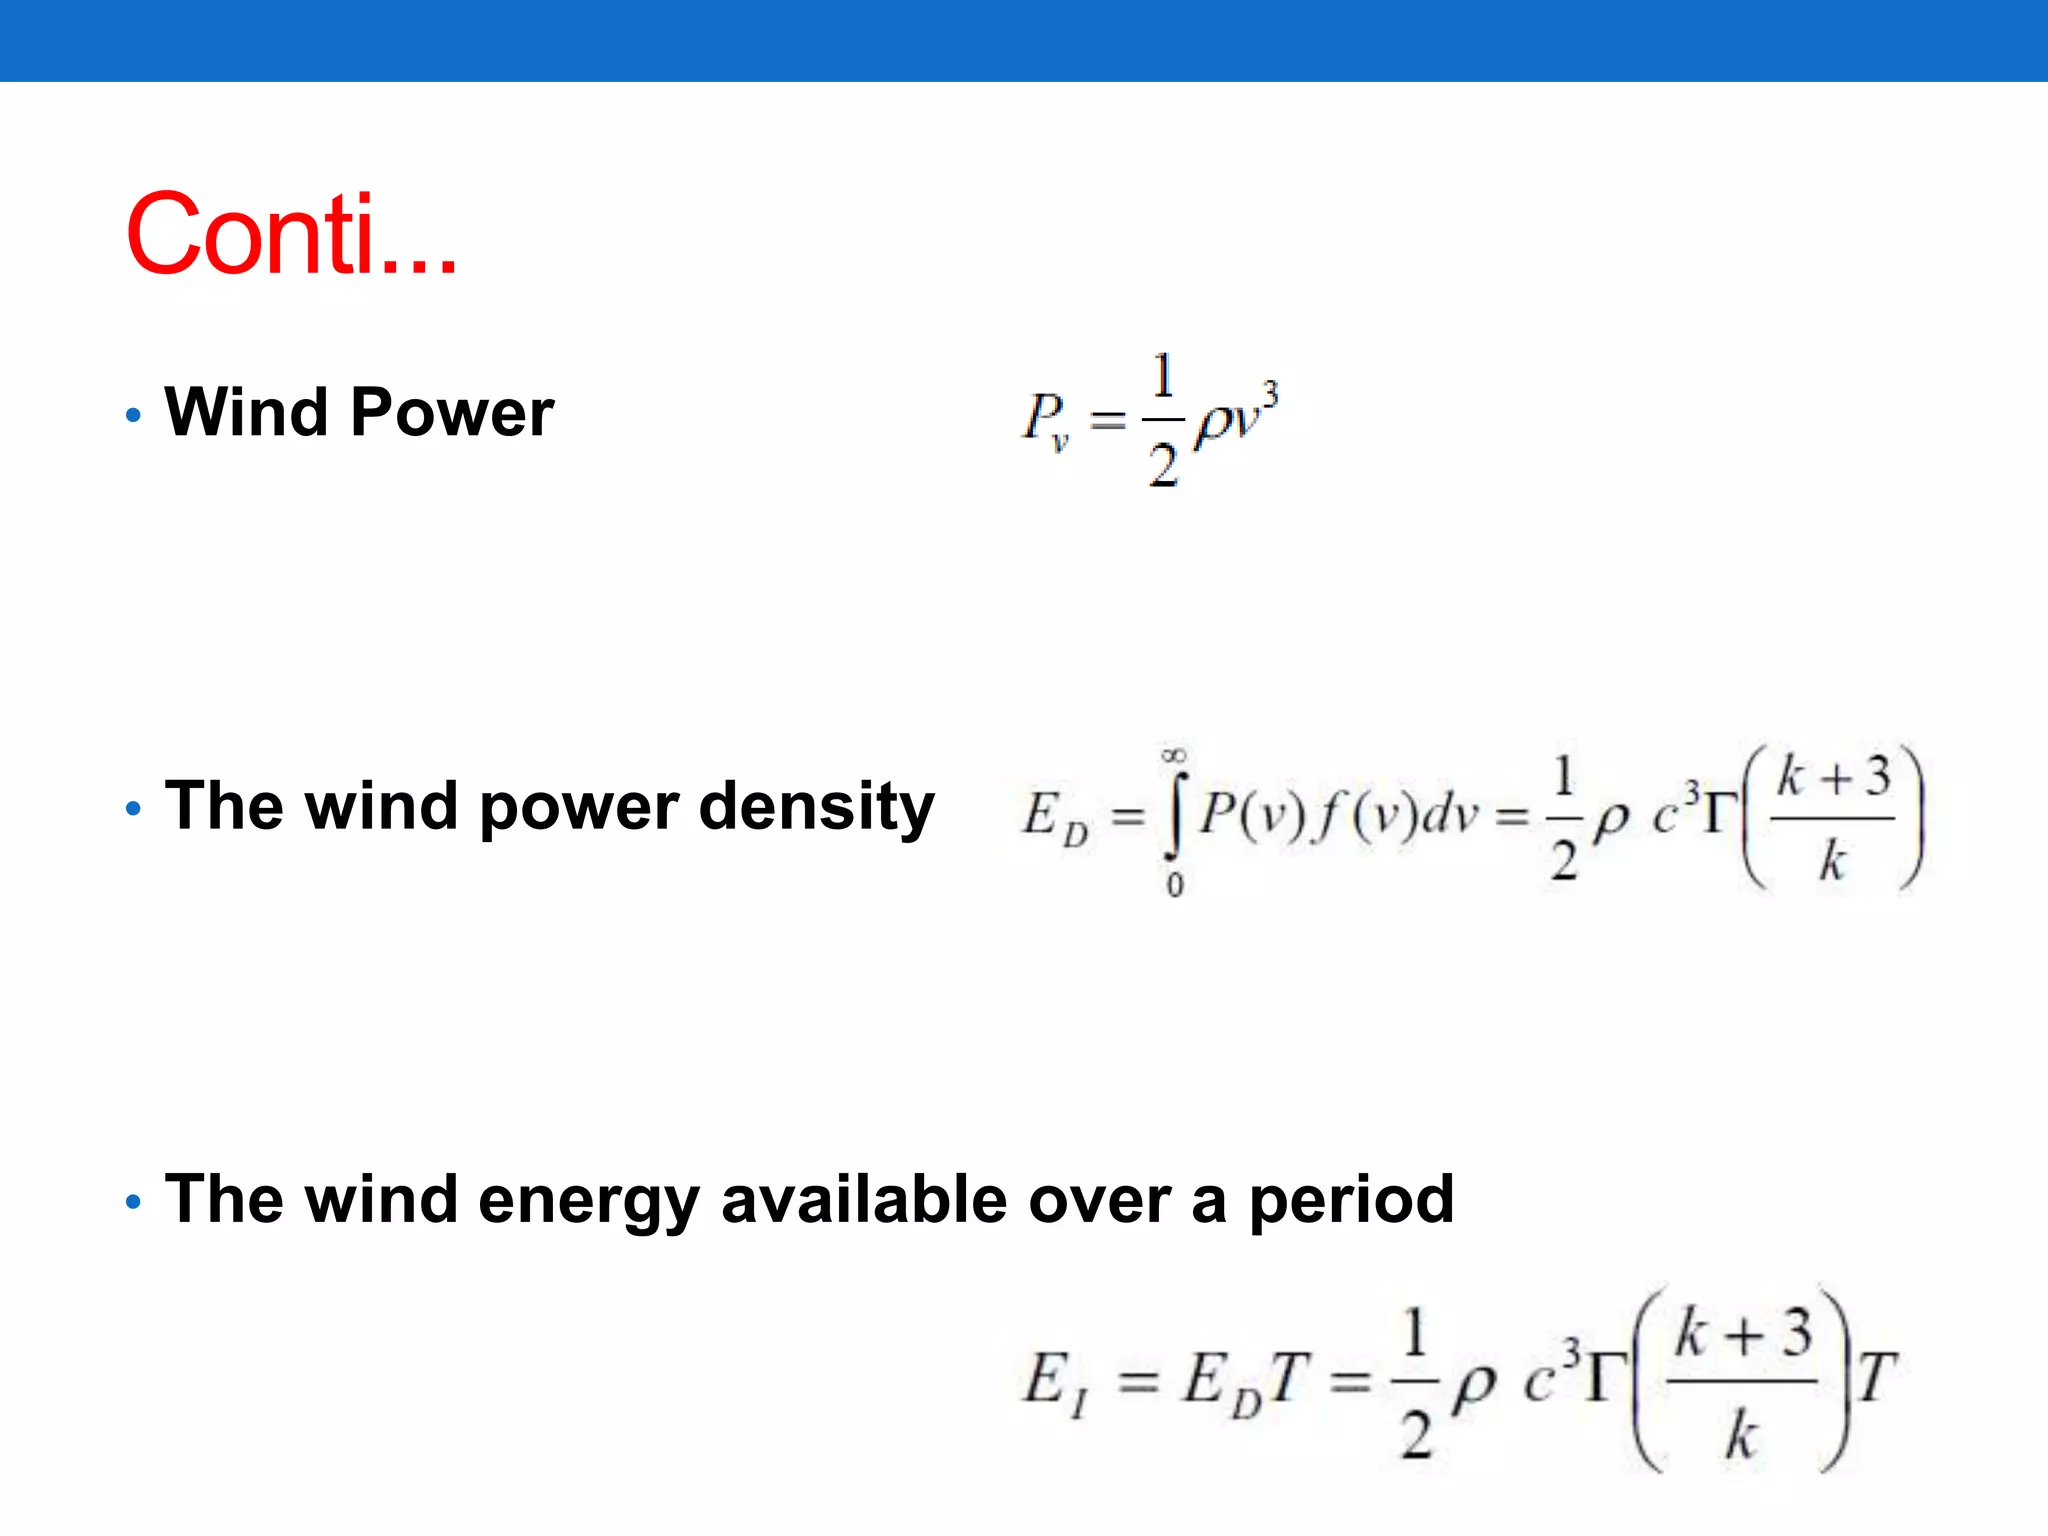
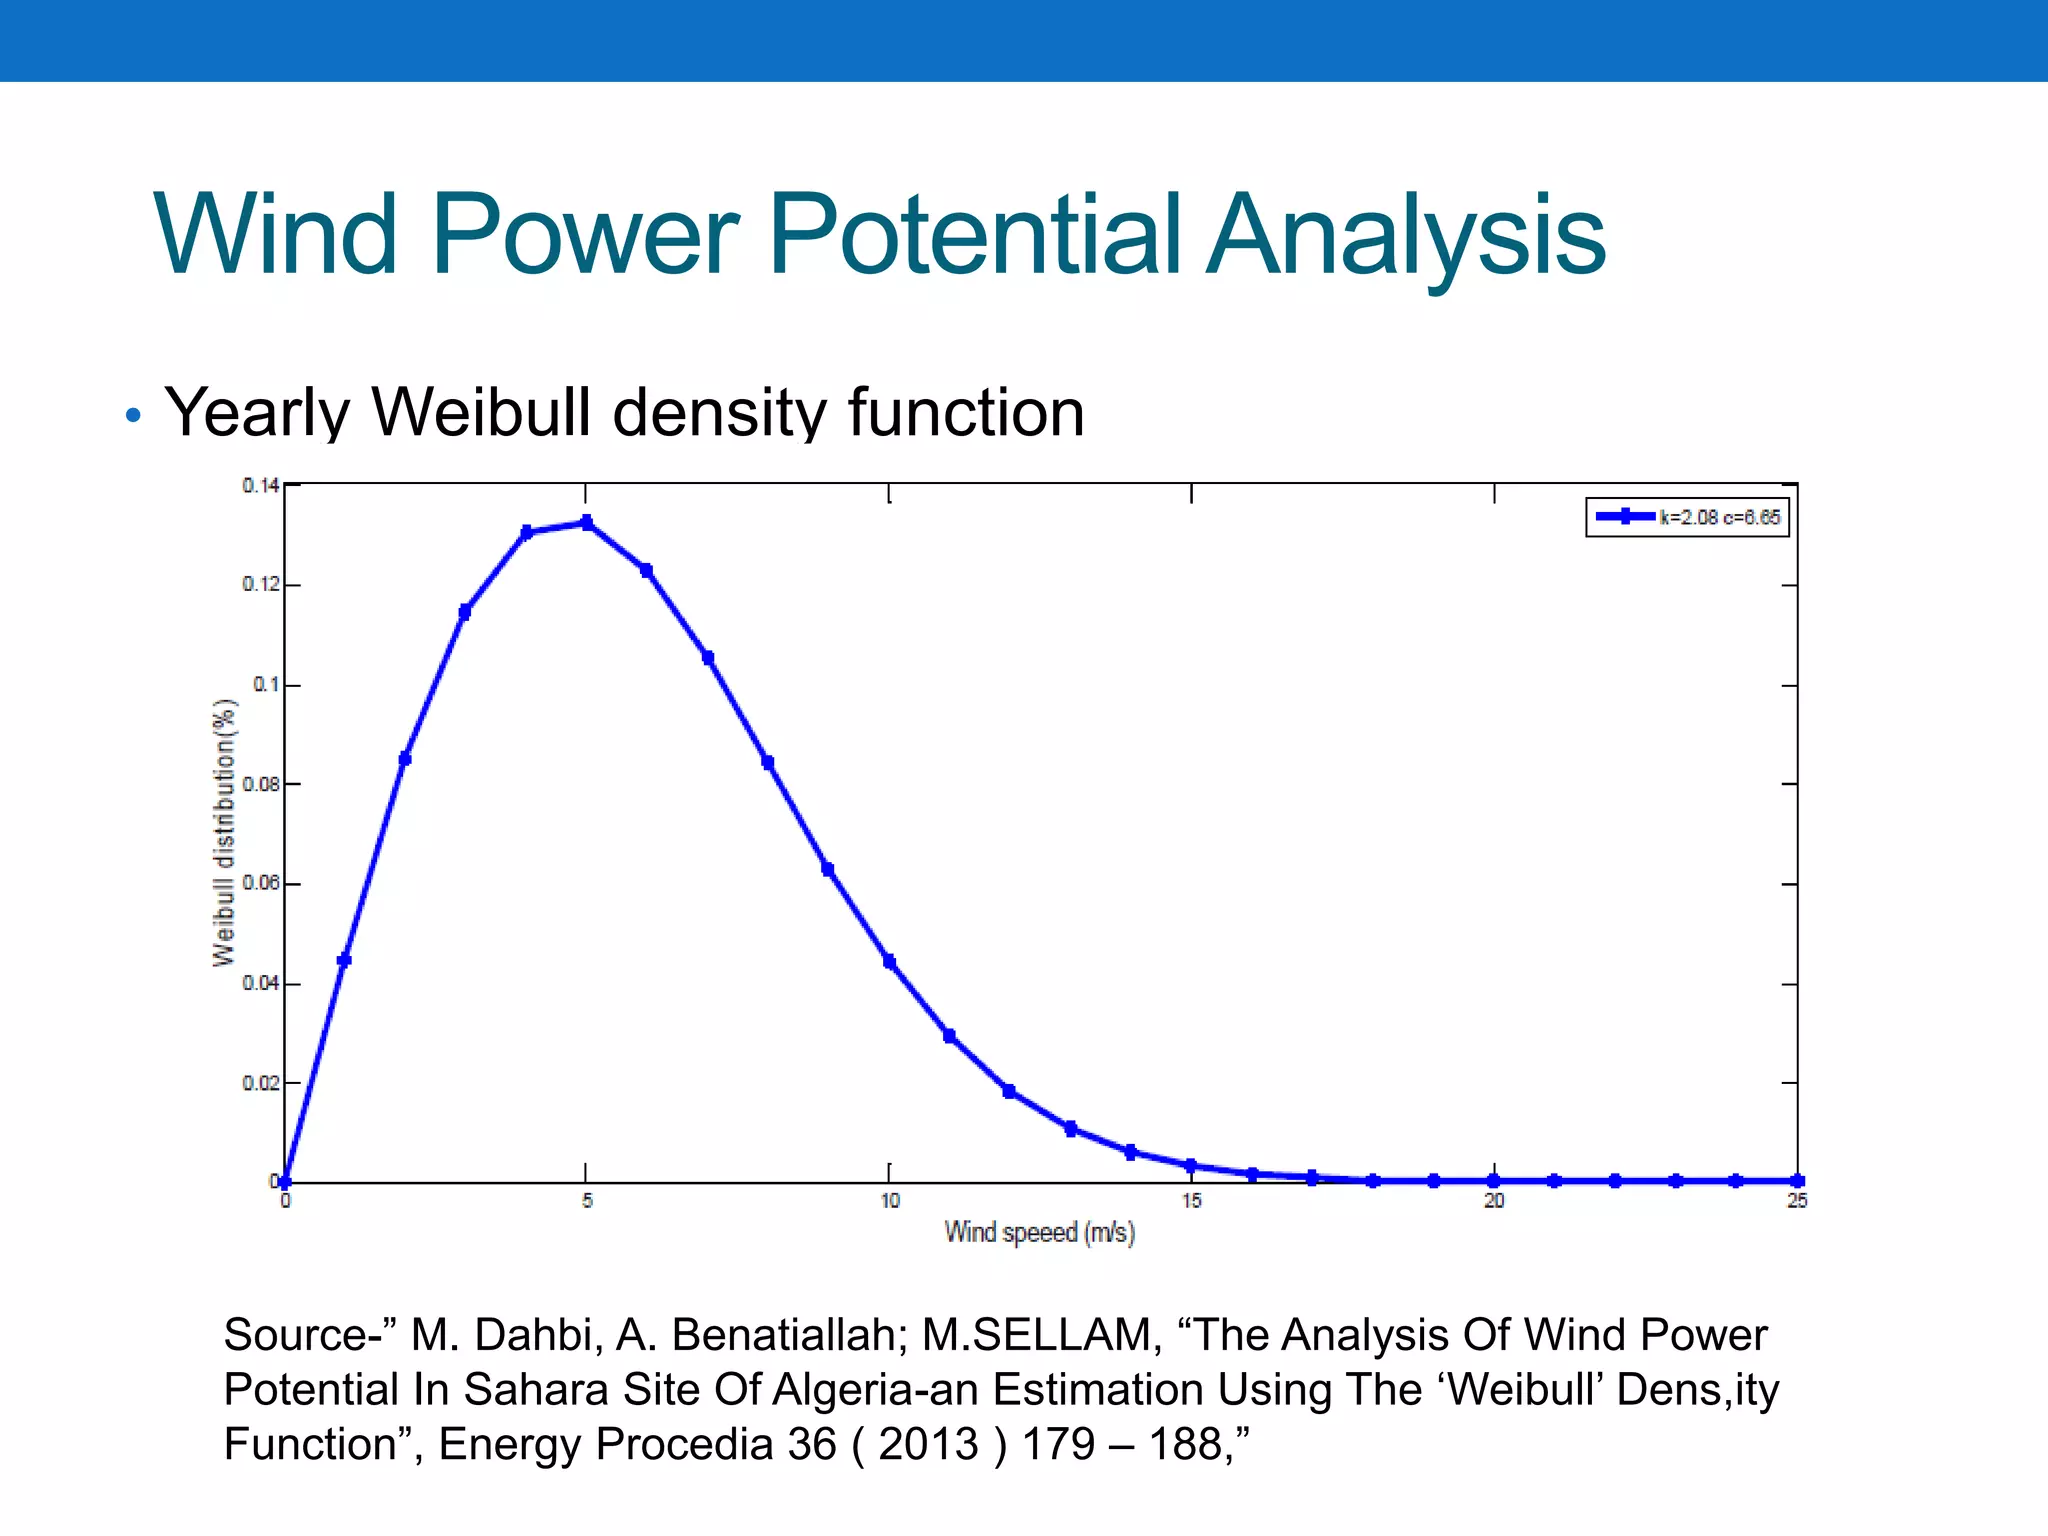
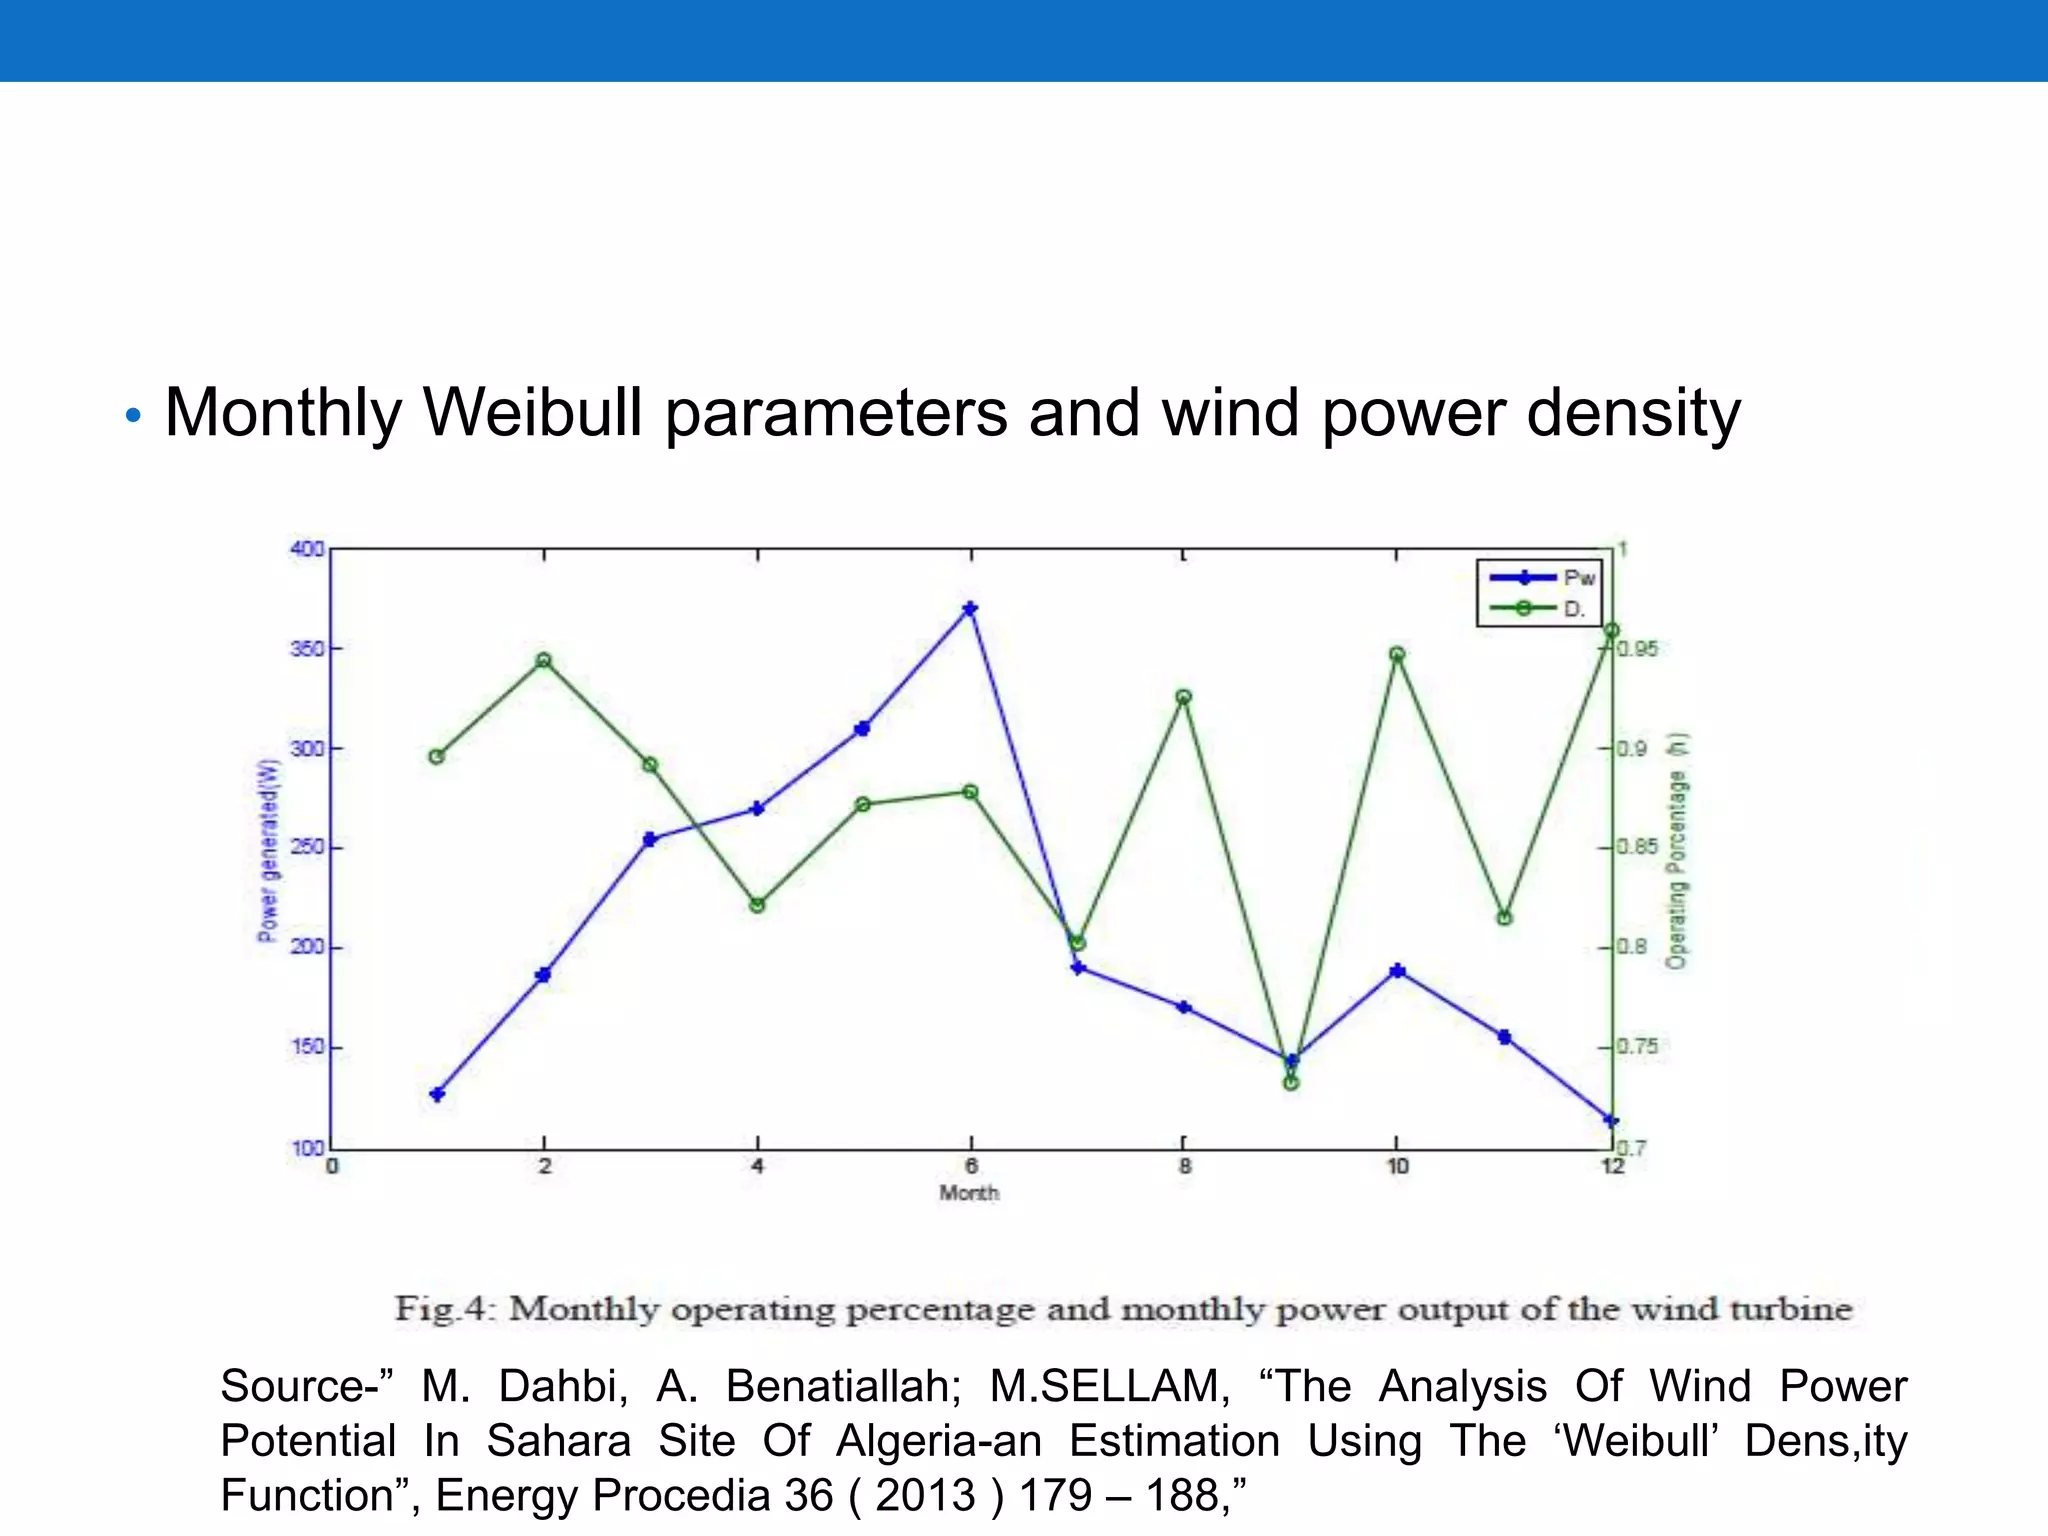
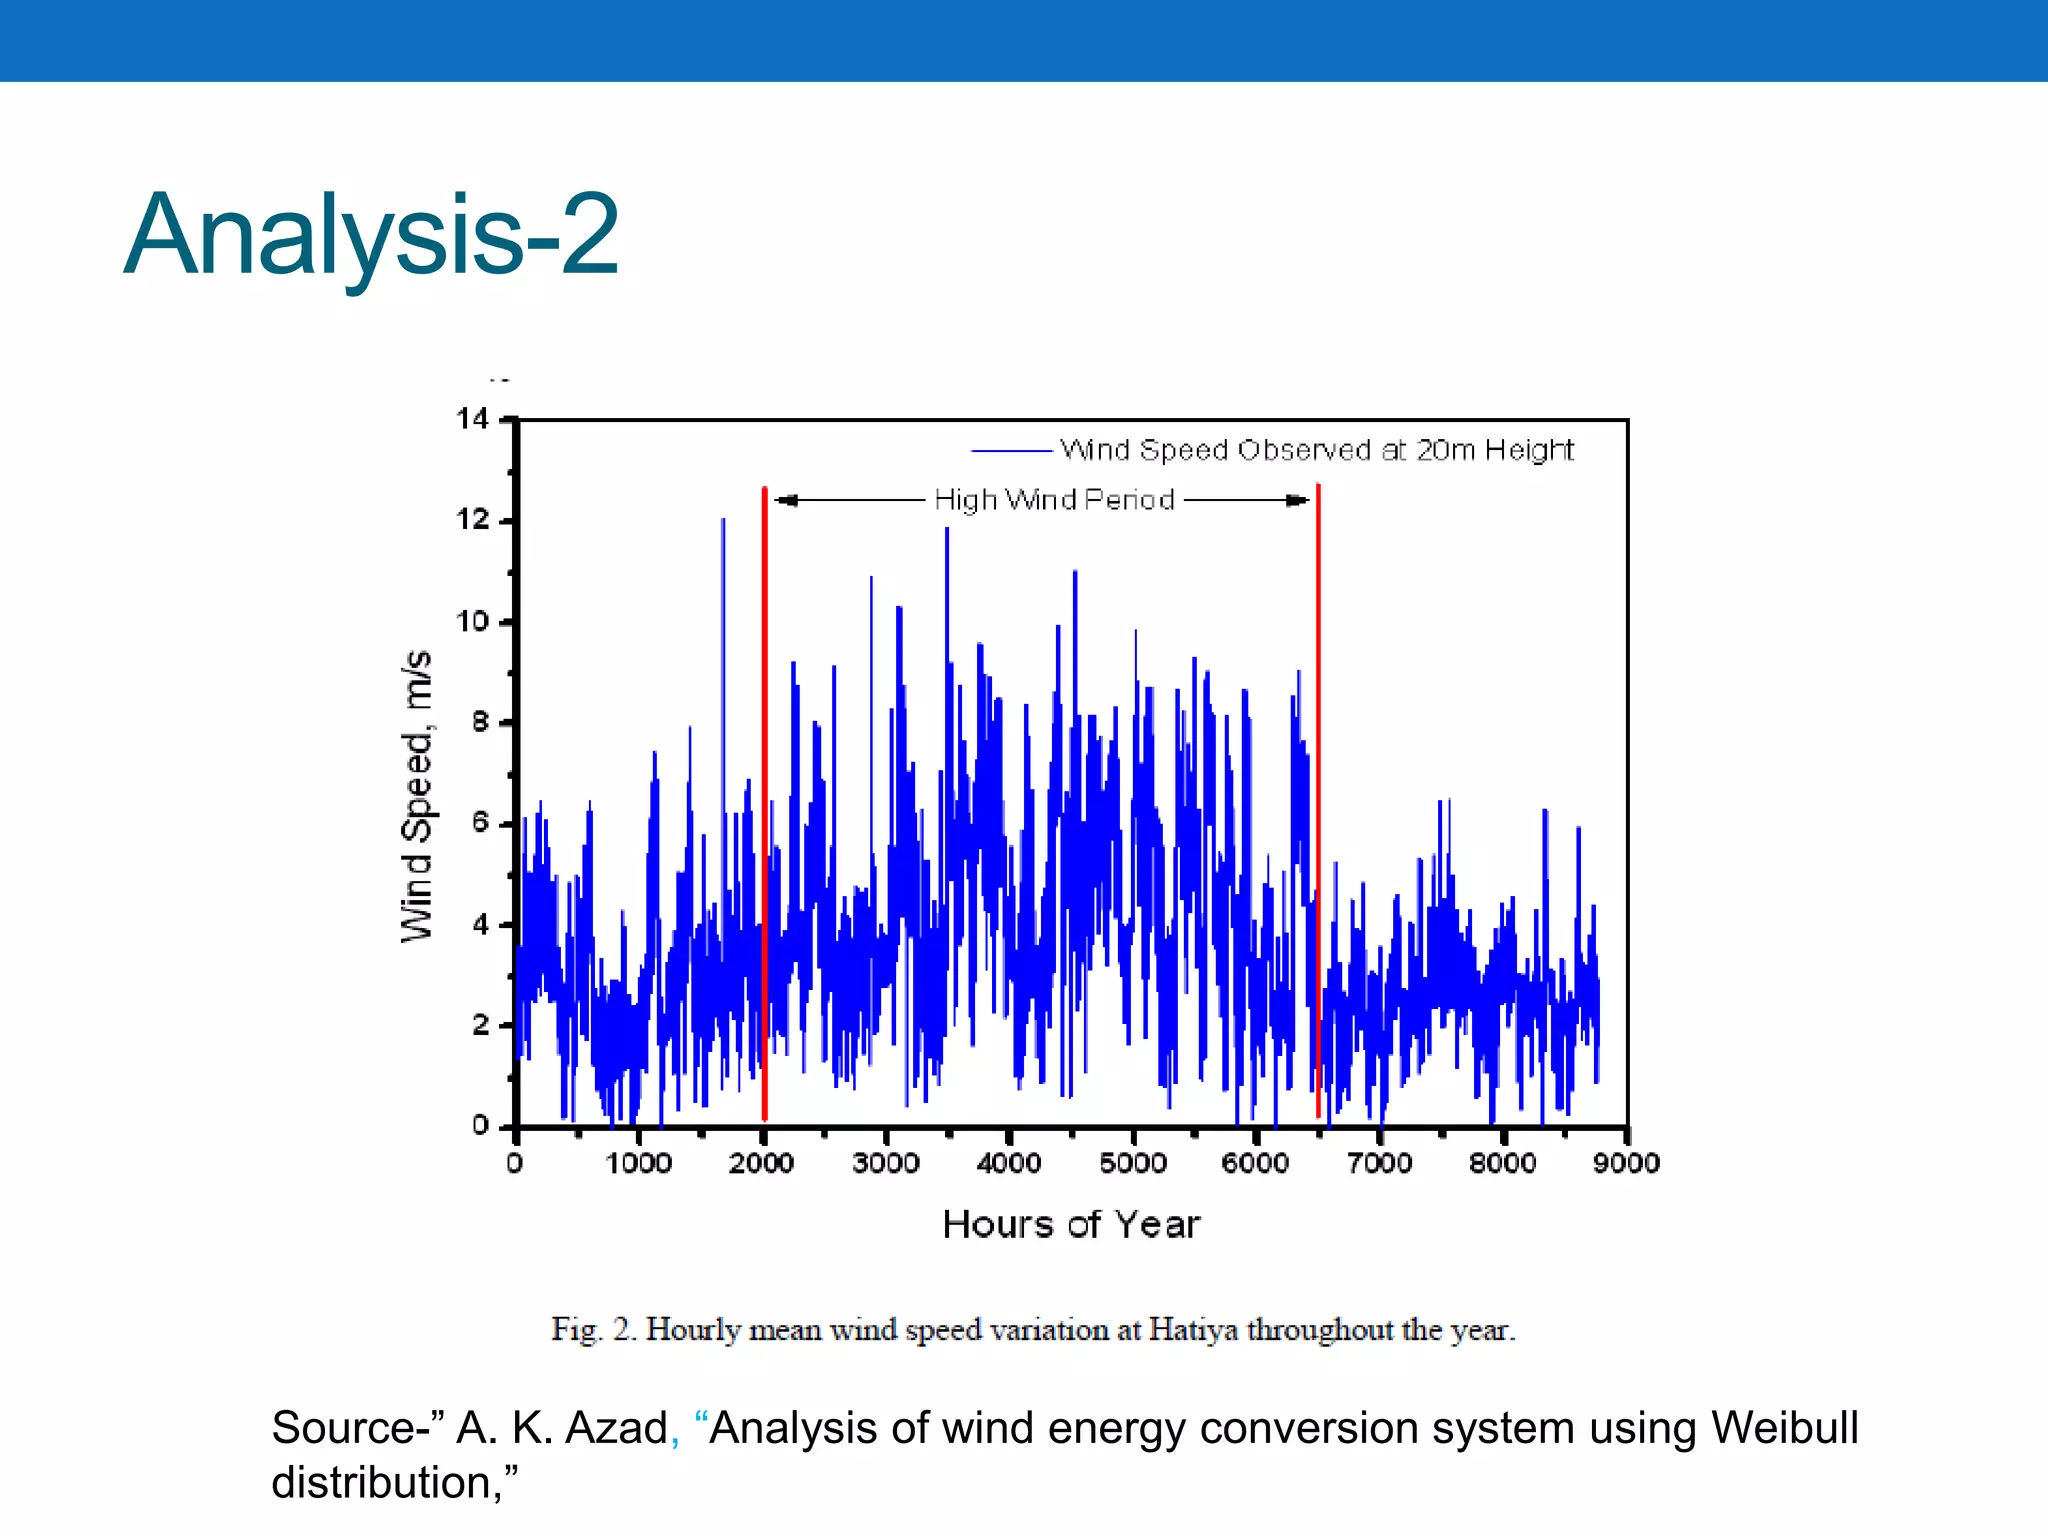
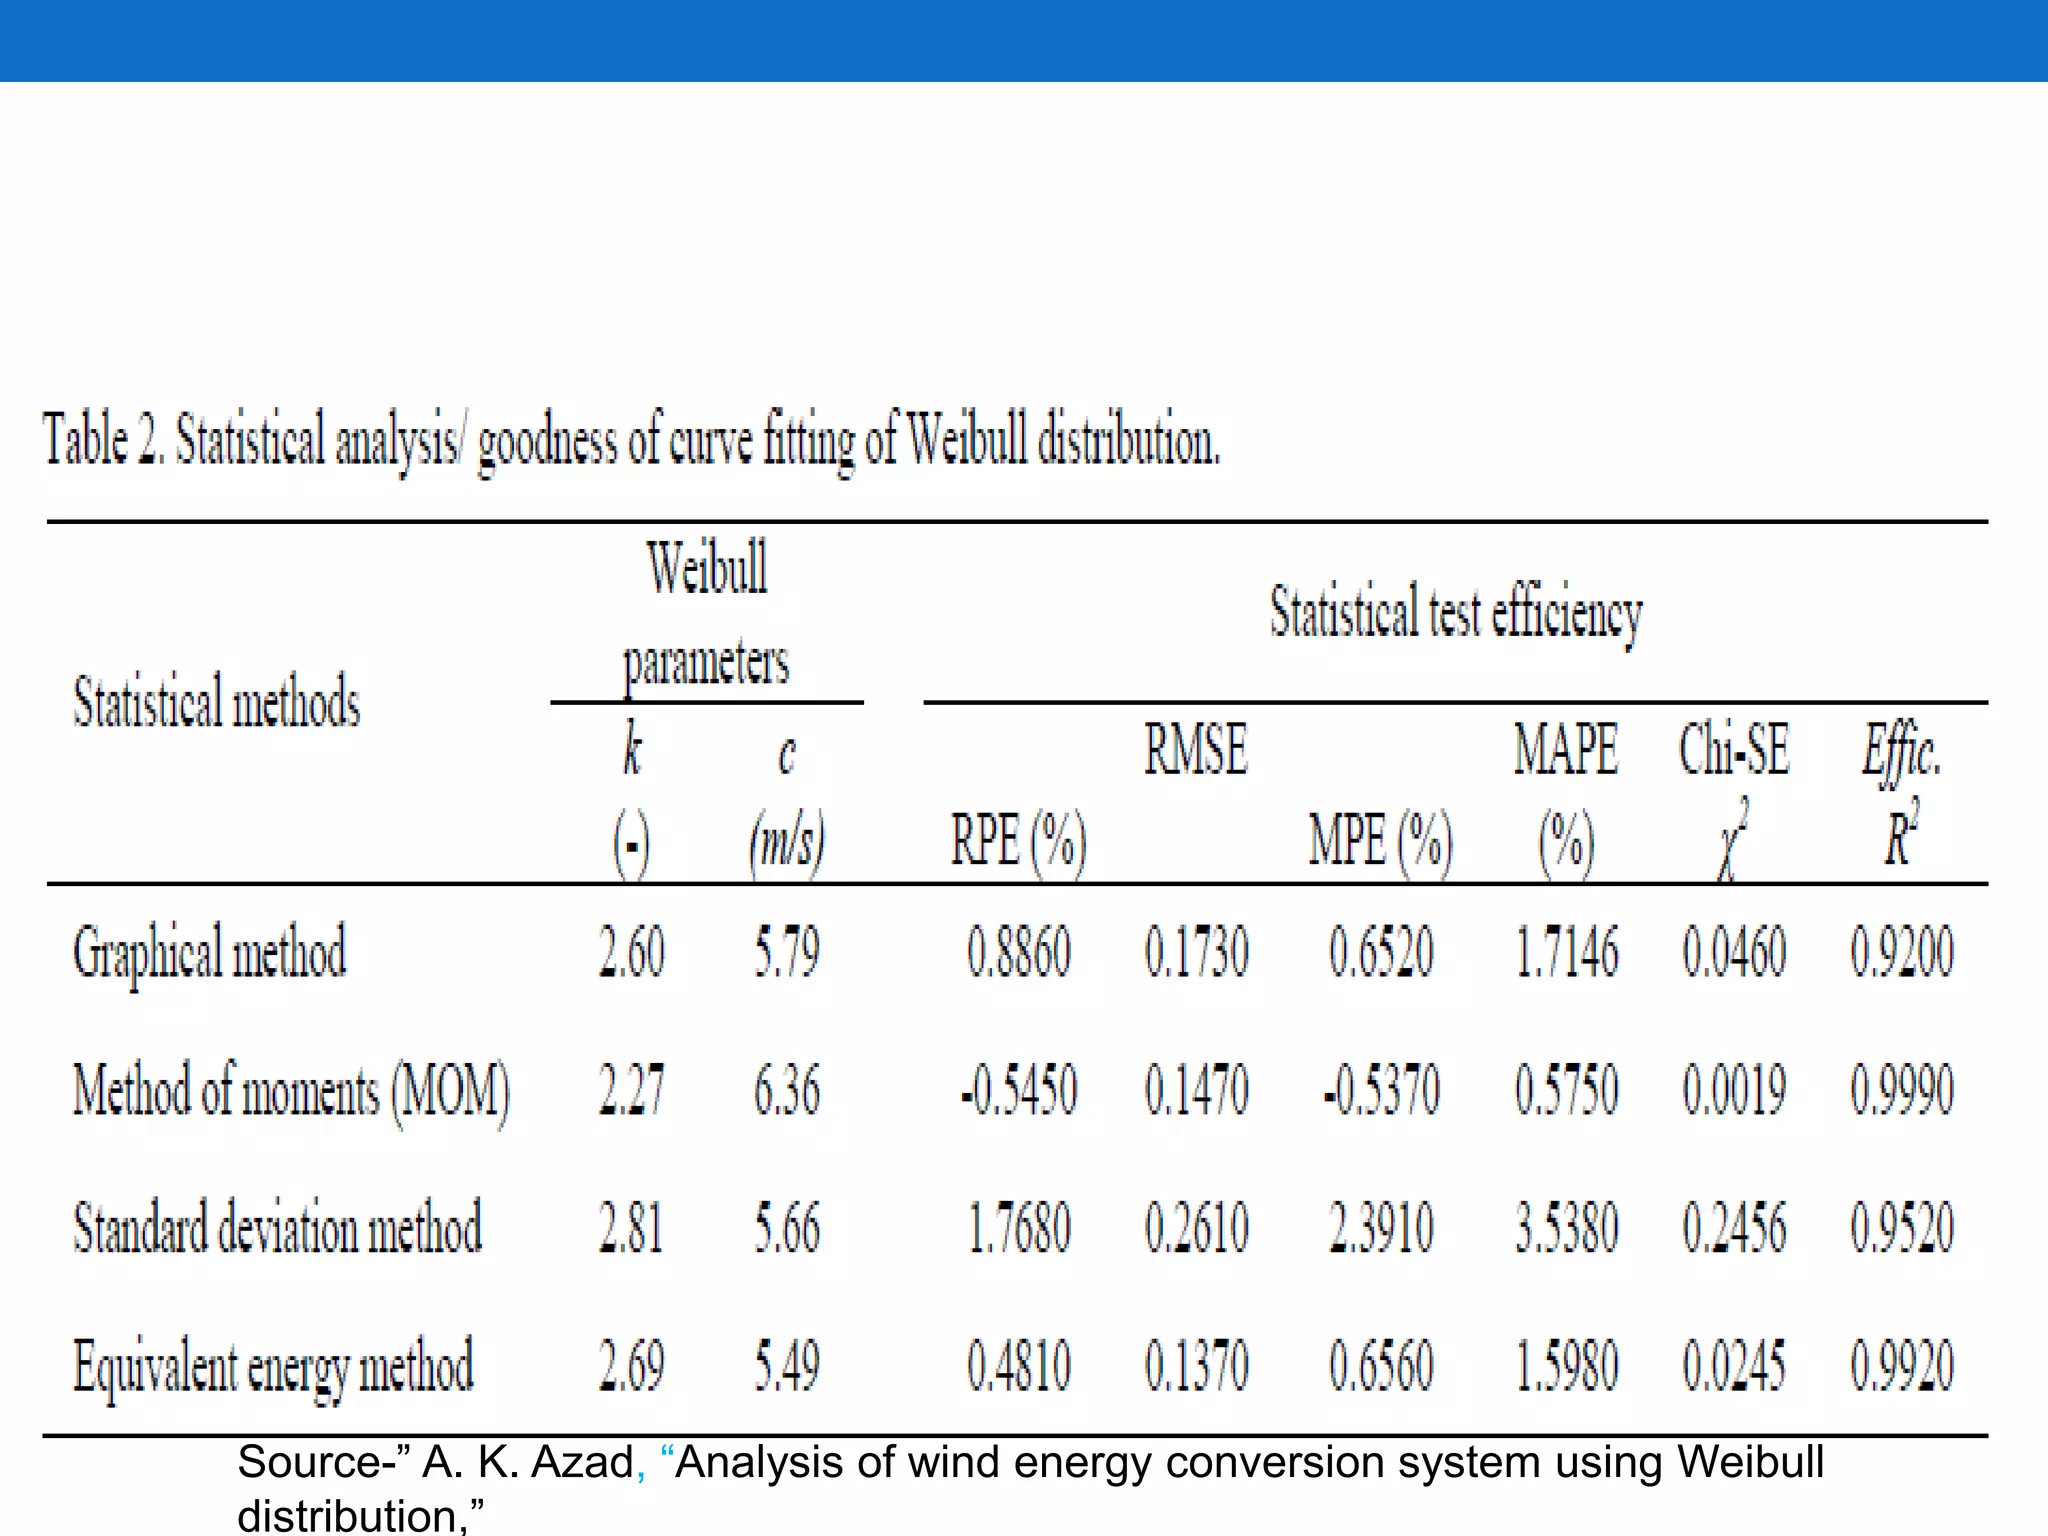
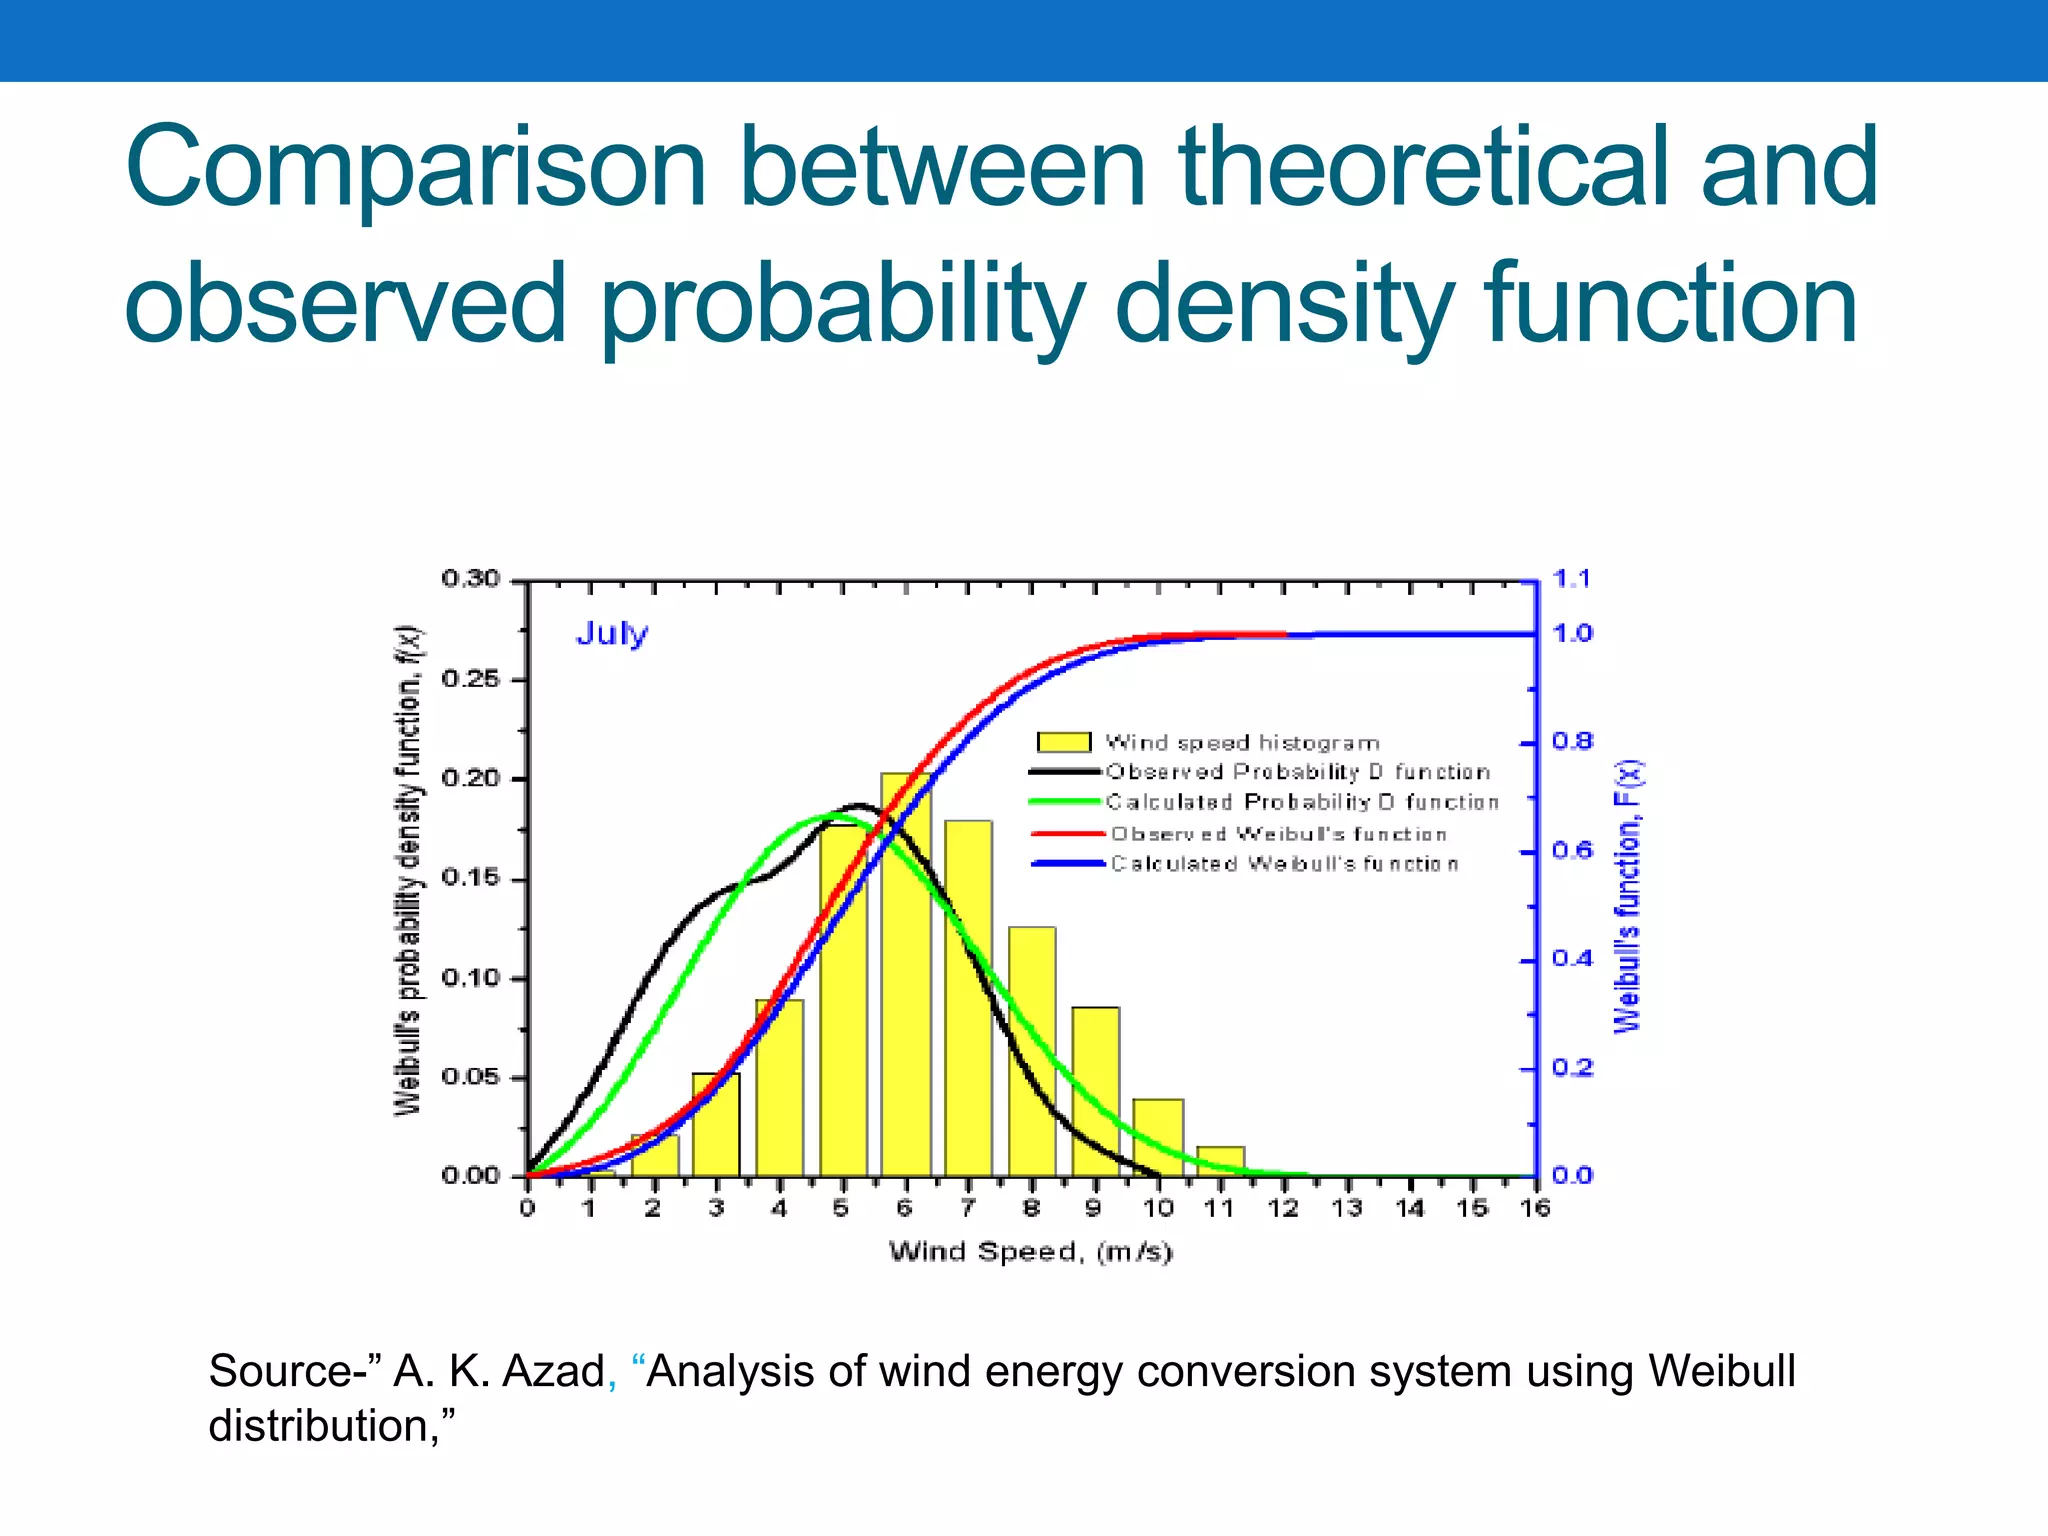
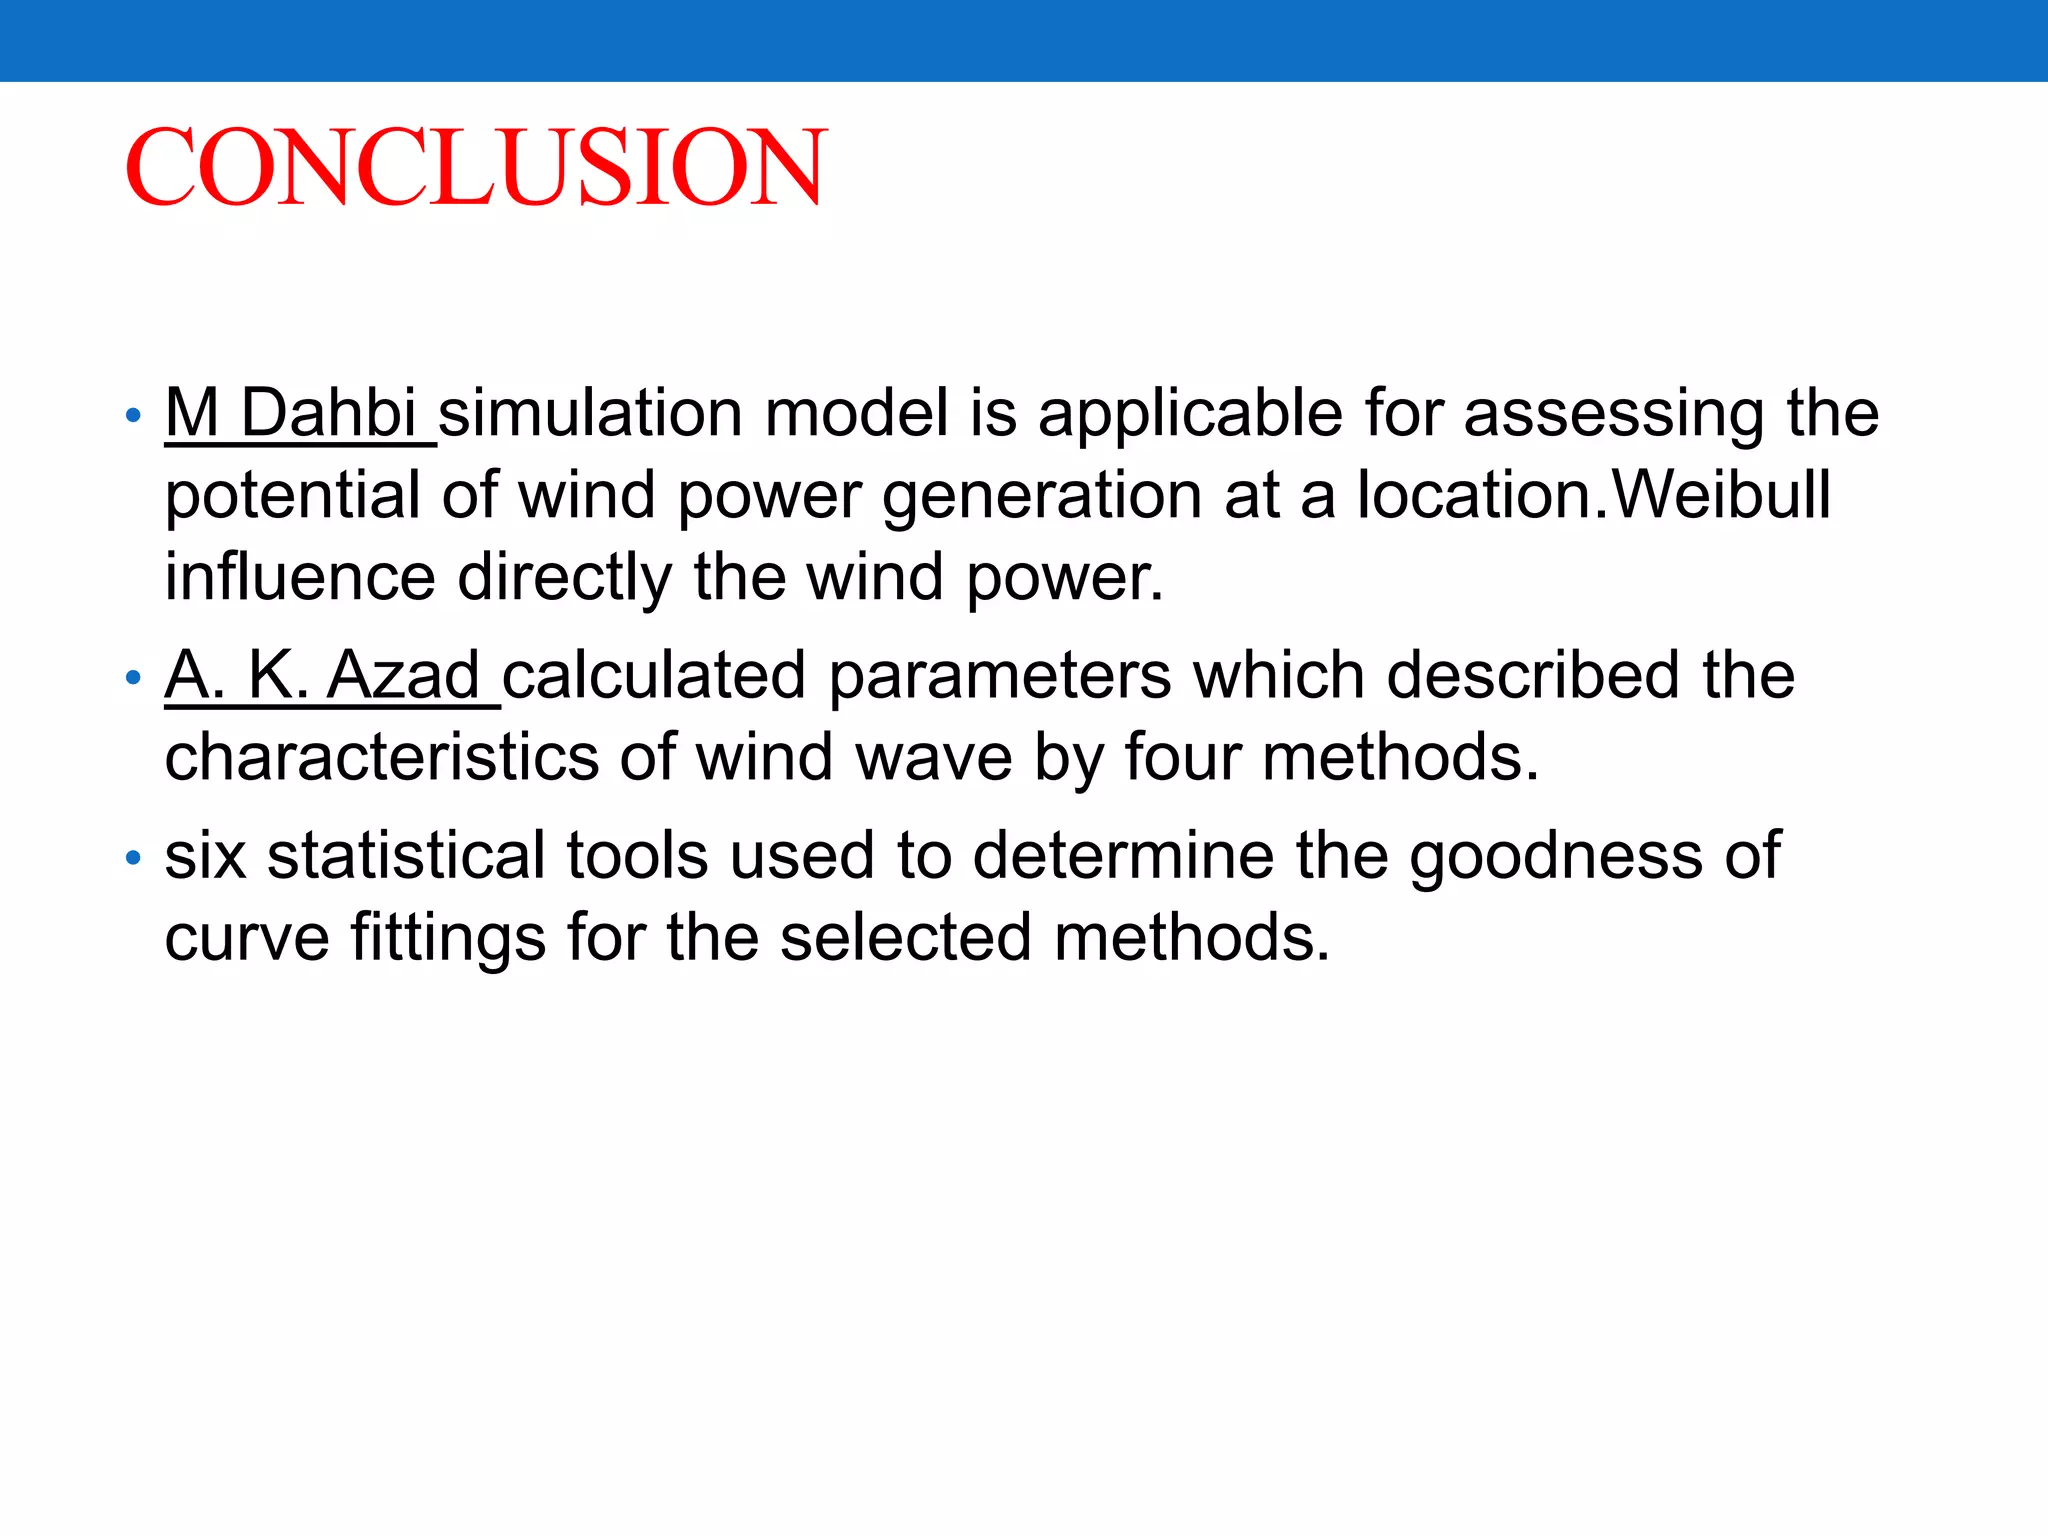
AnAnalysisOfWindEnergyPotentialusing
weibulldistribution
PREPARED BY - TARUN B PATEL
ME ENERGY
GEC VALSAD
140190739009
GUIDED BY- PROF SANDIP T PATEL
Contents
INTRODUCTION
WEIBULL DENSITY FUNCTION
METHODS FOR DETERMINE C AND K
METHODS OF MOMENTS
WIND POWER POTENTIAL ANALYSIS
CONCLUSION
Research Paper
1. A. K. Azada*, M. G. Rasul, M. M. Alam, S. M.
Ameer Uddin, Sukanta Kumar Mondal, ”
Analysis of wind energy conversion system
using Weibull distribution”, Procedia
Engineering 90 ( 2014 ) 725 – 732.
2. M. Dahbi, a. Benatiallah; m.SELLAM, “the
analysis of wind power potential in sahara site
of algeria-an estimation using the ‘weibull’
dens,ity function”, energy procedia 36 ( 2013 )
179 – 188.
Introduction
• M. DAHBI used The Weibull density function to estimate
the monthly power wind density and to determine the
characteristics of monthly parameters of Weibull.
• A simulation model established to describe the
characteristics of a particular wind turbine.
• The monthly power generated and the monthly operating
hours by the wind turbine to be simulated.
• Simulation is performed using Matlab software
environment.
Conti…
• A.K.Azad analysed the wind speed data statistically using
Weibull distribution to find out wind energy conversion
characteristics.
• Two important parameters like Weibull shape factor “k”
and Weibull scale factor “c” have been calculated by four
methods.
• The probability density function f(x), cumulative
distribution function or Weibull function F(x) have been
used to describe the best wind distribution between
observed and theoretically calculated data.
• six statistical tools used to analyse the goodness of curve
fittings and precisely rank the methods.
Weibull Density Function
• The wind speed probability density function
• Where
f(v) = the probability of observing wind speed v.
c = Weibull scale parameter
k = dimensionless Weibull shape parameter.
• Weibull’s cumulative distribution function
Methods For Determination C And K
Graphical method (GM)
Method of moments (MOM)
Empirical method
Equivalent energy method
Empirical Method
Conti...
• Wind Power
• The wind power density
• The wind energy available over a period
Wind Power Potential Analysis
• Yearly Weibull density function
Source-” M. Dahbi, A. Benatiallah; M.SELLAM, “The Analysis Of Wind Power
Potential In Sahara Site Of Algeria-an Estimation Using The ‘Weibull’ Dens,ity
Function”, Energy Procedia 36 ( 2013 ) 179 – 188,”
• Monthly Weibull parameters and wind power density
Source-” M. Dahbi, A. Benatiallah; M.SELLAM, “The Analysis Of Wind Power
Potential In Sahara Site Of Algeria-an Estimation Using The ‘Weibull’ Dens,ity
Function”, Energy Procedia 36 ( 2013 ) 179 – 188,”
Analysis-2
Source-” A. K. Azad, “Analysis of wind energy conversion system using Weibull
distribution,”
Source-” A. K. Azad, “Analysis of wind energy conversion system using Weibull
distribution,”
Comparison between theoretical and
observed probability density function
Source-” A. K. Azad, “Analysis of wind energy conversion system using Weibull
distribution,”
CONCLUSION
• M Dahbi simulation model is applicable for assessing the
potential of wind power generation at a location.Weibull
influence directly the wind power.
• A. K. Azad calculated parameters which described the
characteristics of wind wave by four methods.
• six statistical tools used to determine the goodness of
curve fittings for the selected methods.
REFERENCES
1. A. K. Azada*, M. G. Rasul, M. M. Alam, S. M. Ameer
Uddin, Sukanta Kumar Mondal, ” Analysis of wind
energy conversion system using Weibull distribution”,
Procedia Engineering 90 ( 2014 ) 725 – 732.
2. M. Dahbi, a. Benatiallah; m.SELLAM, “the analysis of
wind power potential in sahara site of algeria-an
estimation using the ‘weibull’ dens,ity function”, energy
procedia 36 ( 2013 ) 179 – 188.
THANK U

an analysis of wind energy potential using weibull distribution

  • 1.
    AnAnalysisOfWindEnergyPotentialusing weibulldistribution PREPARED BY -TARUN B PATEL ME ENERGY GEC VALSAD 140190739009 GUIDED BY- PROF SANDIP T PATEL
  • 2.
    Contents INTRODUCTION WEIBULL DENSITY FUNCTION METHODSFOR DETERMINE C AND K METHODS OF MOMENTS WIND POWER POTENTIAL ANALYSIS CONCLUSION
  • 3.
    Research Paper 1. A.K. Azada*, M. G. Rasul, M. M. Alam, S. M. Ameer Uddin, Sukanta Kumar Mondal, ” Analysis of wind energy conversion system using Weibull distribution”, Procedia Engineering 90 ( 2014 ) 725 – 732. 2. M. Dahbi, a. Benatiallah; m.SELLAM, “the analysis of wind power potential in sahara site of algeria-an estimation using the ‘weibull’ dens,ity function”, energy procedia 36 ( 2013 ) 179 – 188.
  • 4.
    Introduction • M. DAHBIused The Weibull density function to estimate the monthly power wind density and to determine the characteristics of monthly parameters of Weibull. • A simulation model established to describe the characteristics of a particular wind turbine. • The monthly power generated and the monthly operating hours by the wind turbine to be simulated. • Simulation is performed using Matlab software environment.
  • 5.
    Conti… • A.K.Azad analysedthe wind speed data statistically using Weibull distribution to find out wind energy conversion characteristics. • Two important parameters like Weibull shape factor “k” and Weibull scale factor “c” have been calculated by four methods. • The probability density function f(x), cumulative distribution function or Weibull function F(x) have been used to describe the best wind distribution between observed and theoretically calculated data. • six statistical tools used to analyse the goodness of curve fittings and precisely rank the methods.
  • 6.
    Weibull Density Function •The wind speed probability density function • Where f(v) = the probability of observing wind speed v. c = Weibull scale parameter k = dimensionless Weibull shape parameter. • Weibull’s cumulative distribution function
  • 7.
    Methods For DeterminationC And K Graphical method (GM) Method of moments (MOM) Empirical method Equivalent energy method
  • 8.
  • 9.
    Conti... • Wind Power •The wind power density • The wind energy available over a period
  • 10.
    Wind Power PotentialAnalysis • Yearly Weibull density function Source-” M. Dahbi, A. Benatiallah; M.SELLAM, “The Analysis Of Wind Power Potential In Sahara Site Of Algeria-an Estimation Using The ‘Weibull’ Dens,ity Function”, Energy Procedia 36 ( 2013 ) 179 – 188,”
  • 11.
    • Monthly Weibullparameters and wind power density Source-” M. Dahbi, A. Benatiallah; M.SELLAM, “The Analysis Of Wind Power Potential In Sahara Site Of Algeria-an Estimation Using The ‘Weibull’ Dens,ity Function”, Energy Procedia 36 ( 2013 ) 179 – 188,”
  • 12.
    Analysis-2 Source-” A. K.Azad, “Analysis of wind energy conversion system using Weibull distribution,”
  • 13.
    Source-” A. K.Azad, “Analysis of wind energy conversion system using Weibull distribution,”
  • 14.
    Comparison between theoreticaland observed probability density function Source-” A. K. Azad, “Analysis of wind energy conversion system using Weibull distribution,”
  • 15.
    CONCLUSION • M Dahbisimulation model is applicable for assessing the potential of wind power generation at a location.Weibull influence directly the wind power. • A. K. Azad calculated parameters which described the characteristics of wind wave by four methods. • six statistical tools used to determine the goodness of curve fittings for the selected methods.
  • 16.
    REFERENCES 1. A. K.Azada*, M. G. Rasul, M. M. Alam, S. M. Ameer Uddin, Sukanta Kumar Mondal, ” Analysis of wind energy conversion system using Weibull distribution”, Procedia Engineering 90 ( 2014 ) 725 – 732. 2. M. Dahbi, a. Benatiallah; m.SELLAM, “the analysis of wind power potential in sahara site of algeria-an estimation using the ‘weibull’ dens,ity function”, energy procedia 36 ( 2013 ) 179 – 188.
  • 17.

Editor's Notes

  • #7 Where, v is the wind speed in m/s, k> 0 is the dimensionless shape parameter, and c > 0 is the scale parameter with the same unit as wind speed Basically , the scale parameter, c indicates how ‘windy’ a wind location under consideration is, whereas the shape parameter, k , indicates how peaked the wind distrubution is (i.e. if the wind speeds tend to be very close to a certain value, the distribution will have a high k value and be very peaked)
  • #8 The Weibull paper is constructed in such a way that the cumulative Weibull distribution becomes a straight line, with the shape factor k as its slope. Taking logarithm in both sides of the The method of moments is one of the common techniques used in the field of parameter estimation. If 􀢜􀴥represent the mean wind speed data then the value of k and c can be easily determined by the following equations
  • #10 The wind power ( v P ) available per unit area of the rotor in the wind stream of velocity v is described as eq where 􀁕 is air density. Thus the wind power density of a site based on a Weibull probability density function can be expressed as eq. where 􀀪 is the Gamma function. Furthermore wind power density of a site is given; the wind energy available over a period, IE (a month or a year) can be expressed as eq where T is the time period. For example, T is taken as 8,760 h when we calculate the energy on annual.
  • #11 The Adrar(South West Algerian) in new valley meteorological data collected during 8760hours by a wind observation station web site weather underground (The global whether data could be obtained from internet ) is used for analysis in this paper The calculation results meet the Weibull distribution. From the recorded wind data , the shape parameter k is found to be 2.08, and the scale parameter c is 6.66m/s using Equ.1-3.The distribution is shown in fig1.
  • #12 Once the monthly mean wind speed and the variance are known, the monthly probability density can be obtained, as shown in table 1. The results show that the parameters are distinctive for different months in a year, which means the monthly wind speed distribution differs over a whole year. It is clear that the mean wind speed increases during spring months and decrease during Autumns months. For comparison, tow typical monthly Weibull distribution with different shape and scale parameters are given in fig.2. It is clear from the figure that the value of c is low in September and most of the wind speeds are in the lower For different months, the monthly power generated is calculated and the results are given in fig4. The highest power output is generated in June , while the lowest in September. The trend is similar to that for power density, but with some difference. This is because the power generated by a wind turbine is determined not only by the wind speed’s Weibull function (parameters c and k),but also by the characteristics of wind turbines, while power density is determined only by the weibull distribution (c and k). speed range, but in June the value is highest. Using Eq.(5), the average annual wind power density is found as 231w/m^2 , so that the power potential is 1774.08 kWh/m2 per year . With the above equation and the monthly Weibull parameters, the monthly wind power density can also be calculated. The results are given in fig.3 and tabl.1 It is clear from the results that the mean wind speed and average wind power density are distinctive for different months. In February to June, the wind power is high, but low in the autumn months. curves have similar changing trend, but the rate of change is not the same. This is because, for the power density, it is determined not only by the mean speed bat also by the Weibull shape parameter k.