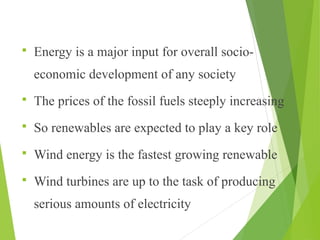
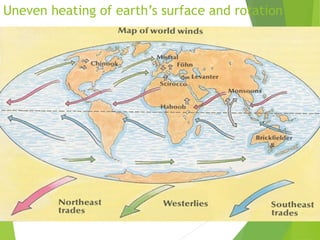
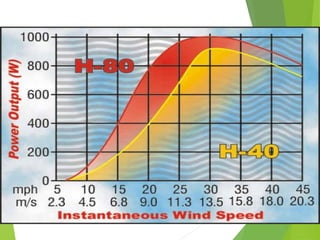
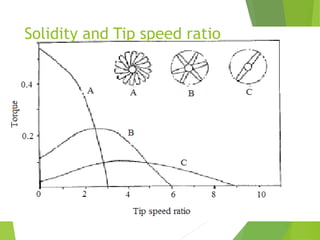
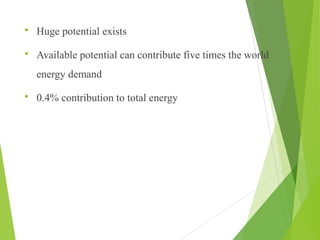
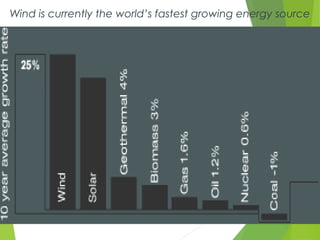
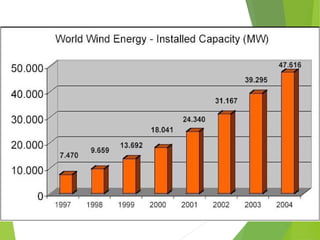
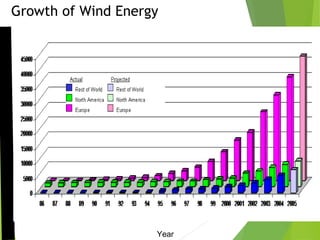
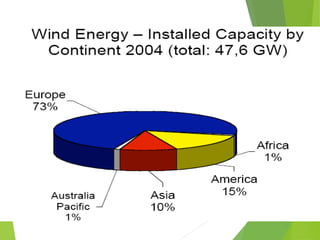
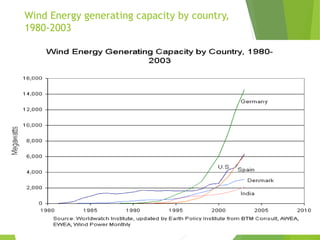
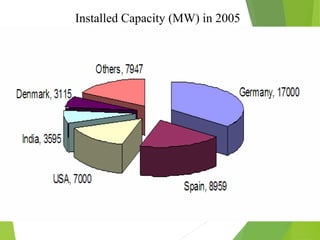
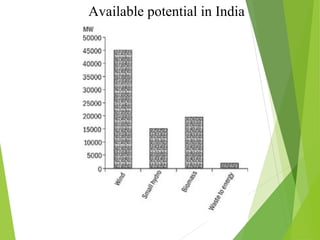
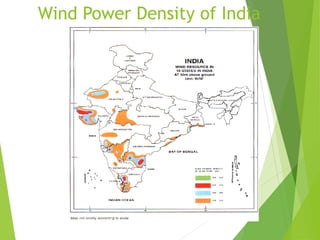
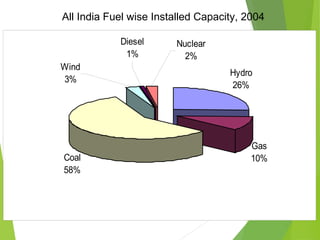
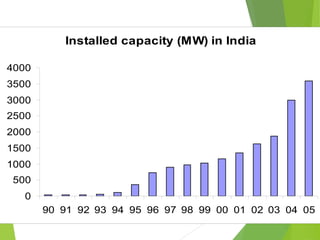
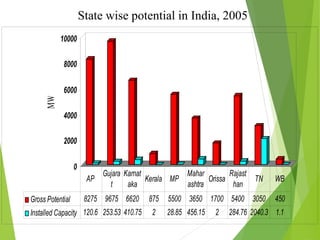
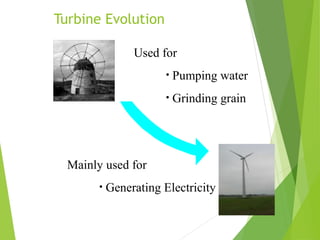
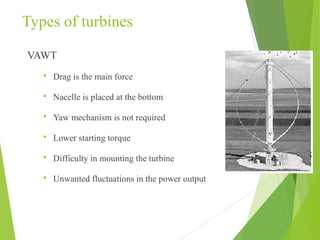
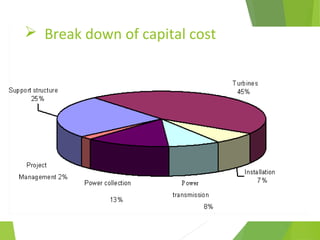
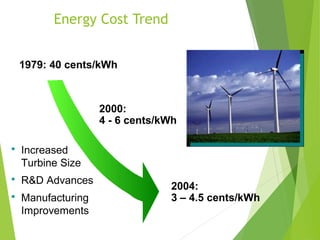
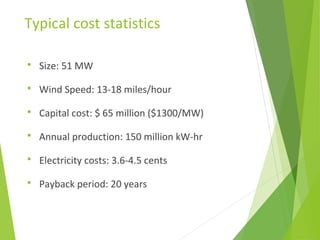
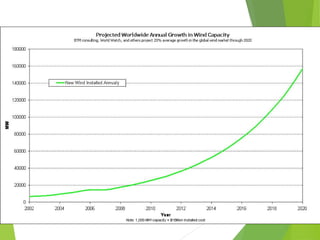
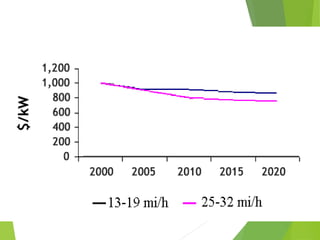
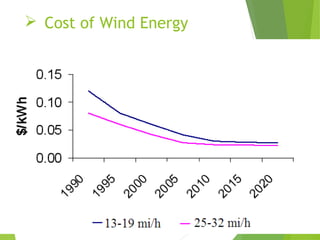
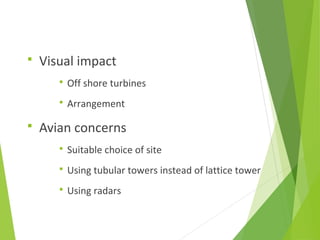
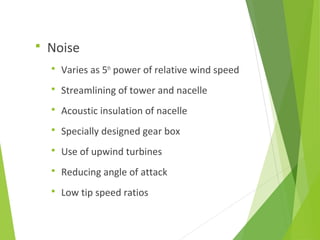
Introduction
Wind Energy
Presentation
on
 Energy is a major input for overall socio-
economic development of any society
 The prices of the fossil fuels steeply increasing
 So renewables are expected to play a key role
 Wind energy is the fastest growing renewable
 Wind turbines are up to the task of producing
serious amounts of electricity
Principles
Uneven heating of earth’s surface and rotation
Force Strength km/h Effect
0 Calm 0-1 Smoke rises vertically
1 Light air 1-5 Smoke drifts slowly
2 Light breeze 6-11 Wind felt on face; leaves rustle
3 Gentle breeze 12-19 Twigs move; light flag unfurls
4 Moderate breeze 20-29 Dust and paper blown about; small branches move
5 Fresh breeze 30-39 Wavelets on inland water; small trees move
6 Strong breeze 40-50 Large branches sway; umbrellas turn inside out
7 Near gale 51-61 Whole trees sway; difficult to walk against wind
8 Gale 62-74 Twigs break off trees; walking very hard
9 Strong gale 75-87 Chimney pots, roof tiles and branches blown down
10 Storm 88-101 Widespread damage to buildings
11 Violent Storm 102-117 Widespread damage to buildings
12 Hurricane Over 119 Devastation
Beaufort Scale
Power vs. Velocity
Solidity and Tip speed ratio
Potential
 Huge potential exists
 Available potential can contribute five times the world
energy demand
 0.4% contribution to total energy
Wind is currently the world’s fastest growing energy source
Growth of Wind EnergyMWInstalled
Year
Wind Energy generating capacity by country,
1980-2003
Installed Capacity (MW) in 2005
Available potential in India
Wind Power Density of India
All India Fuel wise Installed Capacity, 2004
Hydro
26%
Gas
10%Coal
58%
Nuclear
2%
Wind
3%
Diesel
1%
Installed capacity (MW) in India
0
500
1000
1500
2000
2500
3000
3500
4000
90 91 92 93 94 95 96 97 98 99 00 01 02 03 04 05
State wise potential in India, 2005
0
2000
4000
6000
8000
10000
Gross Potential 8275 9675 6620 875 5500 3650 1700 5400 3050 450
Installed Capacity 120.6 253.53 410.75 2 28.85 456.15 2 284.76 2040.3 1.1
AP
Gujara
t
Karnat
aka
Kerala MP
Mahar
ashtra
Orissa
Rajast
han
TN WB
MW
Technology
Turbine Evolution
Used for
• Pumping water
• Grinding grain
Mainly used for
• Generating Electricity
Types of turbines
VAWT
 Drag is the main force
 Nacelle is placed at the bottom
 Yaw mechanism is not required
 Lower starting torque
 Difficulty in mounting the turbine
 Unwanted fluctuations in the power output
HAWT
 Lift is the main force
 Much lower cyclic stresses
 95% of the existing turbines are HAWTs
 Nacelle is placed at the top of the tower
 Yaw mechanism is required
Two types of HAWT
DOWNWIND TURBINE UPWIND TURBINE
 Counter Rotating HAWT
 Increase the rotation speed
 Rear one is smaller and stalls at high
wind speeds
 Operates for wider range of wind speeds
Offshore turbines
 More wind speeds
 Less noise pollution
 Less visual impact
 Difficult to install and maintain
 Energy losses due long distance transport
A Typical HAWT
Turbine design and
construction
 Blades
 Material used
 Typical length
 Tower heightTower height
 Heights twice the blade length are found
economical
 Number of blades
 Three blade HAWT are most efficient
 Two blade turbines don’t require a hub
 As the number increases; noise, wear and
cost increase and efficiency decreases
 Multiple blade turbines are generally used
for water pumping purposes
 Rotational control
 Maintenance
 Noise reduction
 Centripetal force reduction
 Mechanisms
 Stalling
 Furling
 Yaw Mechanism
 To turn the turbine against the wind
 Yaw error and fatigue loads
 Uses electric motors and gear boxes
 Wind turbine safety
 Sensors – controlling vibrations
 Over speed protection
 Aero dynamic braking
 Mechanical braking
Improvements
 Concentrators
Future Wind Turbines
Wind Amplified Rotor Platform
 Disc type wind turbine
 Much more efficient than HAWT
 Requires less height
 Low noise
 Works in any wind direction
Economics
 Determining Factors
 Wind Speed
 Turbine design and construction
 Rated capacity of the turbine
 Exact Location
 Improvements in turbine design
 Capital
 Wind Speed Matters
Assuming the
same size
project, the
better the
wind
resource, the
lower the
cost.
 Size Matters
Assuming the
same wind speed
of 8.08 m/s, a
large wind farm is
more economical
 Break down of capital cost
Energy Cost Trend
1979: 40 cents/kWh
 Increased
Turbine Size
 R&D Advances
 Manufacturing
Improvements
2004:
3 – 4.5 cents/kWh
2000:
4 - 6 cents/kWh
Typical cost statistics
 Size: 51 MW
 Wind Speed: 13-18 miles/hour
 Capital cost: $ 65 million ($1300/MW)
 Annual production: 150 million kW-hr
 Electricity costs: 3.6-4.5 cents
 Payback period: 20 years
Future
Wind Capital Cost
 Cost of Wind Energy
Typical Concerns
 Visual impact
 Off shore turbines
 Arrangement
 Avian concerns
 Suitable choice of site
 Using tubular towers instead of lattice tower
 Using radars
 Noise
 Varies as 5th
power of relative wind speed
 Streamlining of tower and nacelle
 Acoustic insulation of nacelle
 Specially designed gear box
 Use of upwind turbines
 Reducing angle of attack
 Low tip speed ratios
 Changes in wind patterns
 Reducing turbulence
 Intermittent
 Coupling with hydro or solar energy
 TV, microwave, radar interference
 Switching from conducting material to non-
conducting and composite material
Conclusion
 Wind energy is pollution free and nature friendly
 Wind energy has very good potential and it is the fastest
growing energy source
 The future looks bright for wind energy because technology
is becoming more advanced and windmills are becoming
more efficient
THANK YOU

Wind Energy

  • 1.
  • 2.
     Energy isa major input for overall socio- economic development of any society  The prices of the fossil fuels steeply increasing  So renewables are expected to play a key role  Wind energy is the fastest growing renewable  Wind turbines are up to the task of producing serious amounts of electricity
  • 3.
  • 4.
    Uneven heating ofearth’s surface and rotation
  • 5.
    Force Strength km/hEffect 0 Calm 0-1 Smoke rises vertically 1 Light air 1-5 Smoke drifts slowly 2 Light breeze 6-11 Wind felt on face; leaves rustle 3 Gentle breeze 12-19 Twigs move; light flag unfurls 4 Moderate breeze 20-29 Dust and paper blown about; small branches move 5 Fresh breeze 30-39 Wavelets on inland water; small trees move 6 Strong breeze 40-50 Large branches sway; umbrellas turn inside out 7 Near gale 51-61 Whole trees sway; difficult to walk against wind 8 Gale 62-74 Twigs break off trees; walking very hard 9 Strong gale 75-87 Chimney pots, roof tiles and branches blown down 10 Storm 88-101 Widespread damage to buildings 11 Violent Storm 102-117 Widespread damage to buildings 12 Hurricane Over 119 Devastation Beaufort Scale
  • 6.
  • 7.
    Solidity and Tipspeed ratio
  • 8.
  • 9.
     Huge potentialexists  Available potential can contribute five times the world energy demand  0.4% contribution to total energy
  • 10.
    Wind is currentlythe world’s fastest growing energy source
  • 12.
    Growth of WindEnergyMWInstalled Year
  • 14.
    Wind Energy generatingcapacity by country, 1980-2003
  • 15.
  • 16.
  • 17.
  • 18.
    All India Fuelwise Installed Capacity, 2004 Hydro 26% Gas 10%Coal 58% Nuclear 2% Wind 3% Diesel 1%
  • 19.
    Installed capacity (MW)in India 0 500 1000 1500 2000 2500 3000 3500 4000 90 91 92 93 94 95 96 97 98 99 00 01 02 03 04 05
  • 20.
    State wise potentialin India, 2005 0 2000 4000 6000 8000 10000 Gross Potential 8275 9675 6620 875 5500 3650 1700 5400 3050 450 Installed Capacity 120.6 253.53 410.75 2 28.85 456.15 2 284.76 2040.3 1.1 AP Gujara t Karnat aka Kerala MP Mahar ashtra Orissa Rajast han TN WB MW
  • 21.
  • 22.
    Turbine Evolution Used for •Pumping water • Grinding grain Mainly used for • Generating Electricity
  • 23.
    Types of turbines VAWT Drag is the main force  Nacelle is placed at the bottom  Yaw mechanism is not required  Lower starting torque  Difficulty in mounting the turbine  Unwanted fluctuations in the power output
  • 24.
    HAWT  Lift isthe main force  Much lower cyclic stresses  95% of the existing turbines are HAWTs  Nacelle is placed at the top of the tower  Yaw mechanism is required
  • 25.
    Two types ofHAWT DOWNWIND TURBINE UPWIND TURBINE
  • 26.
     Counter RotatingHAWT  Increase the rotation speed  Rear one is smaller and stalls at high wind speeds  Operates for wider range of wind speeds
  • 27.
    Offshore turbines  Morewind speeds  Less noise pollution  Less visual impact  Difficult to install and maintain  Energy losses due long distance transport
  • 28.
  • 29.
    Turbine design and construction Blades  Material used  Typical length  Tower heightTower height  Heights twice the blade length are found economical
  • 30.
     Number ofblades  Three blade HAWT are most efficient  Two blade turbines don’t require a hub  As the number increases; noise, wear and cost increase and efficiency decreases  Multiple blade turbines are generally used for water pumping purposes
  • 31.
     Rotational control Maintenance  Noise reduction  Centripetal force reduction  Mechanisms  Stalling  Furling
  • 32.
     Yaw Mechanism To turn the turbine against the wind  Yaw error and fatigue loads  Uses electric motors and gear boxes  Wind turbine safety  Sensors – controlling vibrations  Over speed protection  Aero dynamic braking  Mechanical braking
  • 33.
  • 34.
    Future Wind Turbines WindAmplified Rotor Platform
  • 35.
     Disc typewind turbine  Much more efficient than HAWT  Requires less height  Low noise  Works in any wind direction
  • 36.
  • 37.
     Determining Factors Wind Speed  Turbine design and construction  Rated capacity of the turbine  Exact Location  Improvements in turbine design  Capital
  • 38.
     Wind SpeedMatters Assuming the same size project, the better the wind resource, the lower the cost.
  • 39.
     Size Matters Assumingthe same wind speed of 8.08 m/s, a large wind farm is more economical
  • 40.
     Break downof capital cost
  • 41.
    Energy Cost Trend 1979:40 cents/kWh  Increased Turbine Size  R&D Advances  Manufacturing Improvements 2004: 3 – 4.5 cents/kWh 2000: 4 - 6 cents/kWh
  • 42.
    Typical cost statistics Size: 51 MW  Wind Speed: 13-18 miles/hour  Capital cost: $ 65 million ($1300/MW)  Annual production: 150 million kW-hr  Electricity costs: 3.6-4.5 cents  Payback period: 20 years
  • 43.
  • 45.
  • 46.
     Cost ofWind Energy
  • 47.
  • 48.
     Visual impact Off shore turbines  Arrangement  Avian concerns  Suitable choice of site  Using tubular towers instead of lattice tower  Using radars
  • 49.
     Noise  Variesas 5th power of relative wind speed  Streamlining of tower and nacelle  Acoustic insulation of nacelle  Specially designed gear box  Use of upwind turbines  Reducing angle of attack  Low tip speed ratios
  • 50.
     Changes inwind patterns  Reducing turbulence  Intermittent  Coupling with hydro or solar energy  TV, microwave, radar interference  Switching from conducting material to non- conducting and composite material
  • 51.
  • 52.
     Wind energyis pollution free and nature friendly  Wind energy has very good potential and it is the fastest growing energy source  The future looks bright for wind energy because technology is becoming more advanced and windmills are becoming more efficient
  • 53.