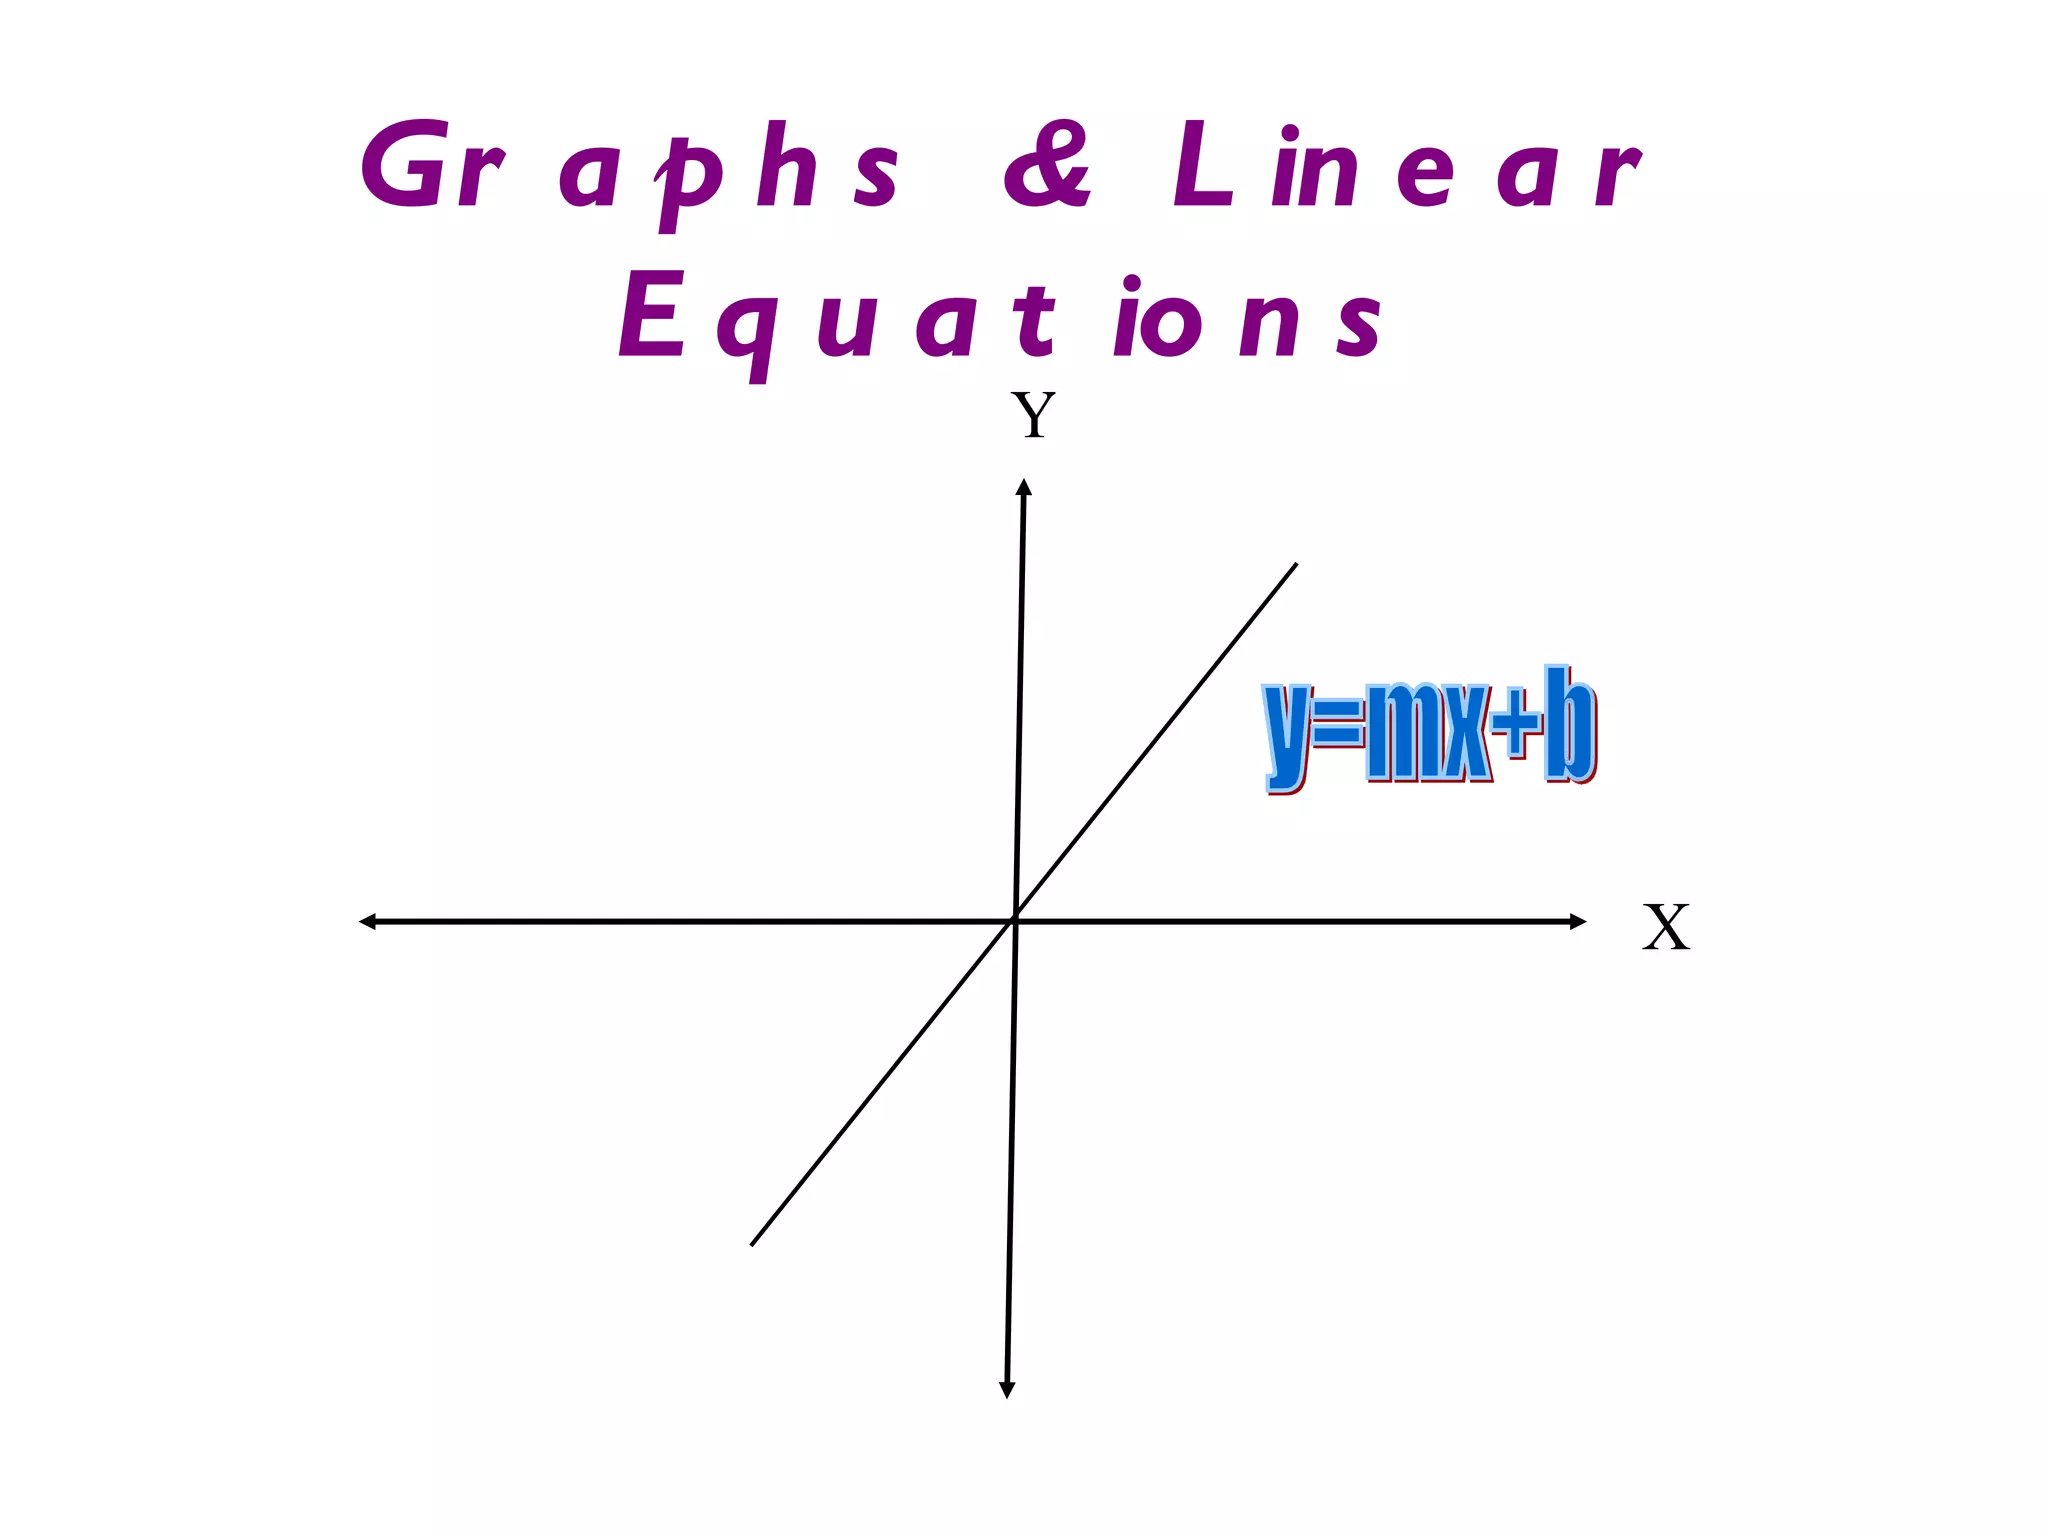
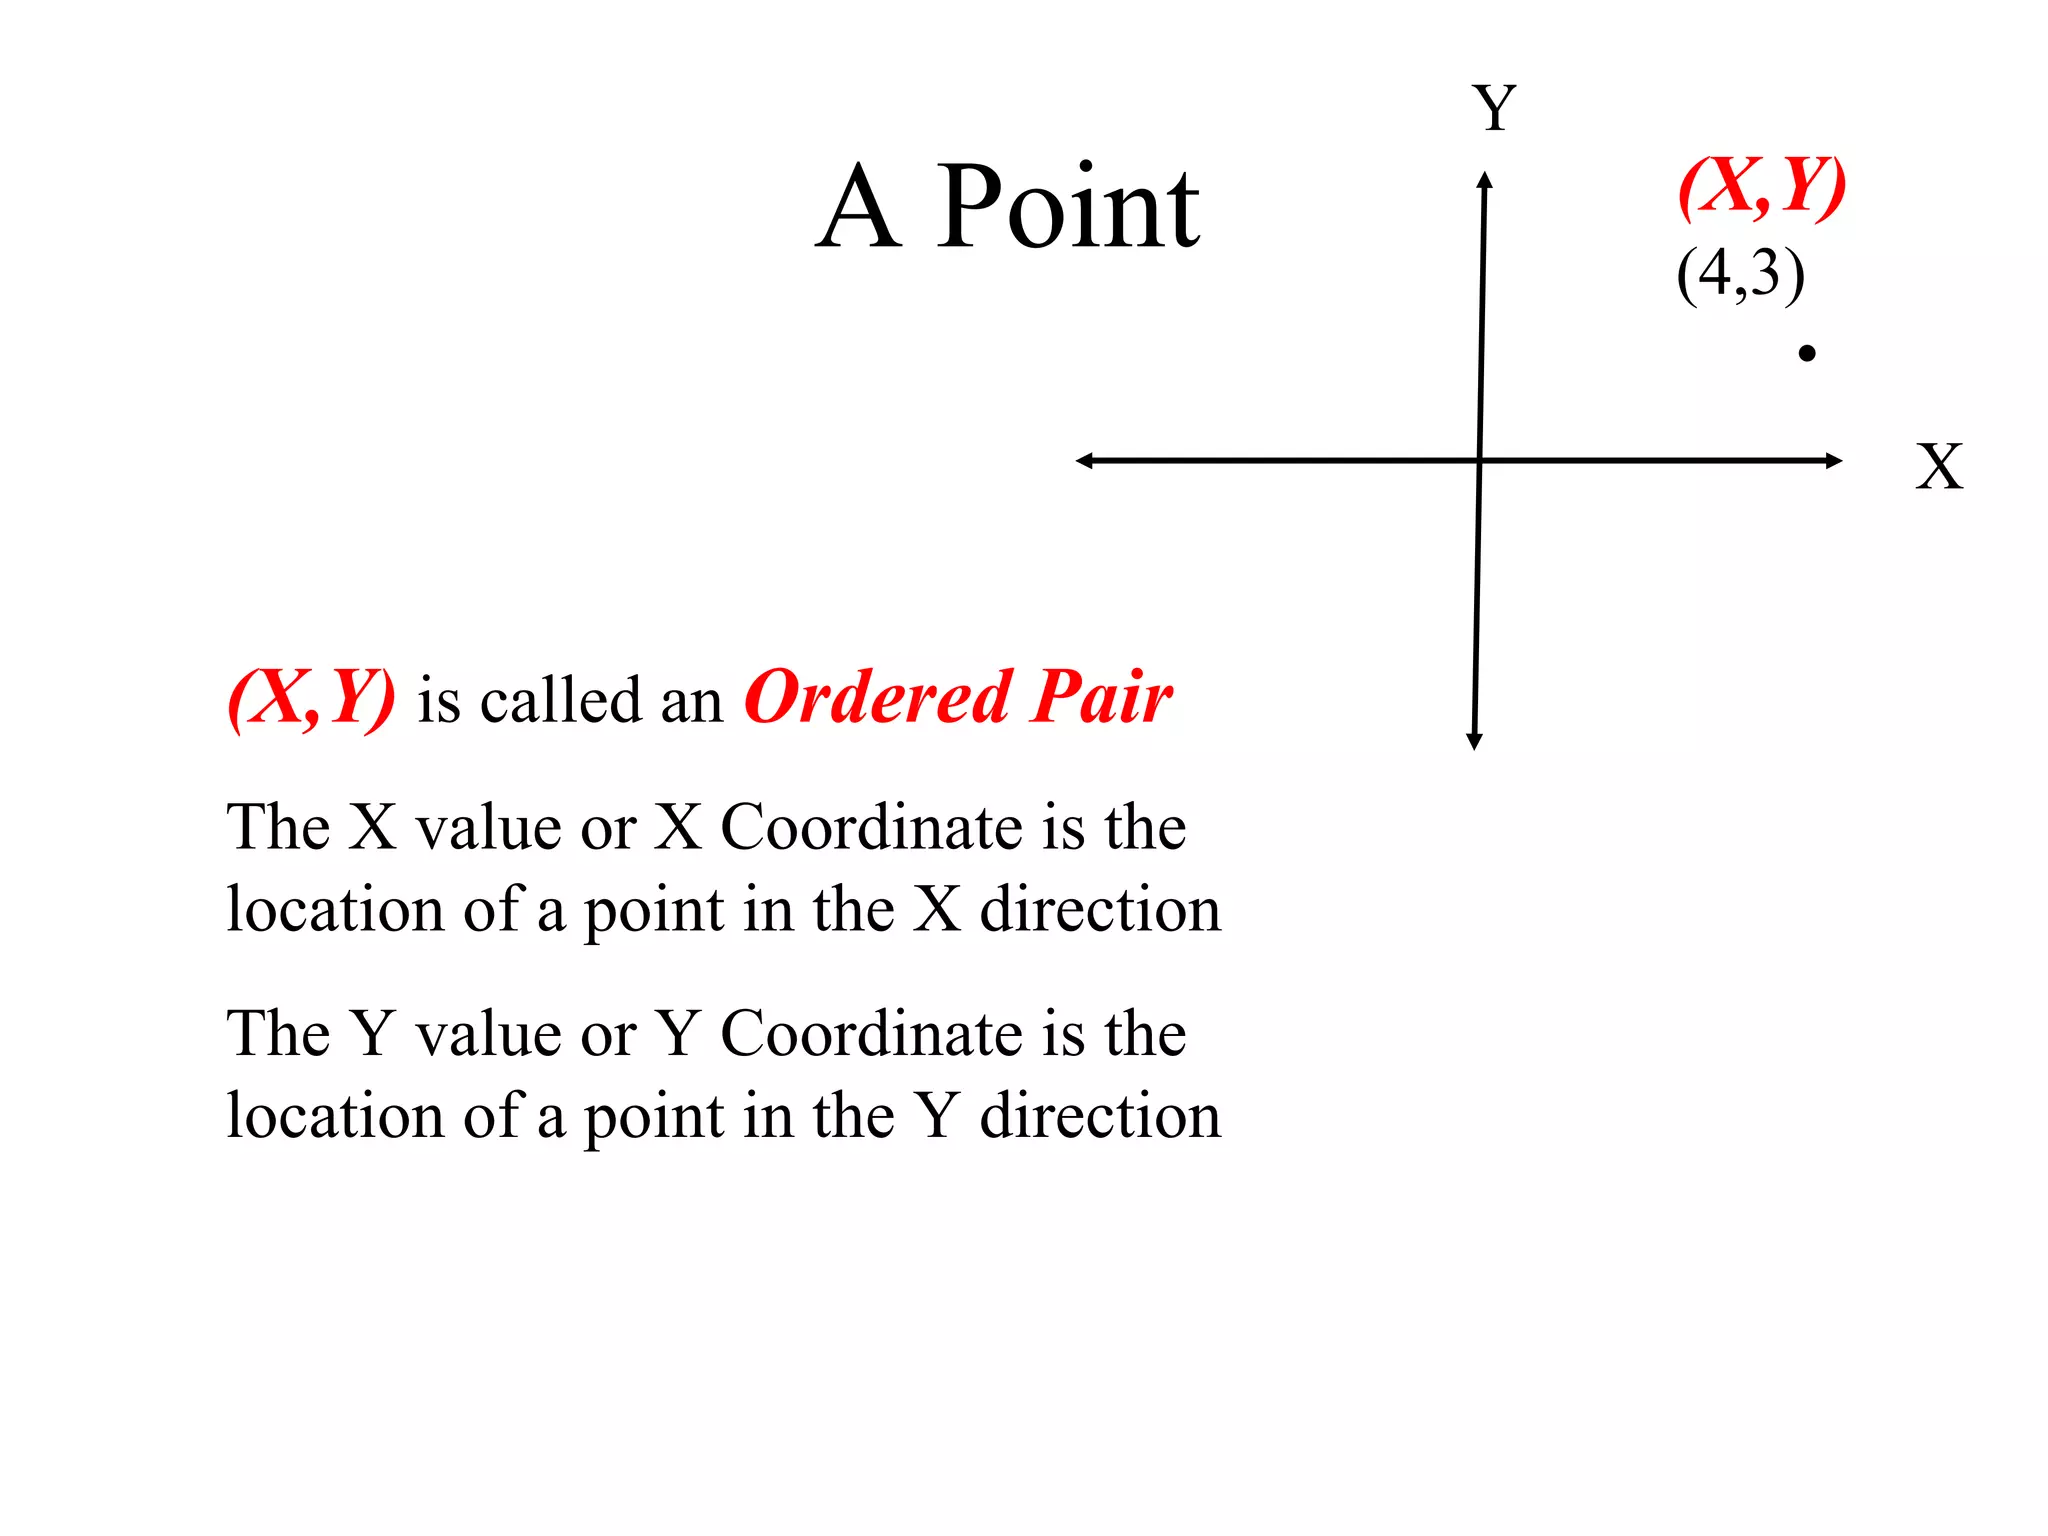
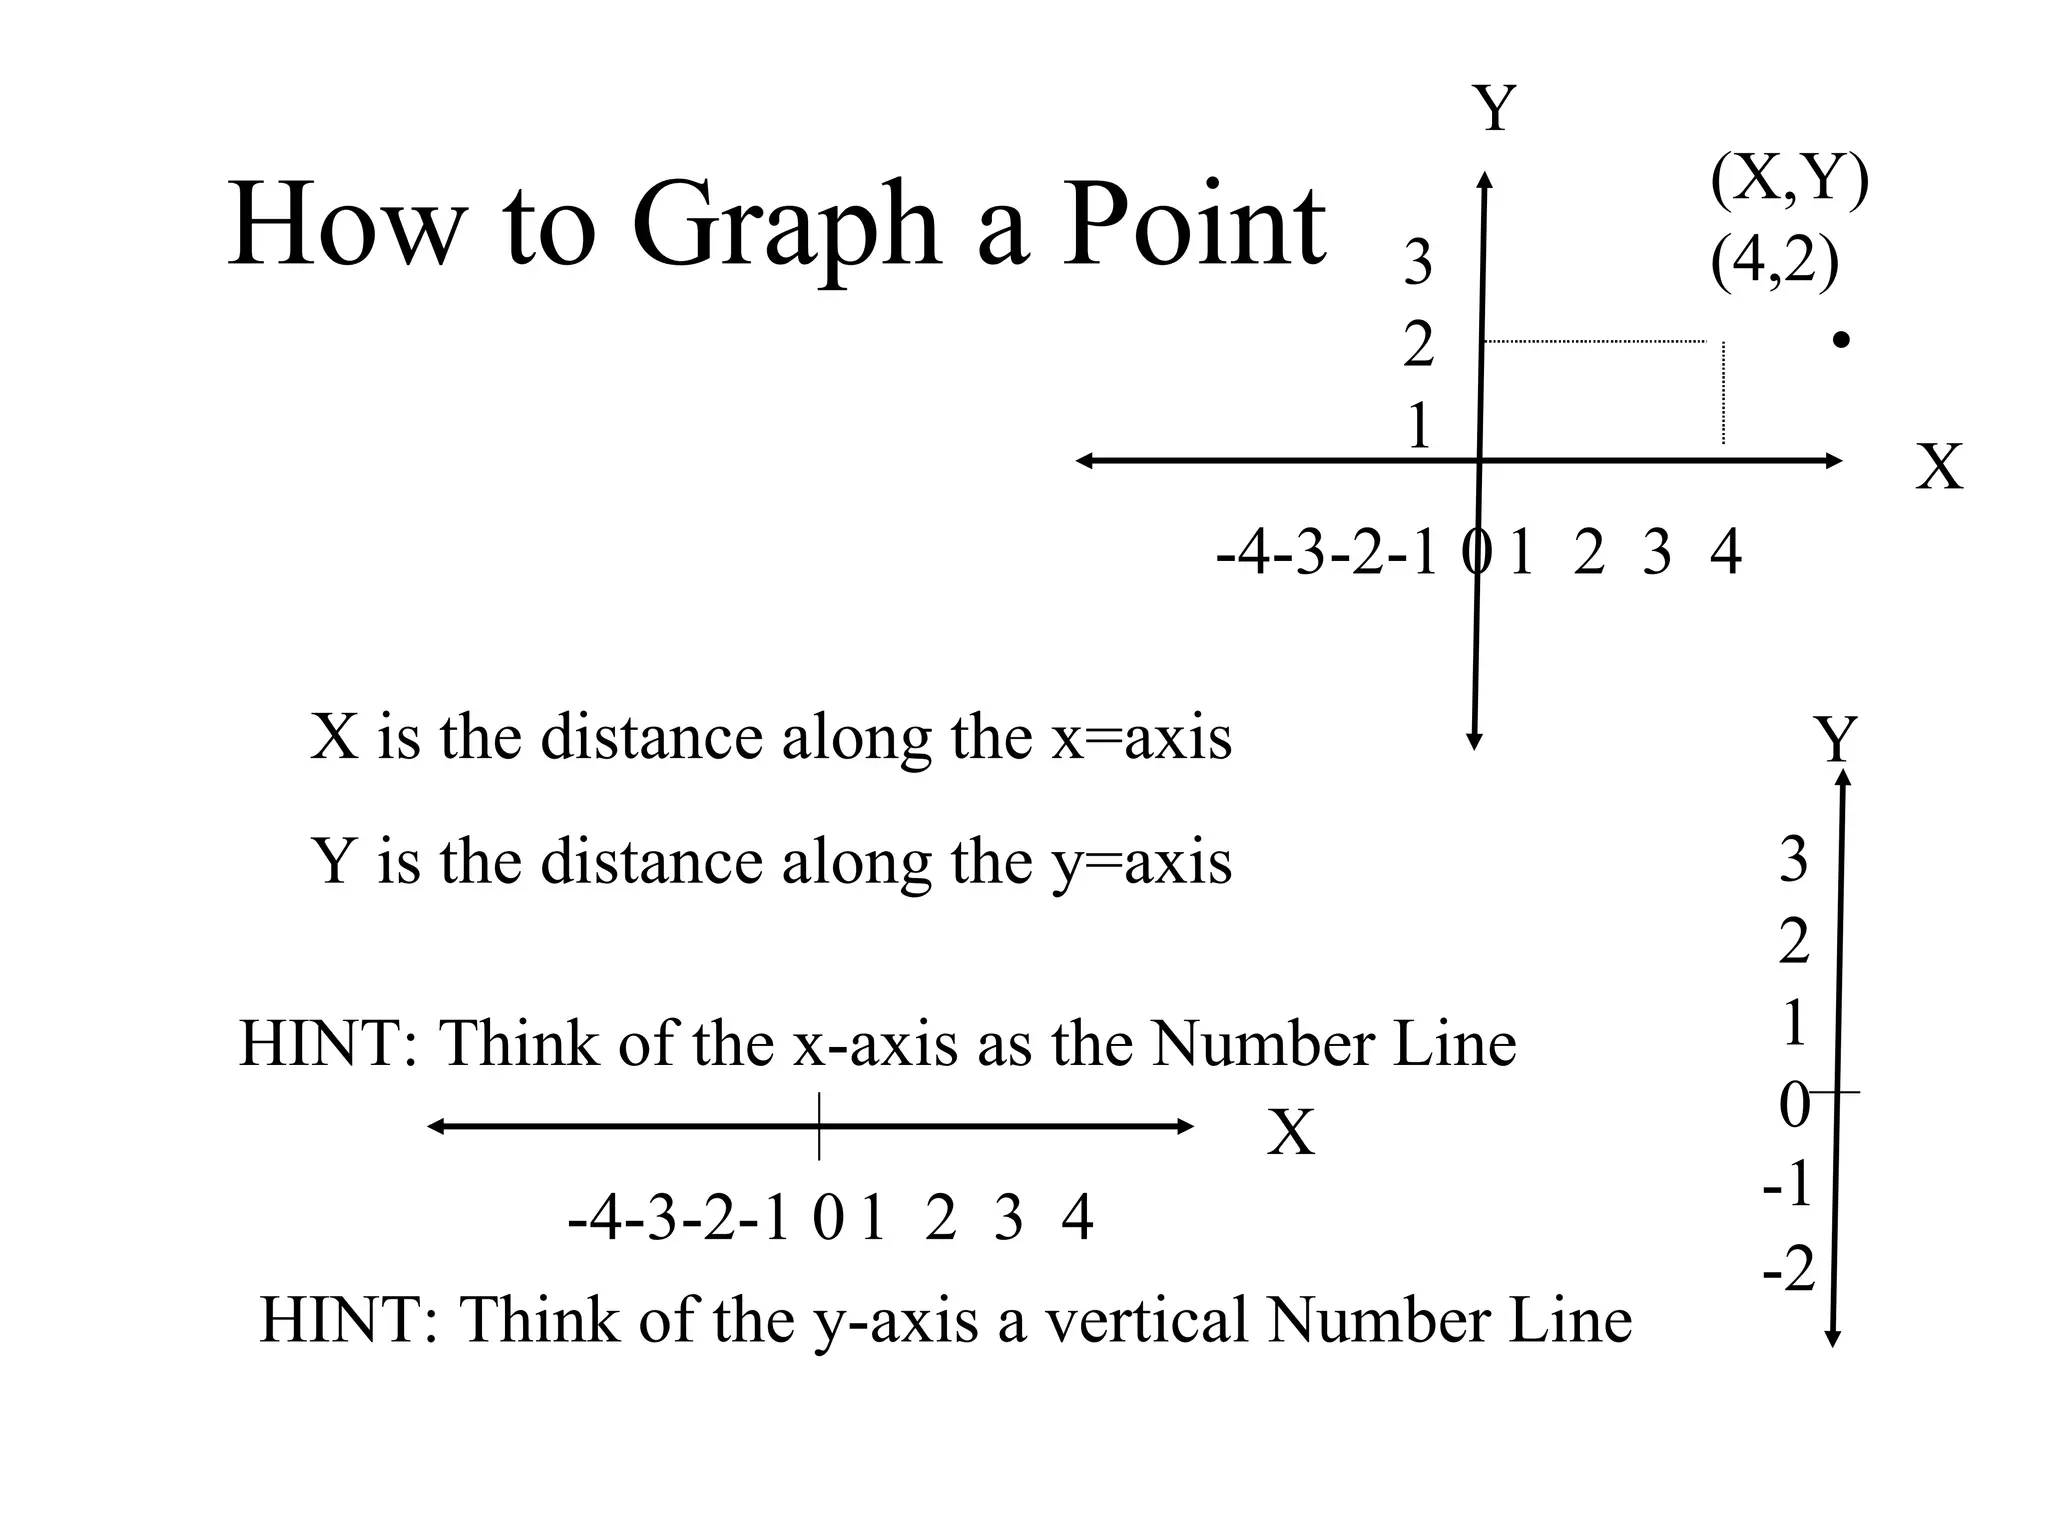
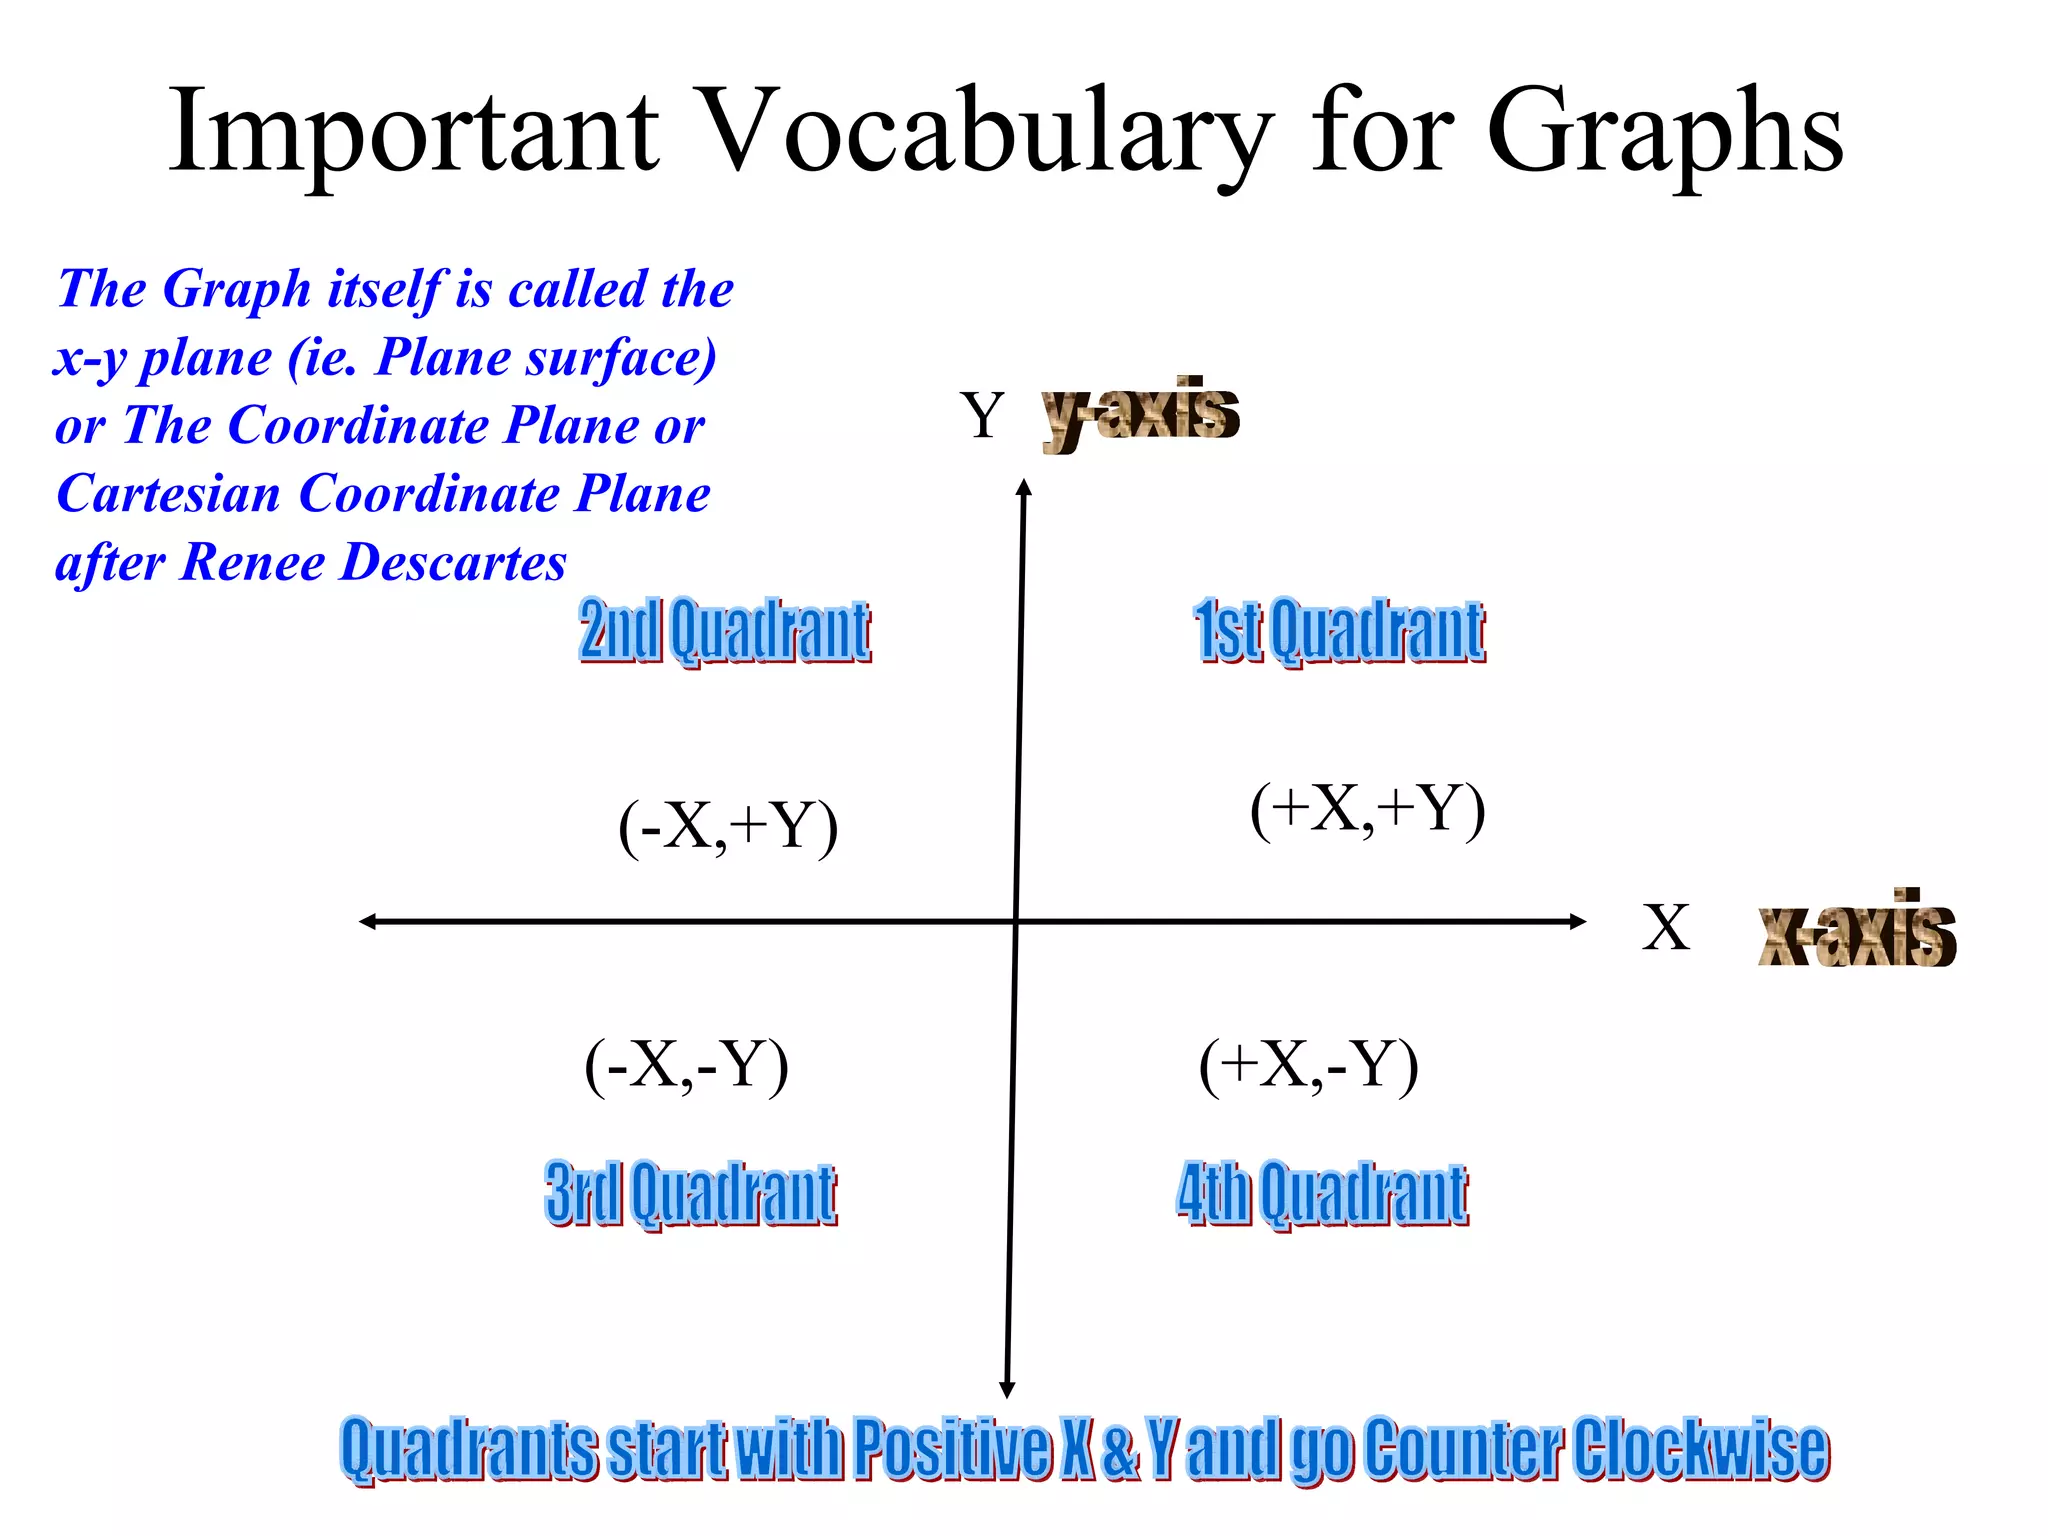
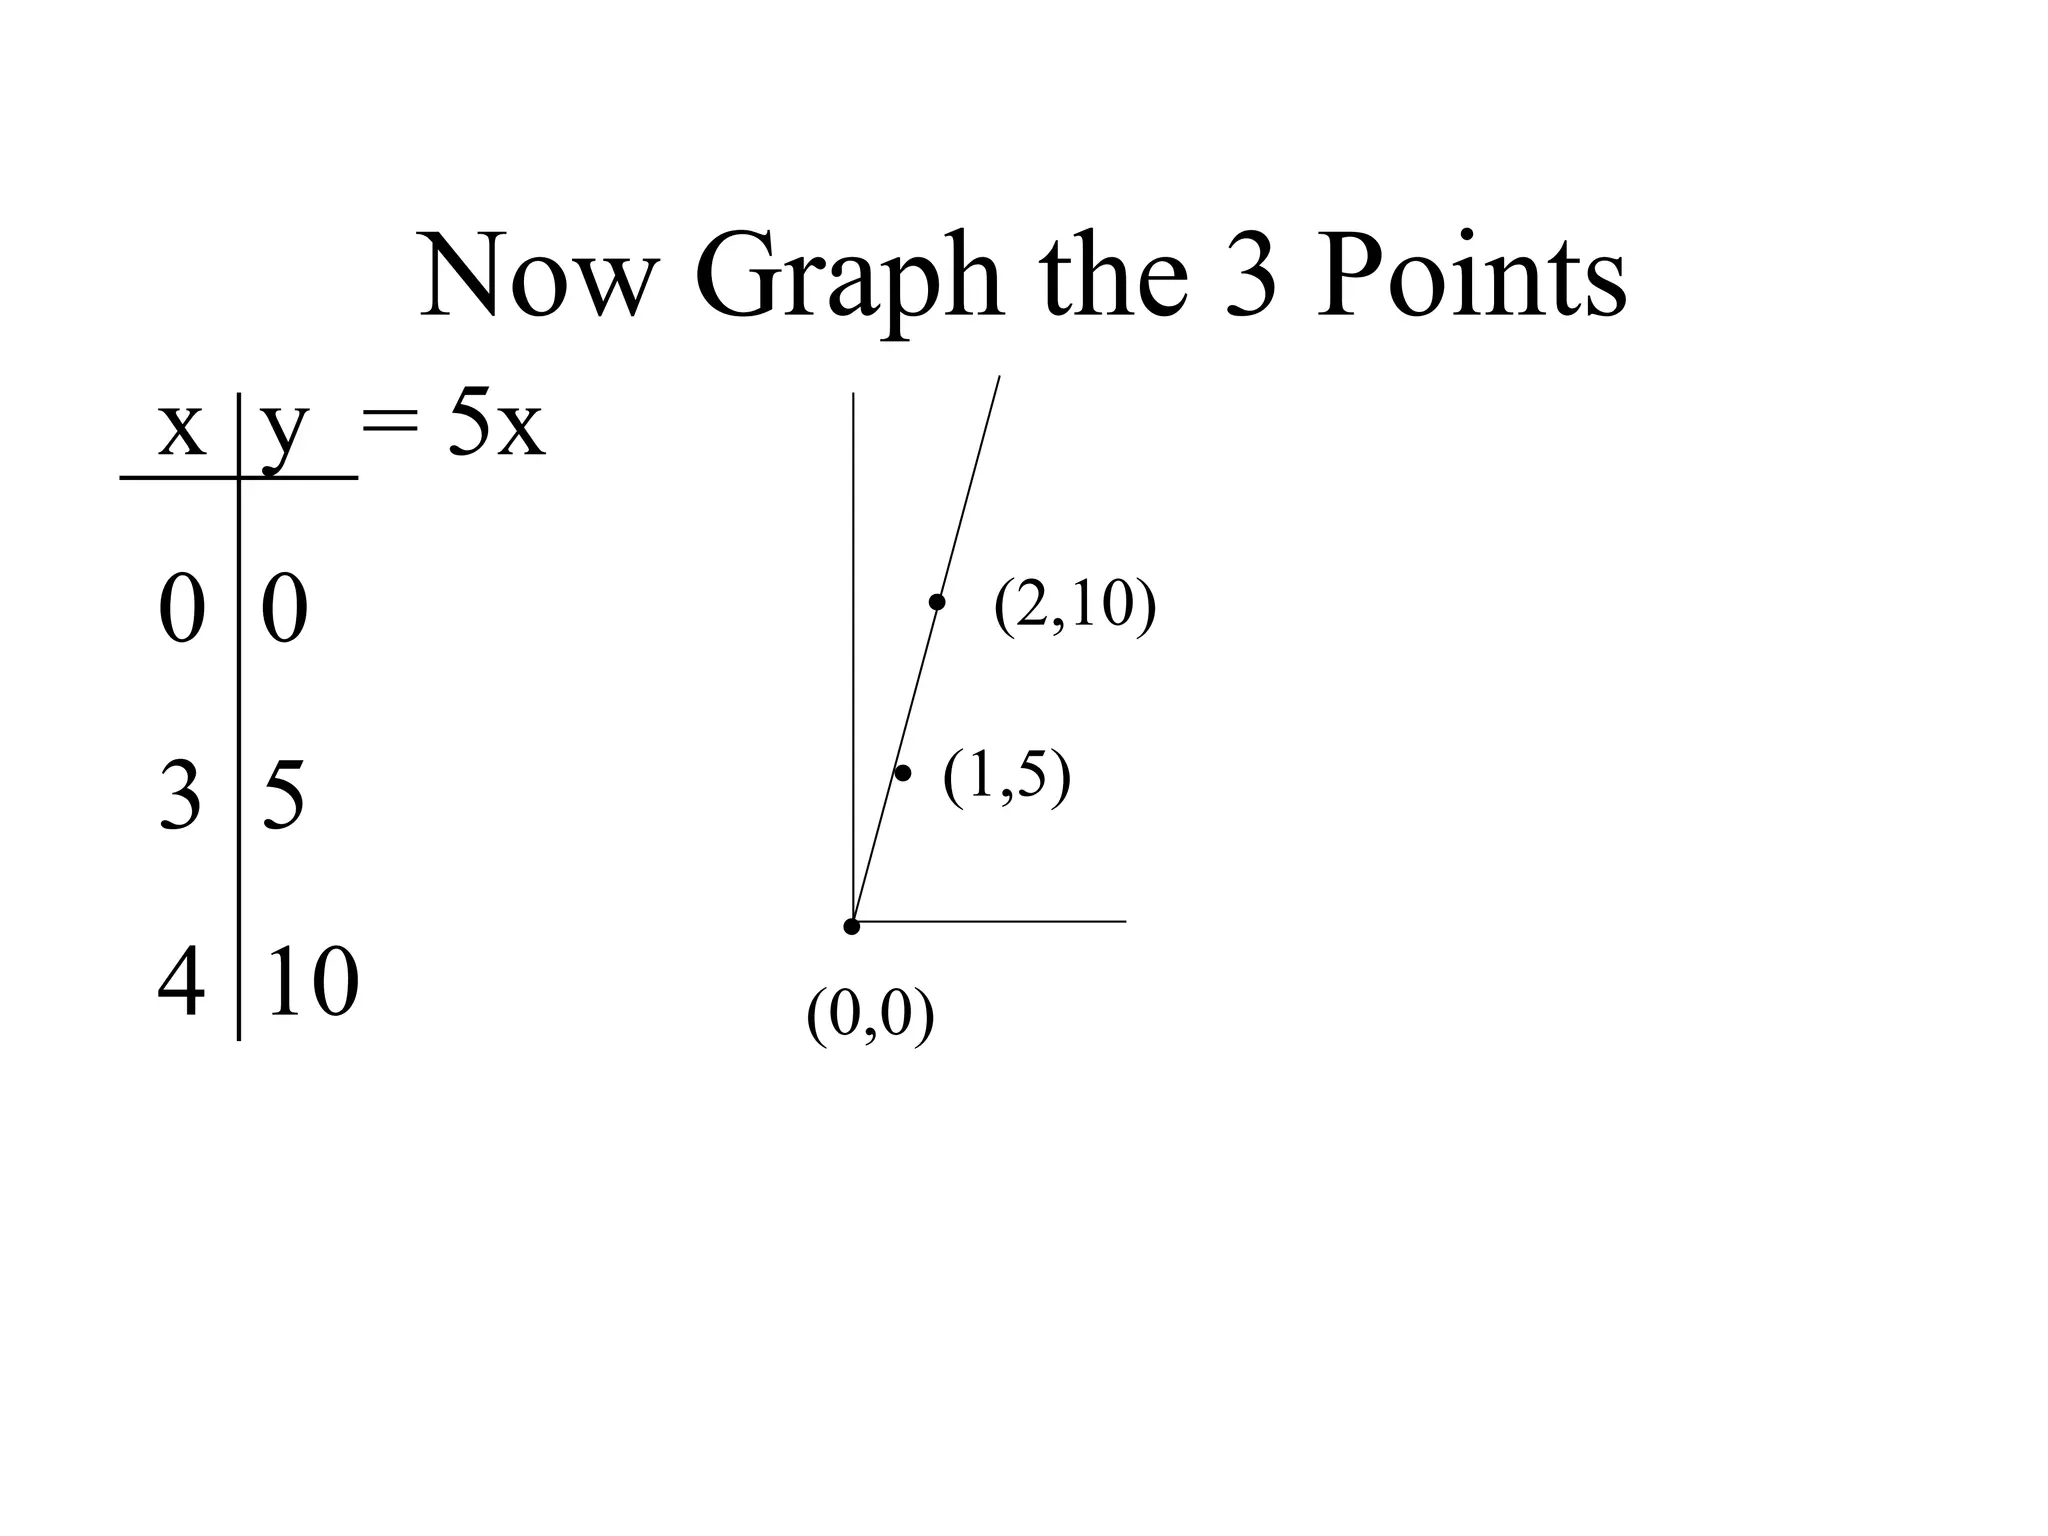
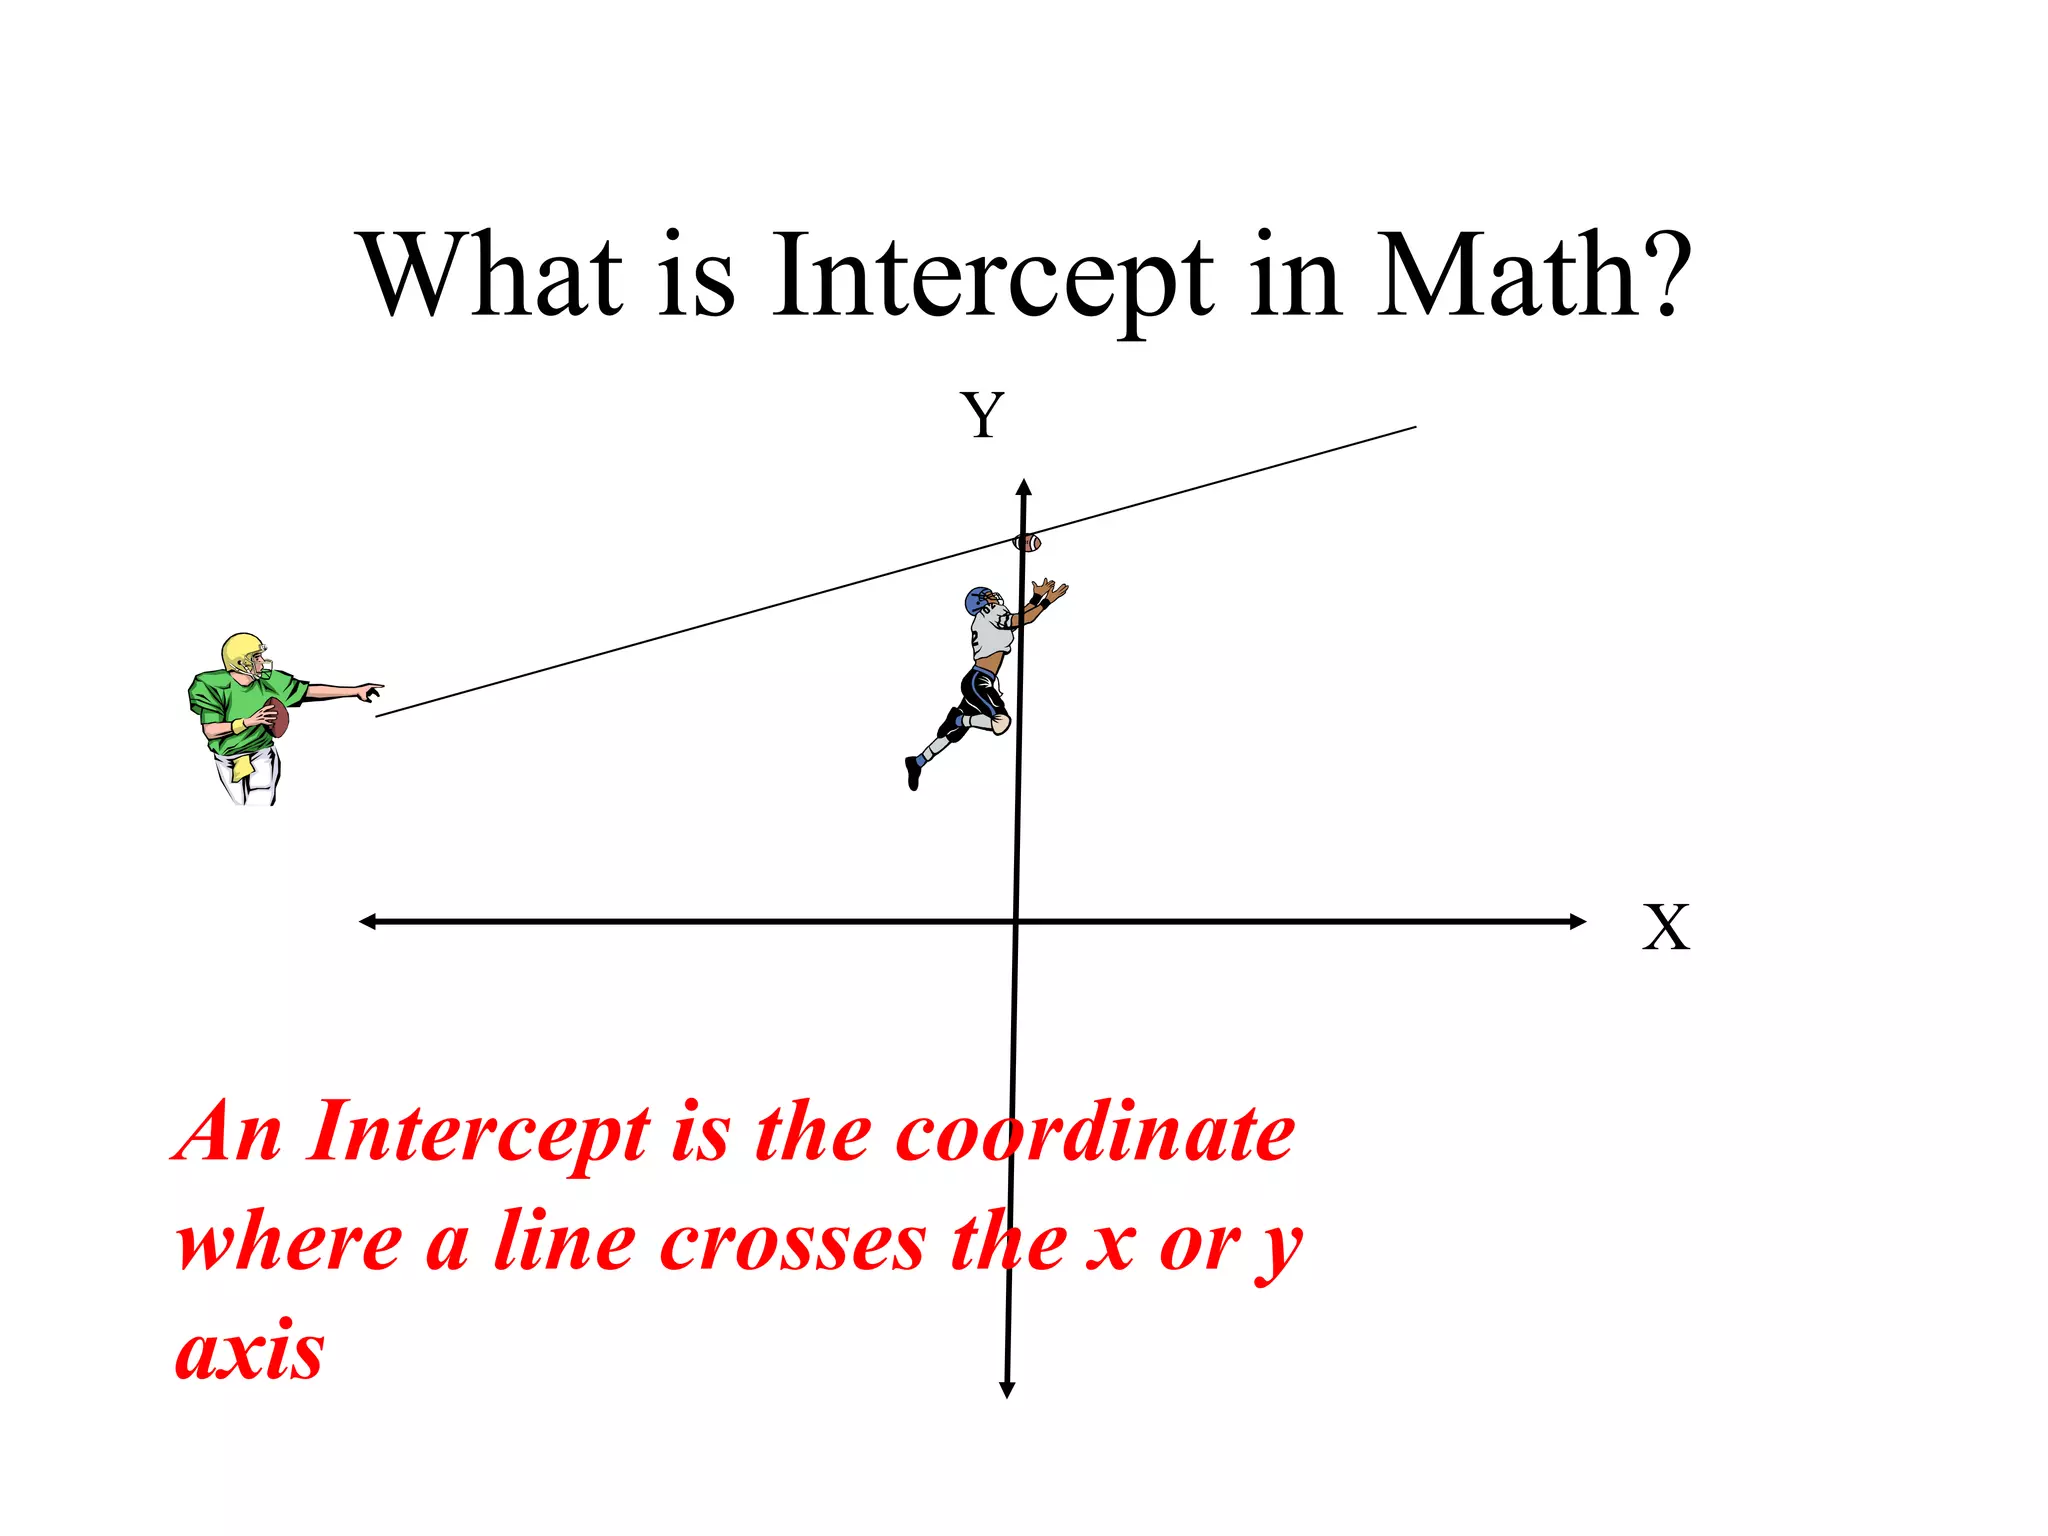
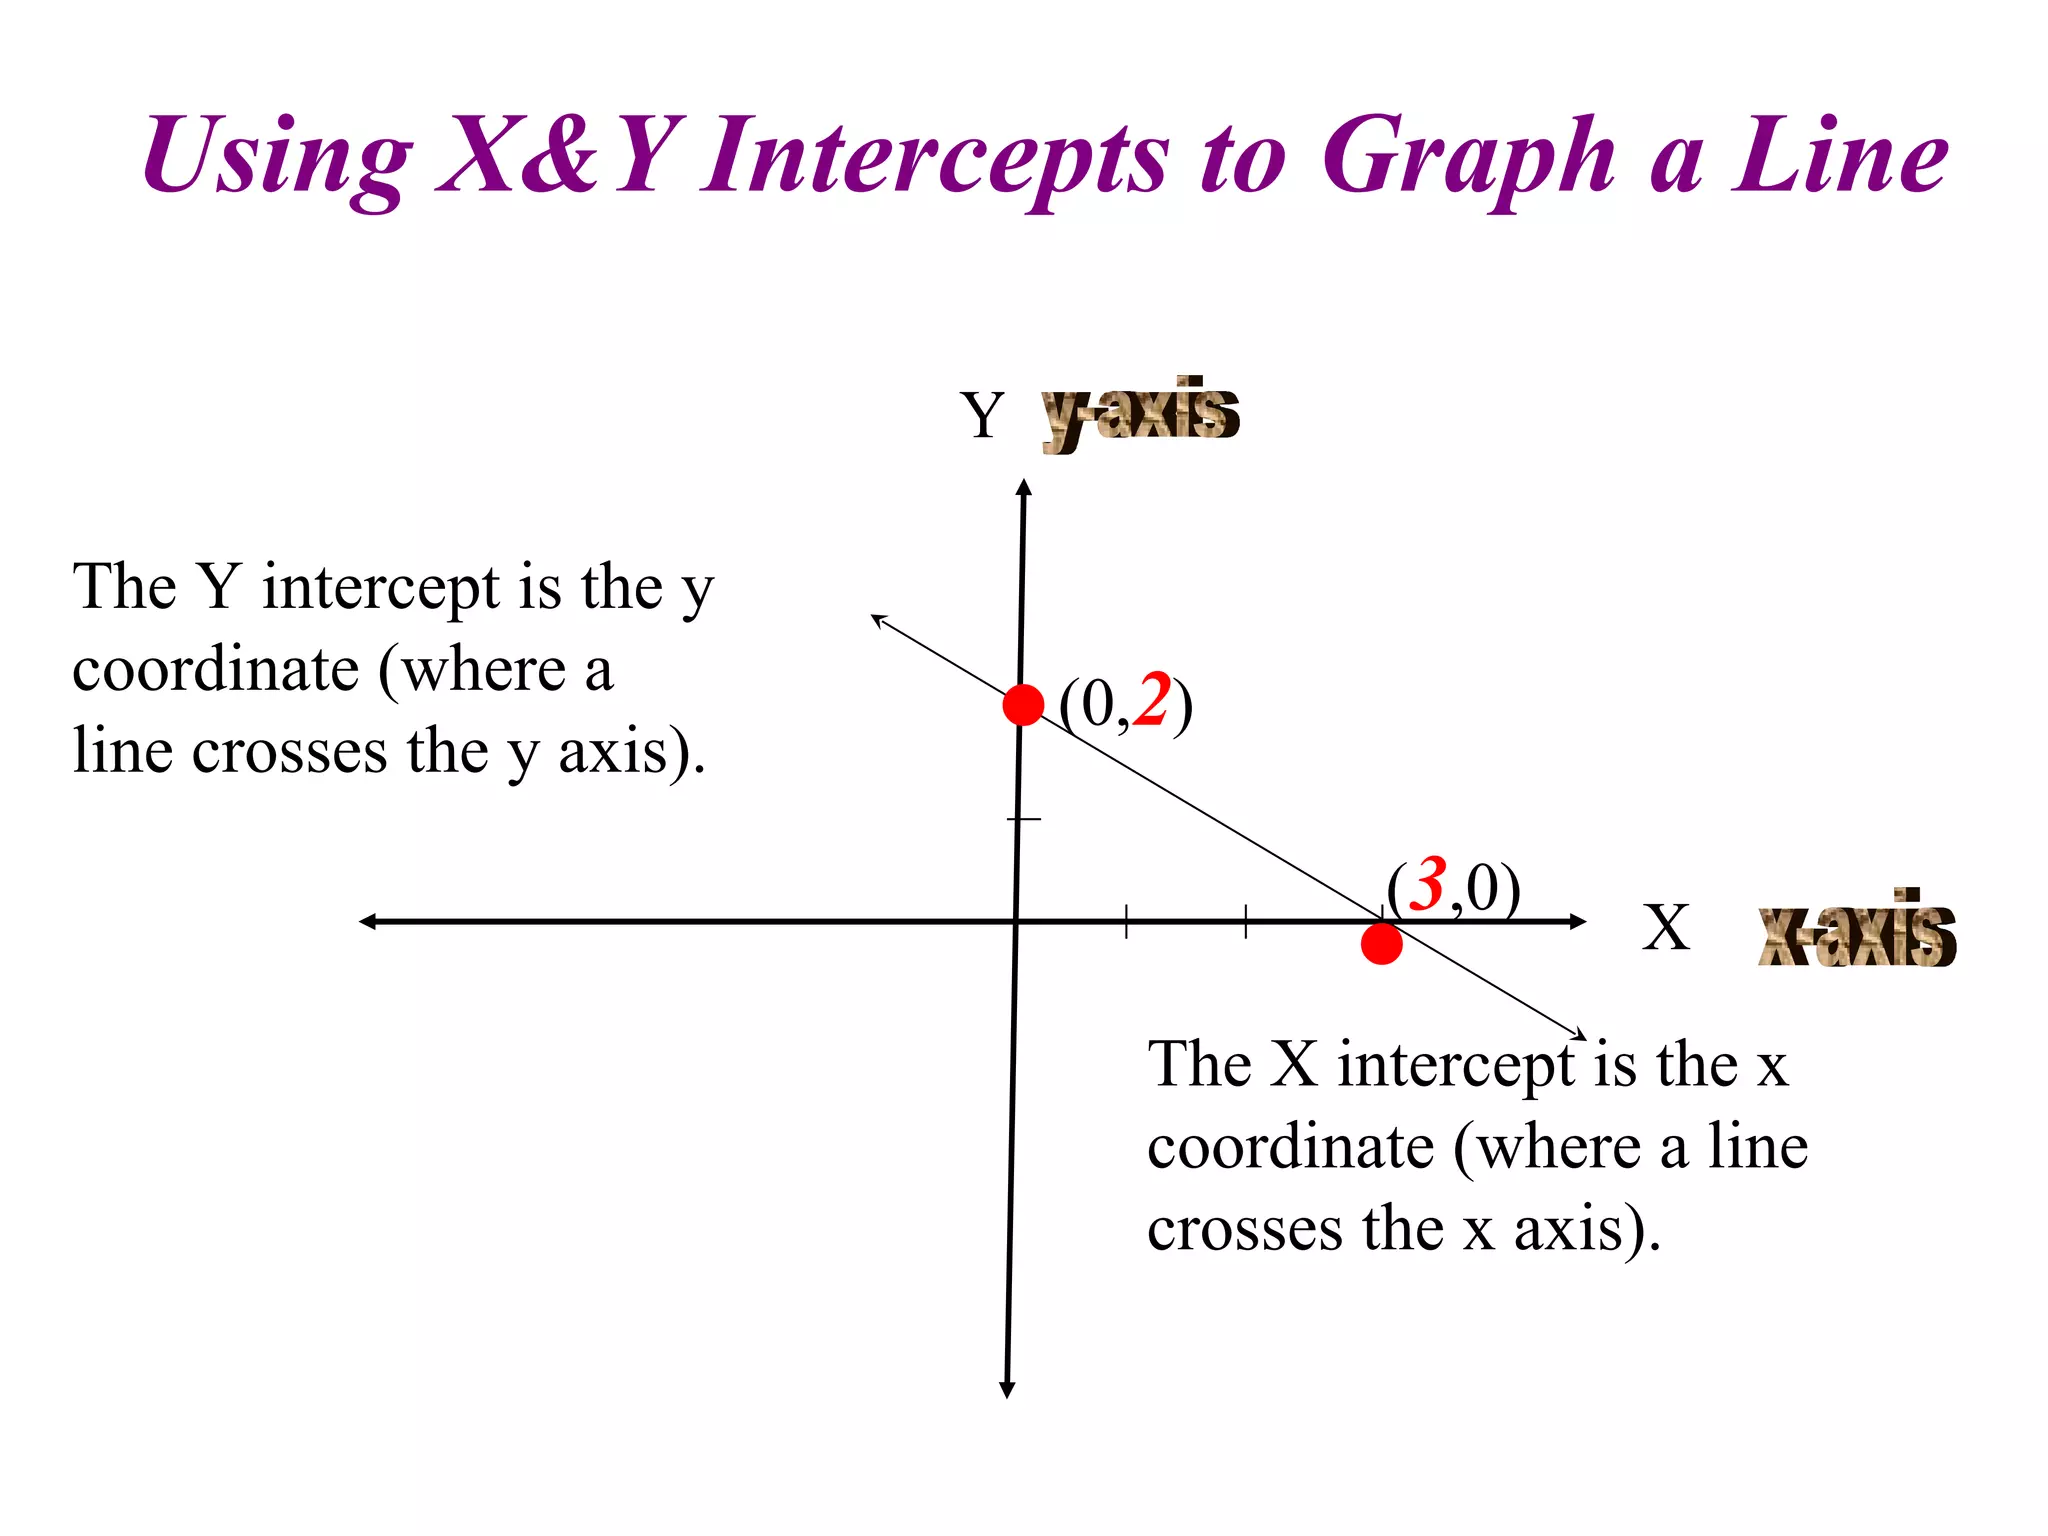
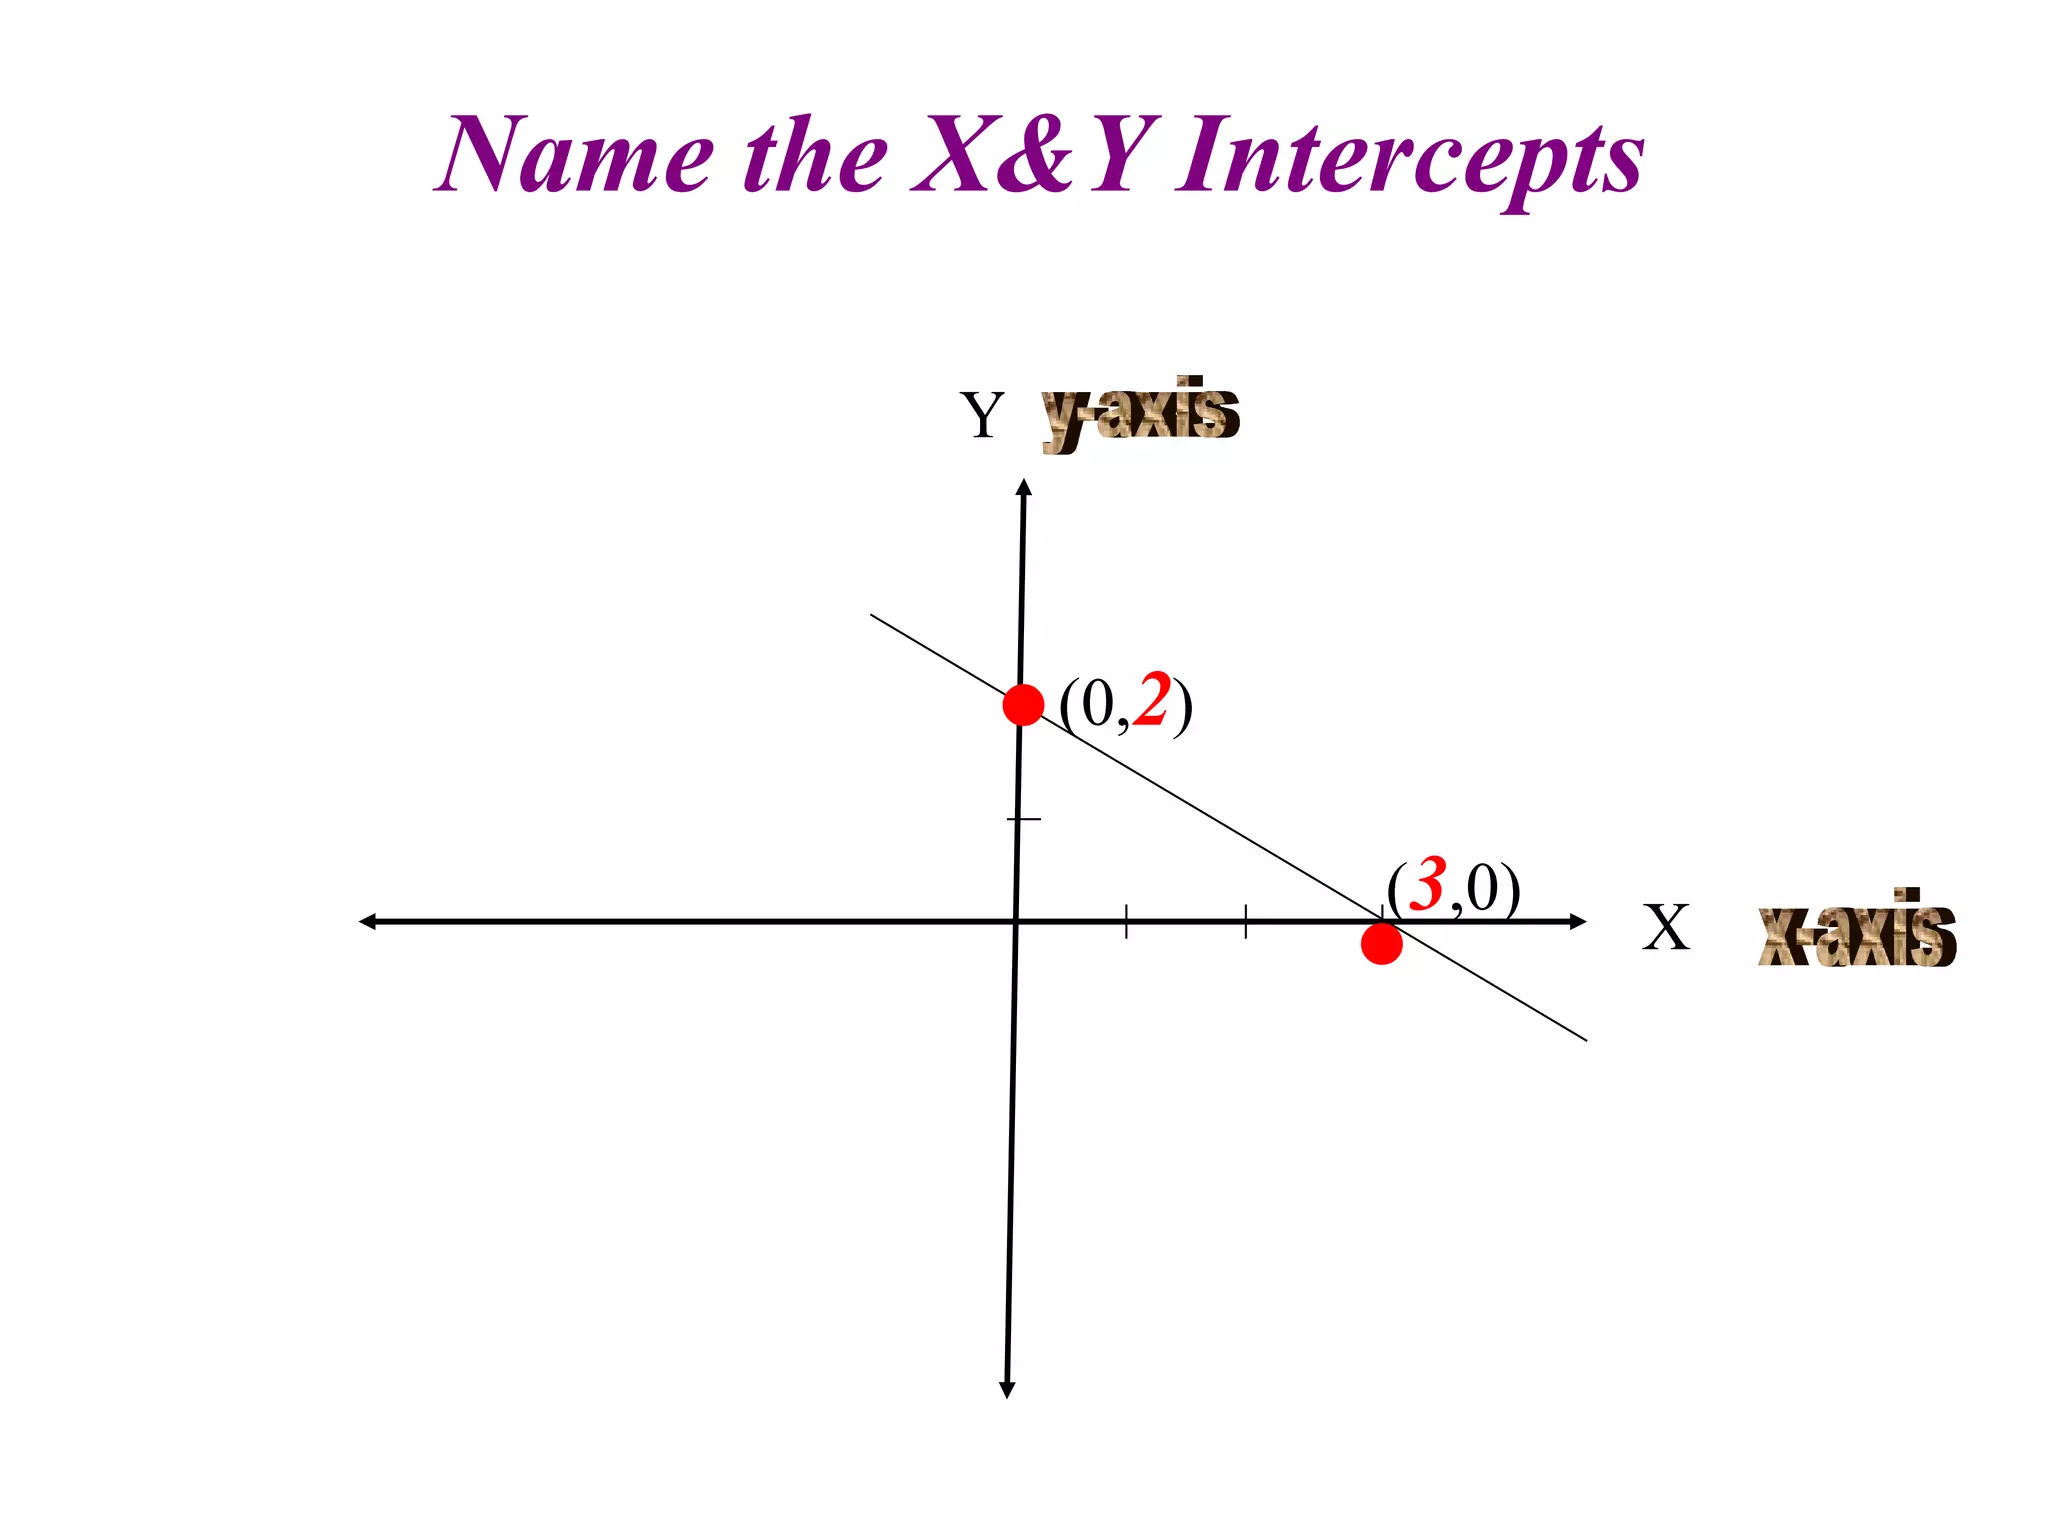
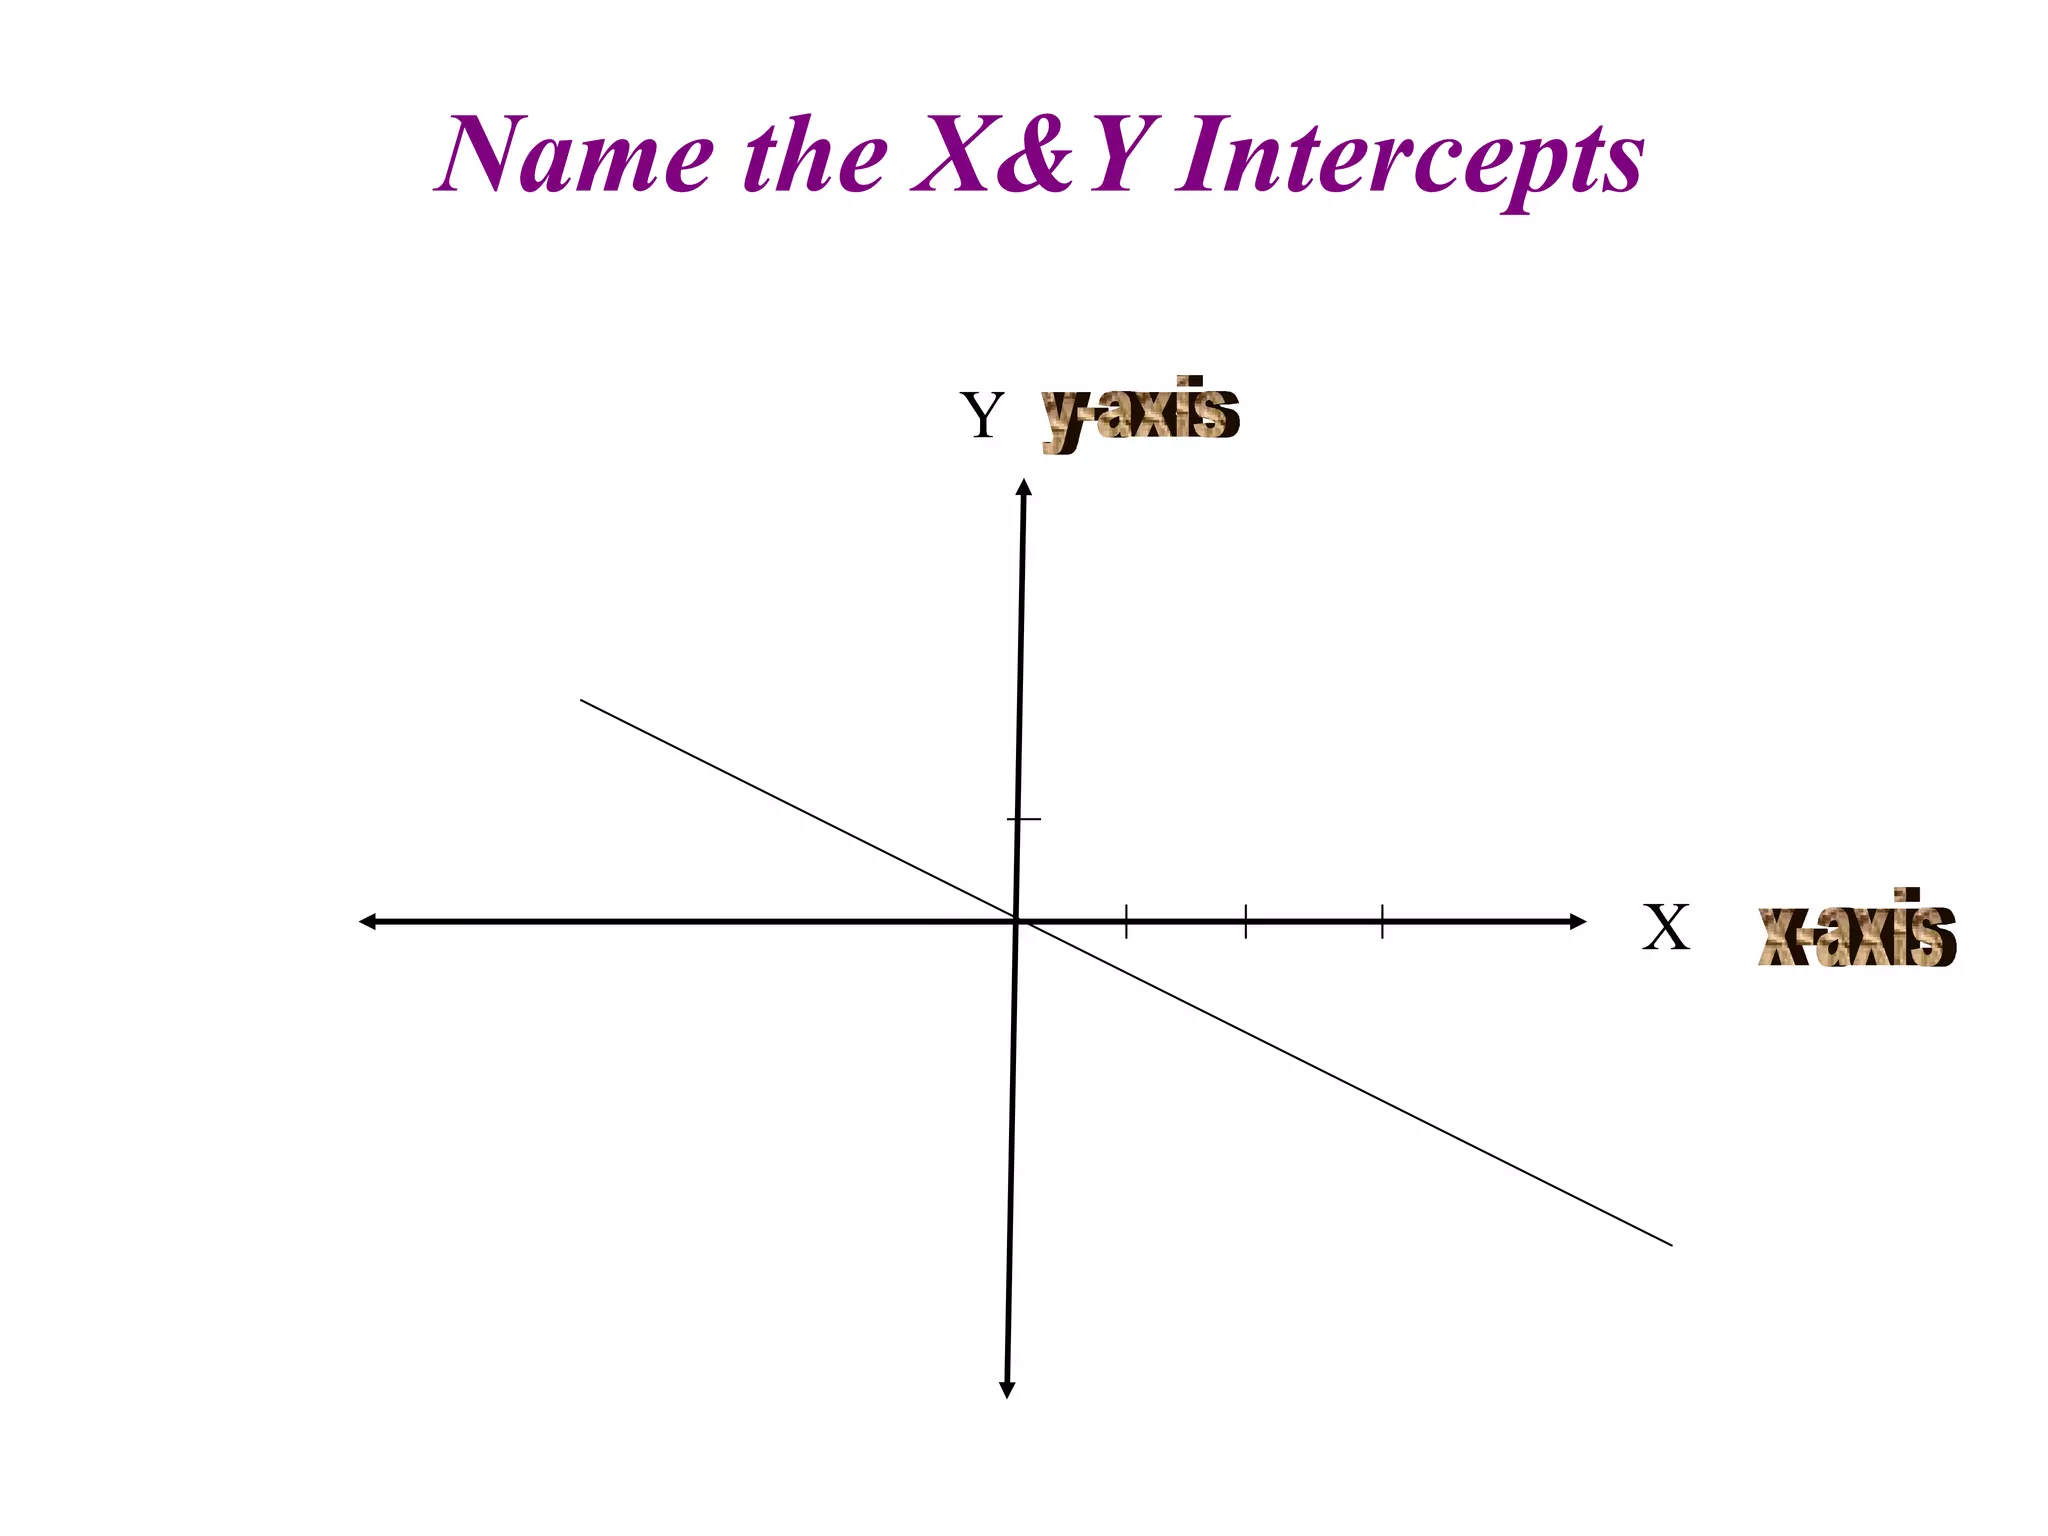
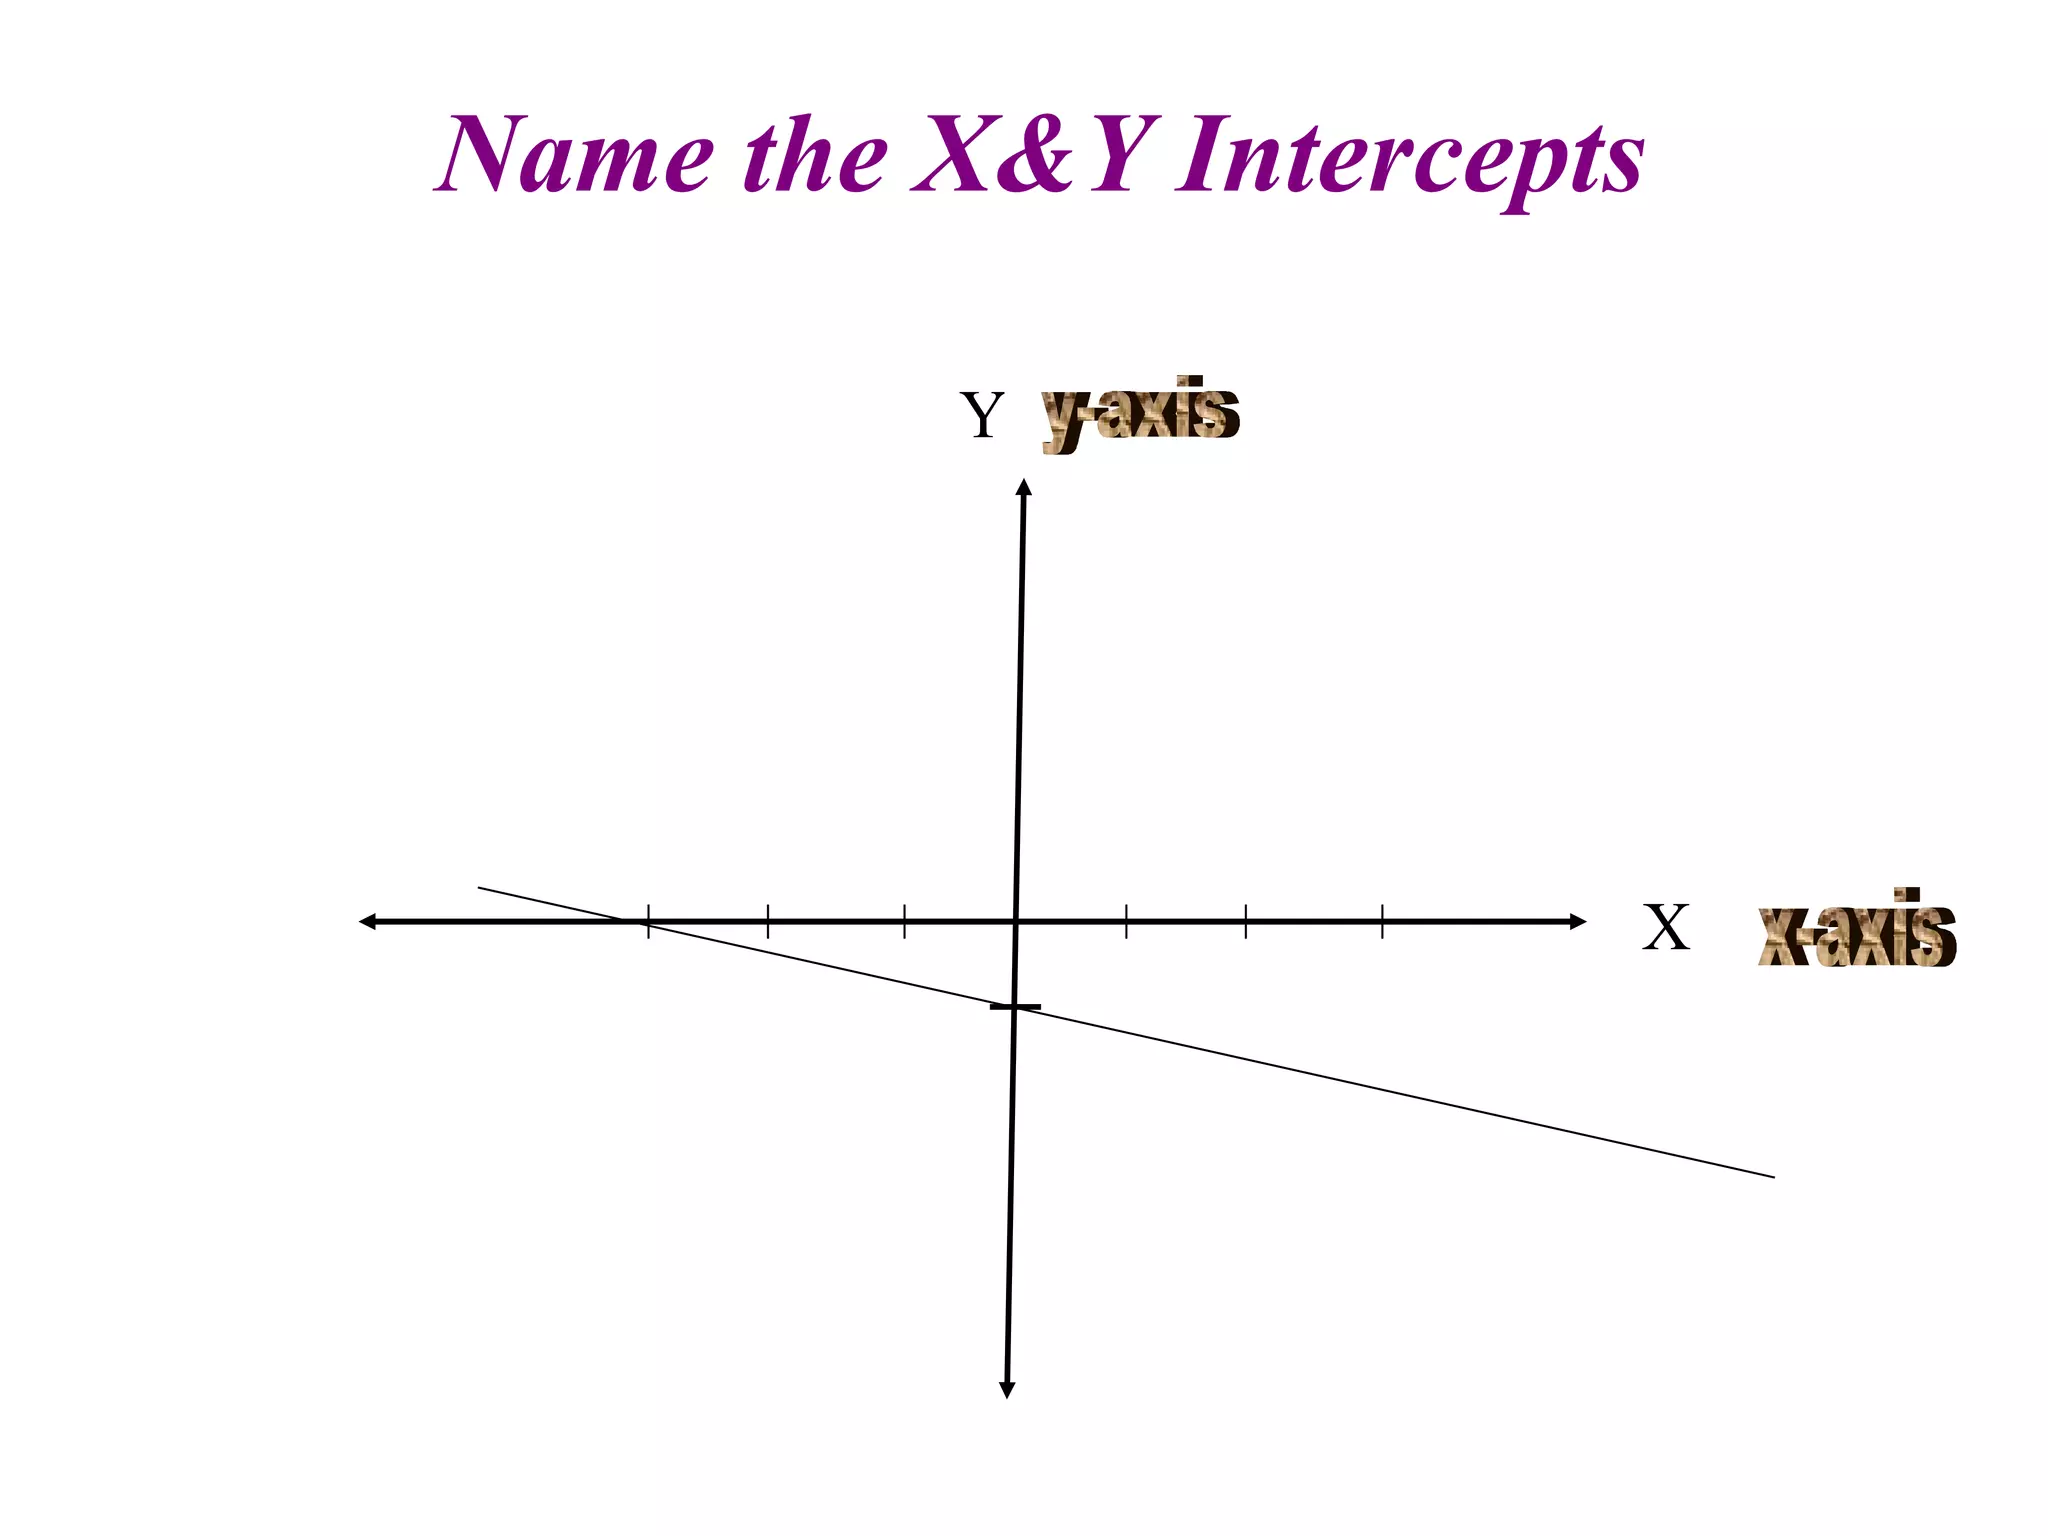
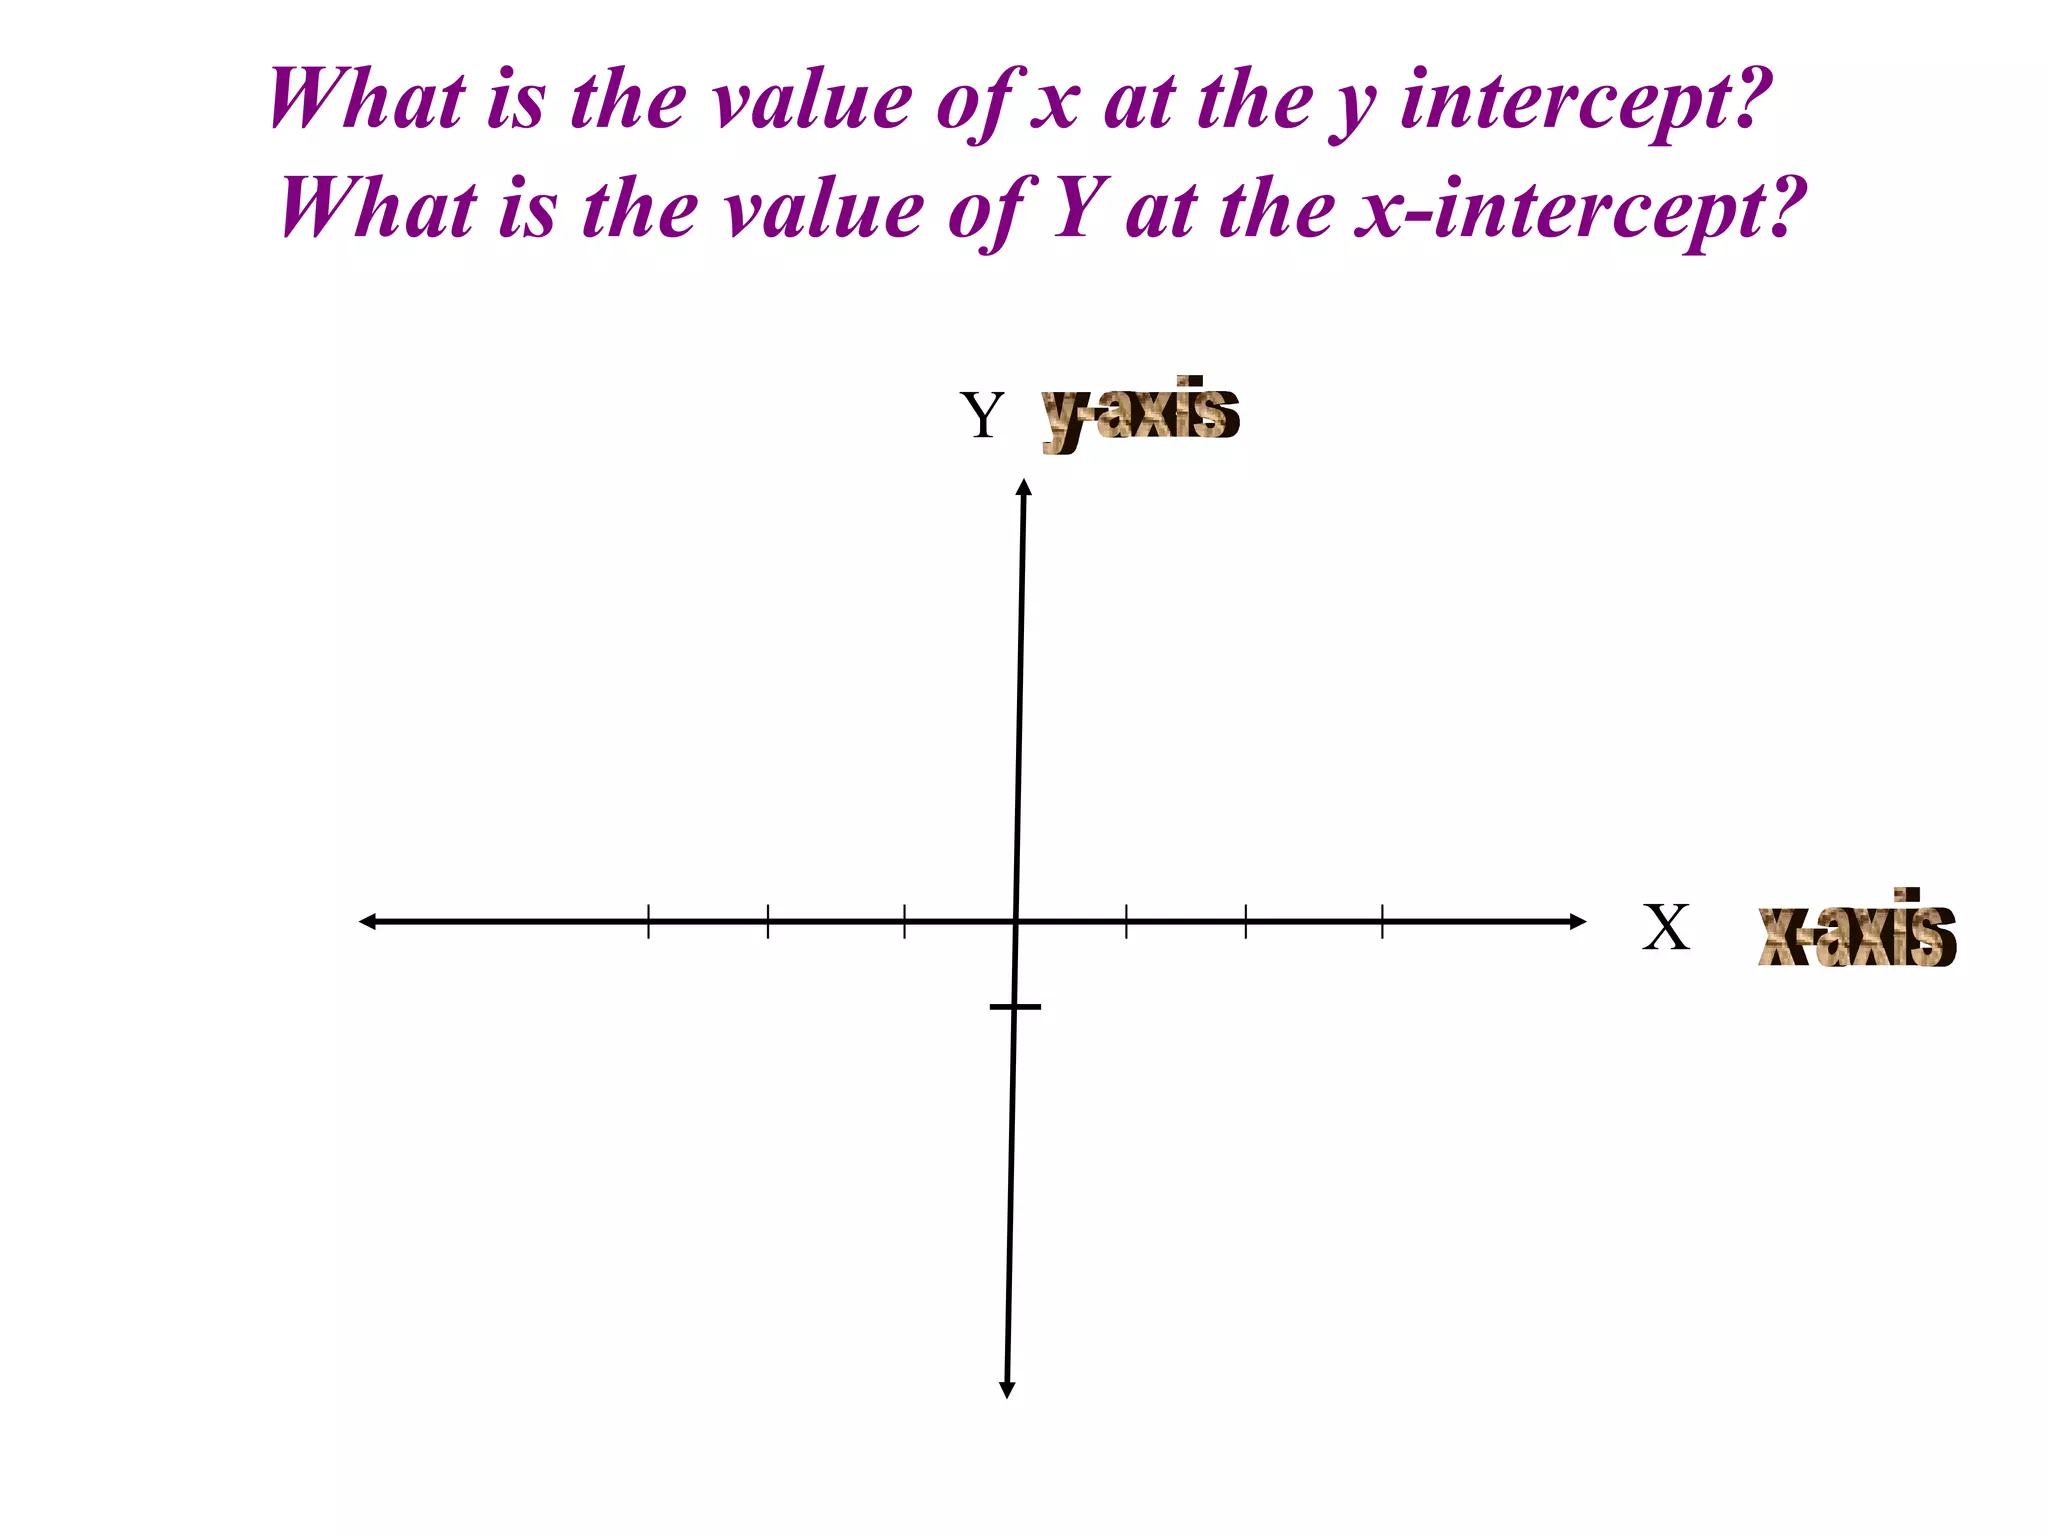
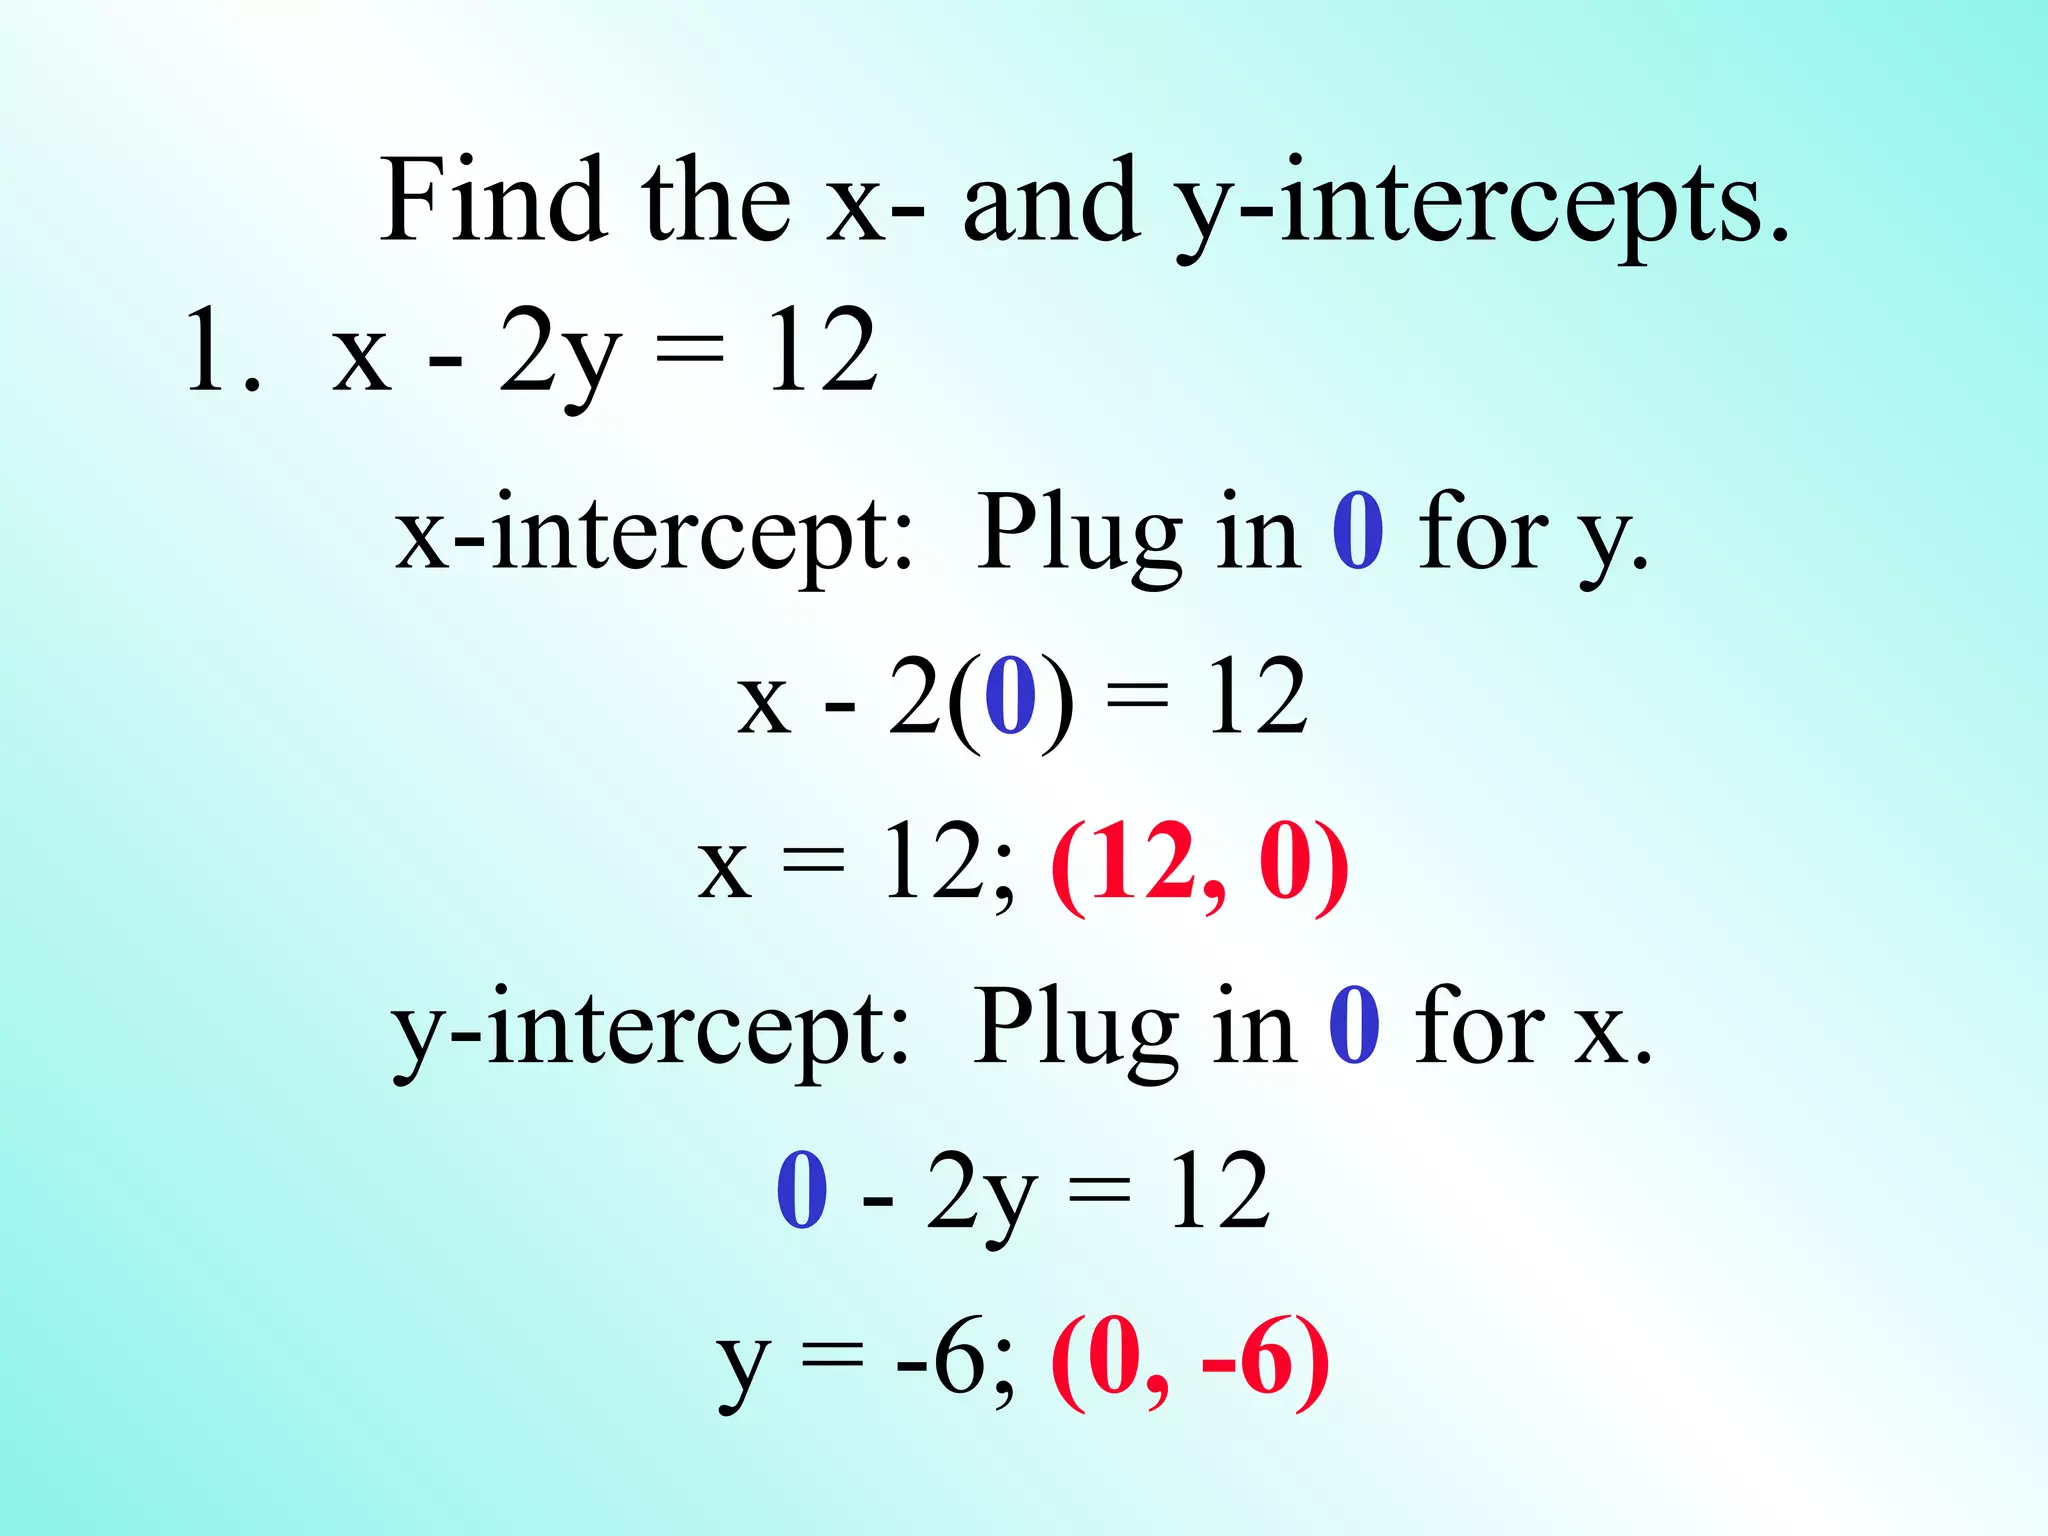
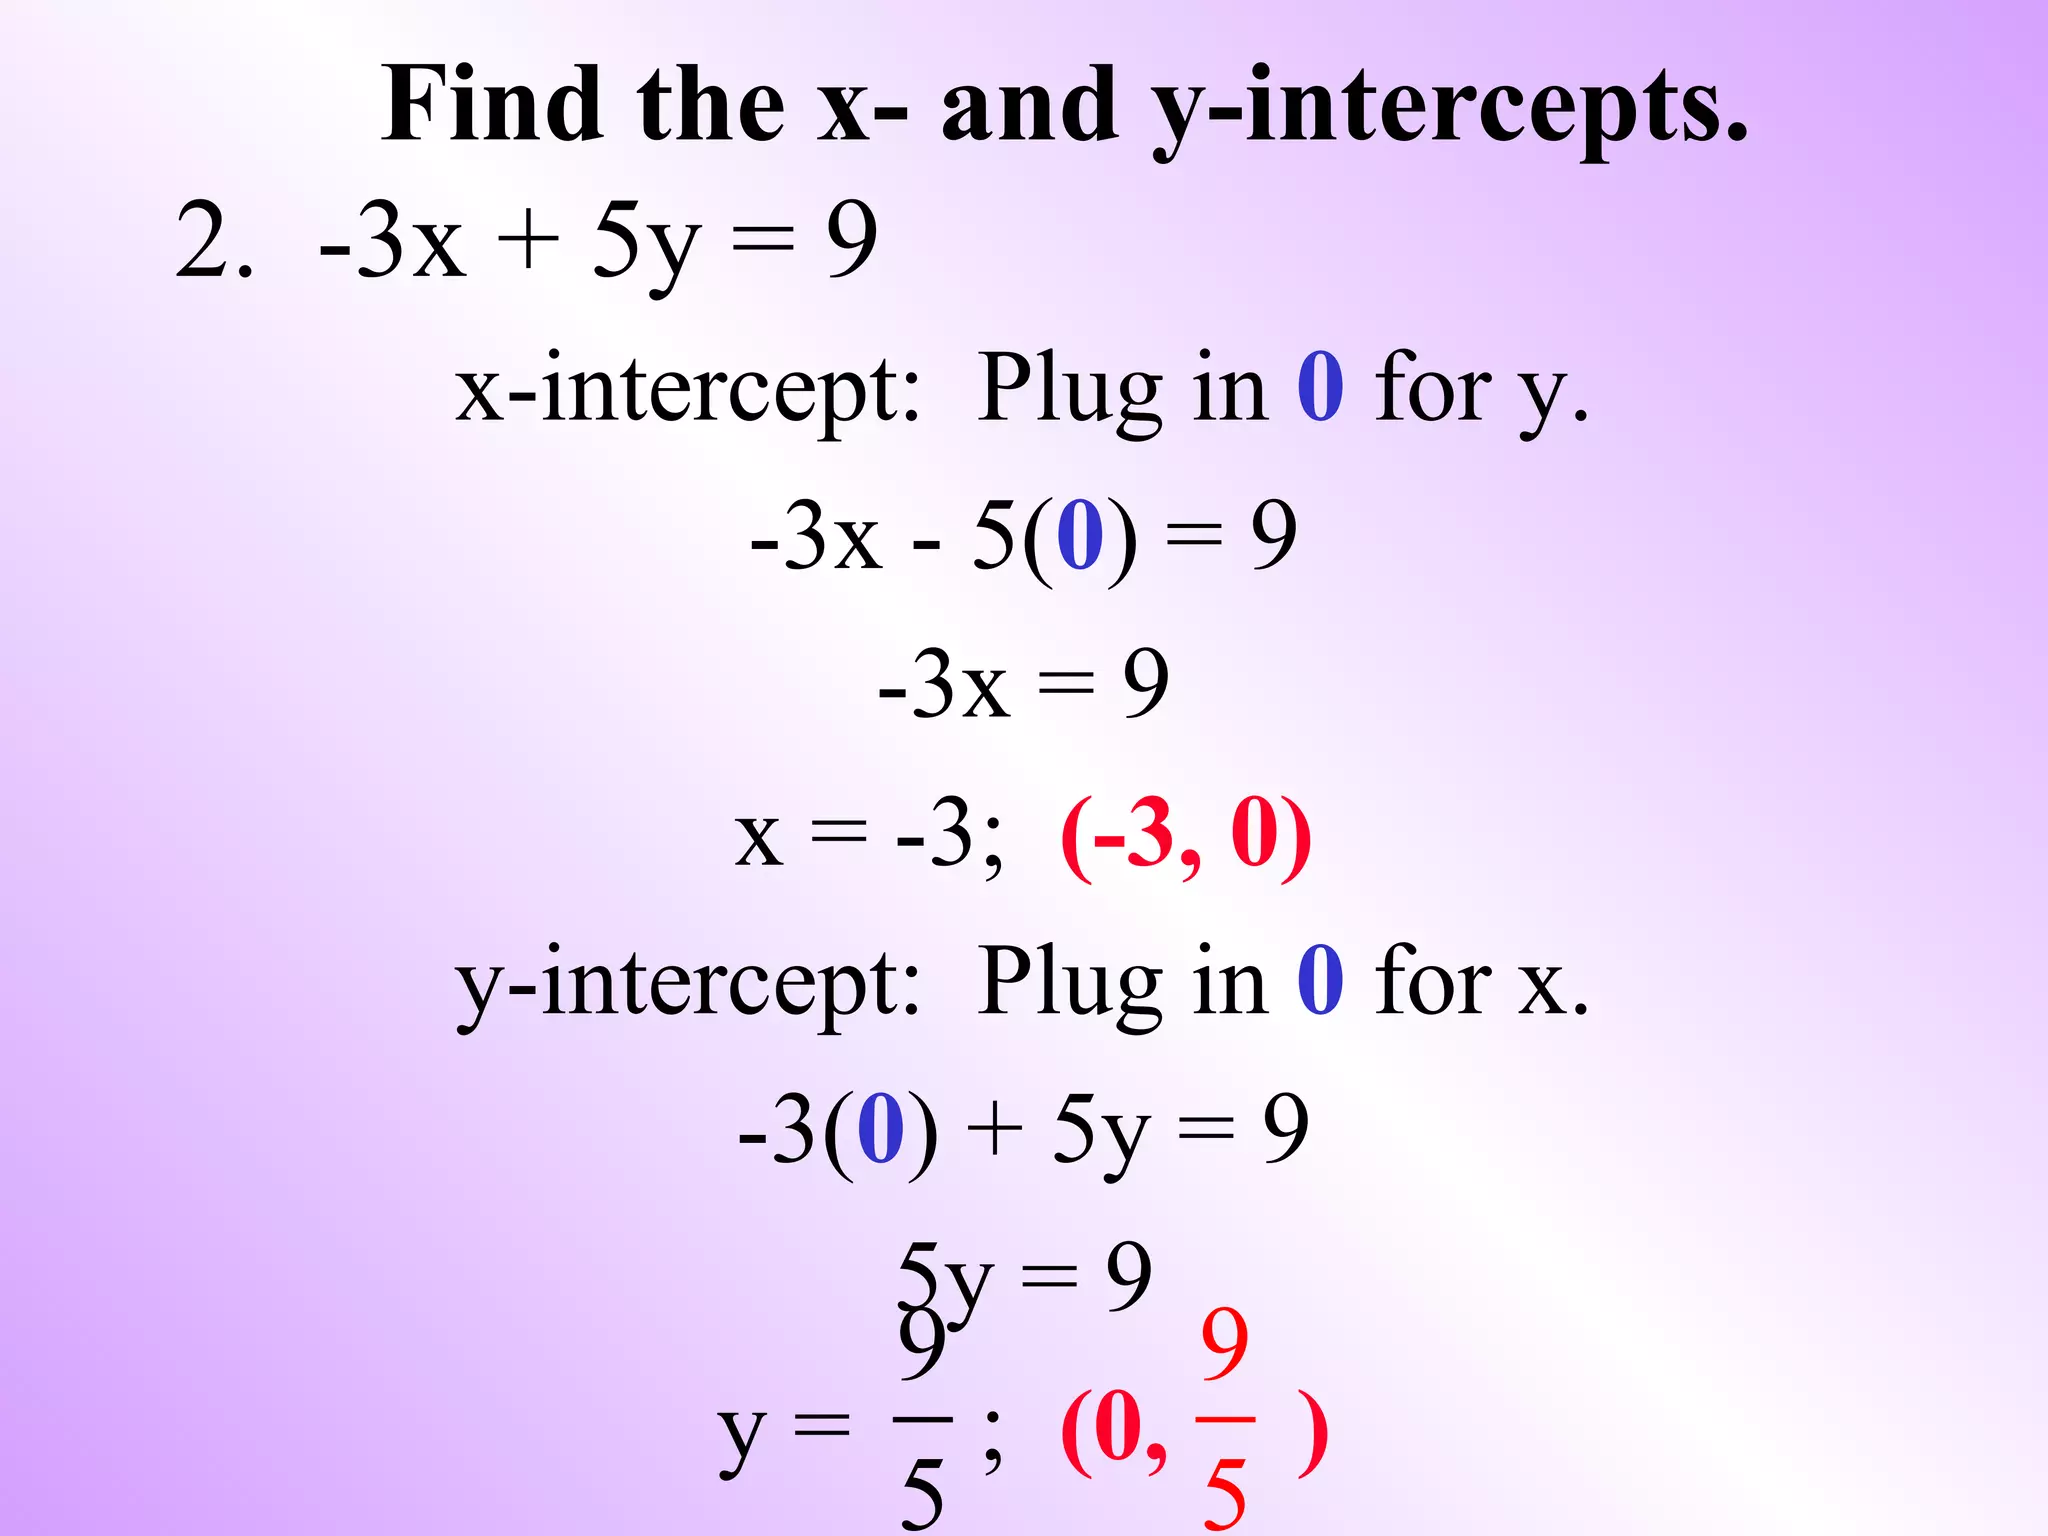
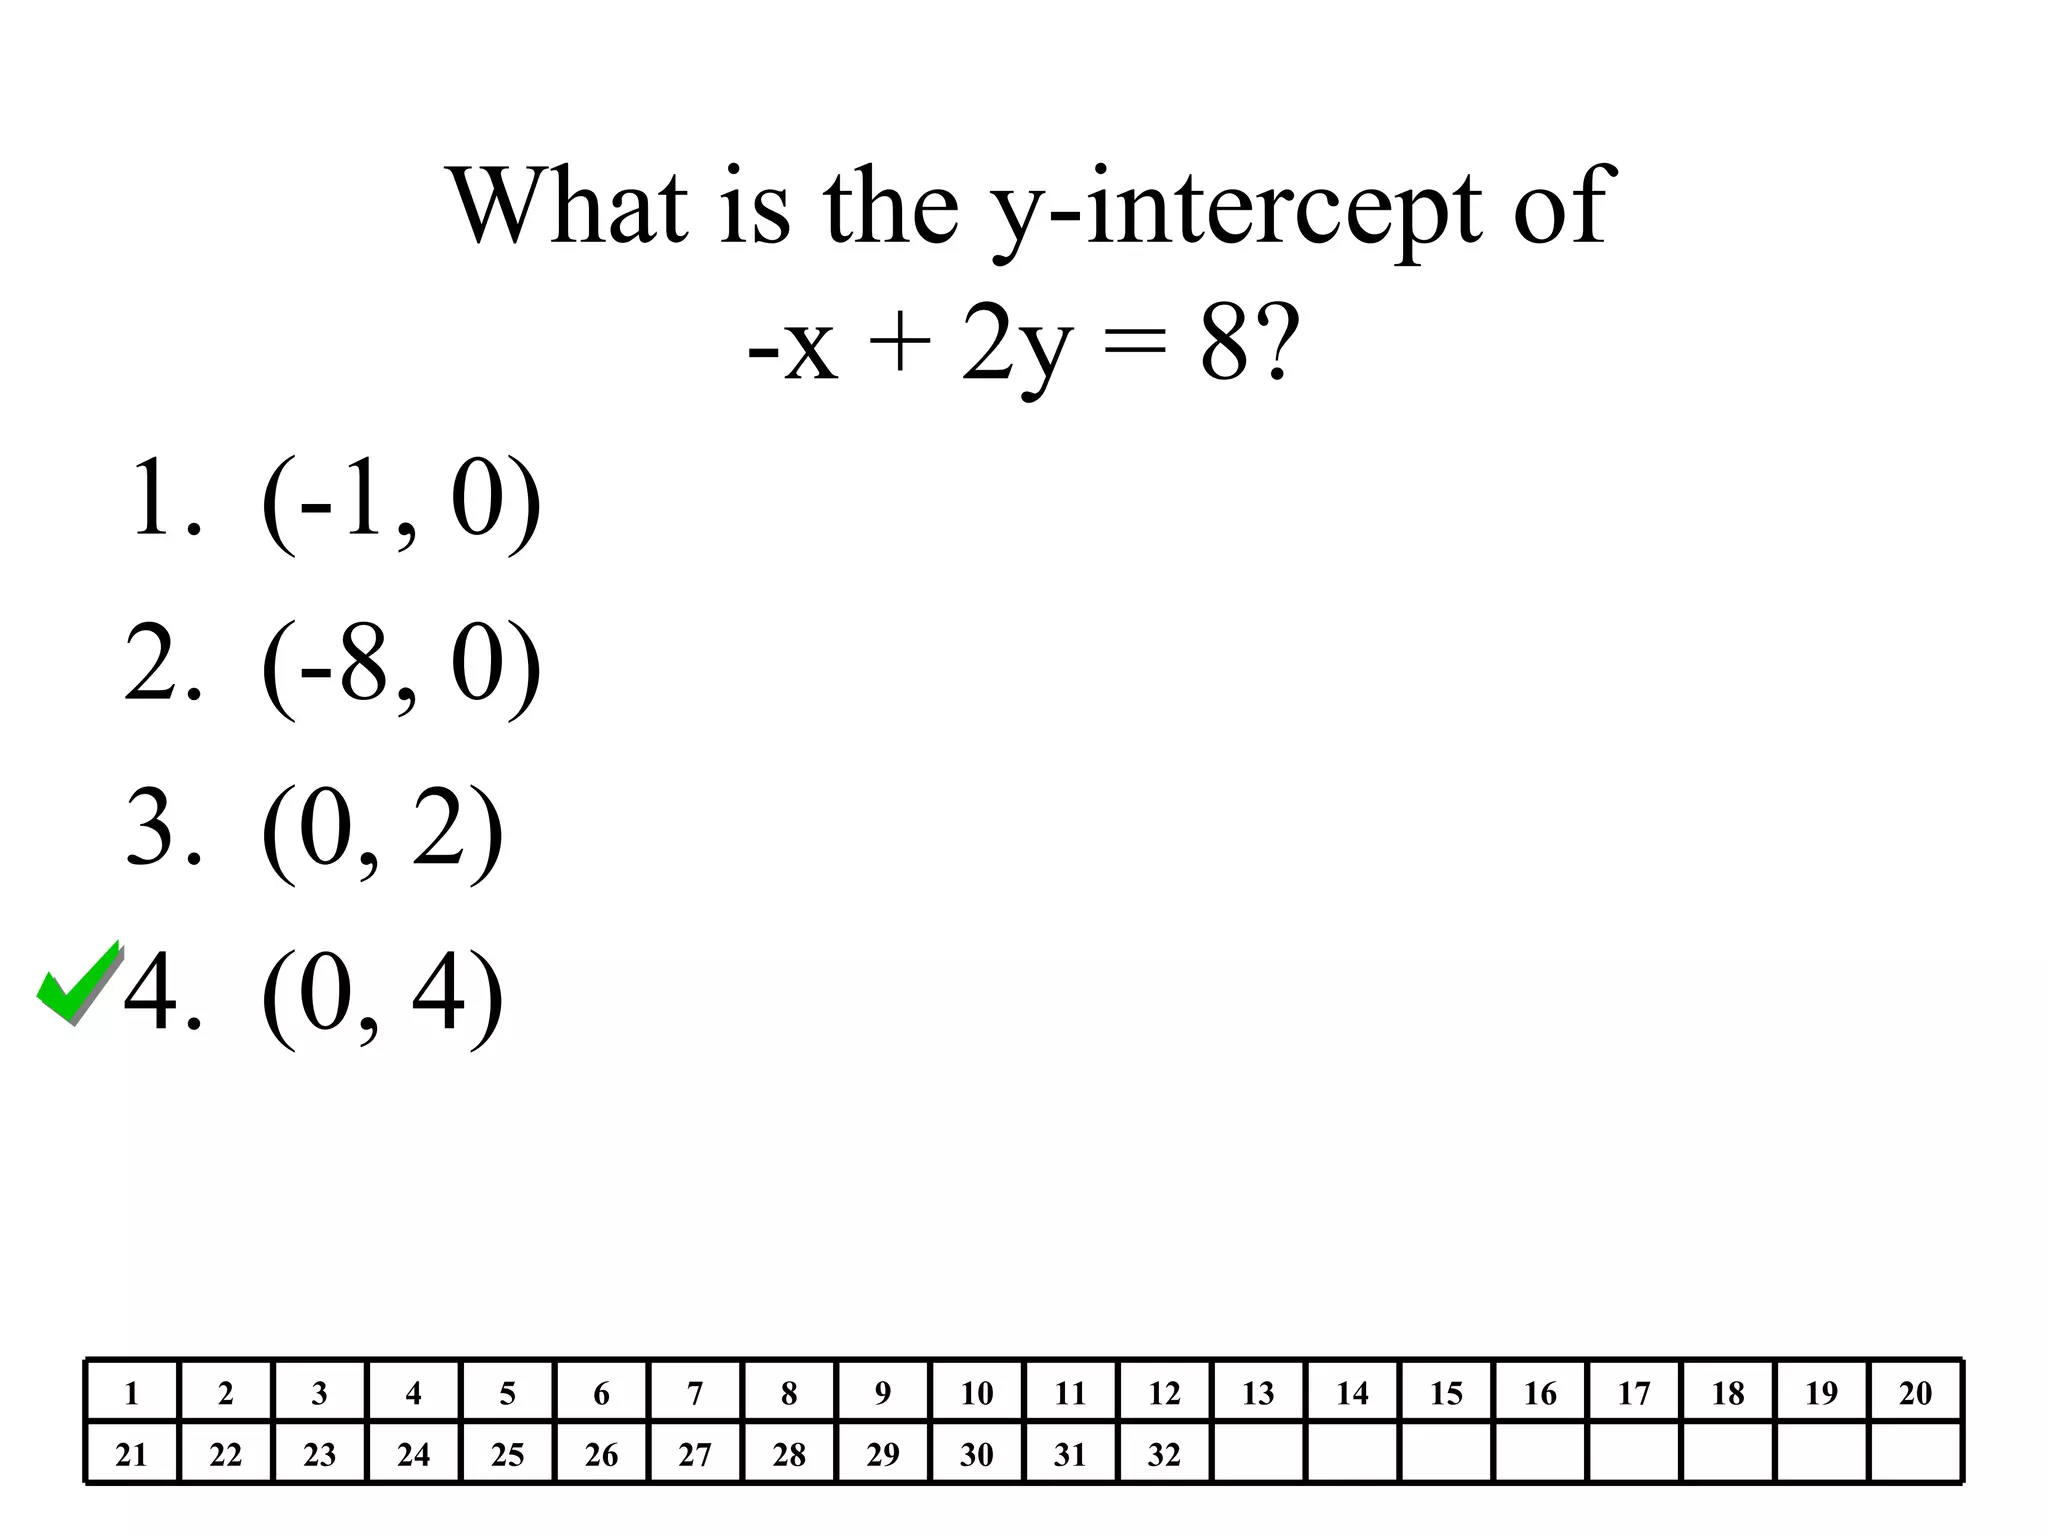
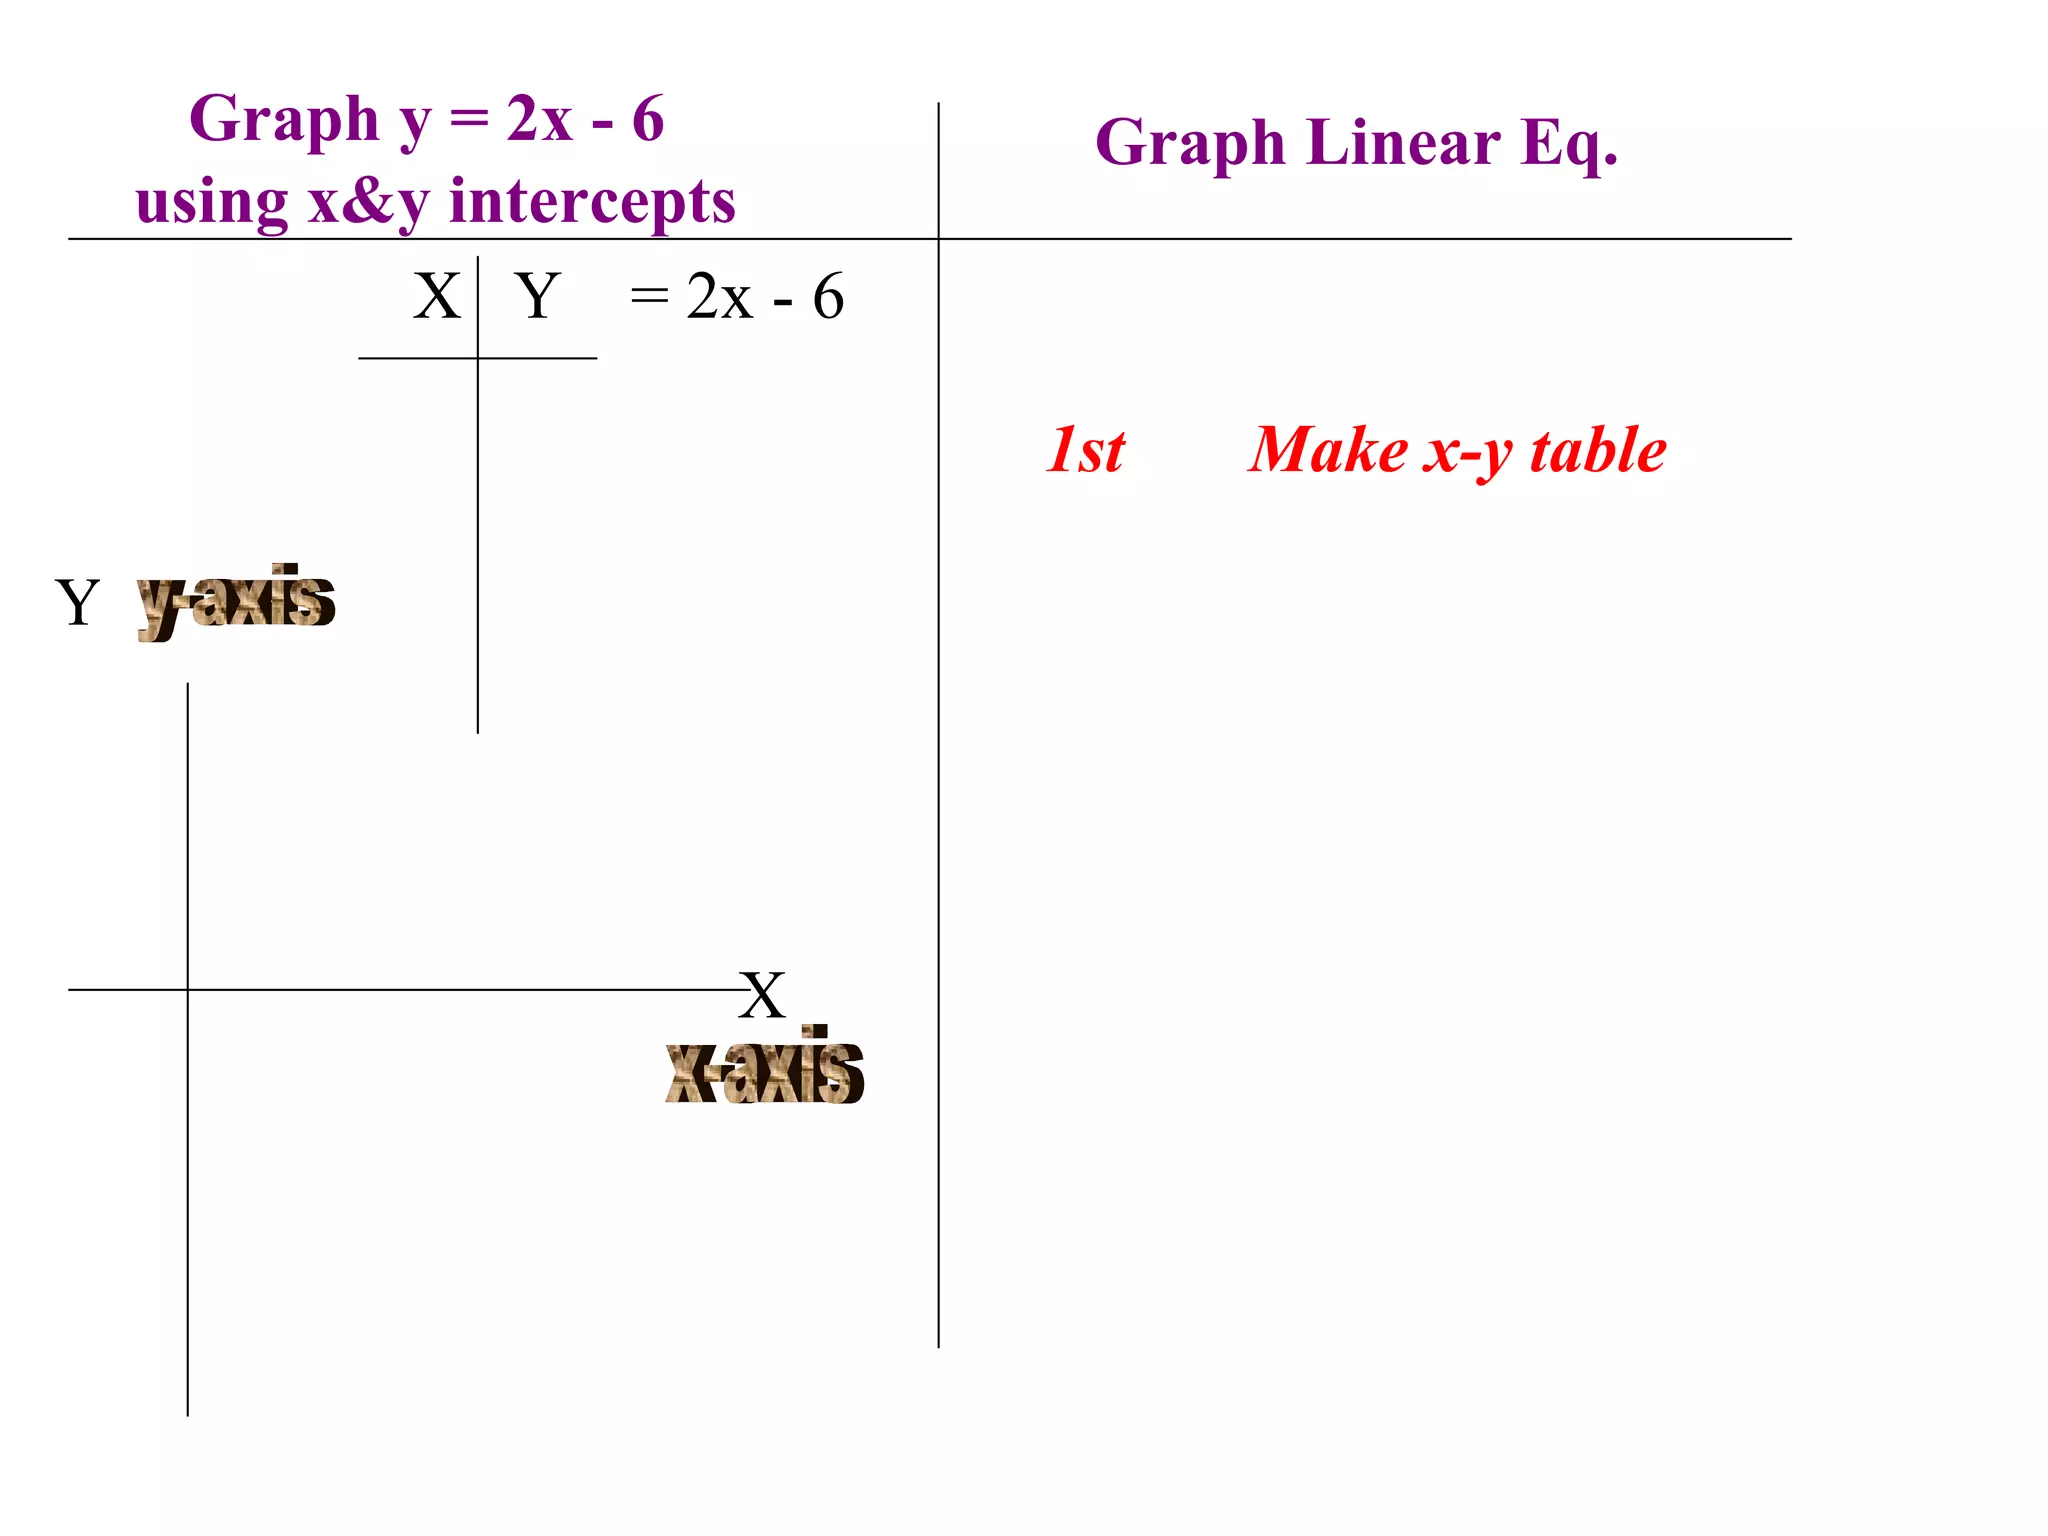
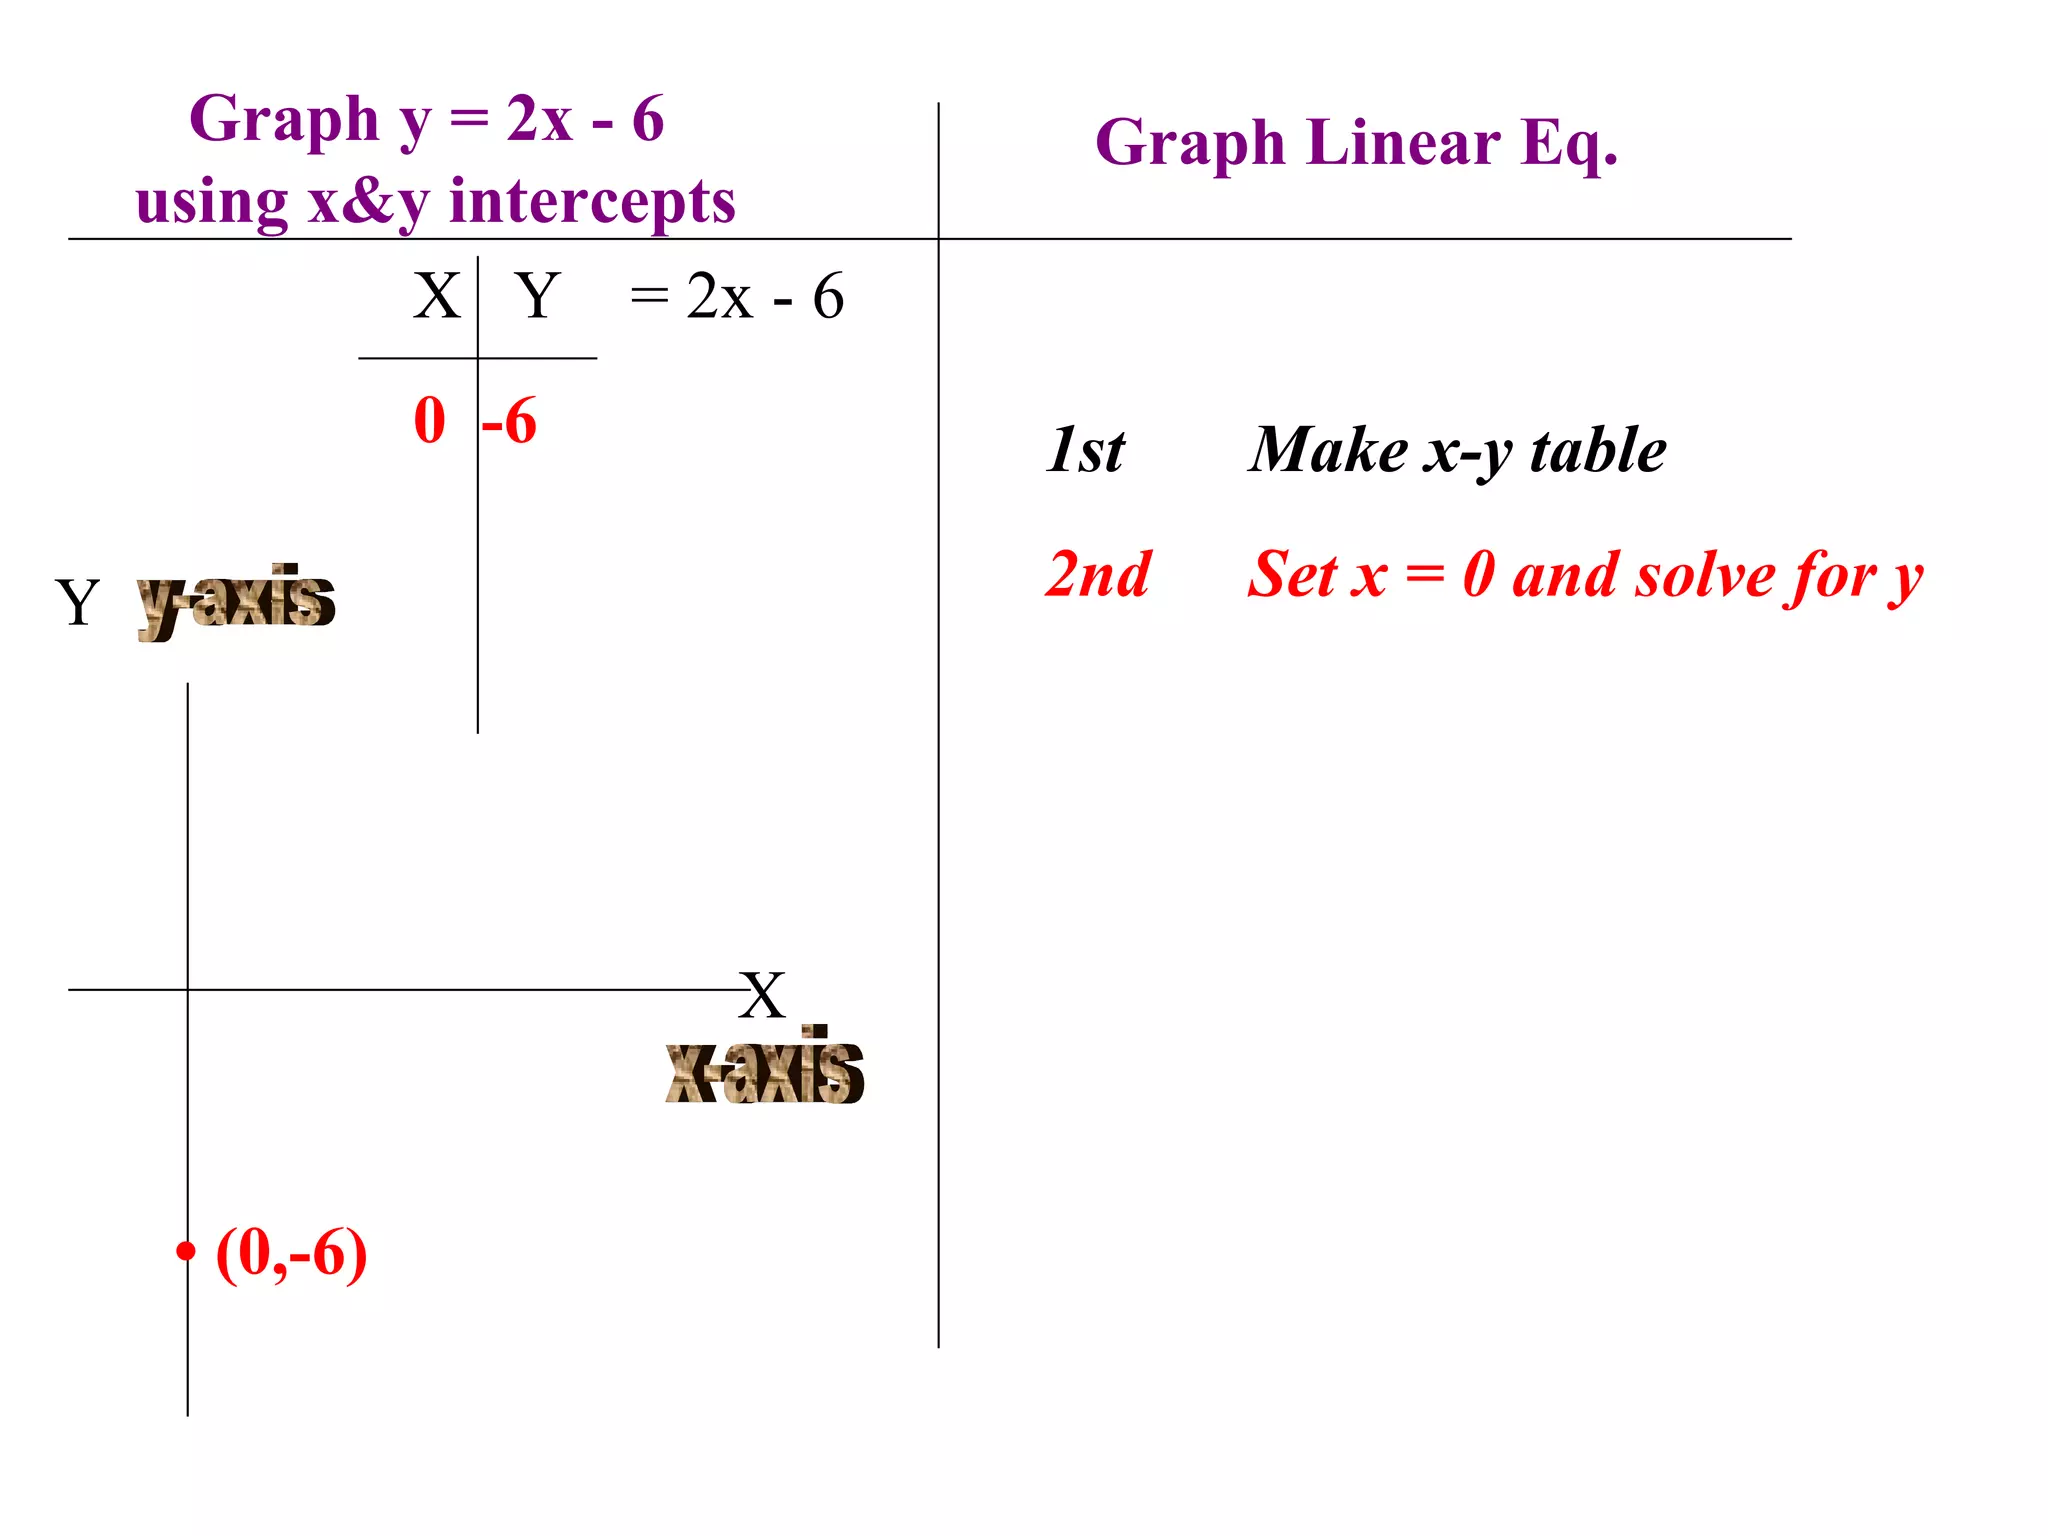
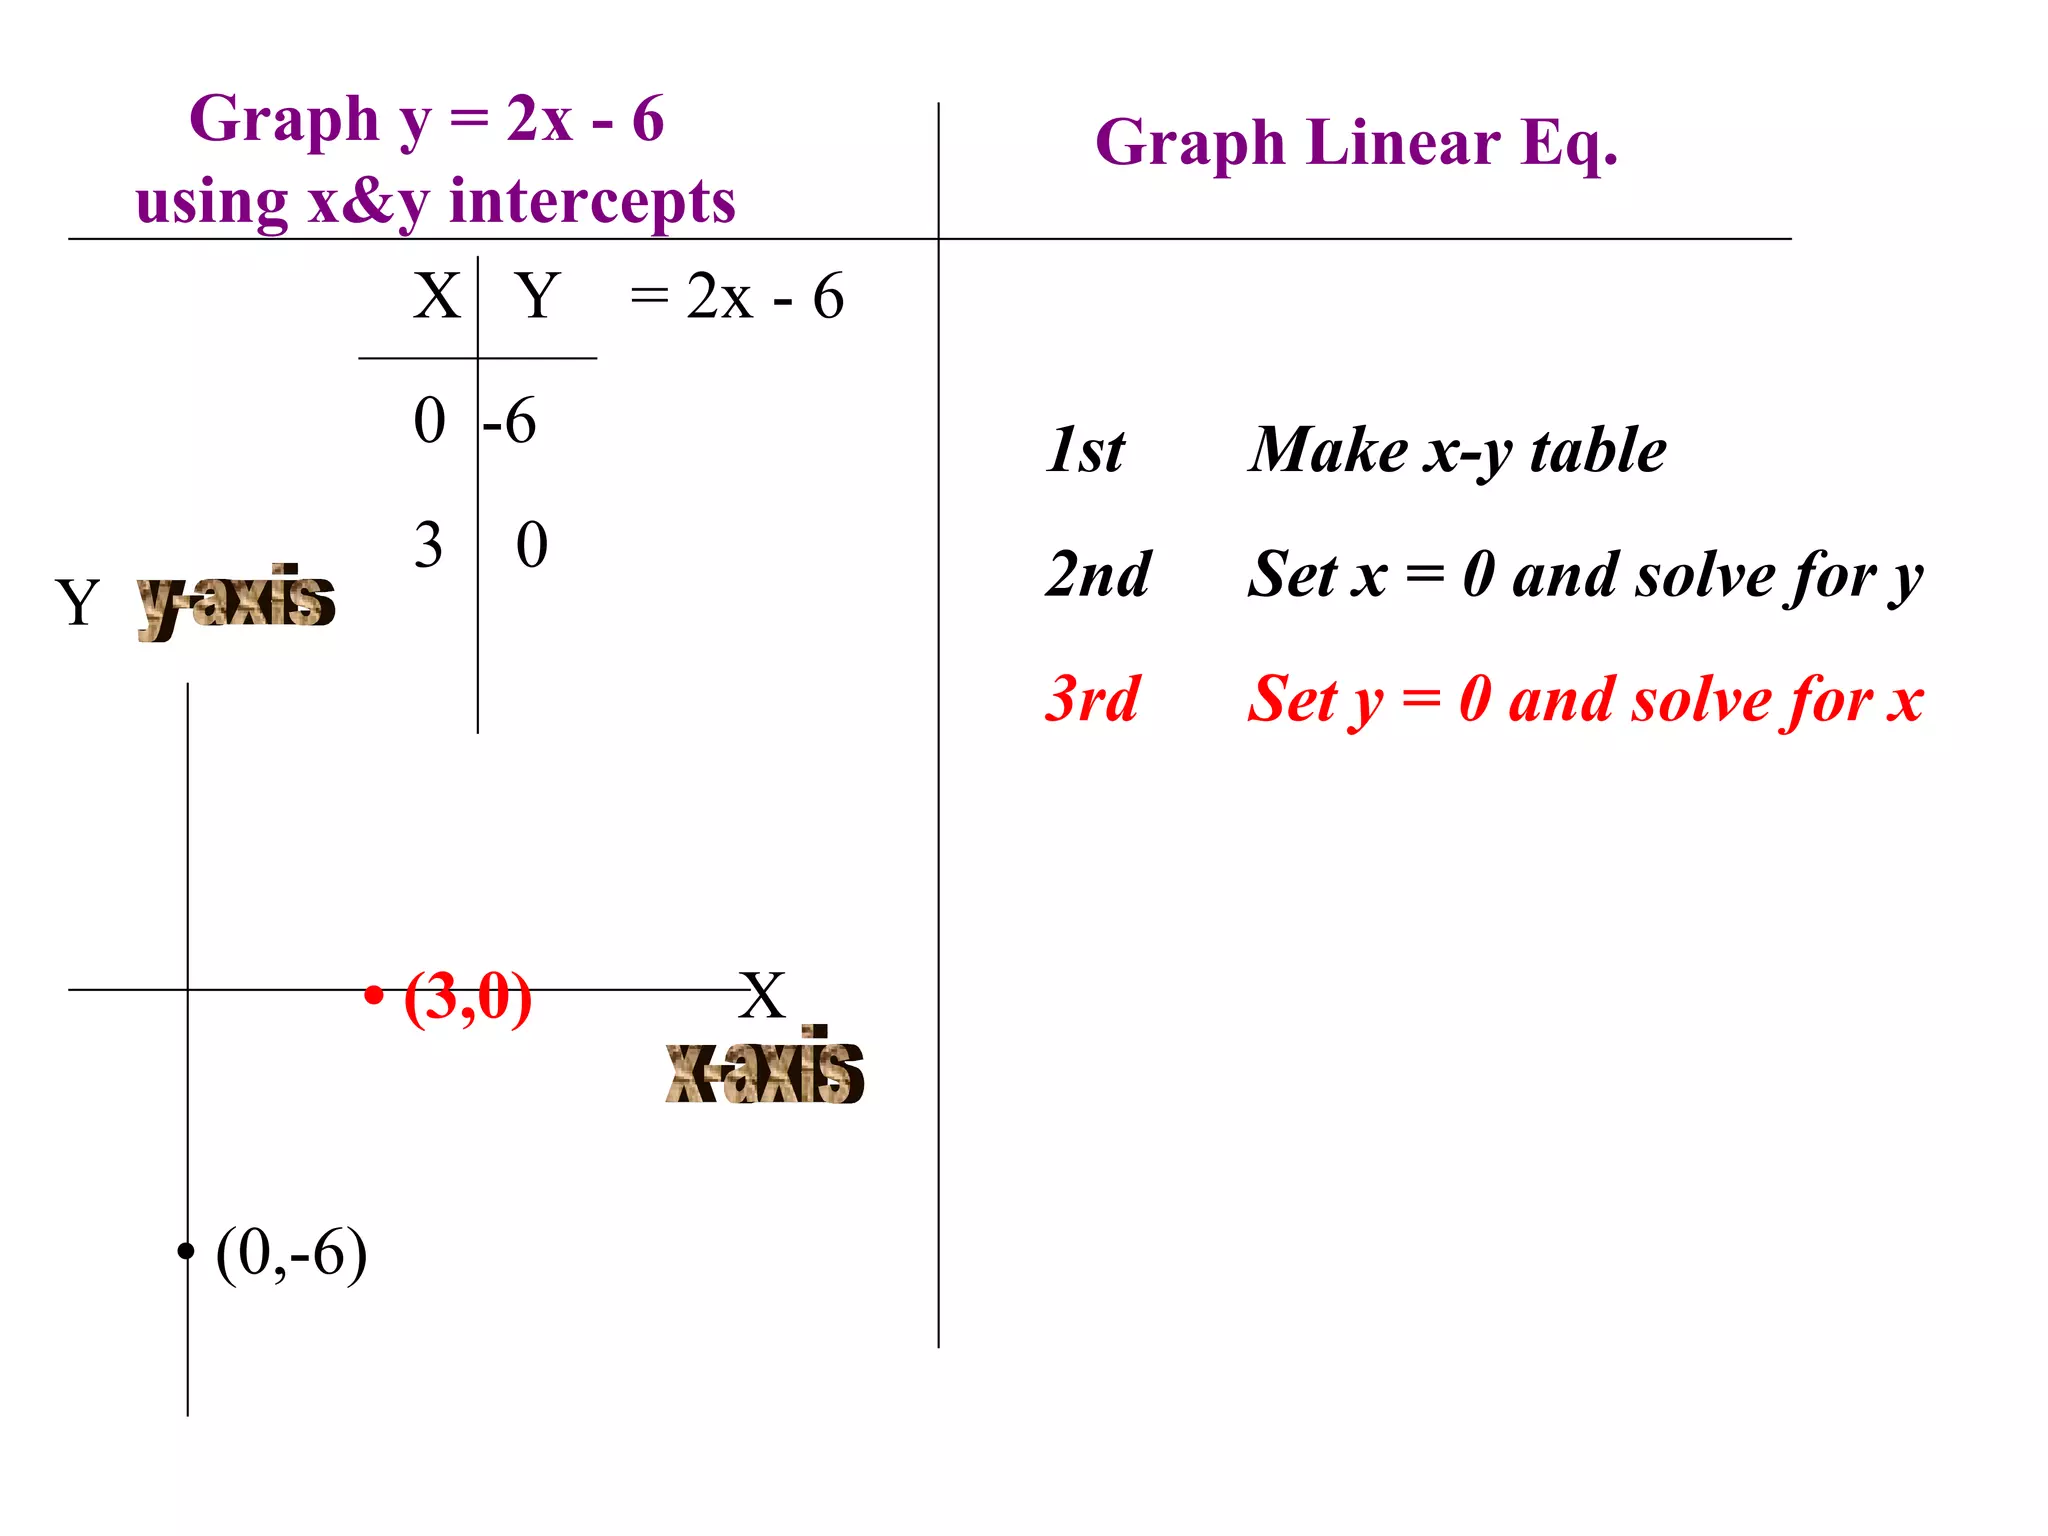
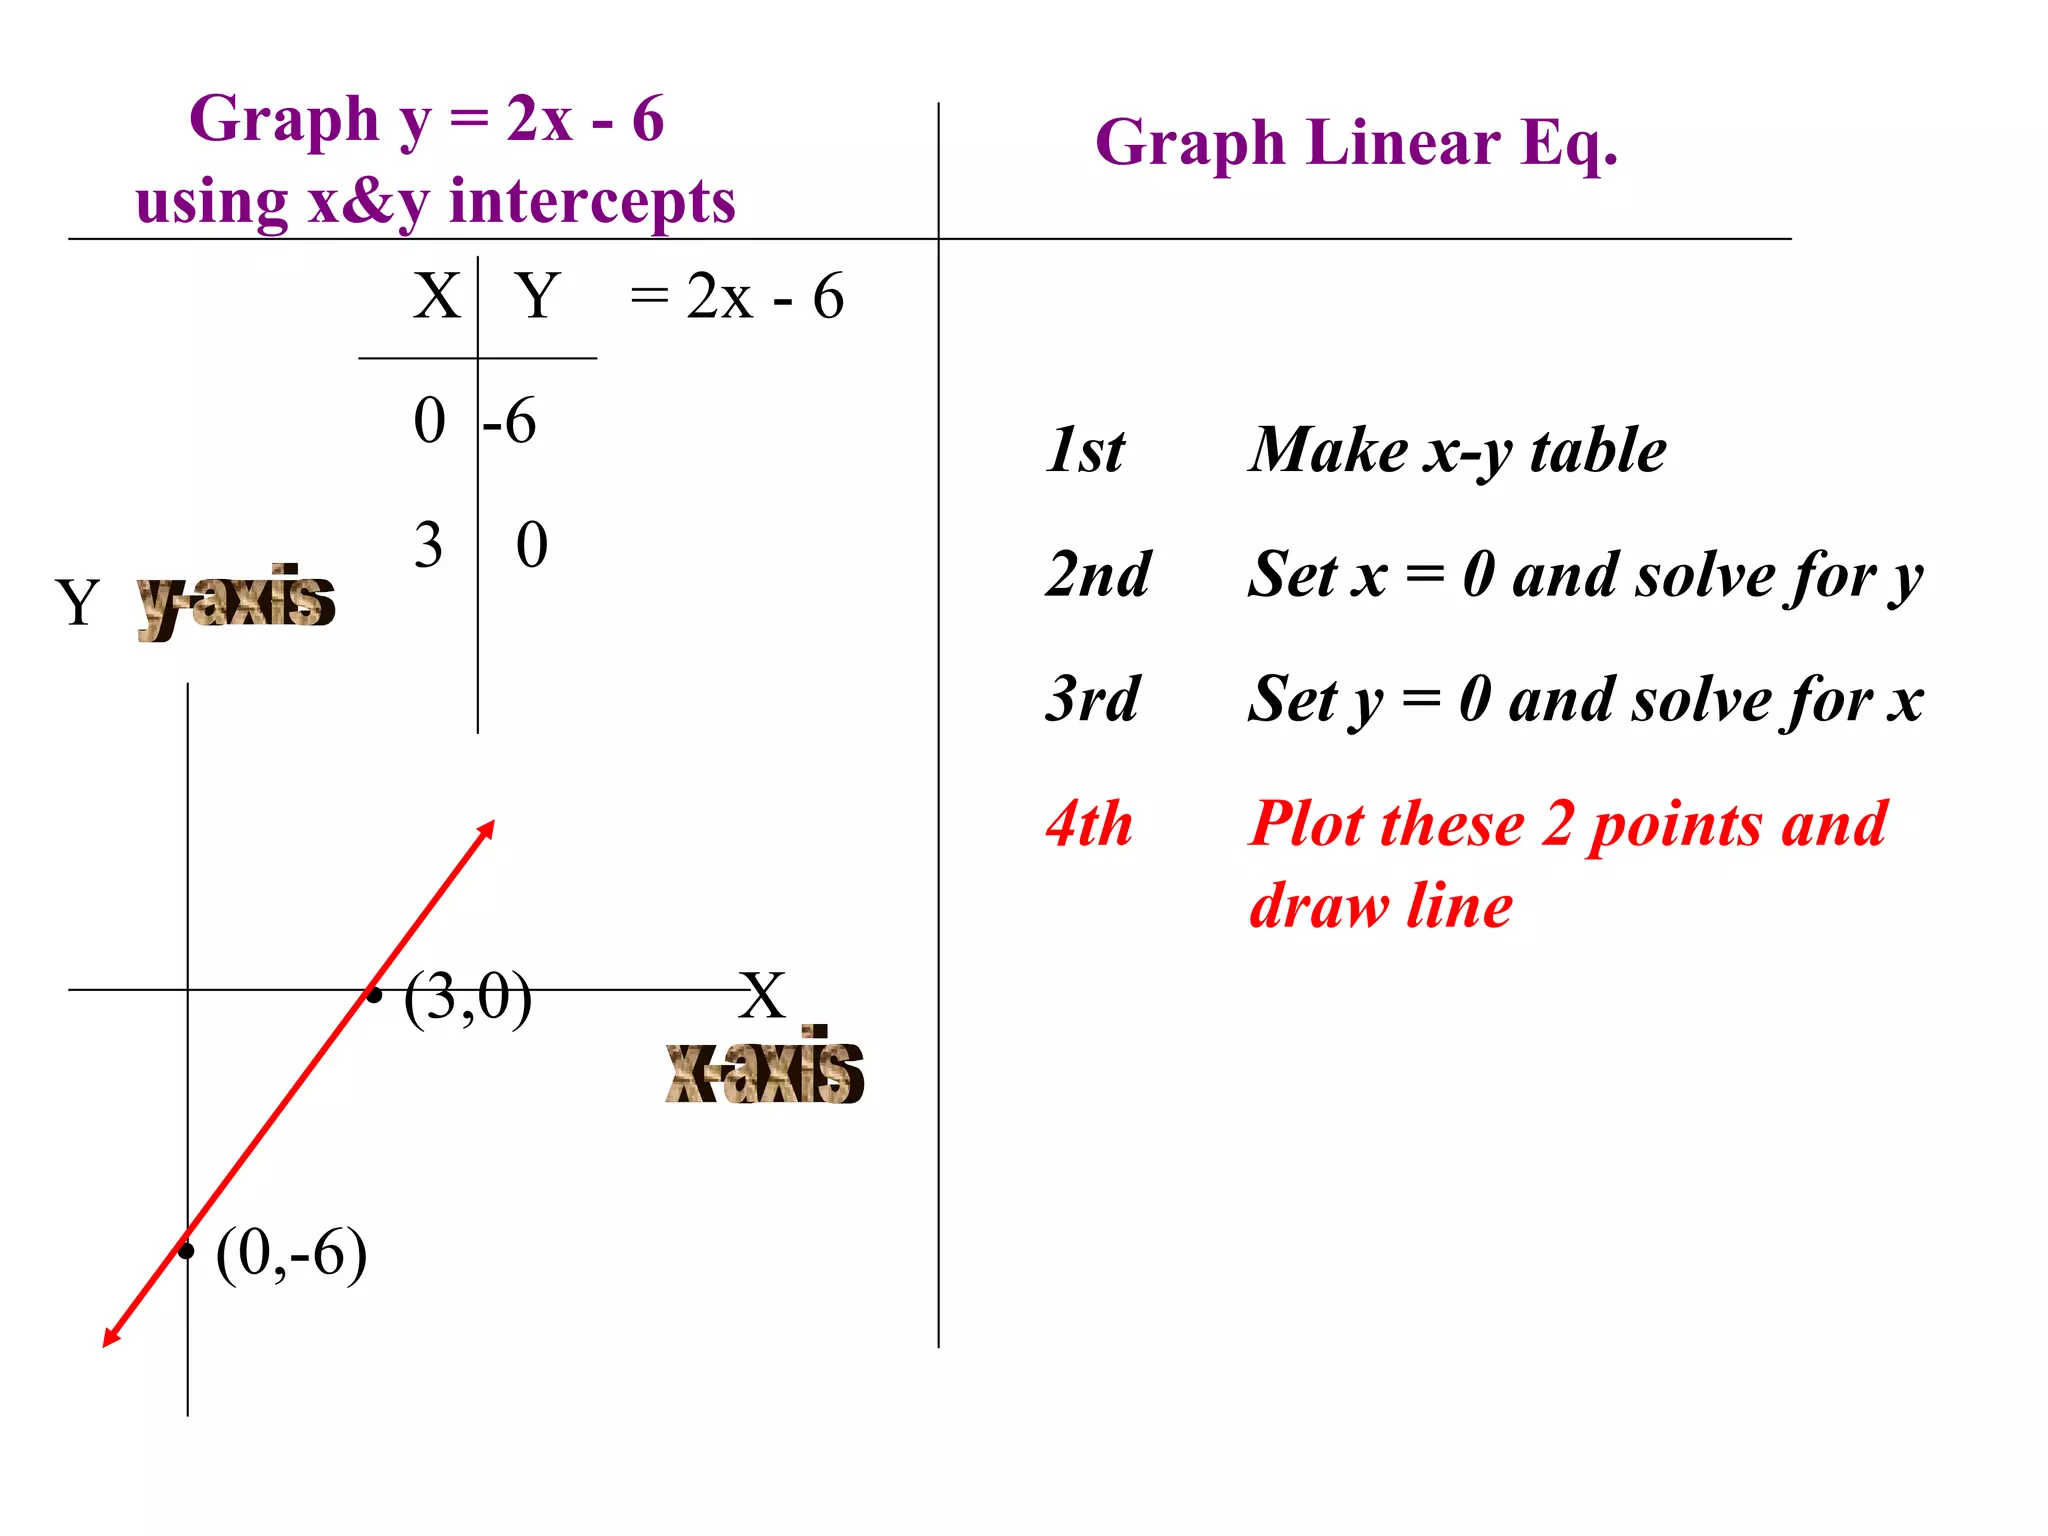
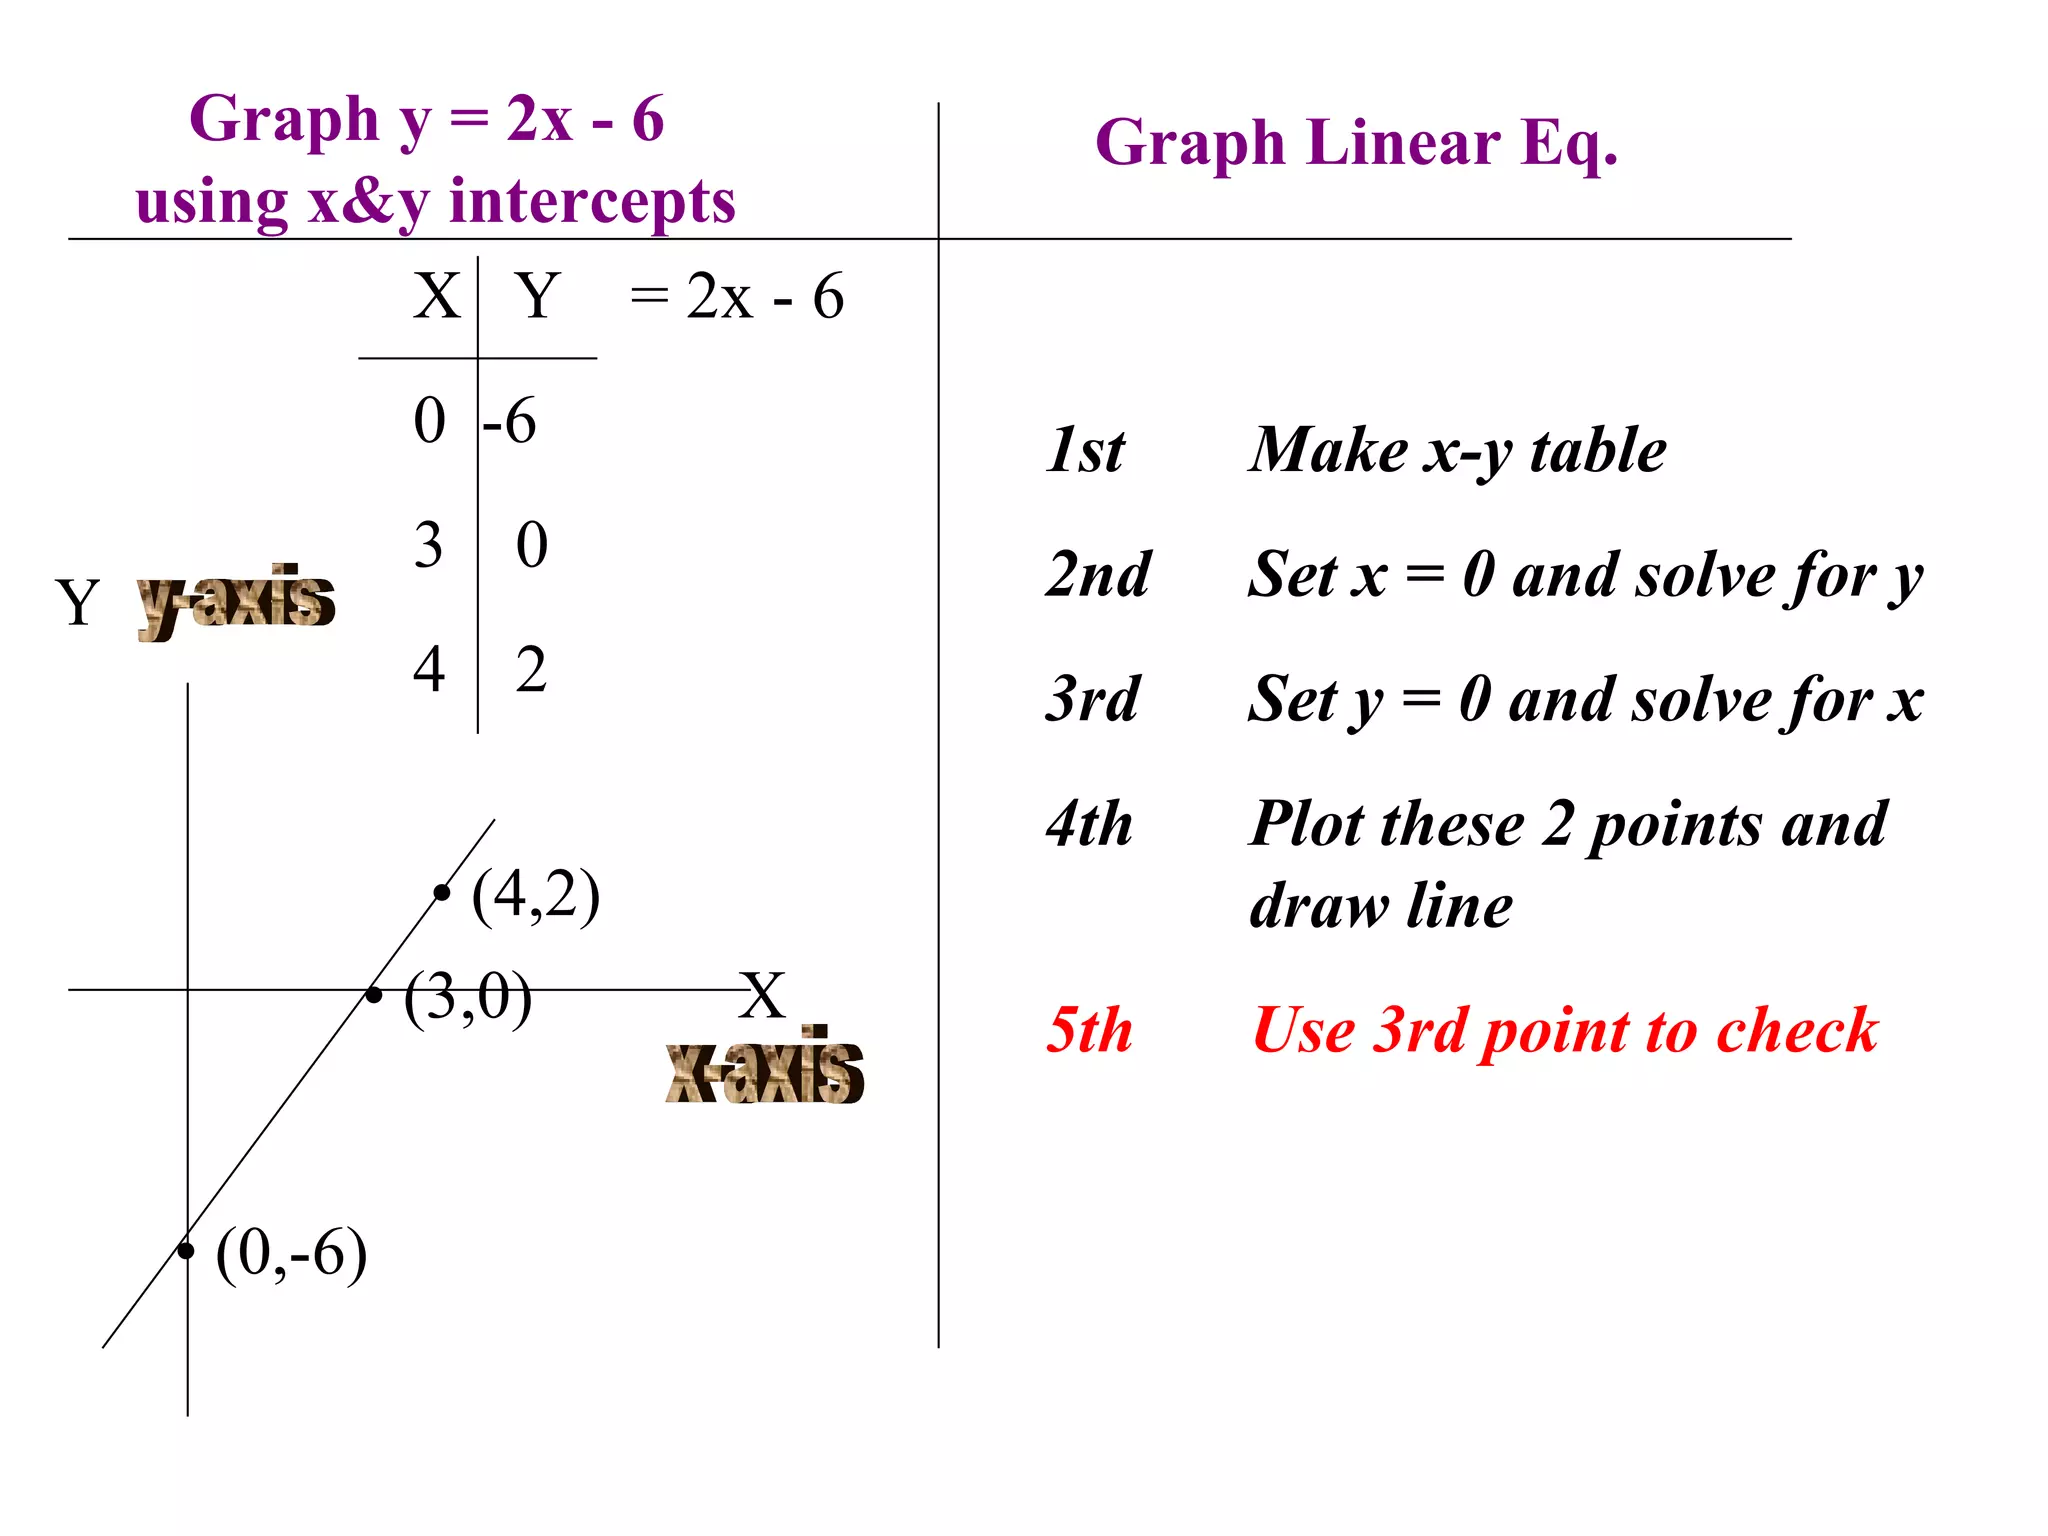
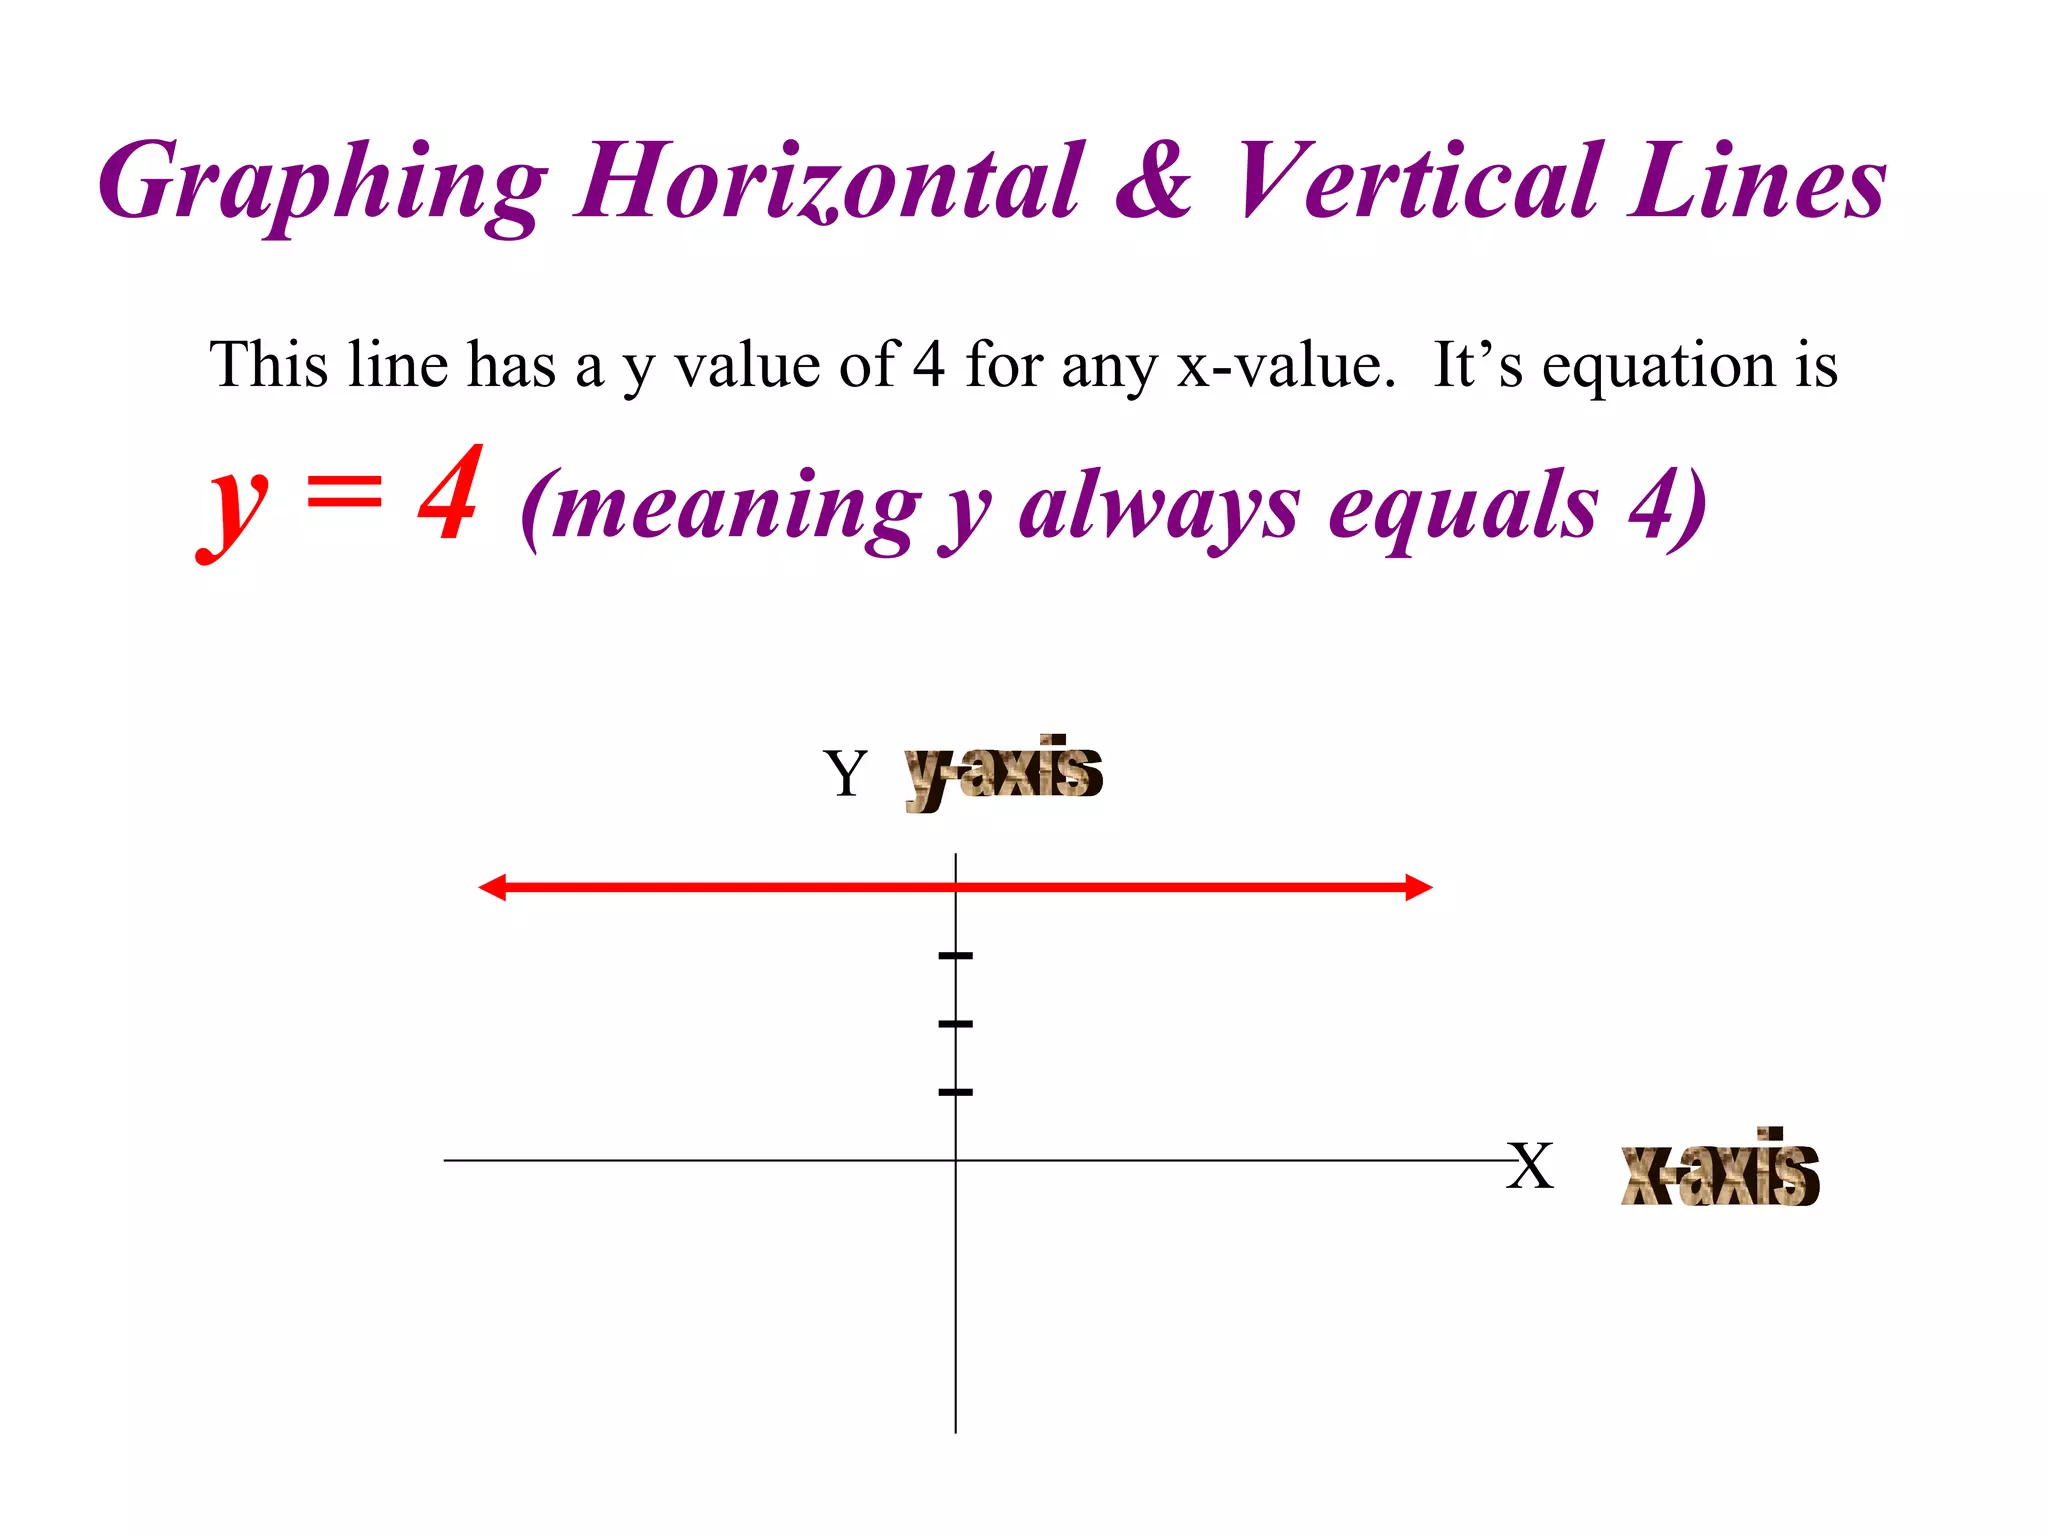
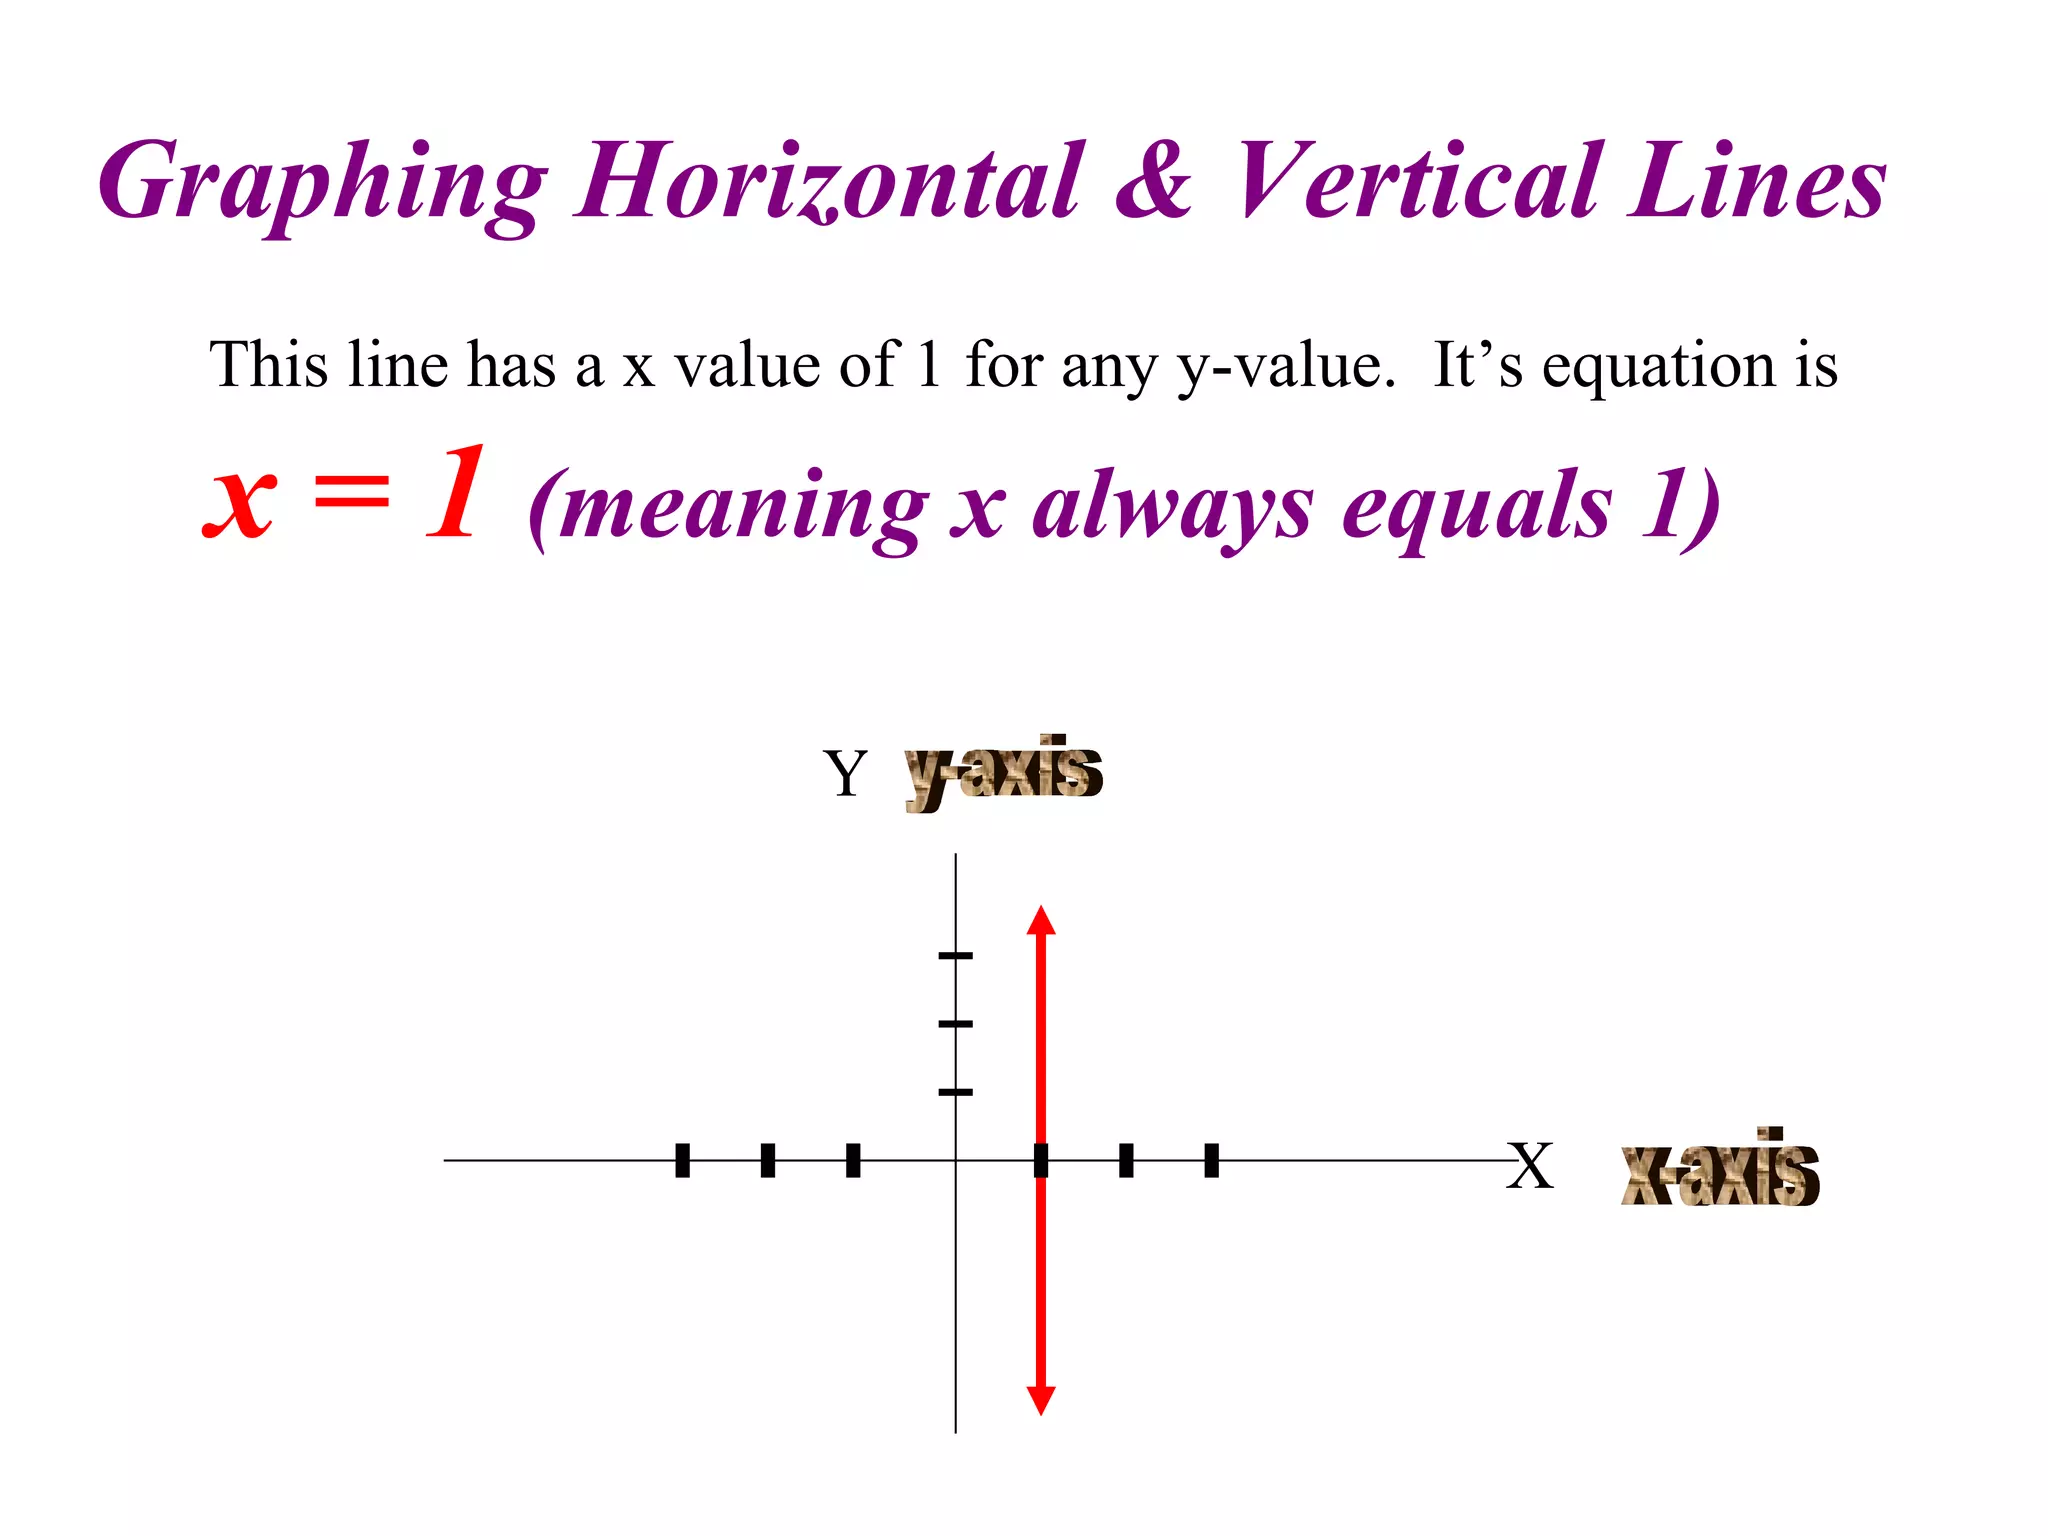
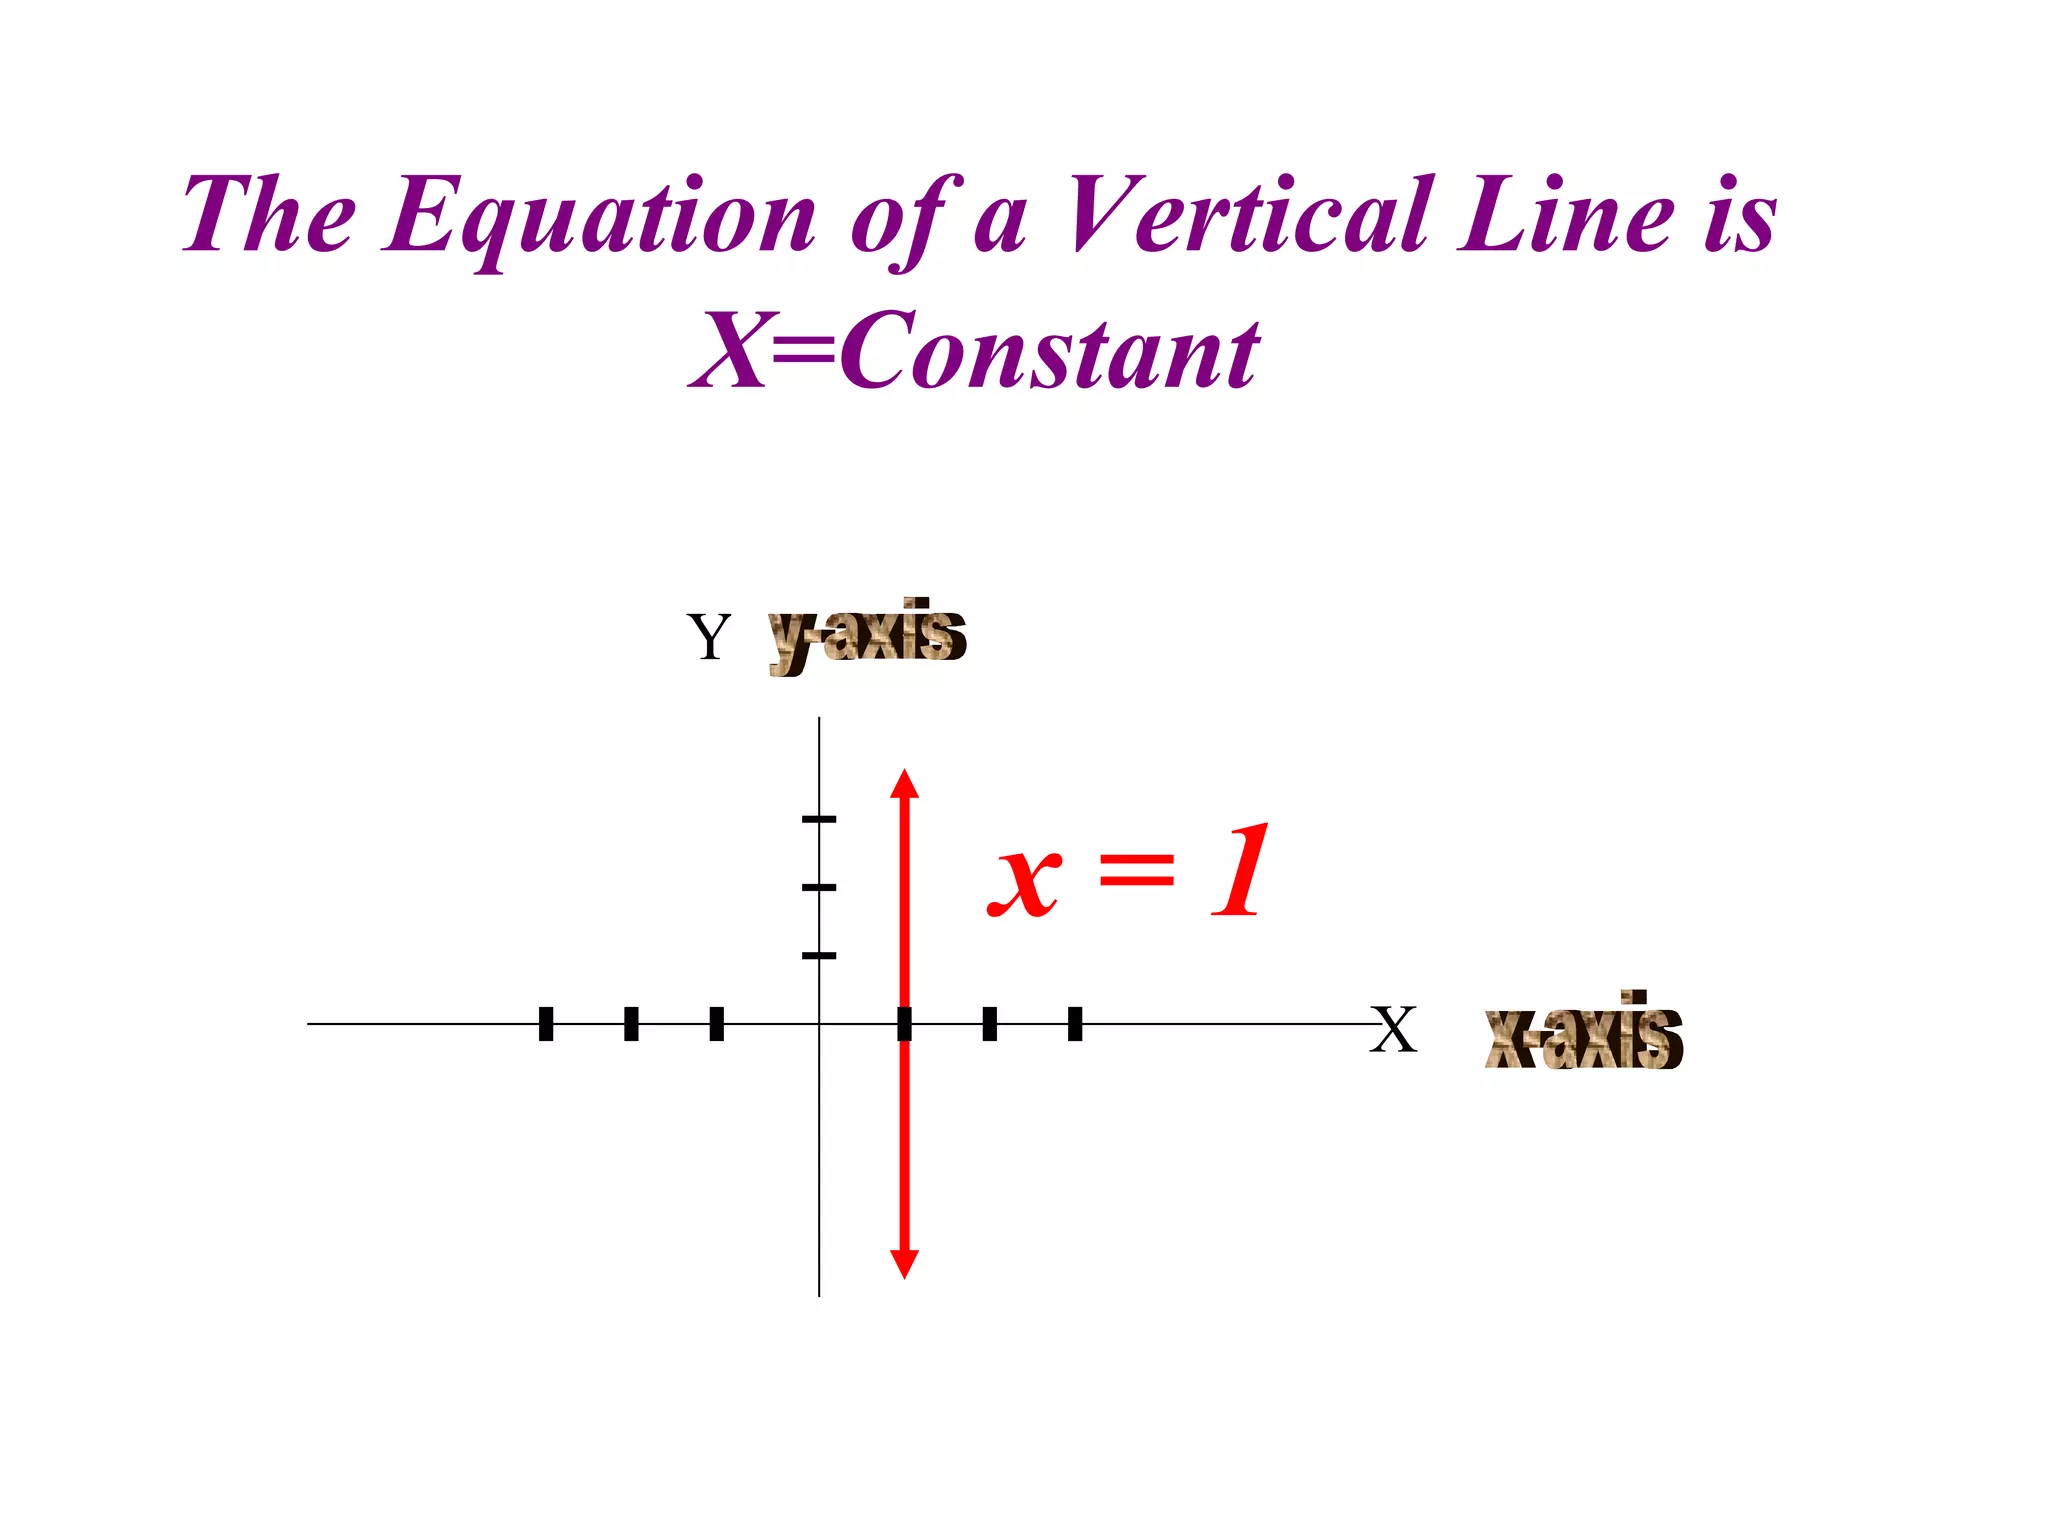
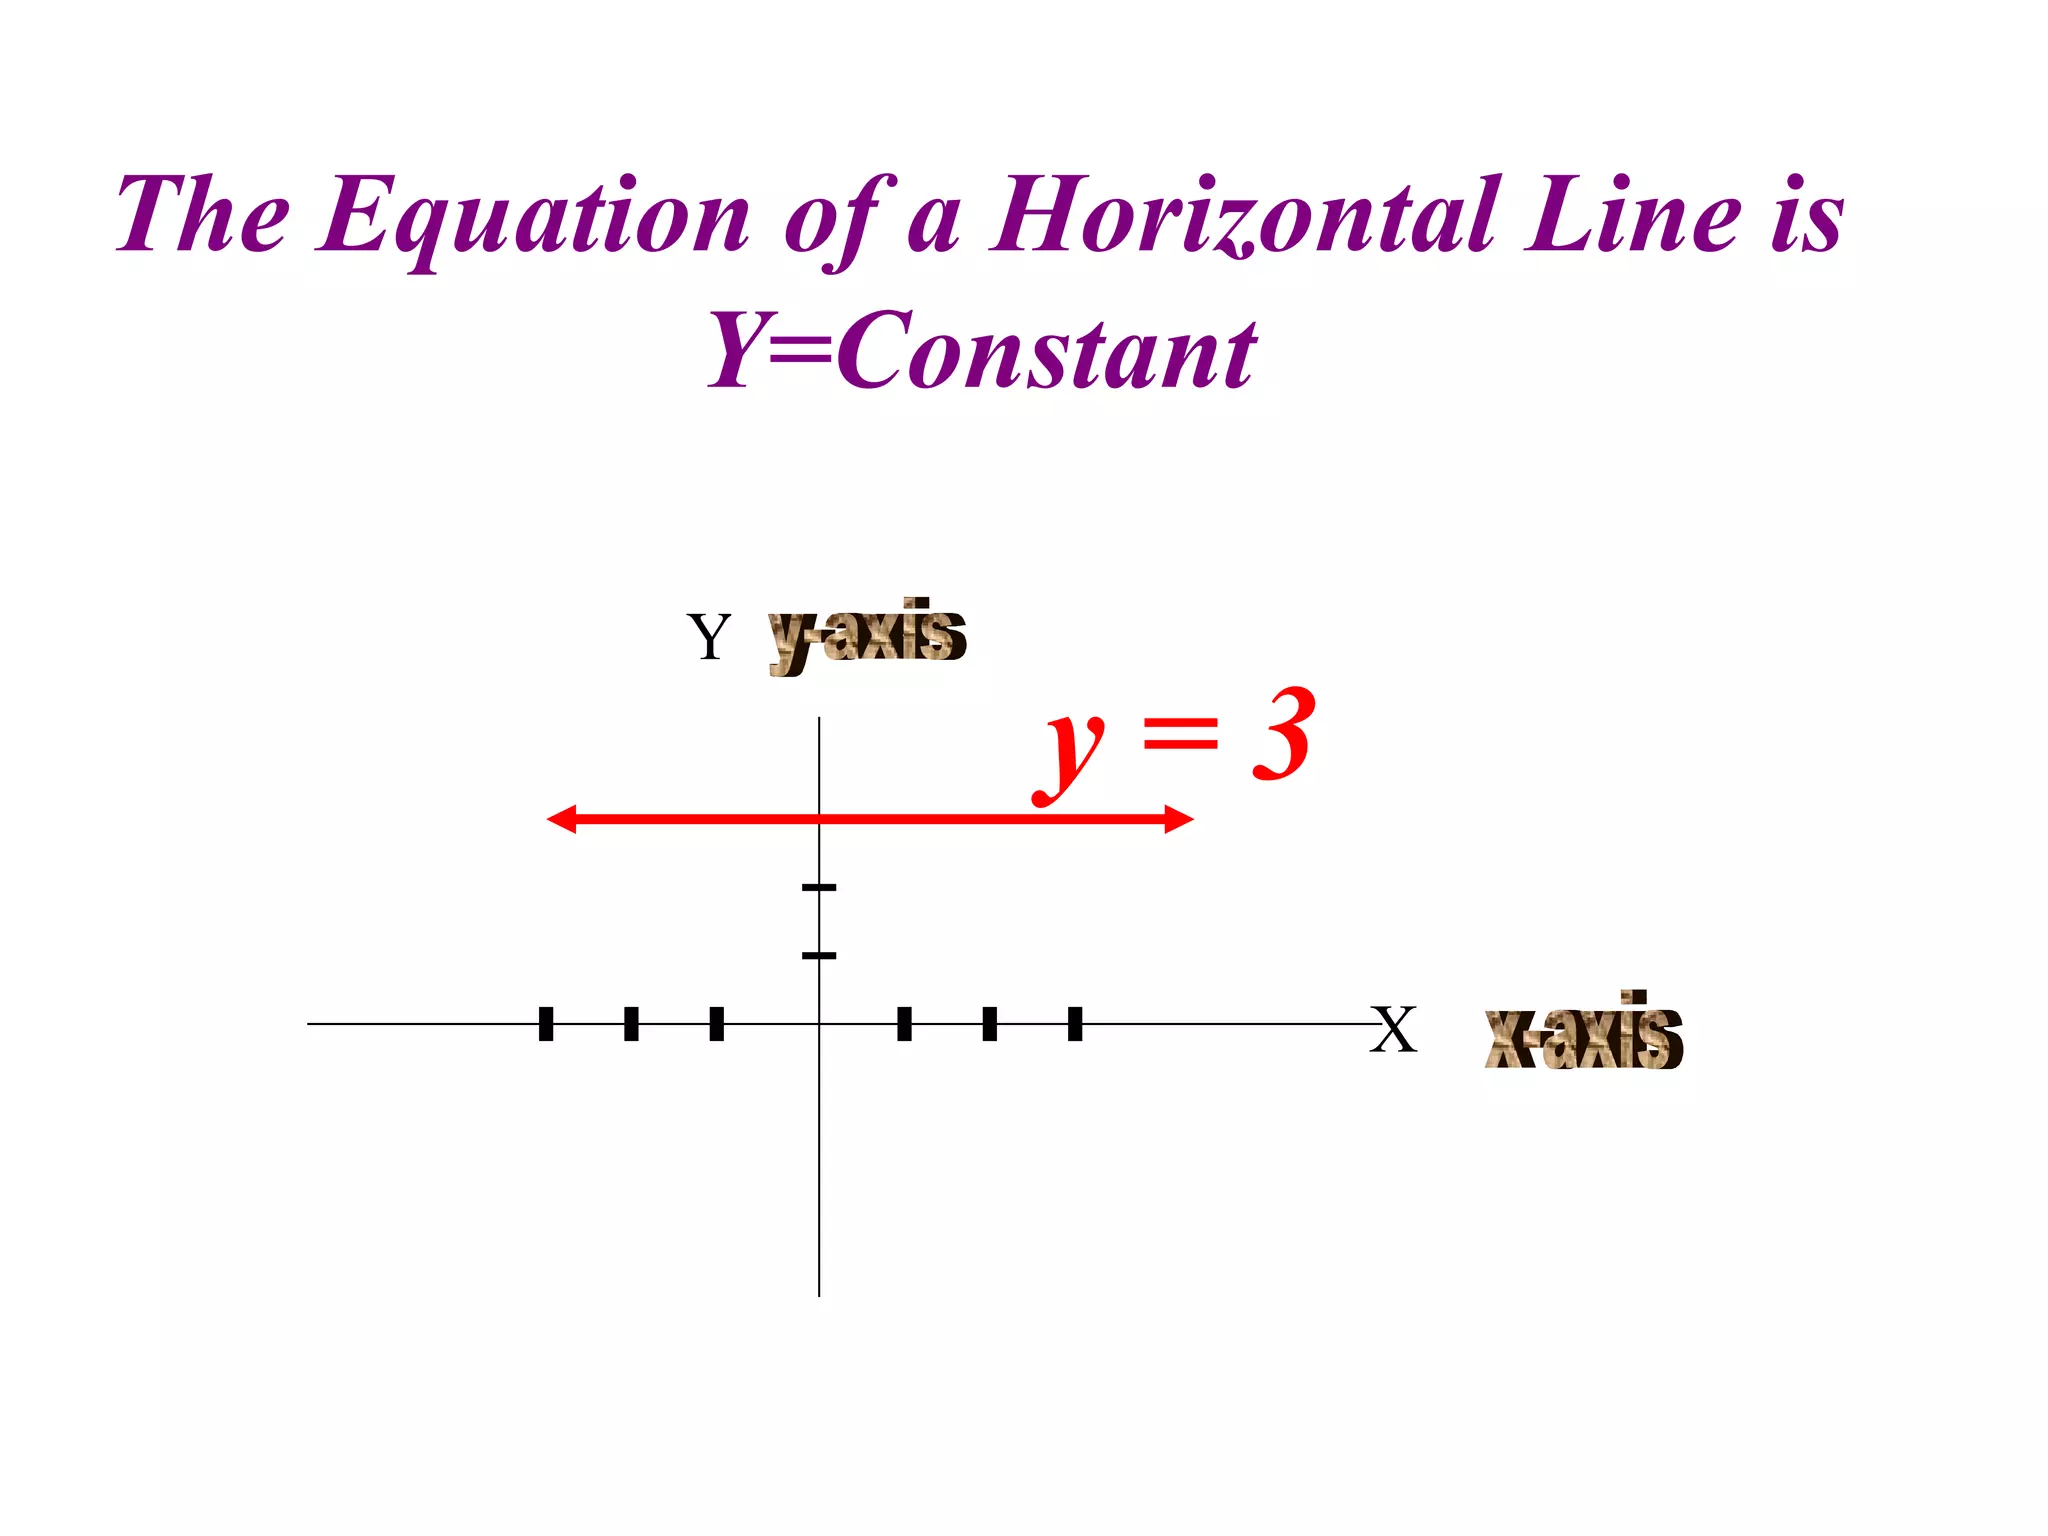
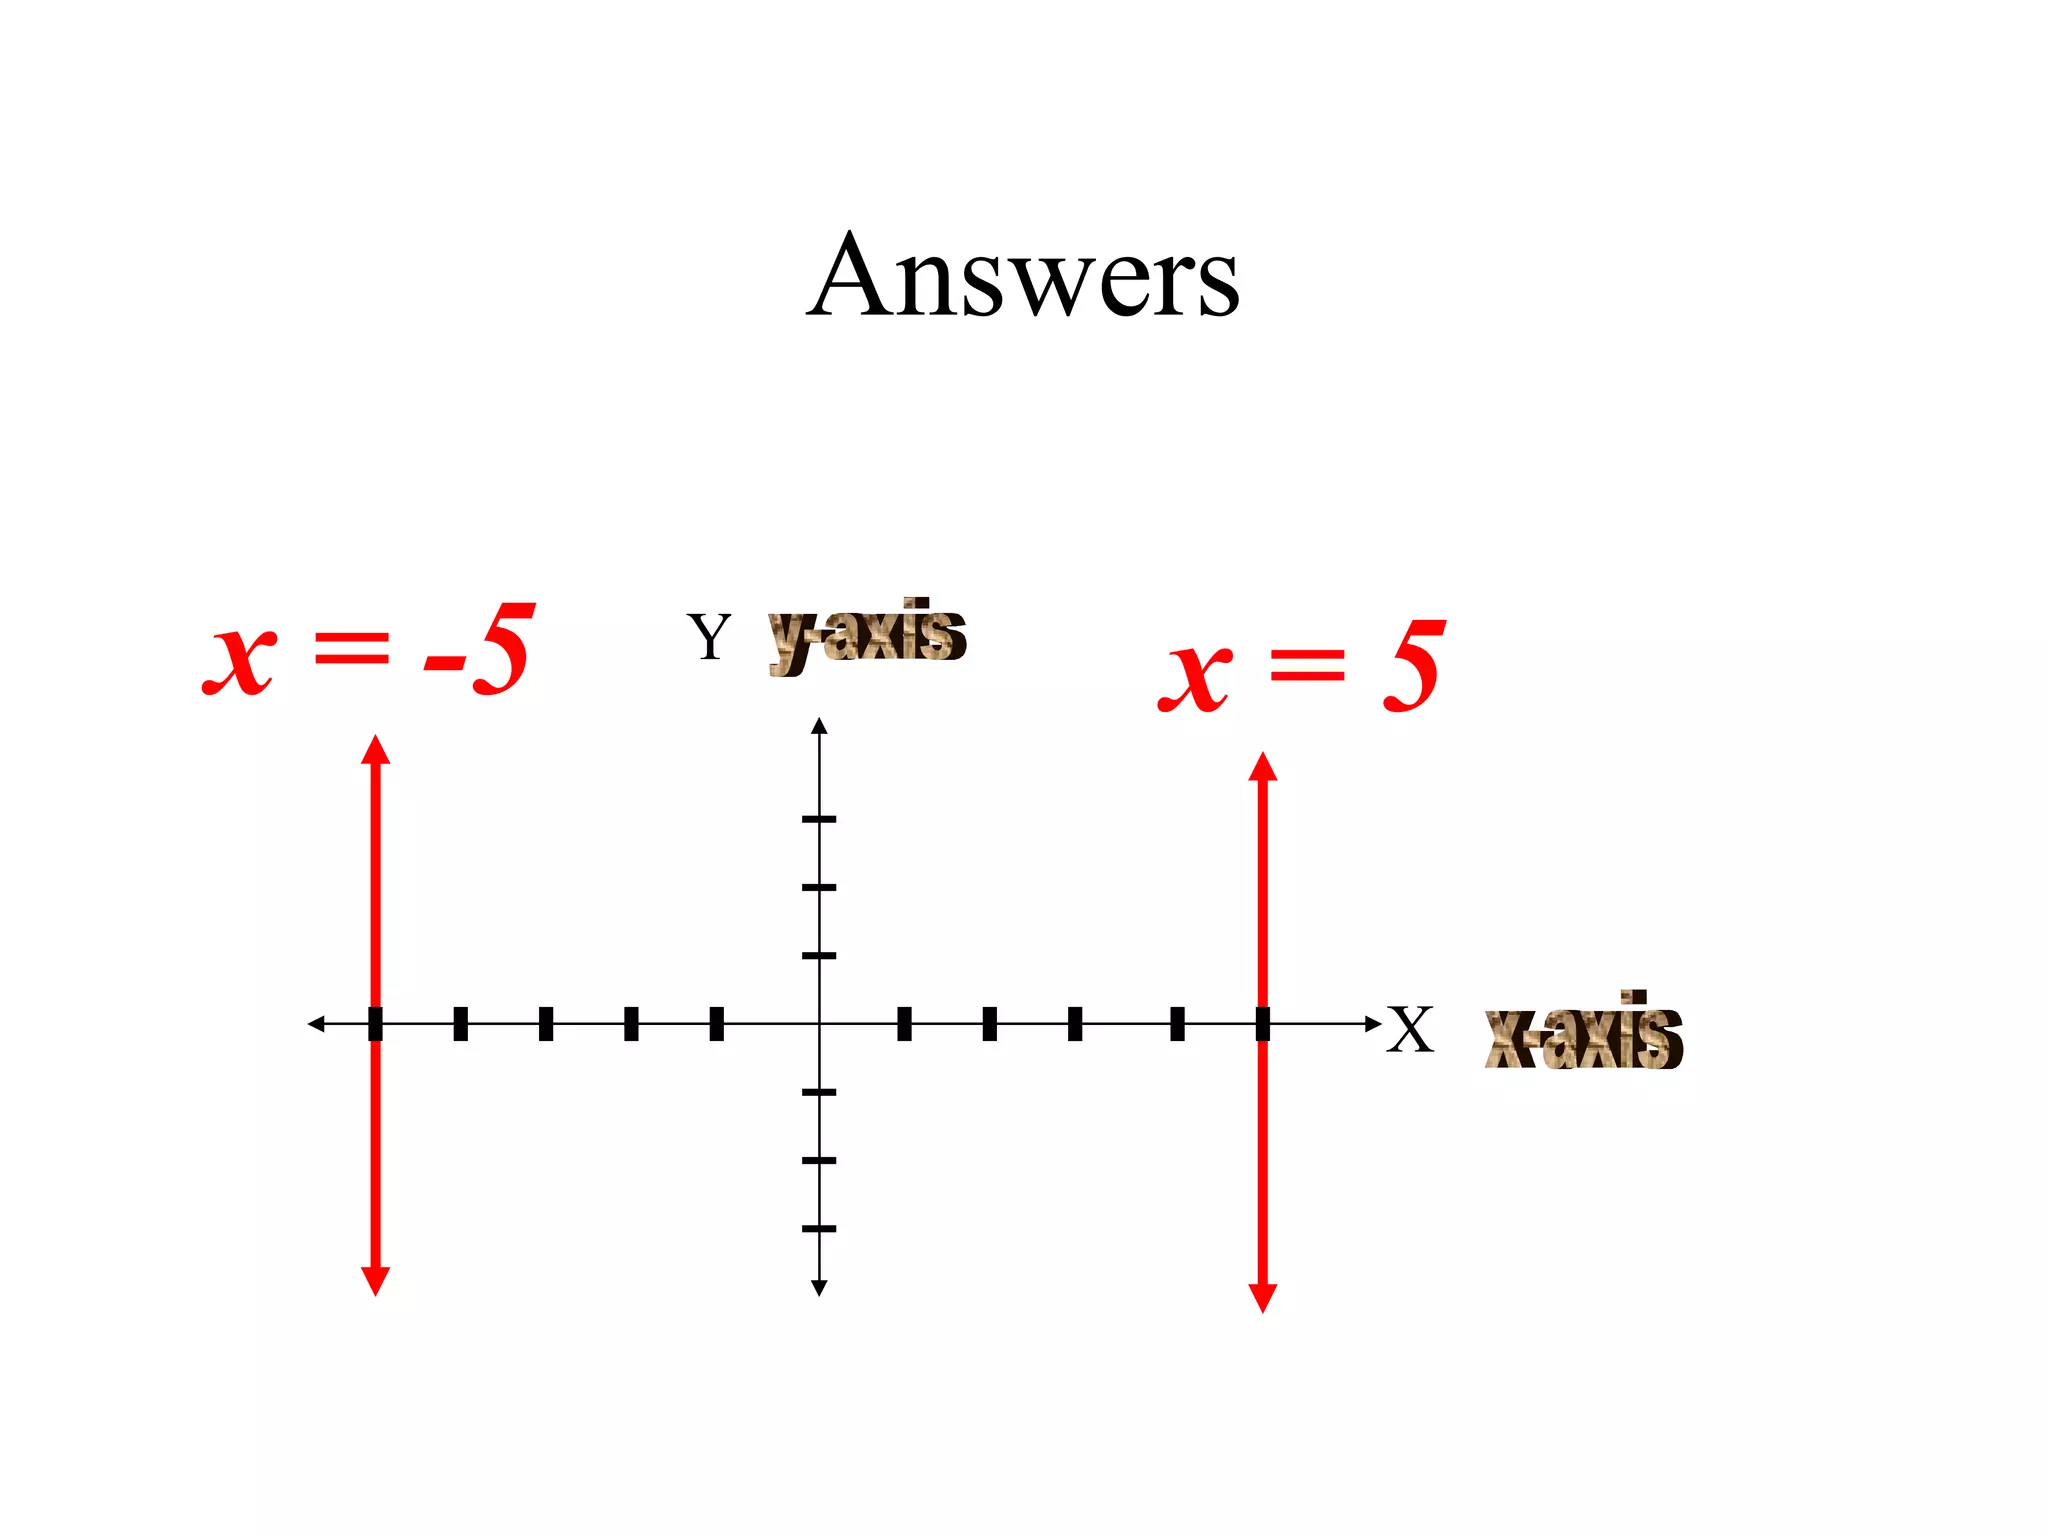
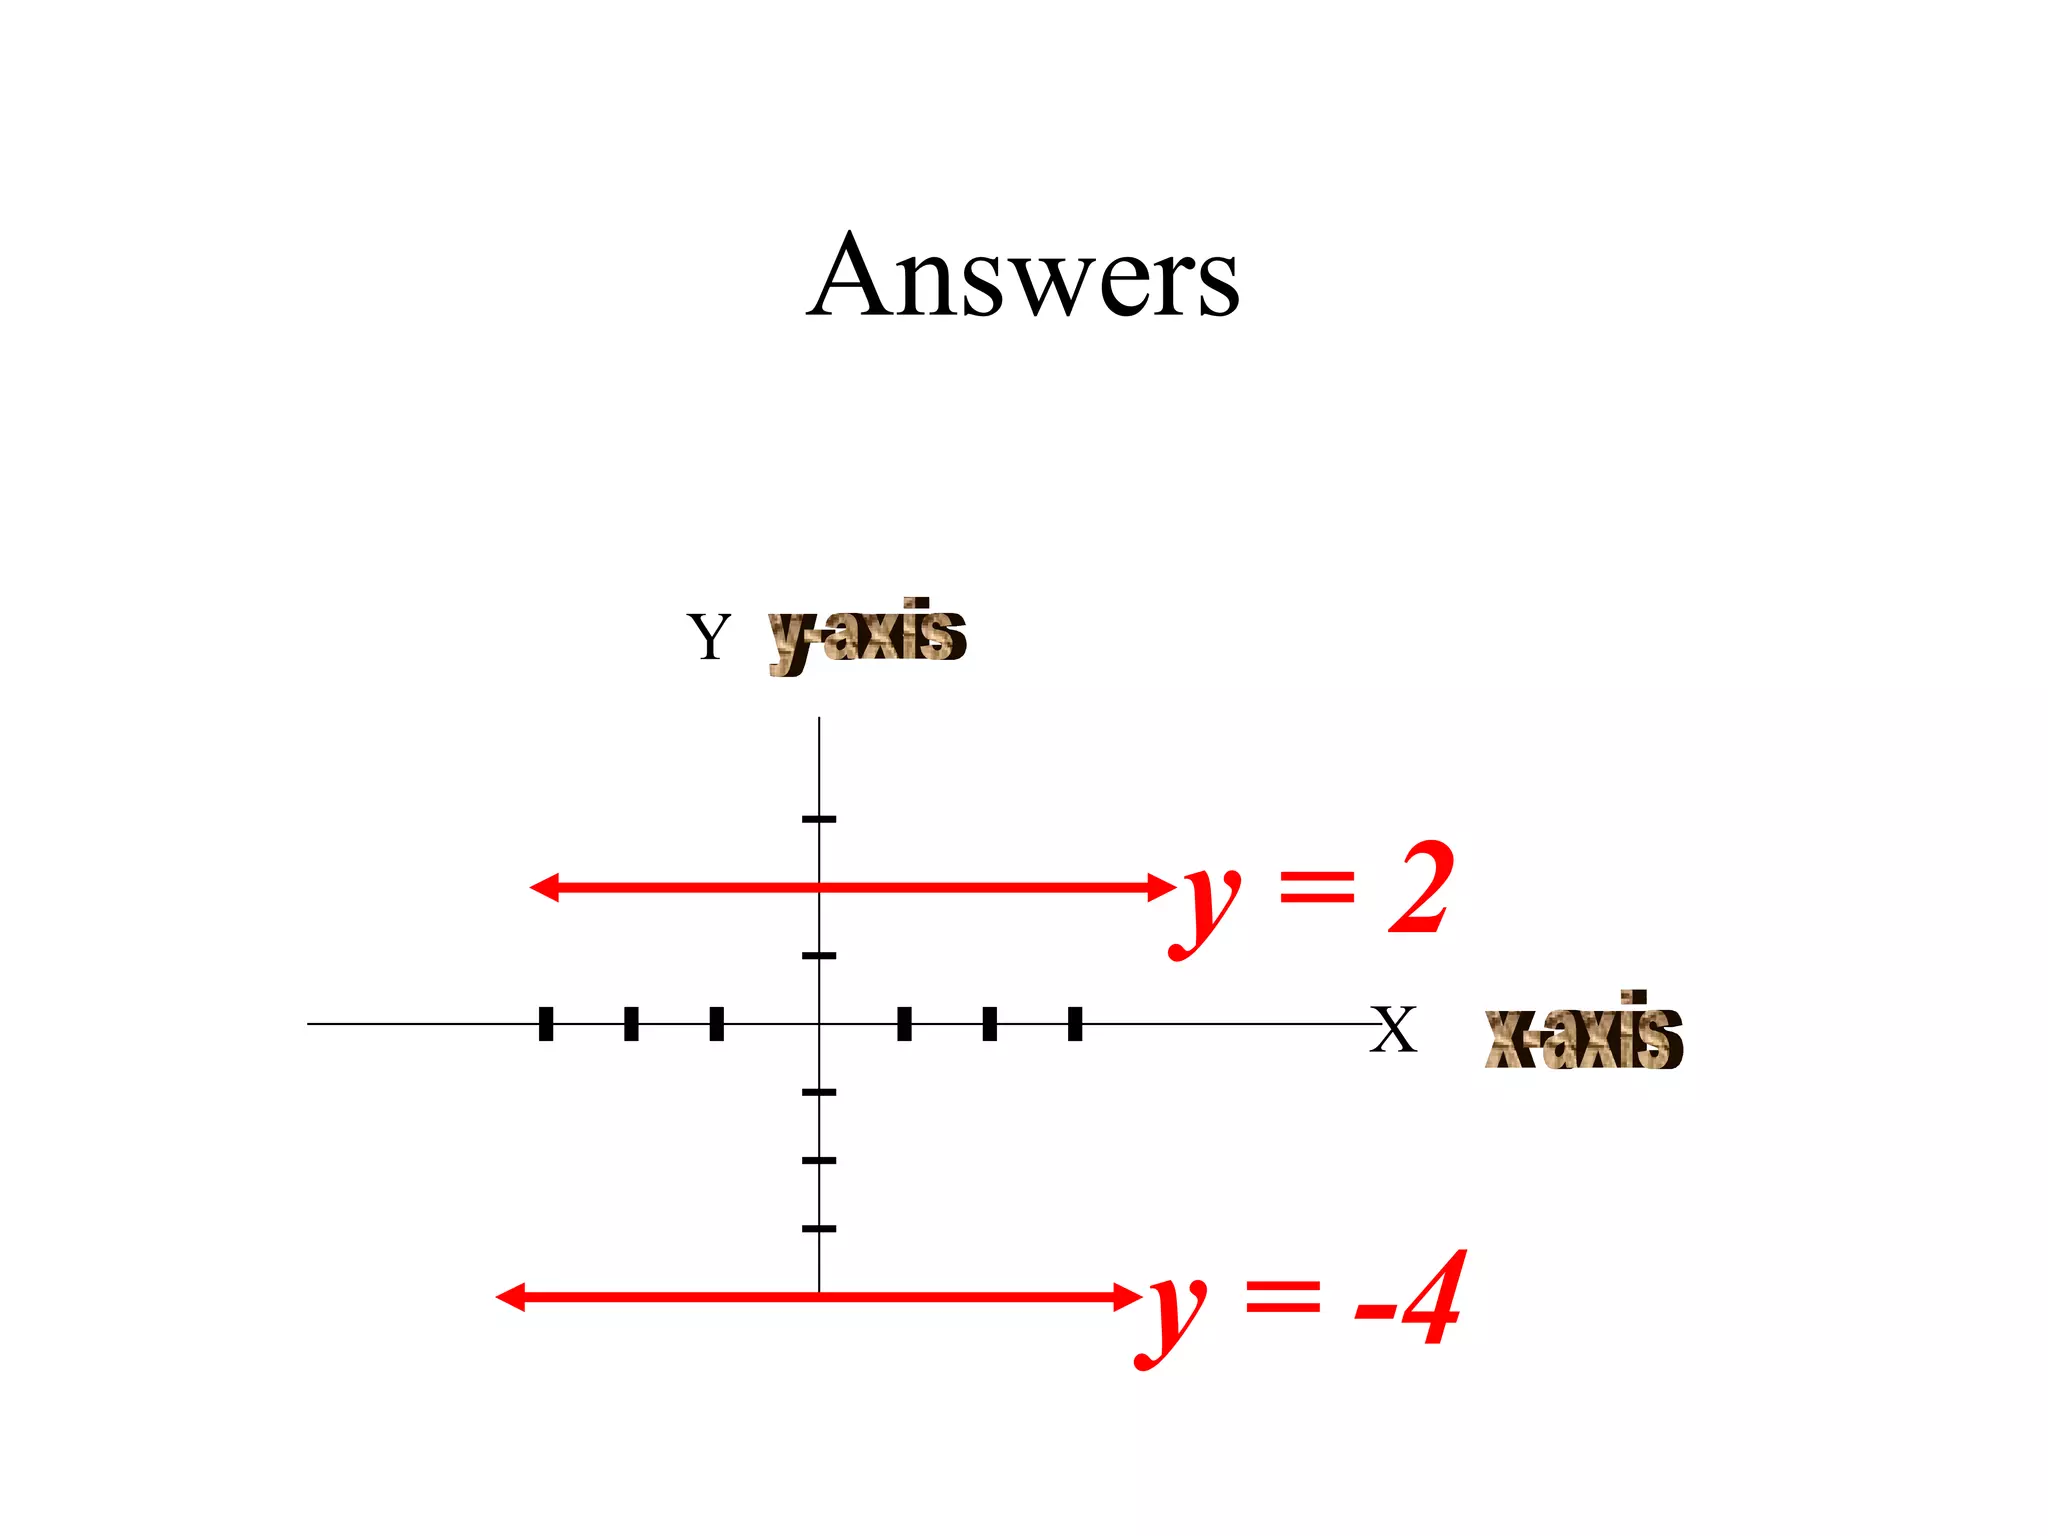
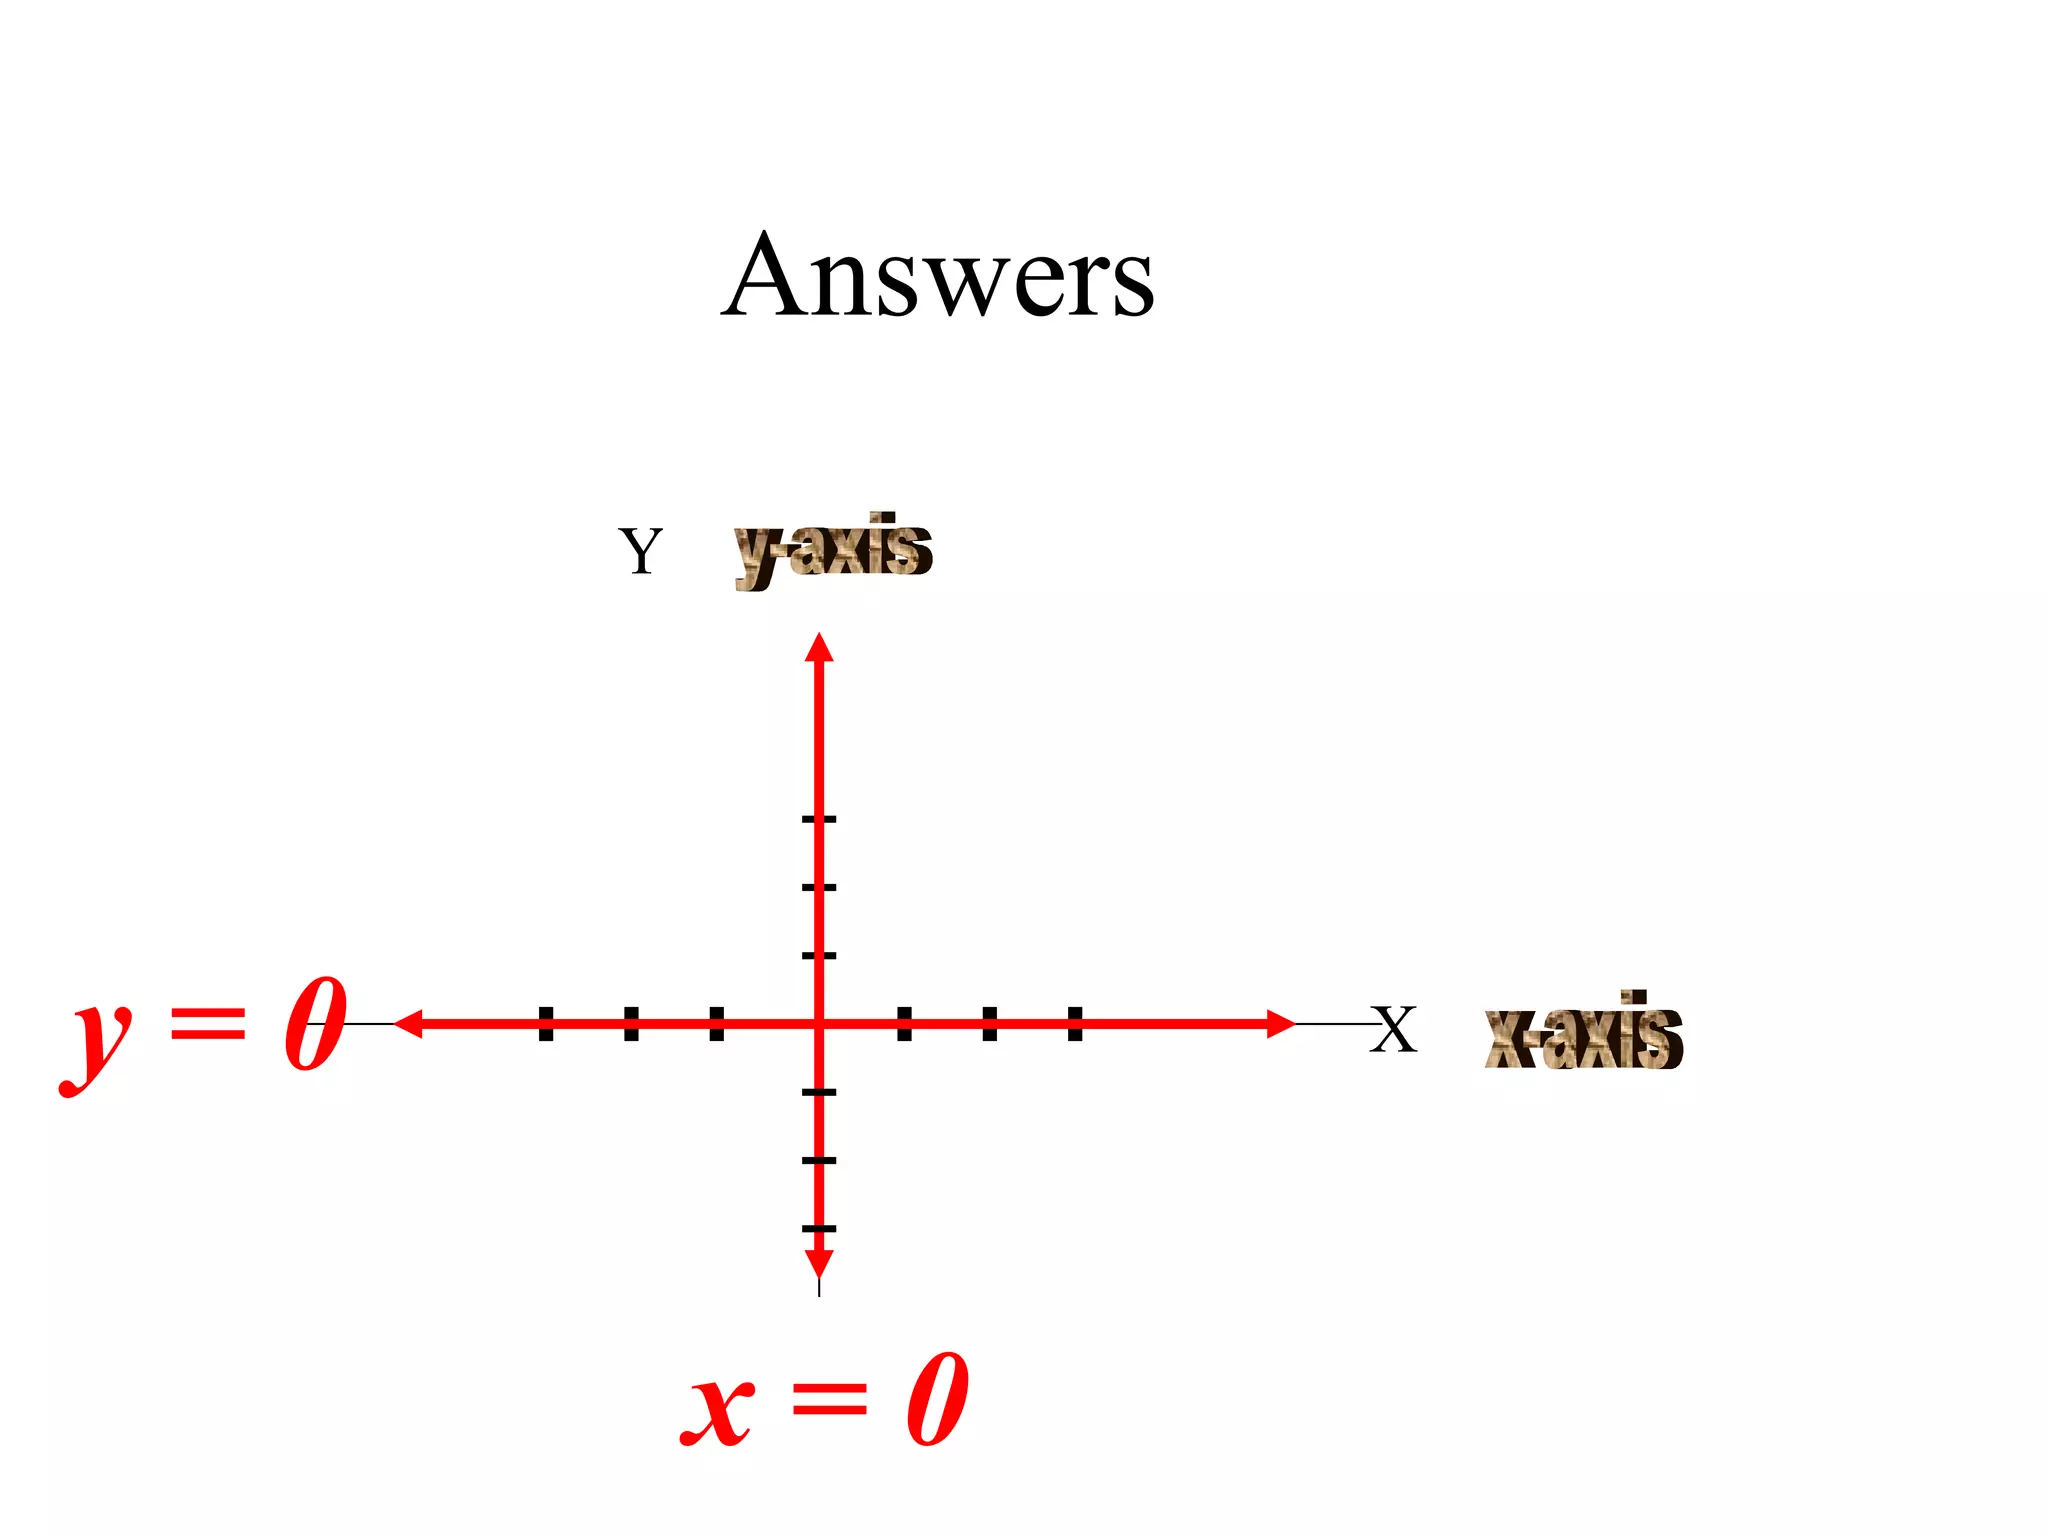
Graphs & Linear Equations Y X y=mx+b
A Point Y X (X,Y)  is called an  Ordered Pair   The X value or X Coordinate is the location of a point in the X direction The Y value or Y Coordinate is the location of a point in the Y direction (X,Y)  (4,3)  •
How to Graph a Point Y X (X,Y) (4,2)  • X is the distance along the x=axis Y is the distance along the y=axis 1  2  3  4 321 HINT: Think of the x-axis as the Number Line -4-3-2-1 0 X 1  2  3  4 -4-3-2-1 0 HINT: Think of the y-axis a vertical Number Line Y 3210  -1 -2
Important Vocabulary for Graphs Y X x-axis y-axis The Graph itself is called the x-y plane (ie. Plane surface) or The Coordinate Plane or Cartesian Coordinate Plane after Renee Descartes 1st Quadrant 2nd Quadrant 3rd Quadrant 4th Quadrant Quadrants start with Positive X & Y and go Counter Clockwise (+X,+Y) (+X,-Y) (-X,-Y) (-X,+Y)
Graphing Linear Equations (Find 3 Domain & Range Points) First Degree Equations are Lines (y=mx+b) and you calculate 3 (X,Y) values Make sure the points line up on a x-y graph and connect the dots.
RECALL X-Domain & Y-Range y = 2x-7  when the  Domain is {-2, 0, 2} f(-2) = 2•(-2) -7 = -4 -7 = -11  (-2,-11) f(0) = 2•(0) -7 = 0 -7 = -7  (0,-7) f(2) = 2•(2) -7 = 4 -7 = -3  (2,-3) Answer: RANGE: {-11, -7, -3} Graphing Lines is just like finding the Range of 3 Domain Points: (Substitute each Domain value into the equation)
Practice Finding 3 Points Given a Linear Equation Find any 3 (X,Y) points for the following equations: y=5x y=4x-5 y=3x+1 (Hint: Try x=0)
Sample Solutions x  y  = 5x 0  0 5 10 x  y  = 4x-5 x  y  = 3x+1
Now Graph the 3 Points x  y  = 5x 0  0 5 10 • • • (0,0) (1,5) (2,10)
What is Intercept in Math? Y X An Intercept is the coordinate where a line crosses the x or y axis
Using X&Y Intercepts to Graph a Line The X intercept is the x coordinate (where a line crosses the x axis). Y X x-axis y-axis (0, 2 ) ( 3 ,0) • • The Y intercept is the y coordinate (where a line crosses the y axis).
Name the X&Y Intercepts Y X x-axis y-axis (0, 2 ) ( 3 ,0) • •
Name the X&Y Intercepts Y X x-axis y-axis (0, 2 ) ( -2 ,0) • •
Name the X&Y Intercepts Y X x-axis y-axis
What is the value of x at the y intercept?  What is the value of Y at the x-intercept? Y X x-axis y-axis
Find the x- and y-intercepts. 1.  x - 2y = 12 x-intercept:  Plug in  0  for y. x - 2( 0 ) = 12 x = 12;  (12, 0) y-intercept:  Plug in  0  for x. 0  - 2y = 12 y = -6;  (0, -6)
Find the x- and y-intercepts. 2.  -3x + 5y = 9 x-intercept:  Plug in  0  for y. -3x - 5( 0 ) = 9 -3x = 9 x = -3;  (-3, 0) y-intercept:  Plug in  0  for x. -3( 0 ) + 5y = 9 5y = 9 y =  ;  (0,  )
What is the x-intercept of 3x – 4y = 24? (3, 0) (8, 0) (0, -4) (0, -6) 1 2 3 4 5 6 7 8 9 10 11 12 13 14 15 16 17 18 19 20 21 22 23 24 25 26 27 28 29 30 31 32
What is the y-intercept of -x + 2y = 8? (-1, 0) (-8, 0) (0, 2) (0, 4) 1 2 3 4 5 6 7 8 9 10 11 12 13 14 15 16 17 18 19 20 21 22 23 24 25 26 27 28 29 30 31 32
Graph y = 2x - 6  using x&y intercepts 1st Make x-y table X  Y  = 2x - 6 Y X x-axis y-axis Graph Linear Eq.
Graph y = 2x - 6  using x&y intercepts 1st Make x-y table 2nd Set x = 0 and solve for y X  Y  = 2x - 6 0  -6 Y X x-axis y-axis •  (0,-6) Graph Linear Eq.
Graph y = 2x - 6  using x&y intercepts 1st Make x-y table 2nd Set x = 0 and solve for y 3rd Set y = 0 and solve for x X  Y  = 2x - 6 0  -6 0 Y X x-axis y-axis •  (0,-6) •  (3,0) Graph Linear Eq.
Graph y = 2x - 6  using x&y intercepts 1st Make x-y table 2nd Set x = 0 and solve for y 3rd Set y = 0 and solve for x 4th  Plot these 2 points and  draw line X  Y  = 2x - 6 0  -6 0 Y X x-axis y-axis •  (0,-6) •  (3,0) Graph Linear Eq.
Graph y = 2x - 6  using x&y intercepts 1st Make x-y table 2nd Set x = 0 and solve for y 3rd Set y = 0 and solve for x 4th  Plot these 2 points and  draw line 5th Use 3rd point to check X  Y  = 2x - 6 0  -6 0 4  2 Y X x-axis y-axis •  (0,-6) •  (3,0) •  (4,2) Graph Linear Eq.
Graphing Horizontal & Vertical Lines Y X x-axis y-axis This line has a y value of 4 for any x-value.  It’s equation is  y = 4   (meaning y always equals 4)
Graphing Horizontal & Vertical Lines Y X x-axis y-axis This line has a x value of 1 for any y-value.  It’s equation is  x = 1   (meaning x always equals 1)
The Equation of a Vertical Line is  X=Constant  Y X x-axis y-axis x = 1
The Equation of a Horizontal Line is  Y=Constant  Y X x-axis y-axis y = 3
Graph the following lines Y = -4 Y = 2 X = 5 X = -5 X = 0 Y = 0
Answers Y X x-axis y-axis x = 5 x = -5
Answers Y X x-axis y-axis y = -4 y = 2
Answers Y X x-axis y-axis x = 0 y = 0

Linear equations 2-2 a graphing and x-y intercepts

  • 1.
    Graphs & LinearEquations Y X y=mx+b
  • 2.
    A Point YX (X,Y) is called an Ordered Pair The X value or X Coordinate is the location of a point in the X direction The Y value or Y Coordinate is the location of a point in the Y direction (X,Y) (4,3) •
  • 3.
    How to Grapha Point Y X (X,Y) (4,2) • X is the distance along the x=axis Y is the distance along the y=axis 1 2 3 4 321 HINT: Think of the x-axis as the Number Line -4-3-2-1 0 X 1 2 3 4 -4-3-2-1 0 HINT: Think of the y-axis a vertical Number Line Y 3210 -1 -2
  • 4.
    Important Vocabulary forGraphs Y X x-axis y-axis The Graph itself is called the x-y plane (ie. Plane surface) or The Coordinate Plane or Cartesian Coordinate Plane after Renee Descartes 1st Quadrant 2nd Quadrant 3rd Quadrant 4th Quadrant Quadrants start with Positive X & Y and go Counter Clockwise (+X,+Y) (+X,-Y) (-X,-Y) (-X,+Y)
  • 5.
    Graphing Linear Equations(Find 3 Domain & Range Points) First Degree Equations are Lines (y=mx+b) and you calculate 3 (X,Y) values Make sure the points line up on a x-y graph and connect the dots.
  • 6.
    RECALL X-Domain &Y-Range y = 2x-7 when the Domain is {-2, 0, 2} f(-2) = 2•(-2) -7 = -4 -7 = -11 (-2,-11) f(0) = 2•(0) -7 = 0 -7 = -7 (0,-7) f(2) = 2•(2) -7 = 4 -7 = -3 (2,-3) Answer: RANGE: {-11, -7, -3} Graphing Lines is just like finding the Range of 3 Domain Points: (Substitute each Domain value into the equation)
  • 7.
    Practice Finding 3Points Given a Linear Equation Find any 3 (X,Y) points for the following equations: y=5x y=4x-5 y=3x+1 (Hint: Try x=0)
  • 8.
    Sample Solutions x y = 5x 0 0 5 10 x y = 4x-5 x y = 3x+1
  • 9.
    Now Graph the3 Points x y = 5x 0 0 5 10 • • • (0,0) (1,5) (2,10)
  • 10.
    What is Interceptin Math? Y X An Intercept is the coordinate where a line crosses the x or y axis
  • 11.
    Using X&Y Interceptsto Graph a Line The X intercept is the x coordinate (where a line crosses the x axis). Y X x-axis y-axis (0, 2 ) ( 3 ,0) • • The Y intercept is the y coordinate (where a line crosses the y axis).
  • 12.
    Name the X&YIntercepts Y X x-axis y-axis (0, 2 ) ( 3 ,0) • •
  • 13.
    Name the X&YIntercepts Y X x-axis y-axis (0, 2 ) ( -2 ,0) • •
  • 14.
    Name the X&YIntercepts Y X x-axis y-axis
  • 15.
    Name the X&YIntercepts Y X x-axis y-axis
  • 16.
    What is thevalue of x at the y intercept? What is the value of Y at the x-intercept? Y X x-axis y-axis
  • 17.
    Find the x-and y-intercepts. 1. x - 2y = 12 x-intercept: Plug in 0 for y. x - 2( 0 ) = 12 x = 12; (12, 0) y-intercept: Plug in 0 for x. 0 - 2y = 12 y = -6; (0, -6)
  • 18.
    Find the x-and y-intercepts. 2. -3x + 5y = 9 x-intercept: Plug in 0 for y. -3x - 5( 0 ) = 9 -3x = 9 x = -3; (-3, 0) y-intercept: Plug in 0 for x. -3( 0 ) + 5y = 9 5y = 9 y = ; (0, )
  • 19.
    What is thex-intercept of 3x – 4y = 24? (3, 0) (8, 0) (0, -4) (0, -6) 1 2 3 4 5 6 7 8 9 10 11 12 13 14 15 16 17 18 19 20 21 22 23 24 25 26 27 28 29 30 31 32
  • 20.
    What is they-intercept of -x + 2y = 8? (-1, 0) (-8, 0) (0, 2) (0, 4) 1 2 3 4 5 6 7 8 9 10 11 12 13 14 15 16 17 18 19 20 21 22 23 24 25 26 27 28 29 30 31 32
  • 21.
    Graph y =2x - 6 using x&y intercepts 1st Make x-y table X Y = 2x - 6 Y X x-axis y-axis Graph Linear Eq.
  • 22.
    Graph y =2x - 6 using x&y intercepts 1st Make x-y table 2nd Set x = 0 and solve for y X Y = 2x - 6 0 -6 Y X x-axis y-axis • (0,-6) Graph Linear Eq.
  • 23.
    Graph y =2x - 6 using x&y intercepts 1st Make x-y table 2nd Set x = 0 and solve for y 3rd Set y = 0 and solve for x X Y = 2x - 6 0 -6 0 Y X x-axis y-axis • (0,-6) • (3,0) Graph Linear Eq.
  • 24.
    Graph y =2x - 6 using x&y intercepts 1st Make x-y table 2nd Set x = 0 and solve for y 3rd Set y = 0 and solve for x 4th Plot these 2 points and draw line X Y = 2x - 6 0 -6 0 Y X x-axis y-axis • (0,-6) • (3,0) Graph Linear Eq.
  • 25.
    Graph y =2x - 6 using x&y intercepts 1st Make x-y table 2nd Set x = 0 and solve for y 3rd Set y = 0 and solve for x 4th Plot these 2 points and draw line 5th Use 3rd point to check X Y = 2x - 6 0 -6 0 4 2 Y X x-axis y-axis • (0,-6) • (3,0) • (4,2) Graph Linear Eq.
  • 26.
    Graphing Horizontal &Vertical Lines Y X x-axis y-axis This line has a y value of 4 for any x-value. It’s equation is y = 4 (meaning y always equals 4)
  • 27.
    Graphing Horizontal &Vertical Lines Y X x-axis y-axis This line has a x value of 1 for any y-value. It’s equation is x = 1 (meaning x always equals 1)
  • 28.
    The Equation ofa Vertical Line is X=Constant Y X x-axis y-axis x = 1
  • 29.
    The Equation ofa Horizontal Line is Y=Constant Y X x-axis y-axis y = 3
  • 30.
    Graph the followinglines Y = -4 Y = 2 X = 5 X = -5 X = 0 Y = 0
  • 31.
    Answers Y Xx-axis y-axis x = 5 x = -5
  • 32.
    Answers Y Xx-axis y-axis y = -4 y = 2
  • 33.
    Answers Y Xx-axis y-axis x = 0 y = 0