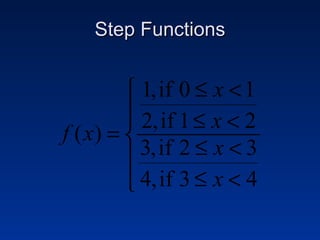
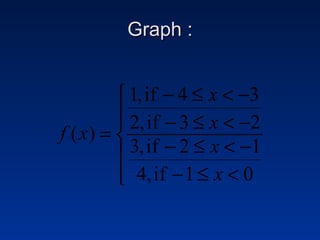
This document discusses different types of piecewise functions including:
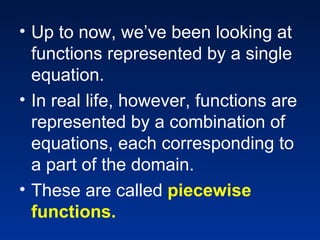
- Piecewise functions which use separate equations depending on the domain values. For example, one equation for when x ≤ 1 and another for when x > 1.
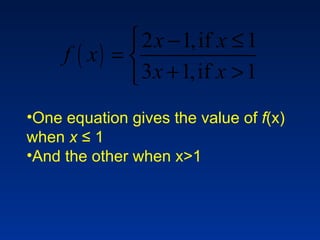
- An example problem evaluating a piecewise function at different x values and determining which equation to use.
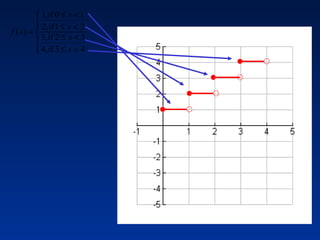
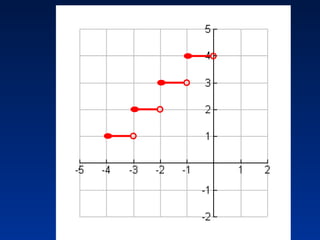
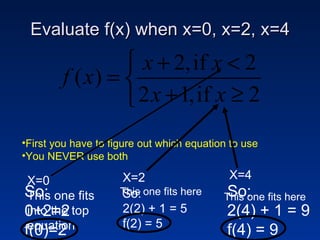
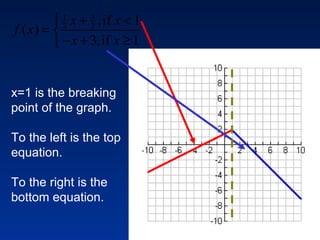
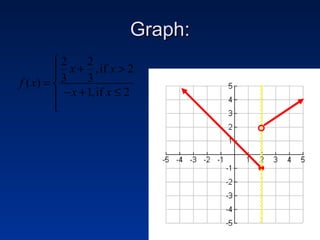
- Graphing a piecewise function involves using one equation's graph for values below a breaking point, and another equation's graph for values at or above the breaking point.
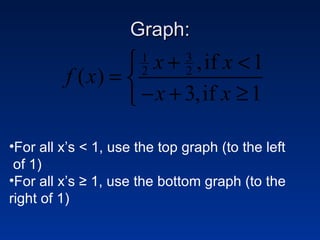
- Greatest integer functions which return the greatest integer less than or equal to the input value. An example graph of y = [x] + 2 is shown and evaluated in a table.


![Greatest Integer Function: A function in the form y = [ x ] Note: [ x ] means the greatest integer less than or equal to x . For example, the largest integer less than or equal to -3.5 is -4. 2 4 6 – 2 – 4 – 6 x 2 4 6 – 2 – 4 – 6 y y =[ x ]](https://image.slidesharecdn.com/gr10piecewisefunctions-120223191823-phpapp01/85/Gr10-piecewise-functions-11-320.jpg)
![Greatest Integer Function: A function inthe form y = [ x ] Graph y = [ x ] + 2 by completing the t-table: x y -3 - 2.75 -2.5 -2.25 -2 -1.75 -1.5 -1.25 -1 0 1 2 4 6 – 2 – 4 – 6 x 2 4 6 – 2 – 4 – 6 y x y -3 y = [-3]+2=-1 - 2.75 y = [-2.75]+2=-1 -2.5 y = [-2.5]+2=-1 -2.25 y = [-2.25]+2=-1 -2 y = [-2]+2 =0 -1.75 y = [-1.75]+2=0 -1.5 y = [-1.5]+2=0 -1.25 y = [-1.25]+2=0 -1 y = [-1]+2=1 0 y = [0]+2=2 1 y = [1]+2=3](https://image.slidesharecdn.com/gr10piecewisefunctions-120223191823-phpapp01/85/Gr10-piecewise-functions-12-320.jpg)