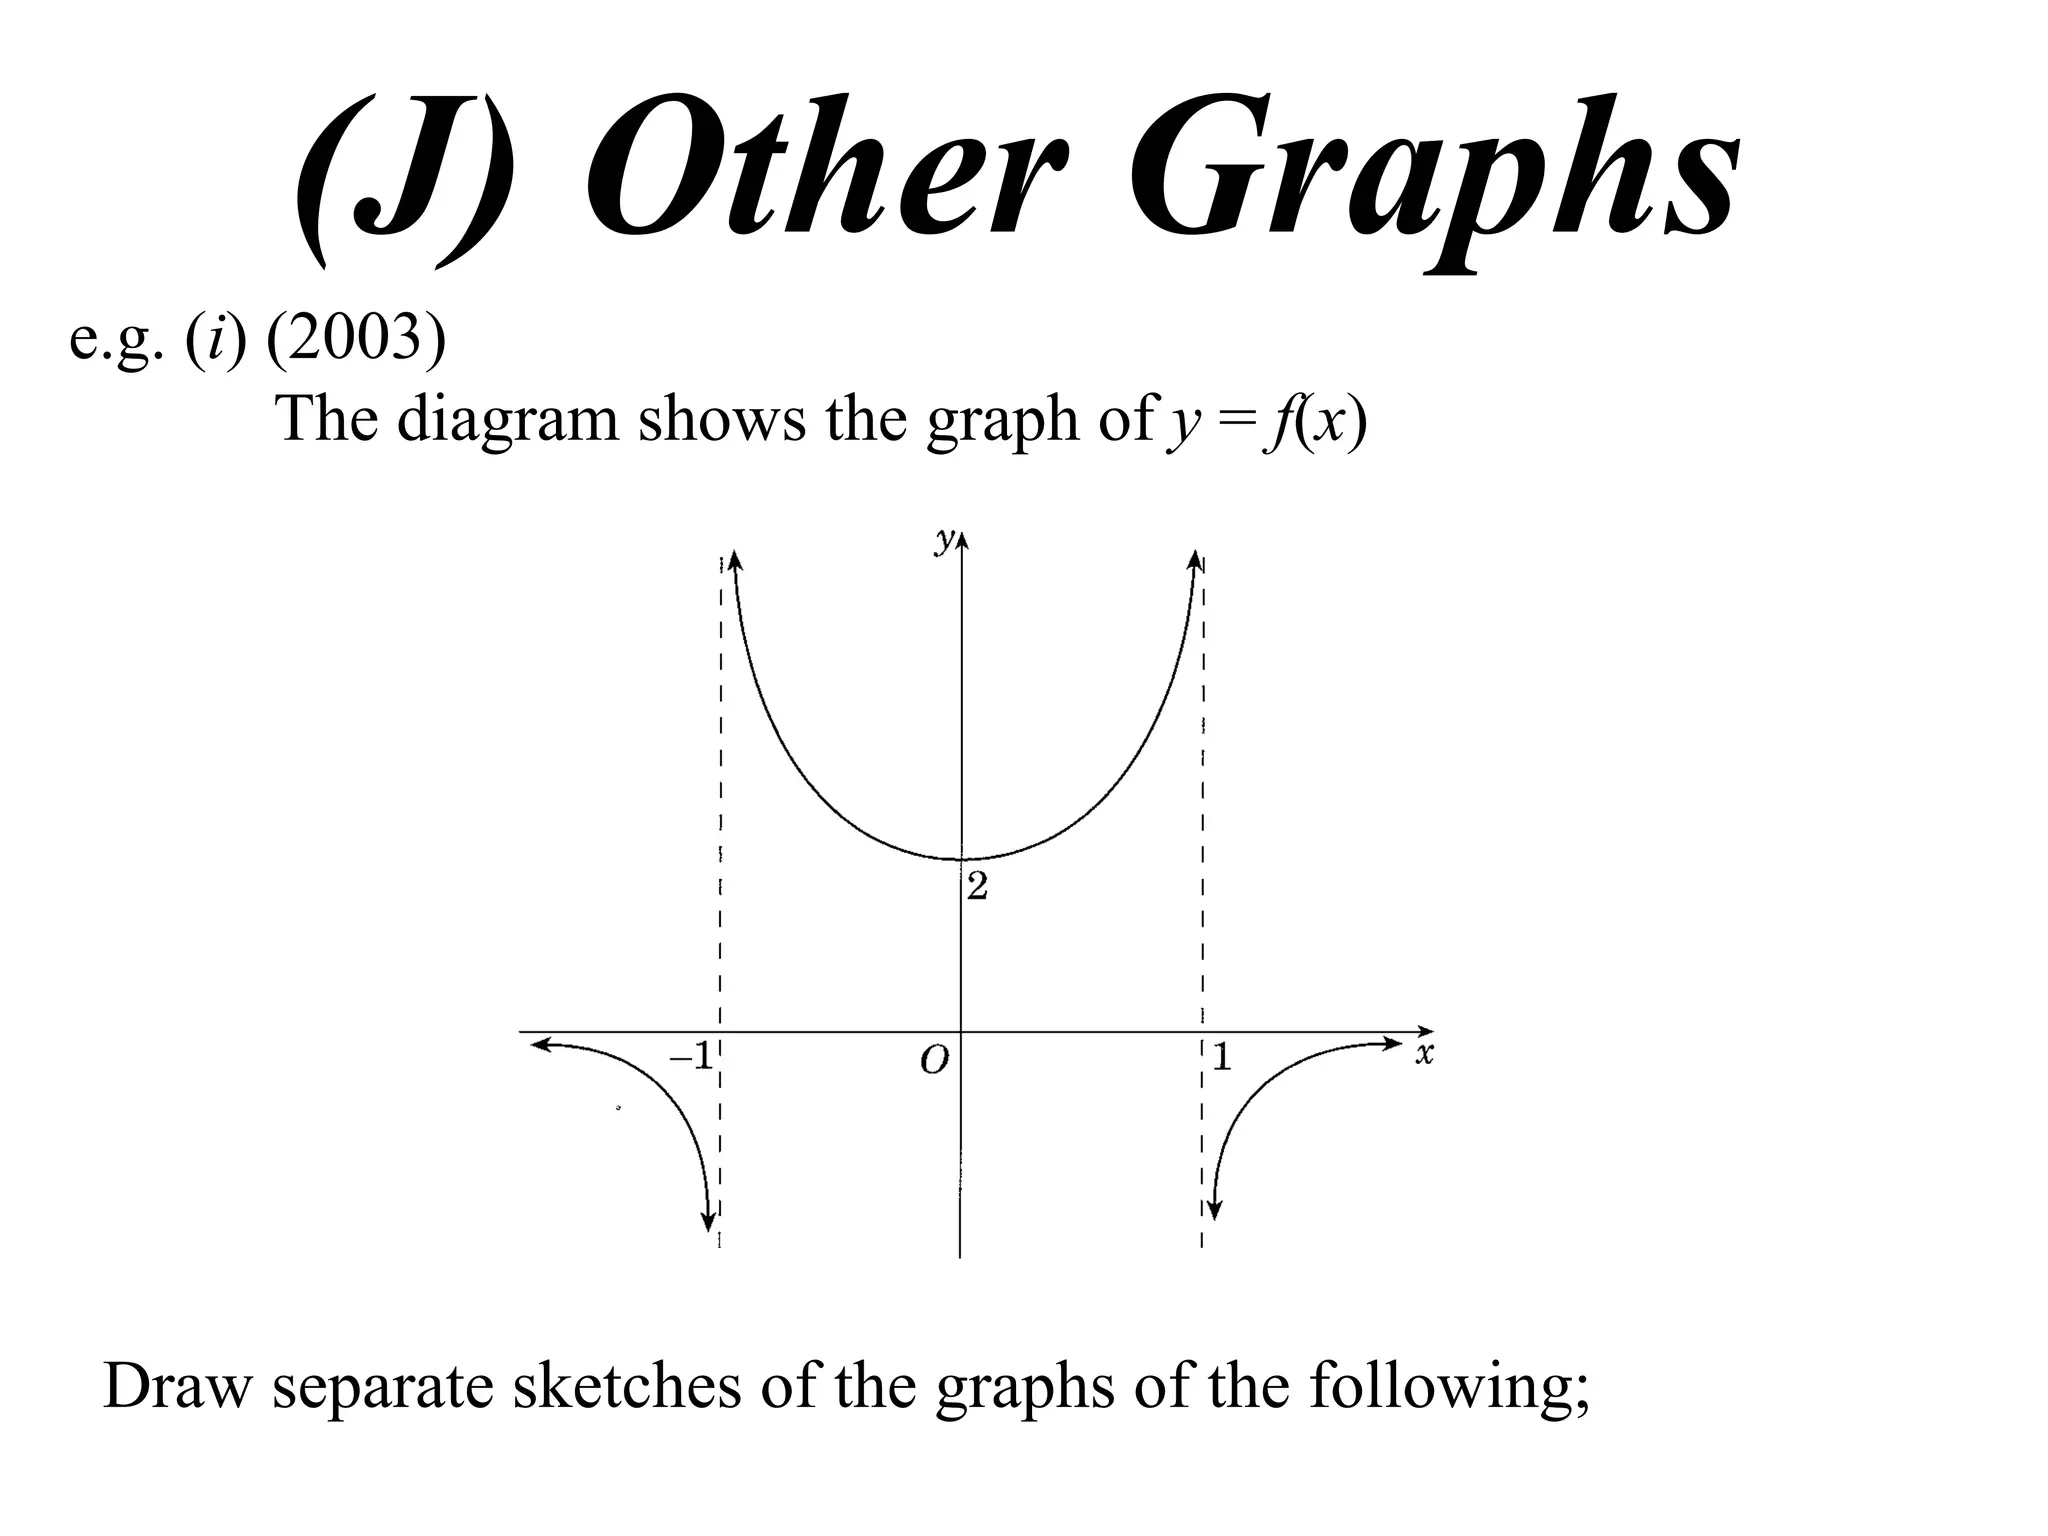
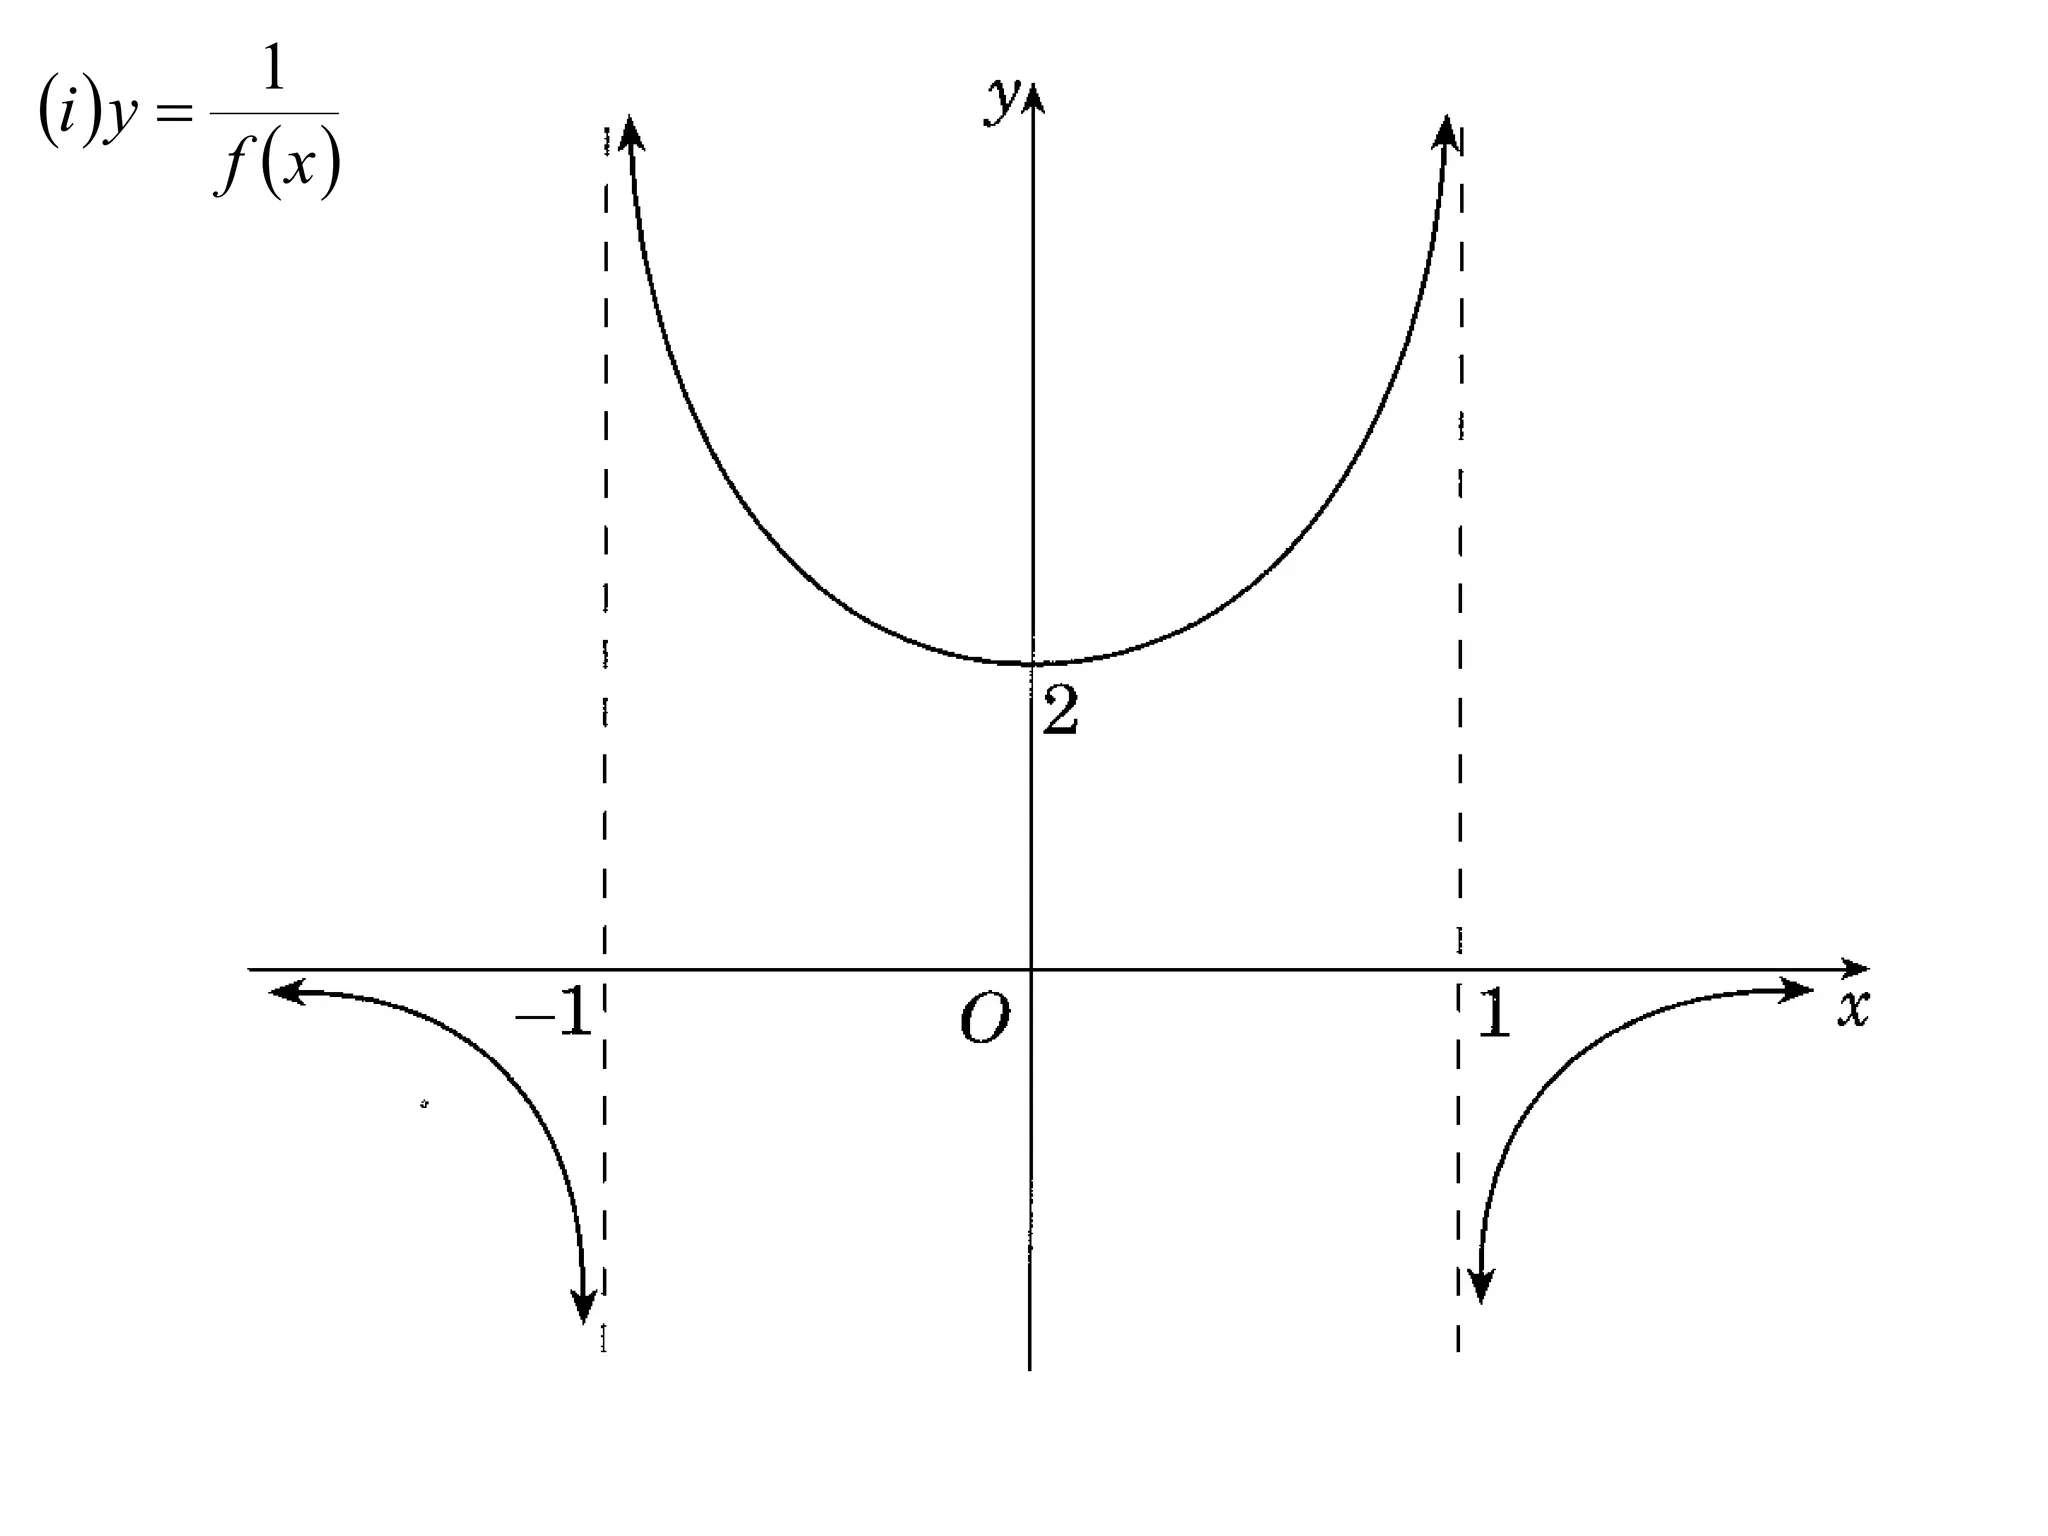
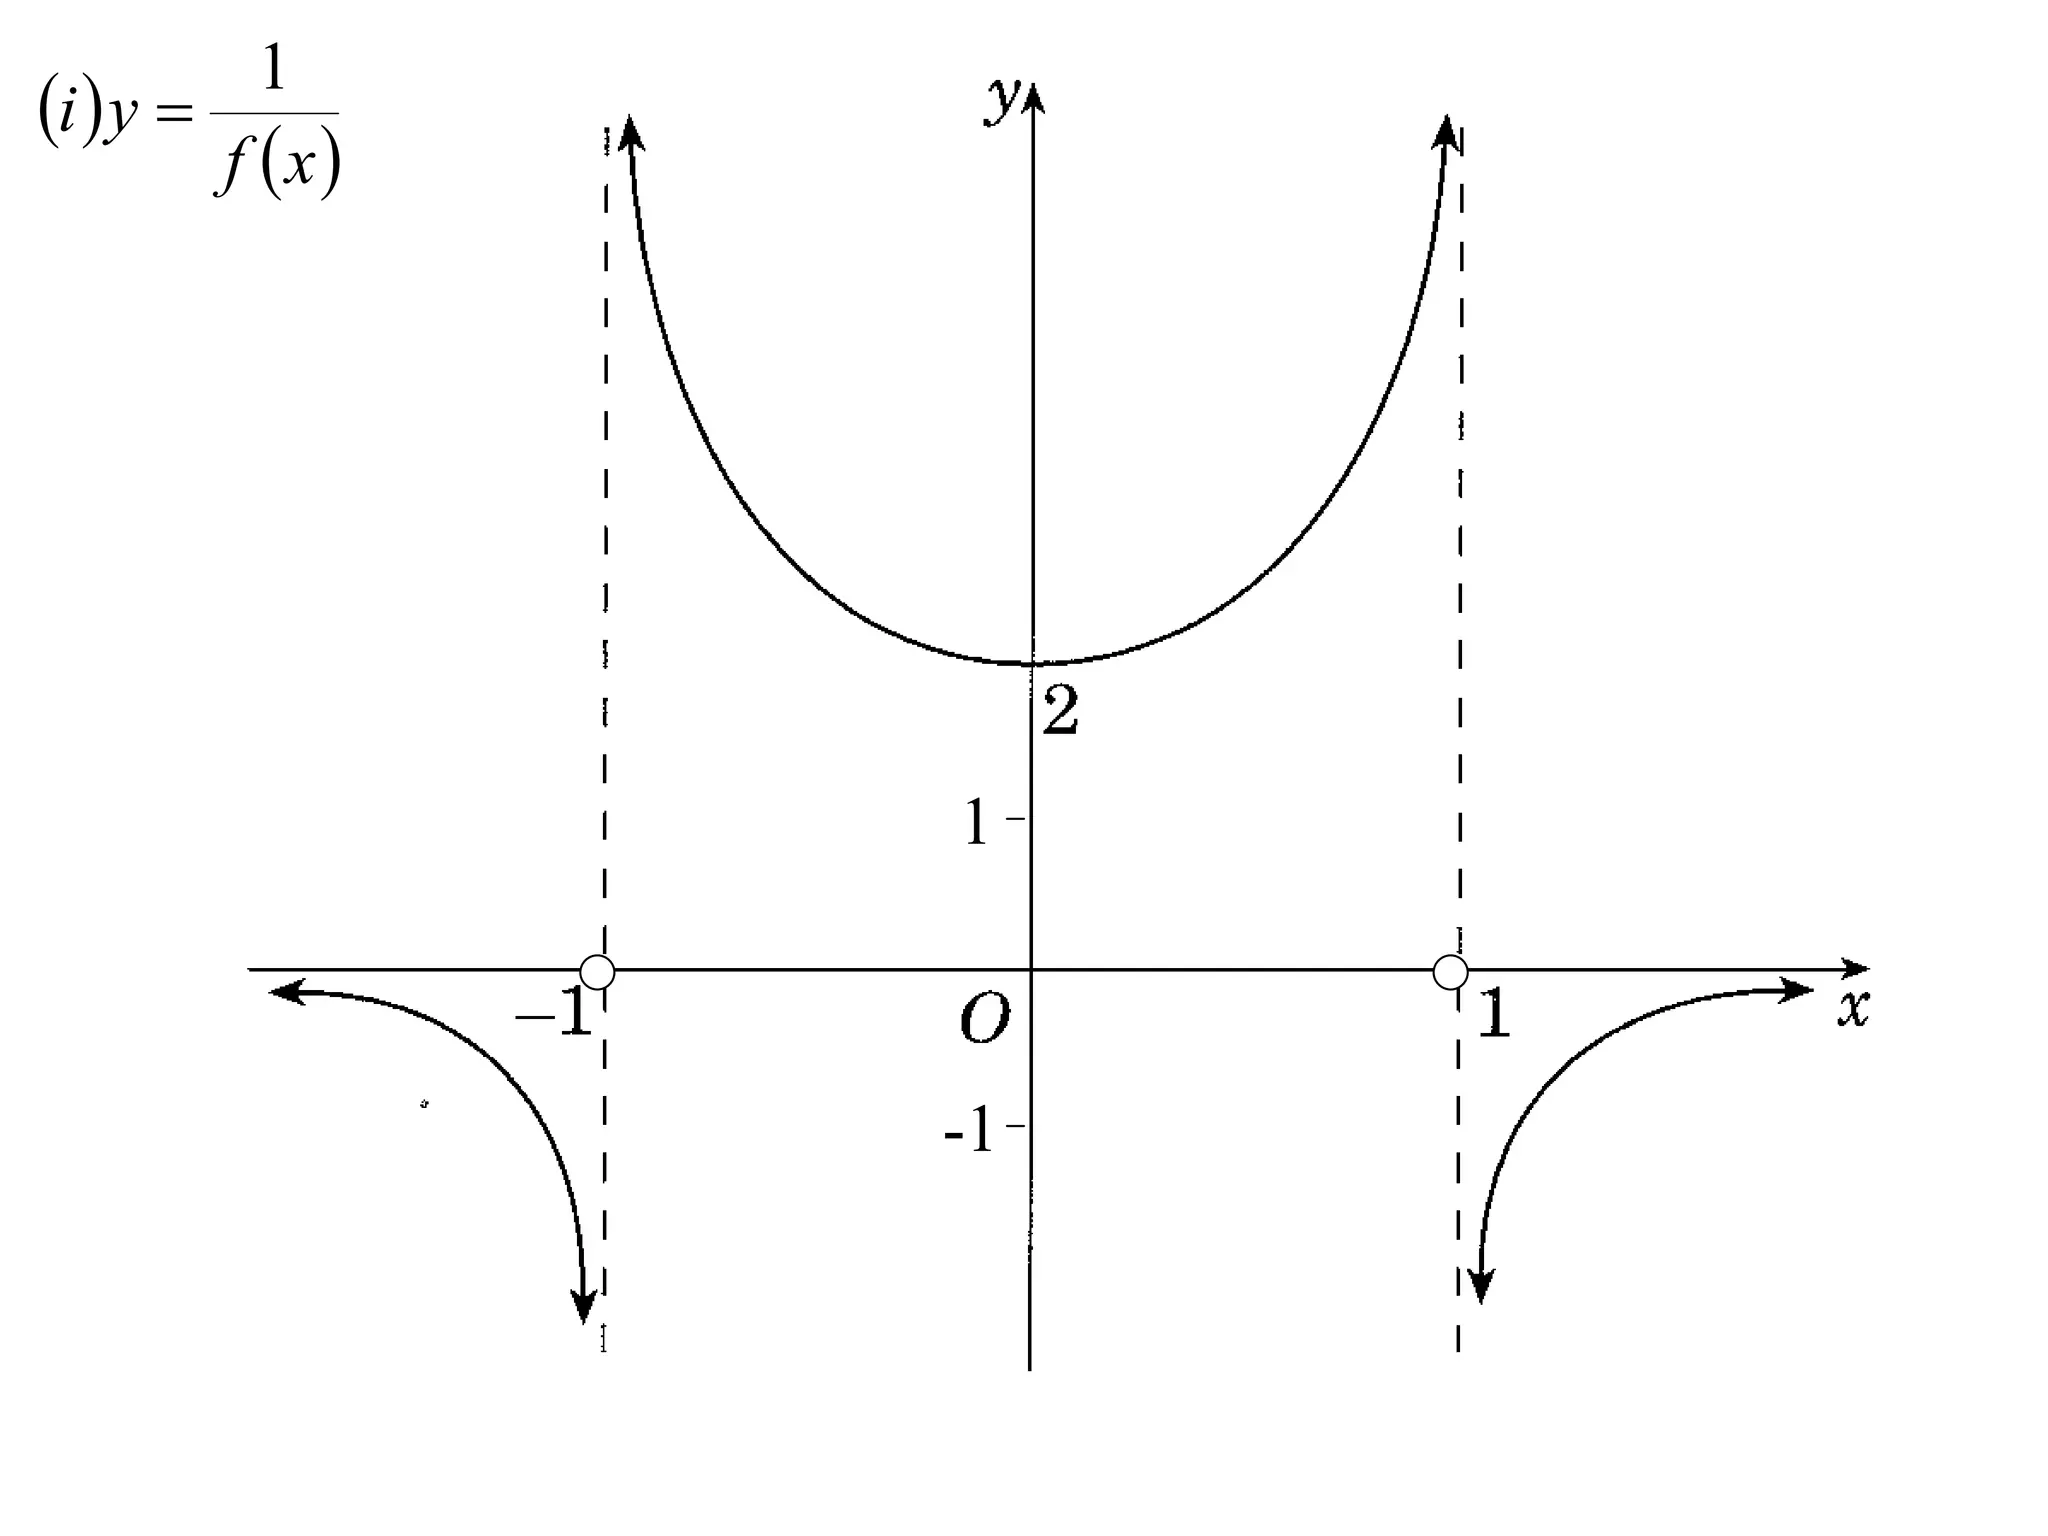
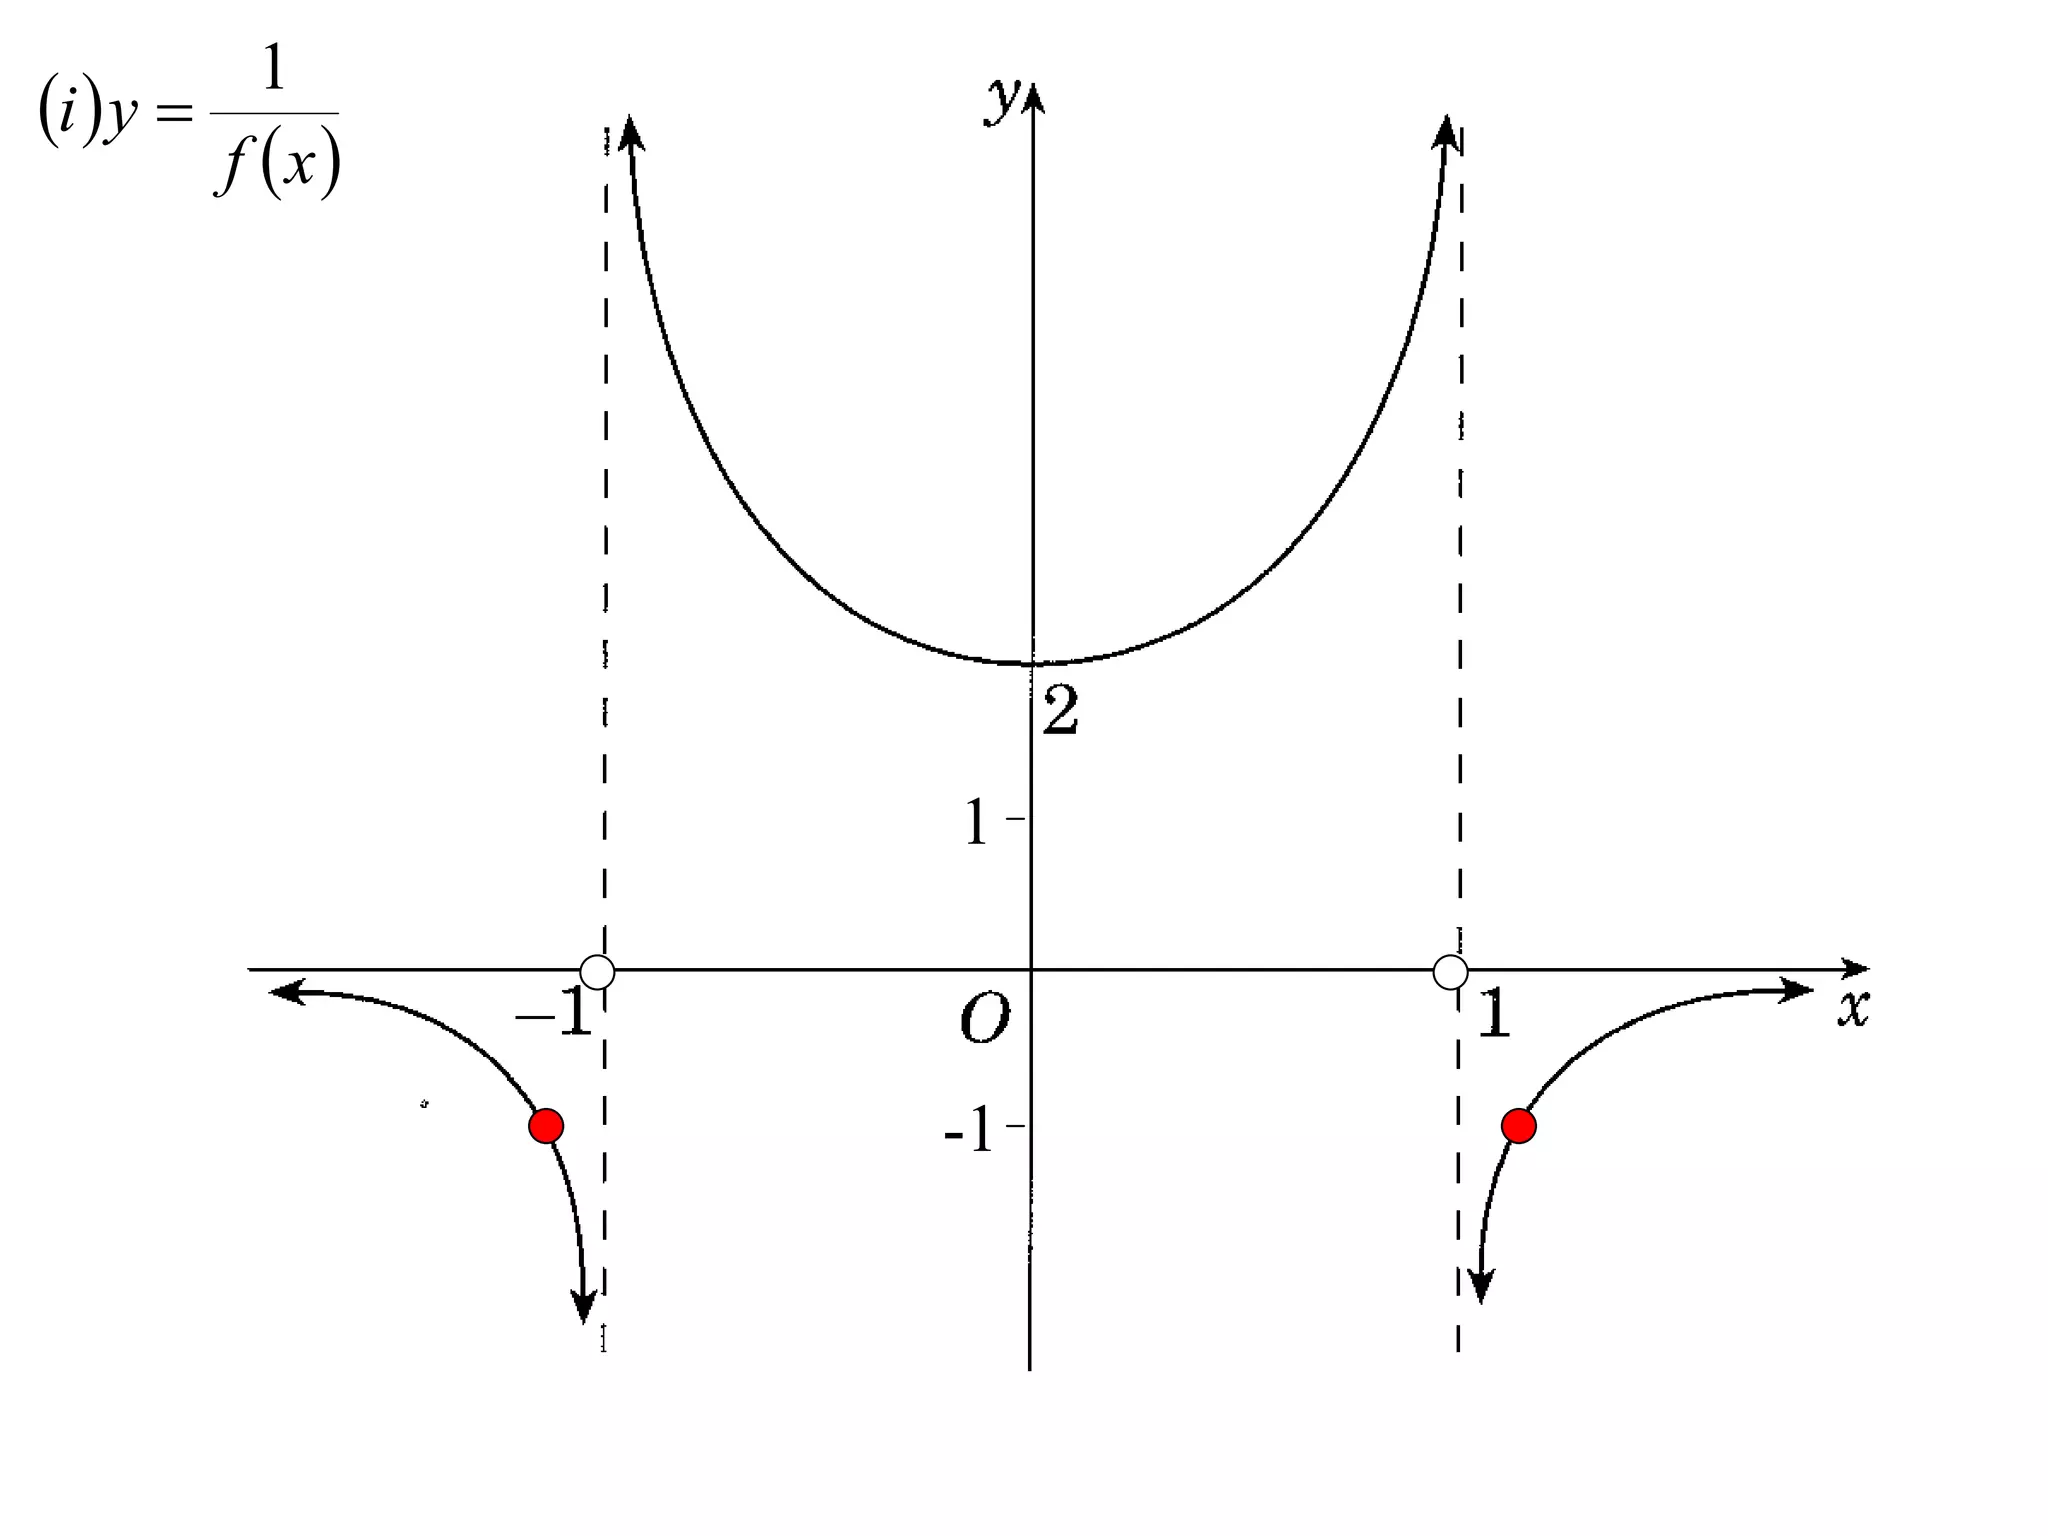
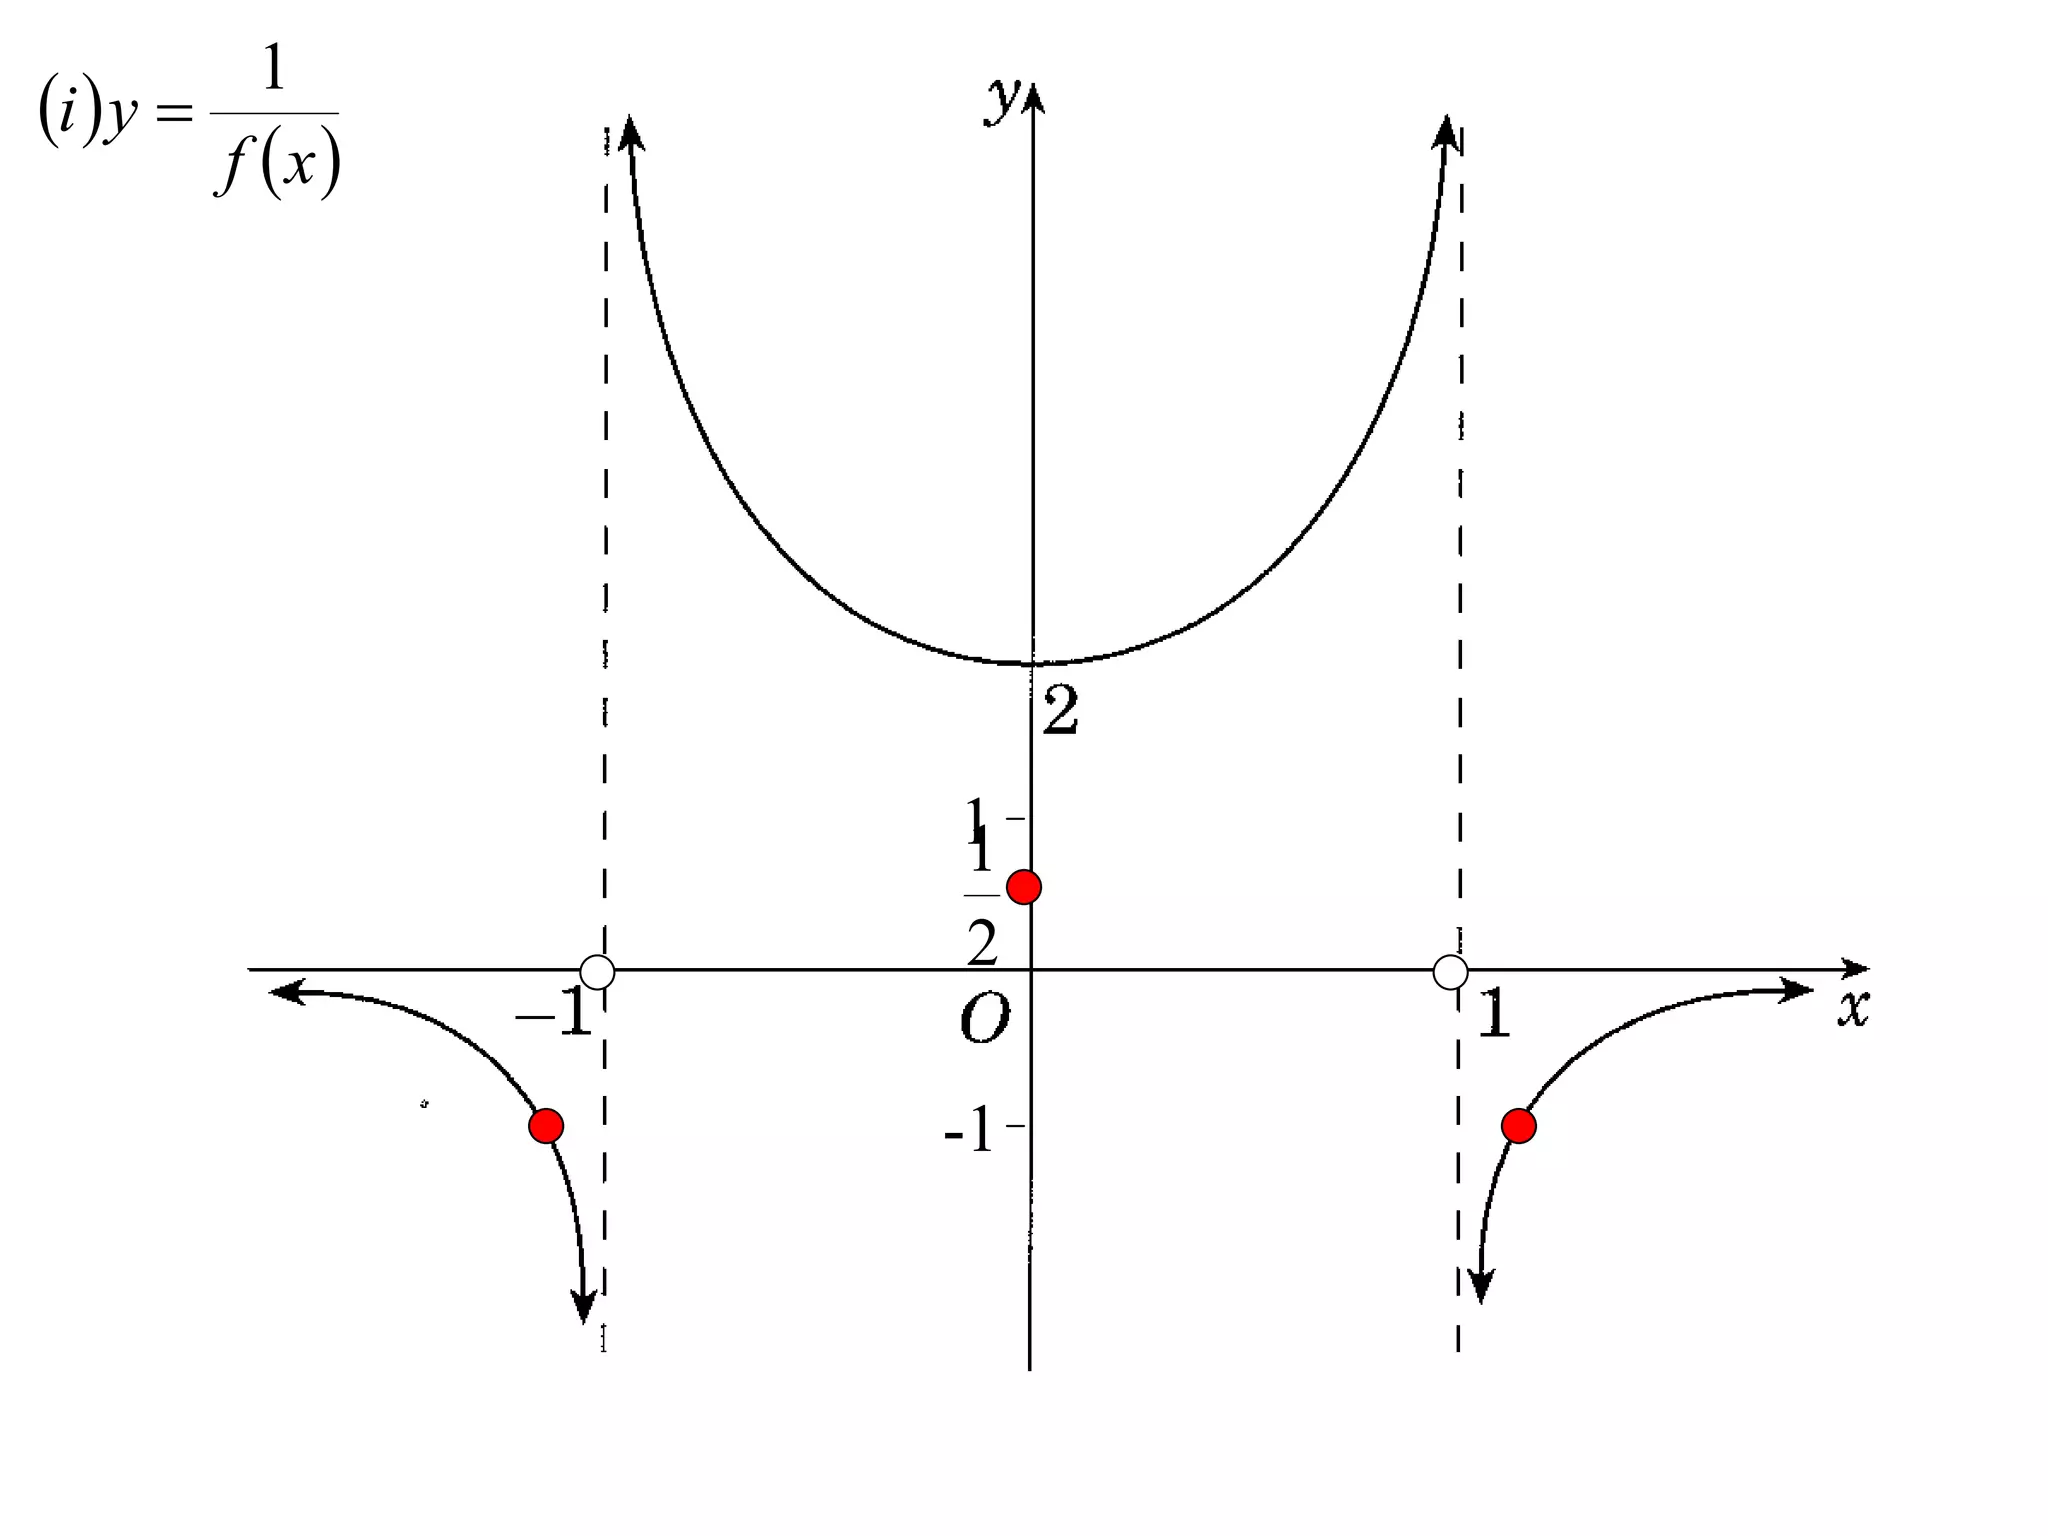
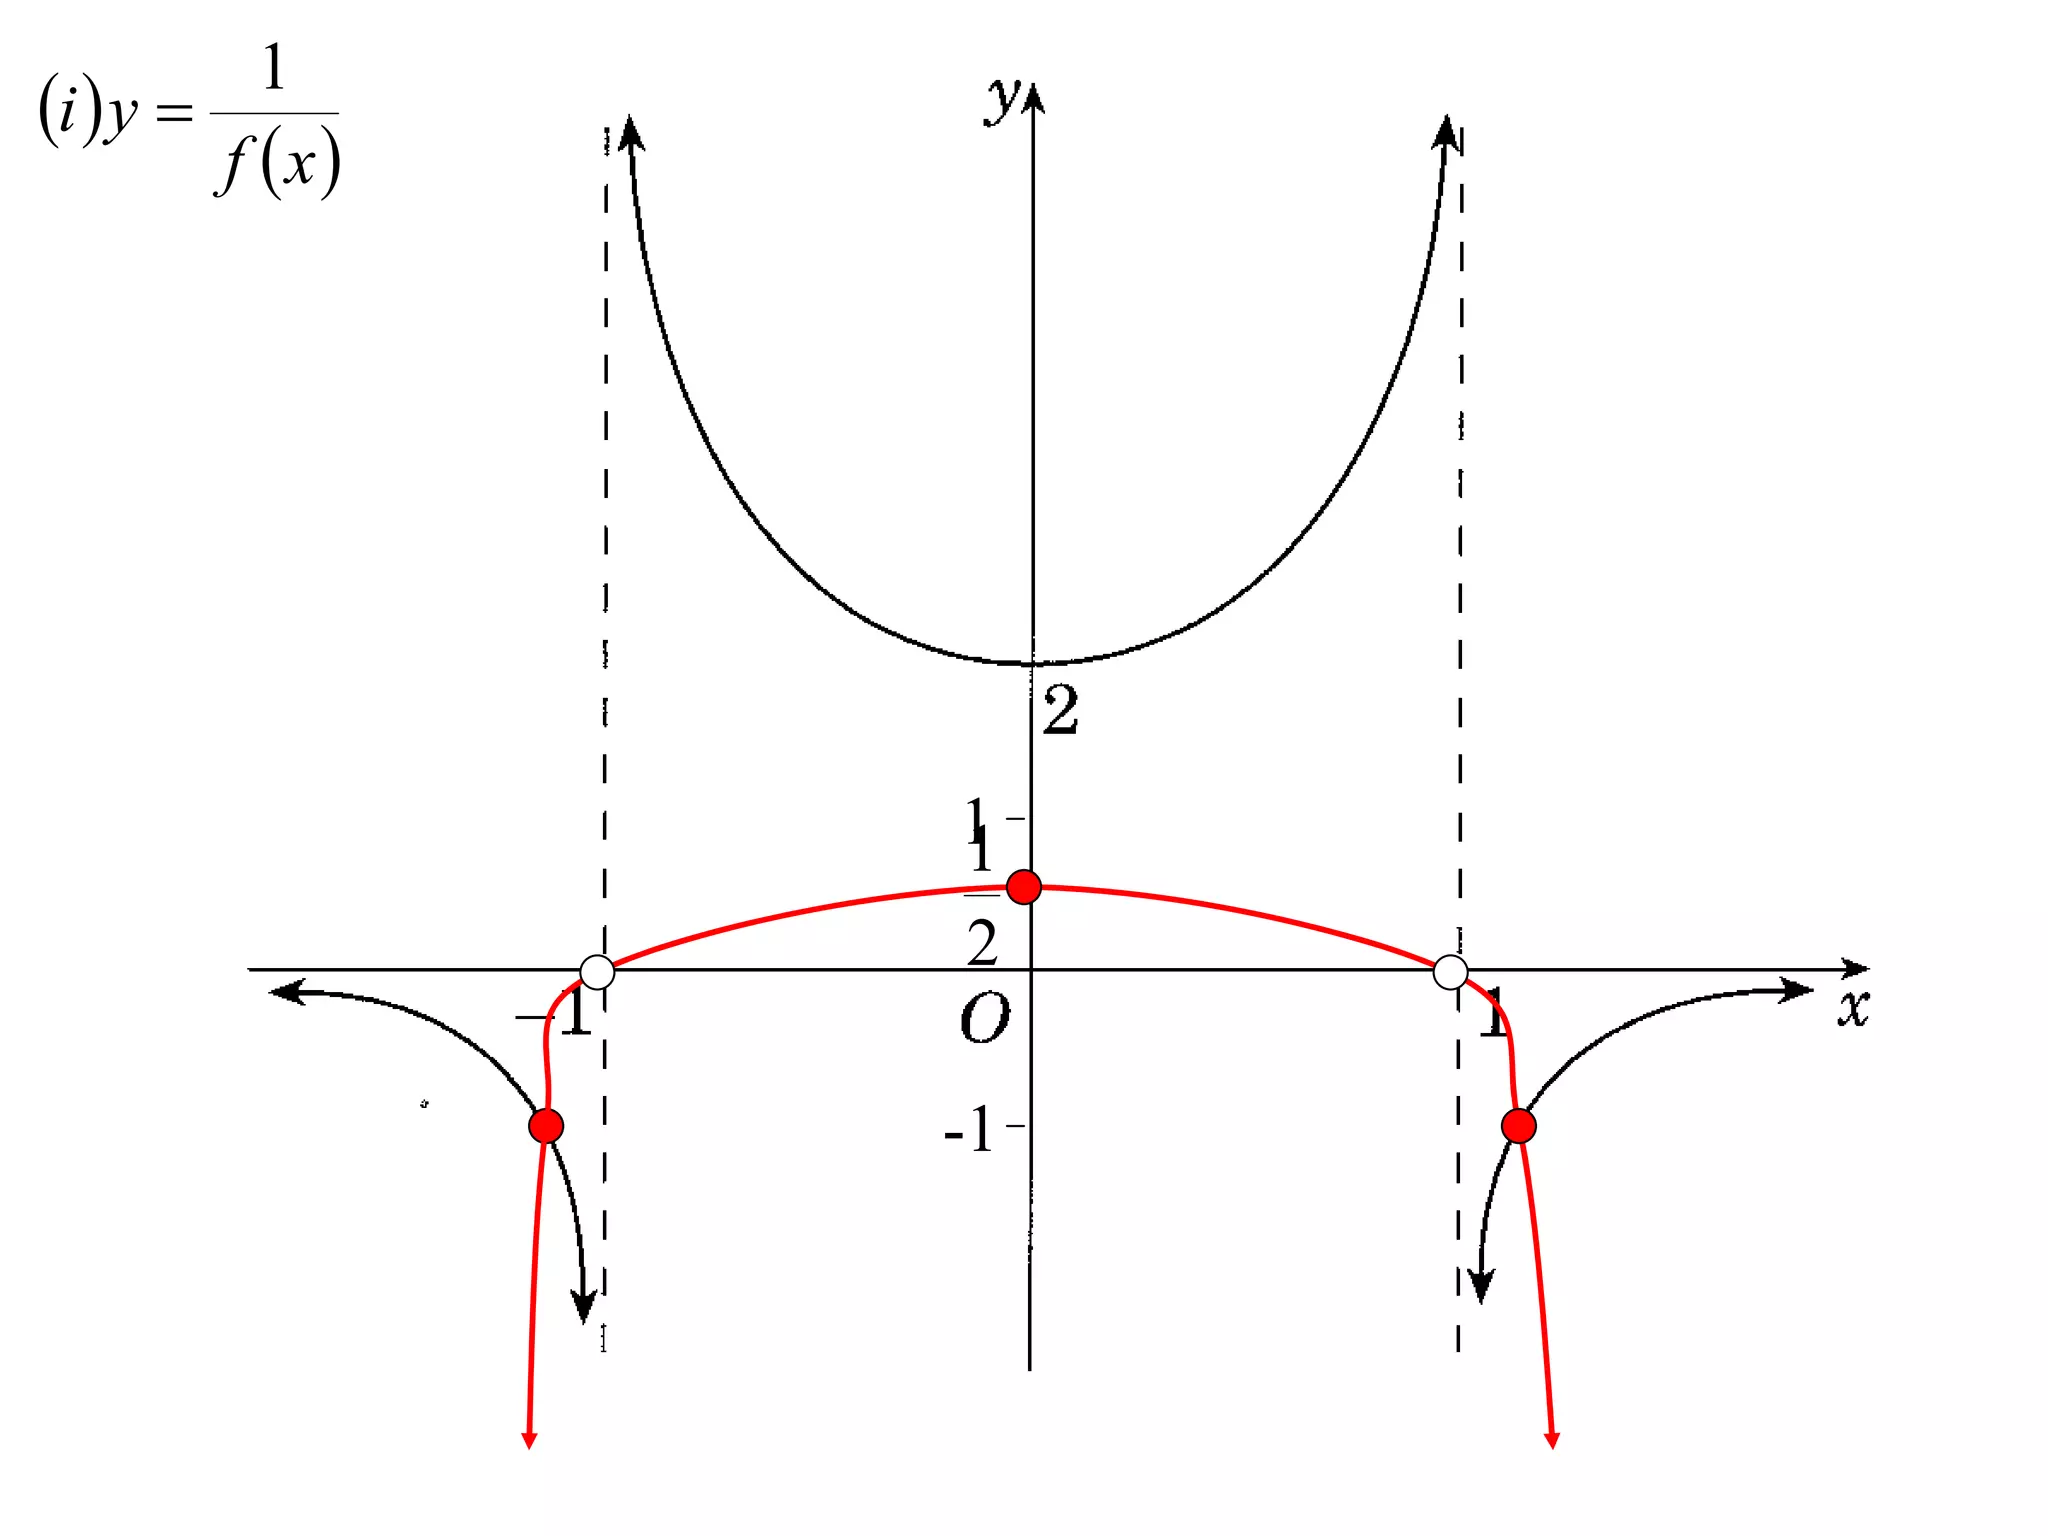
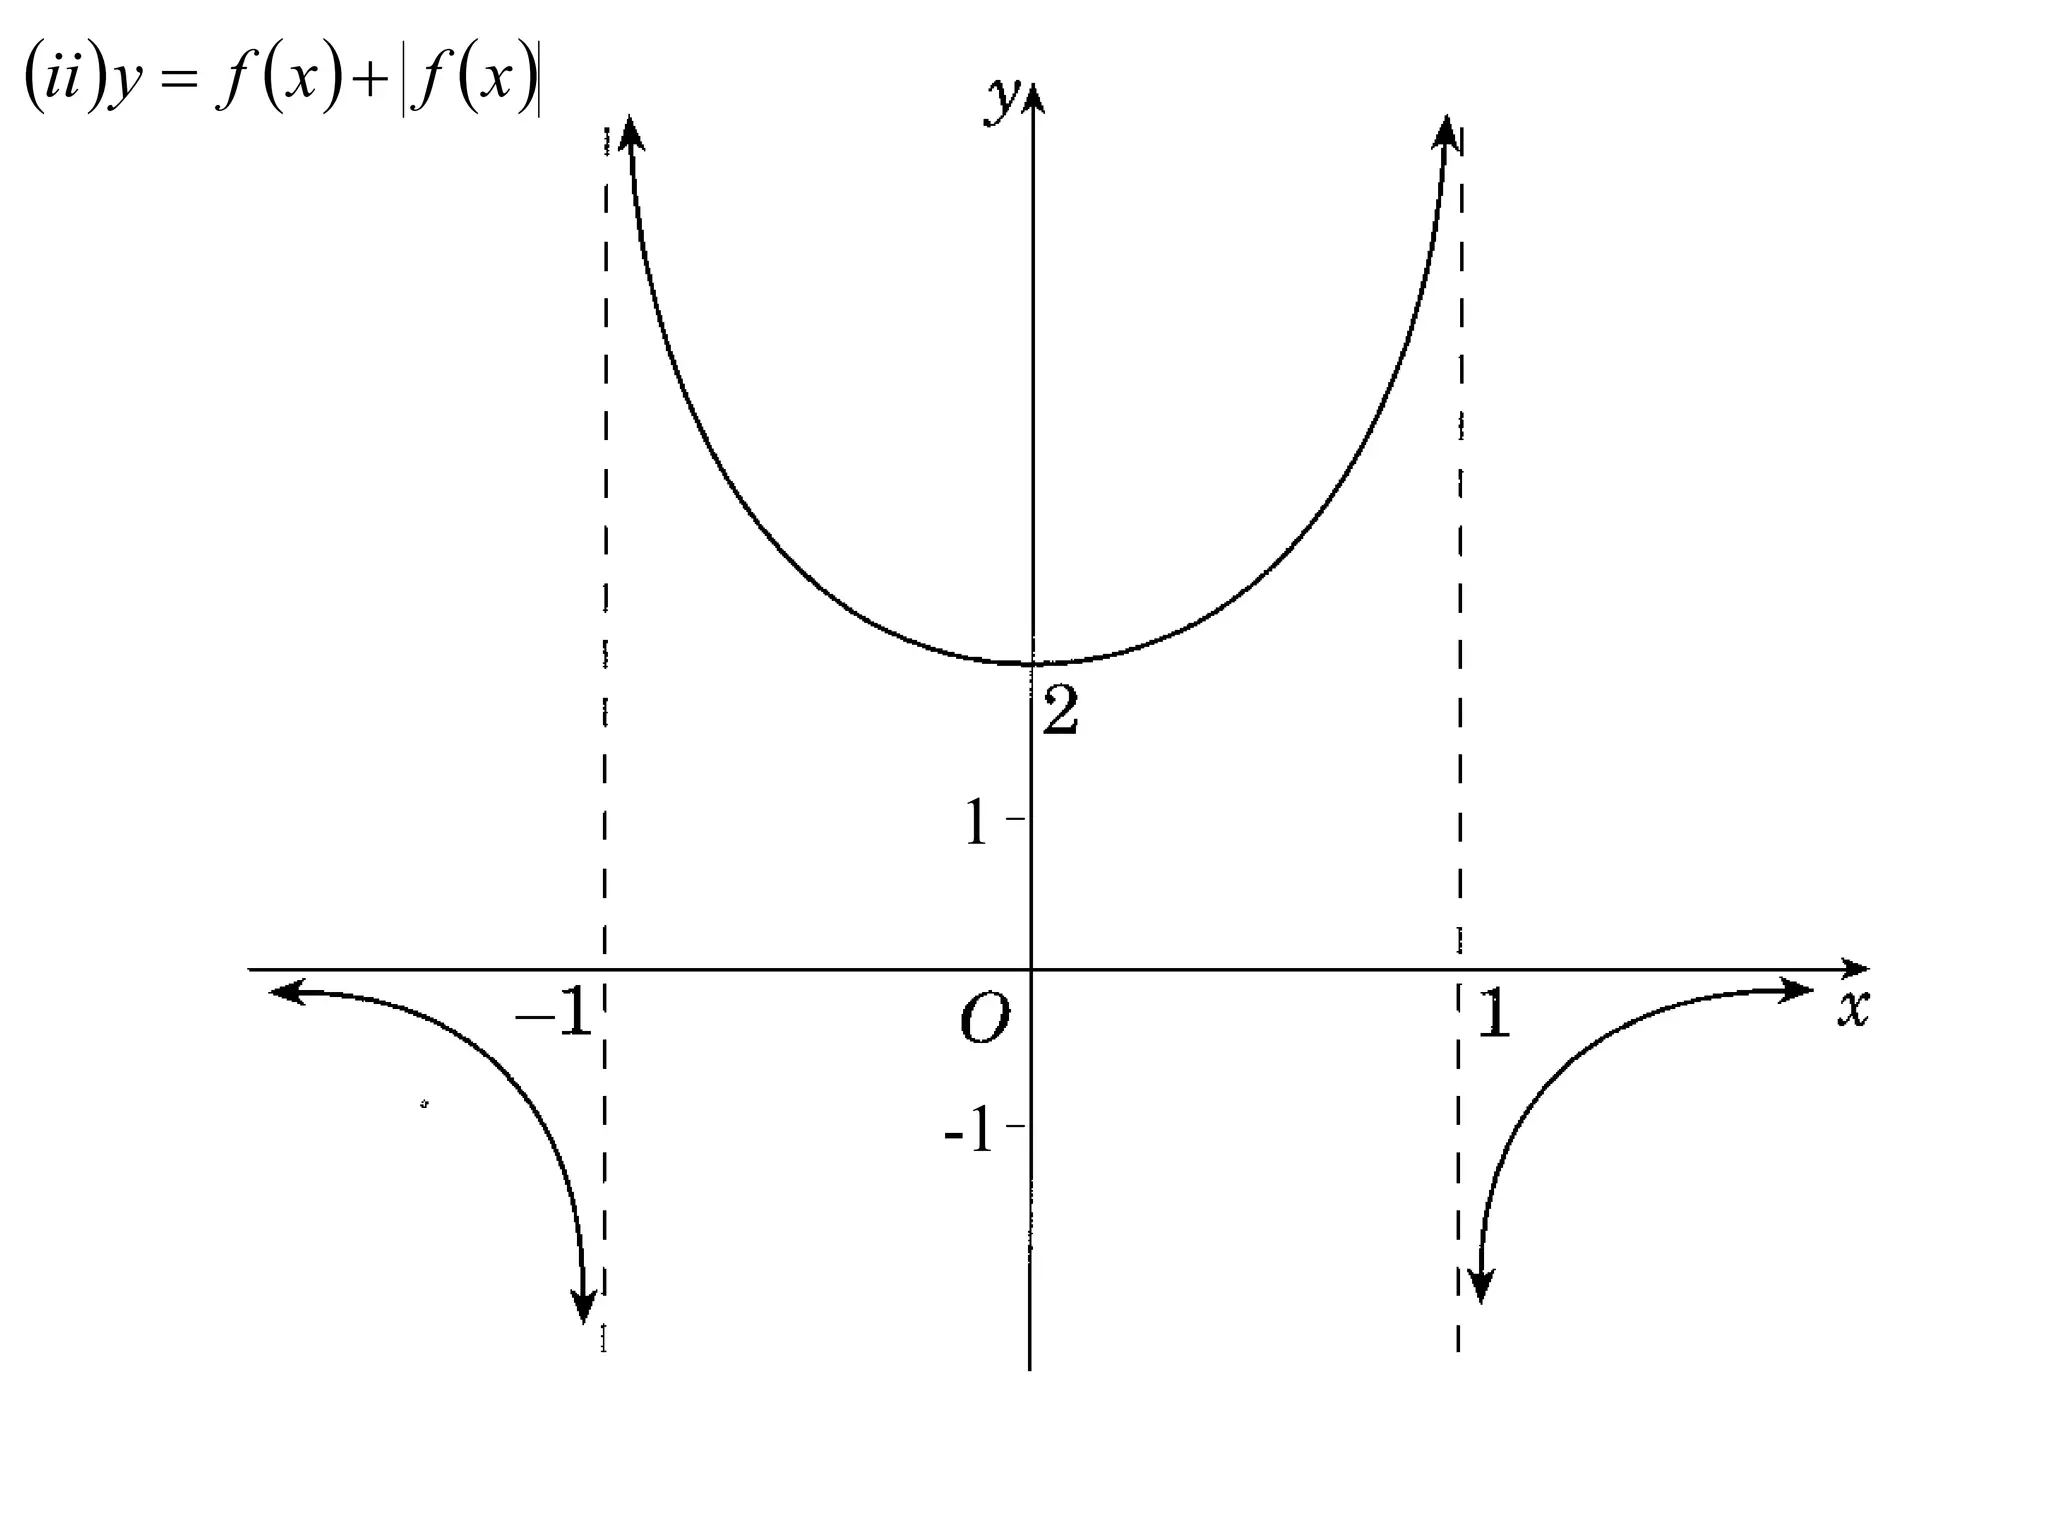
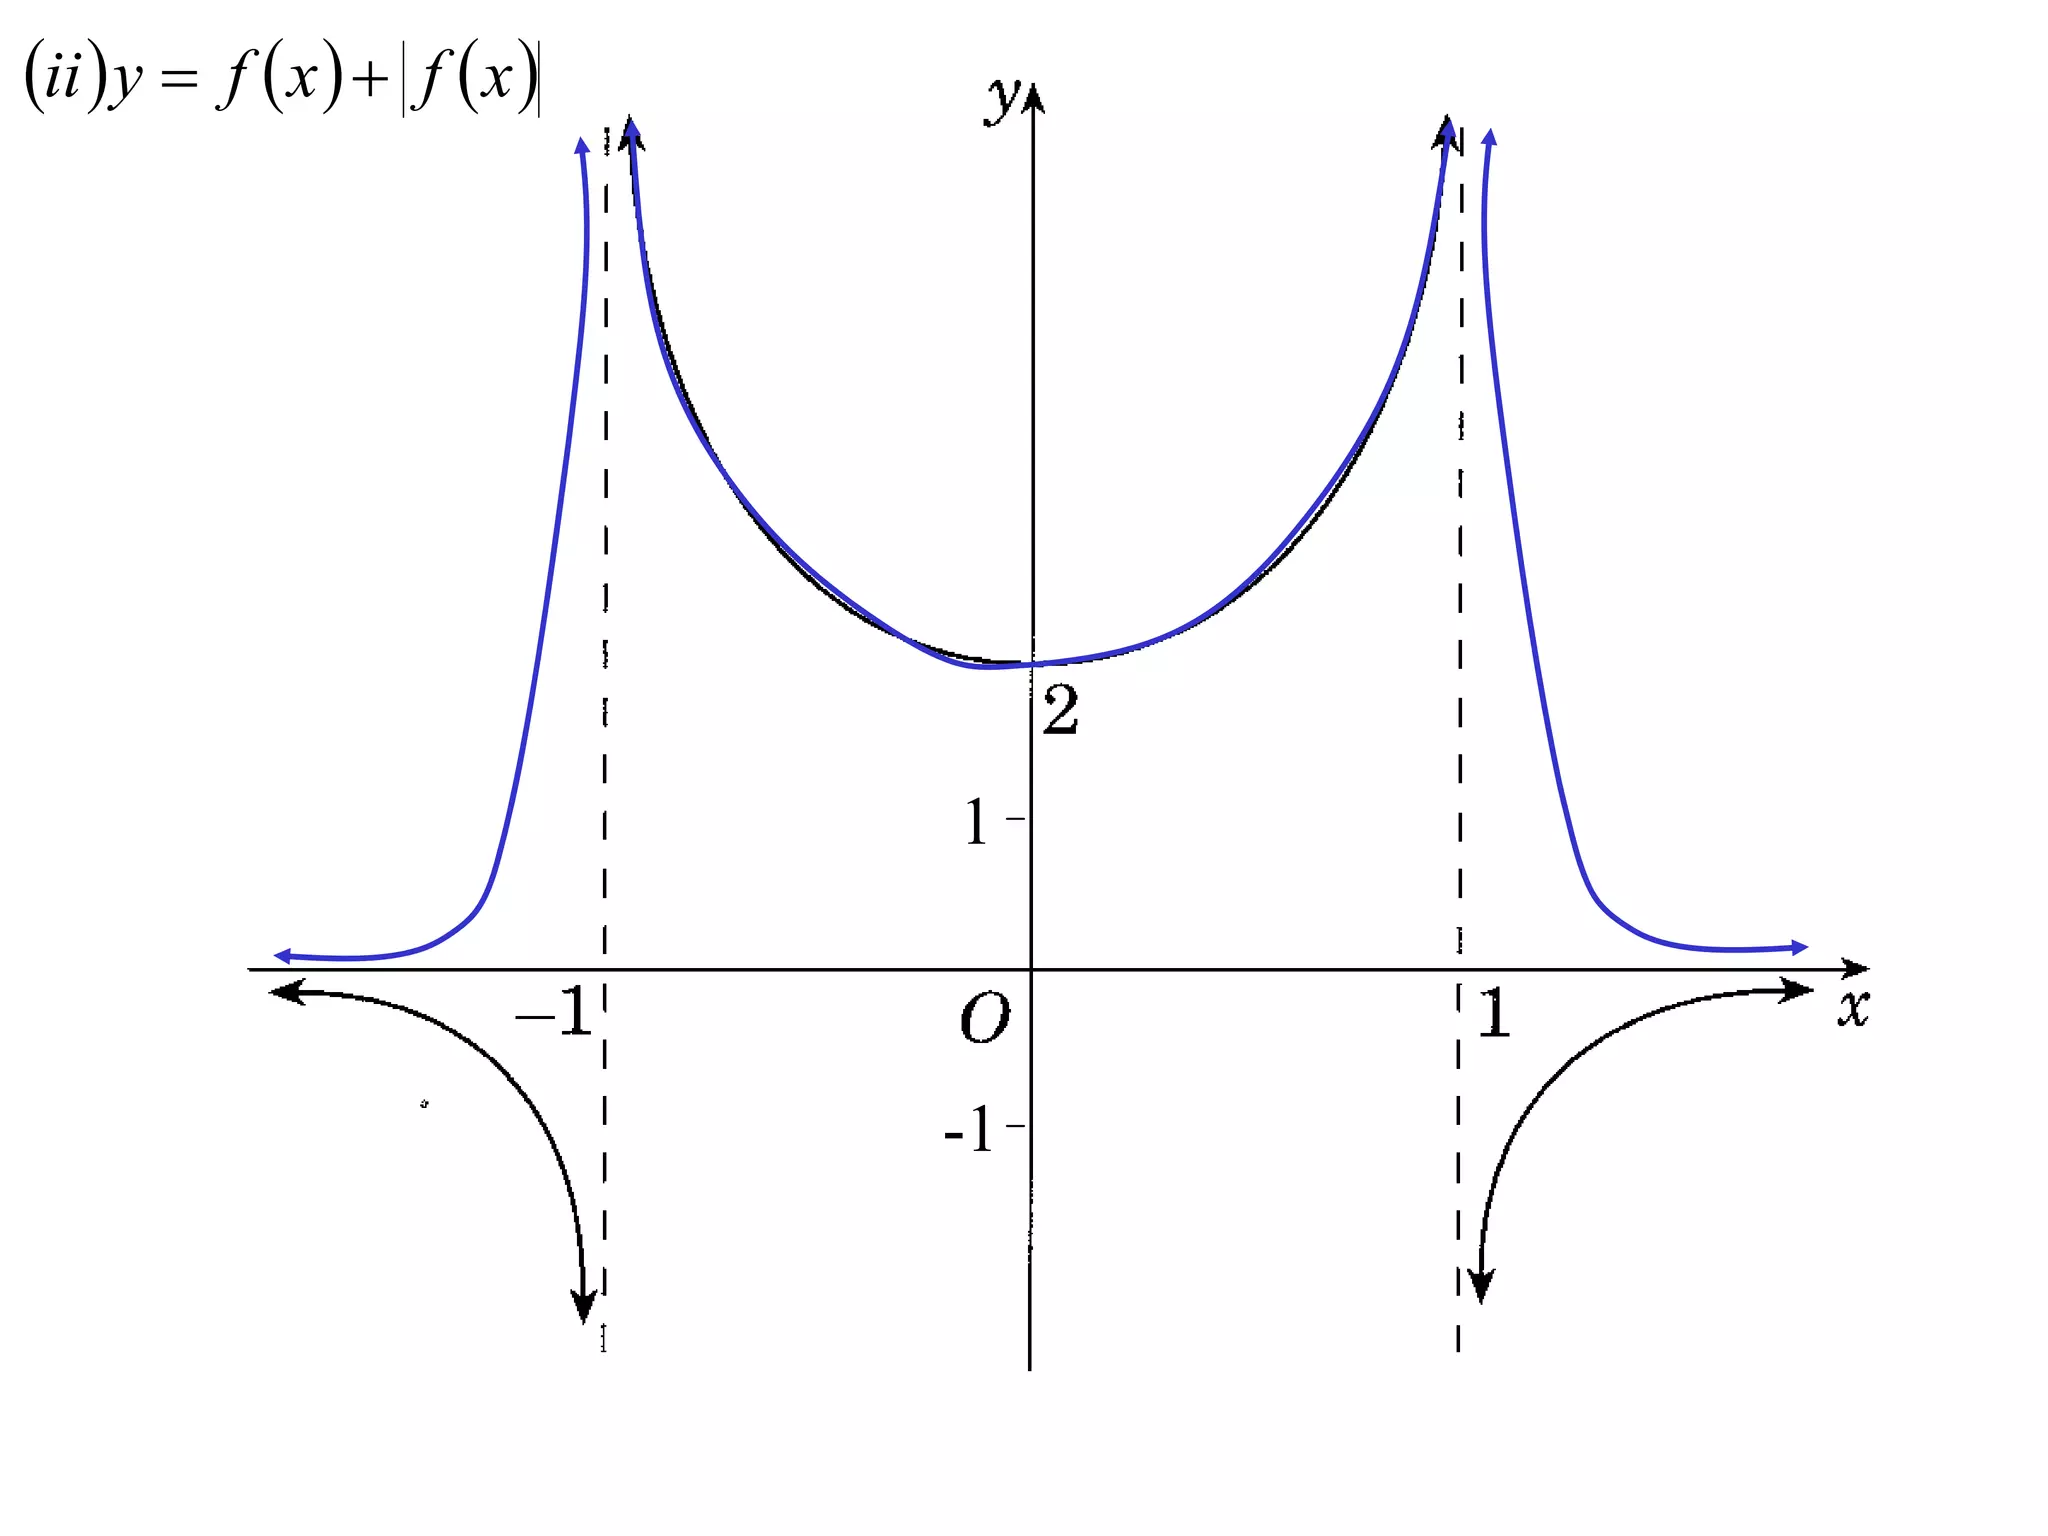
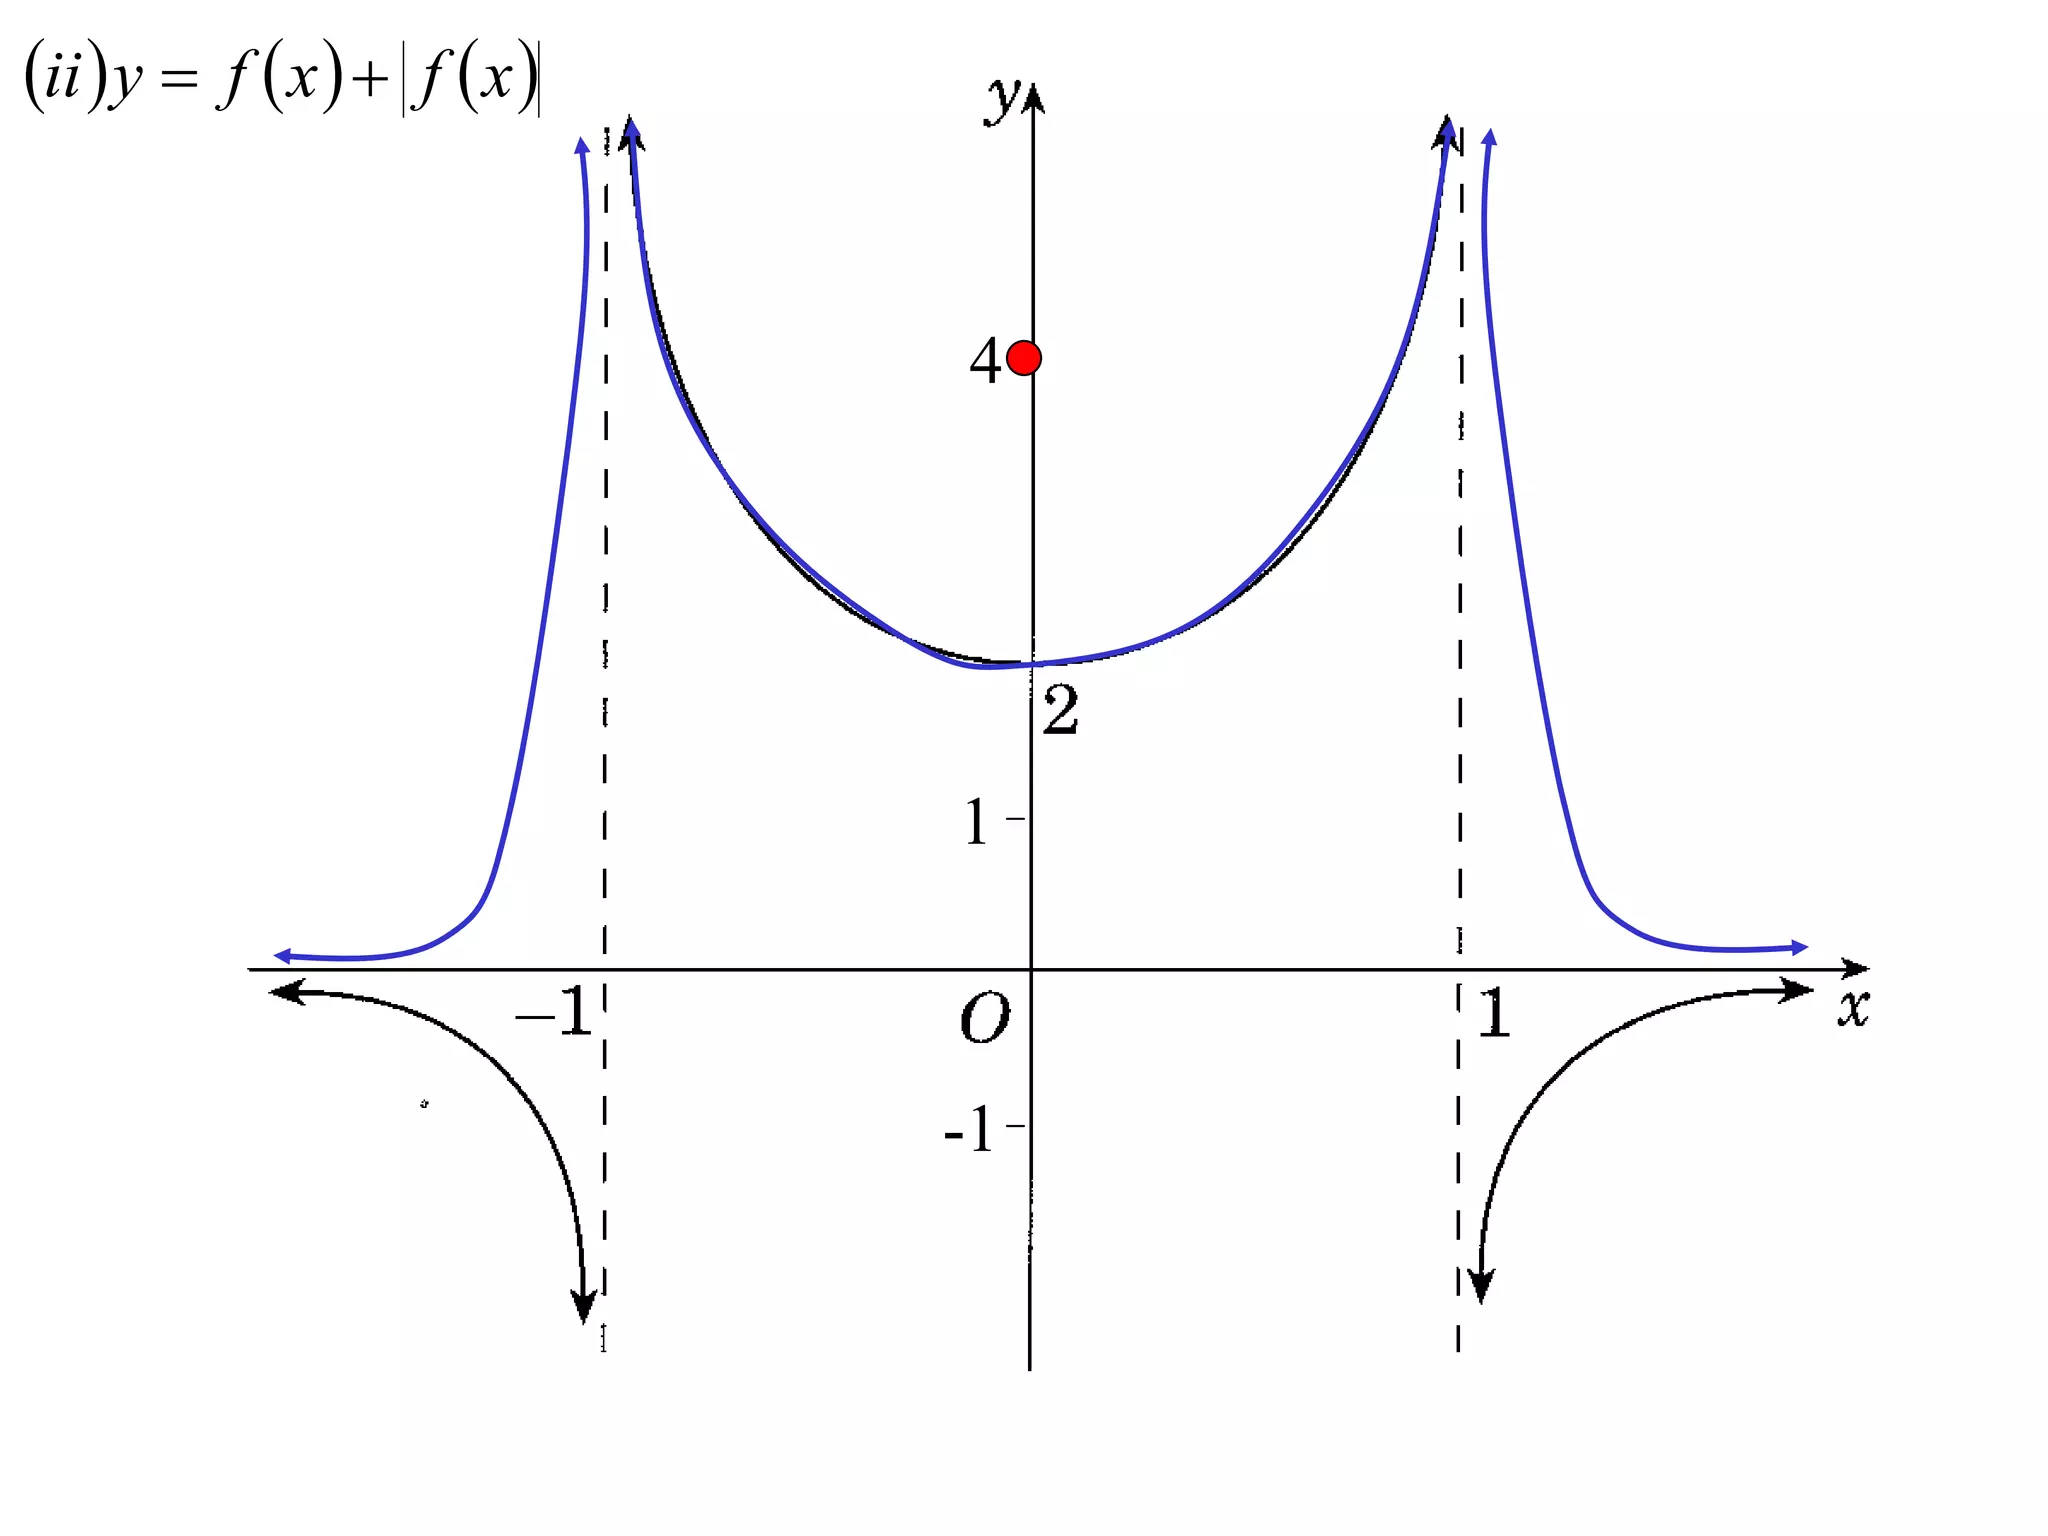
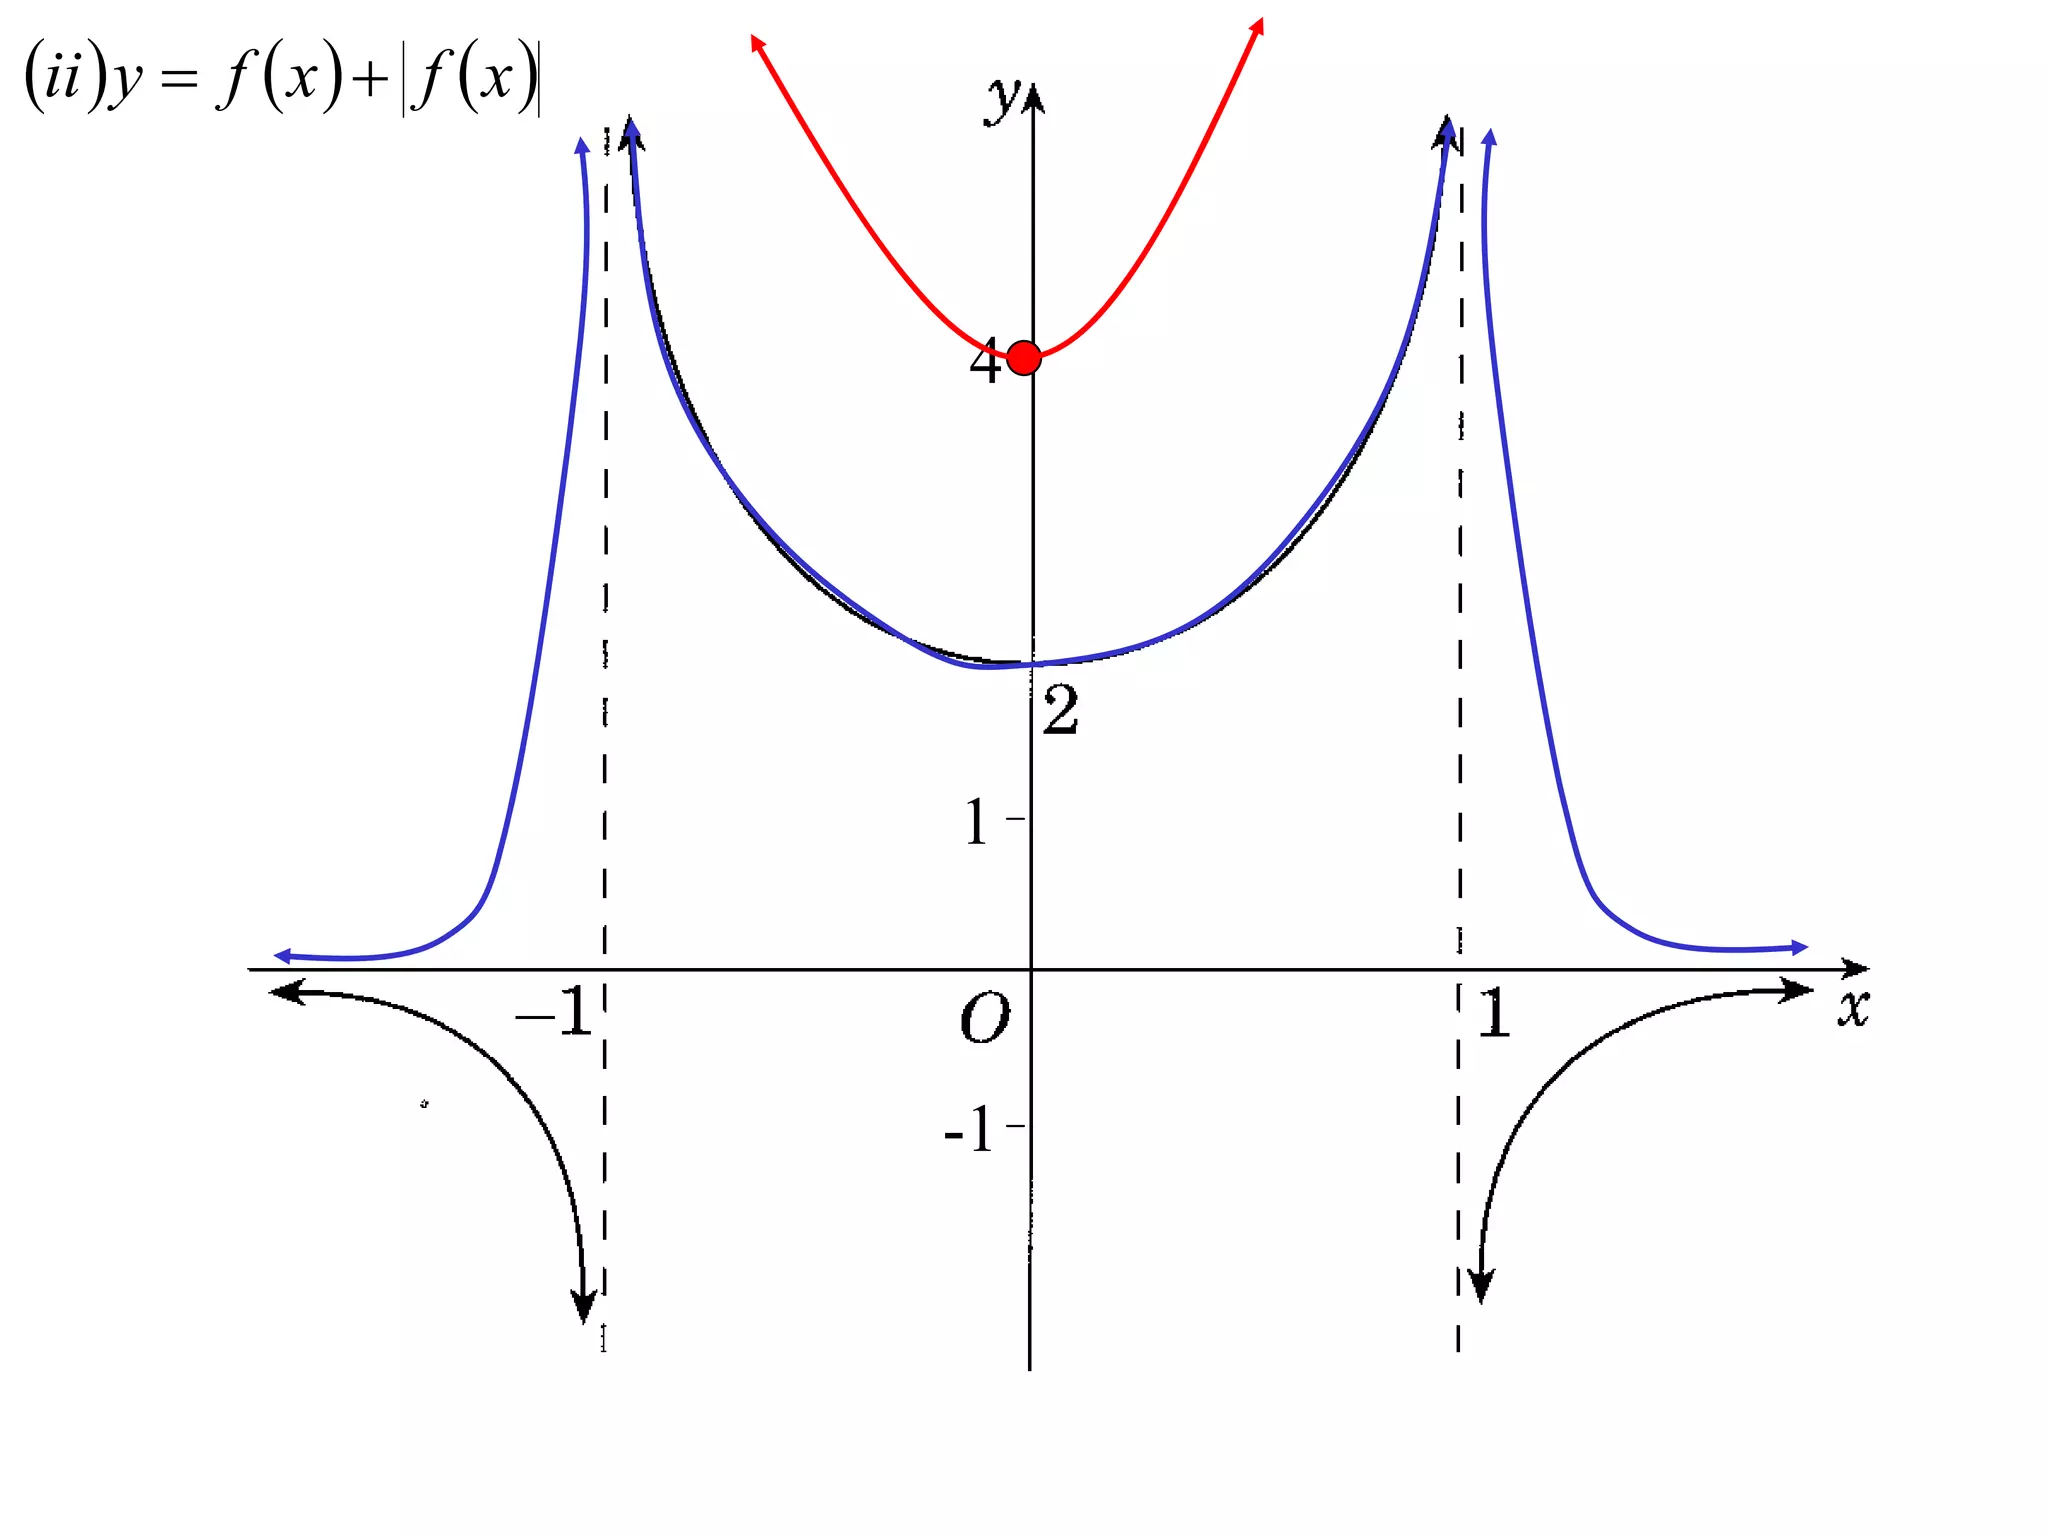
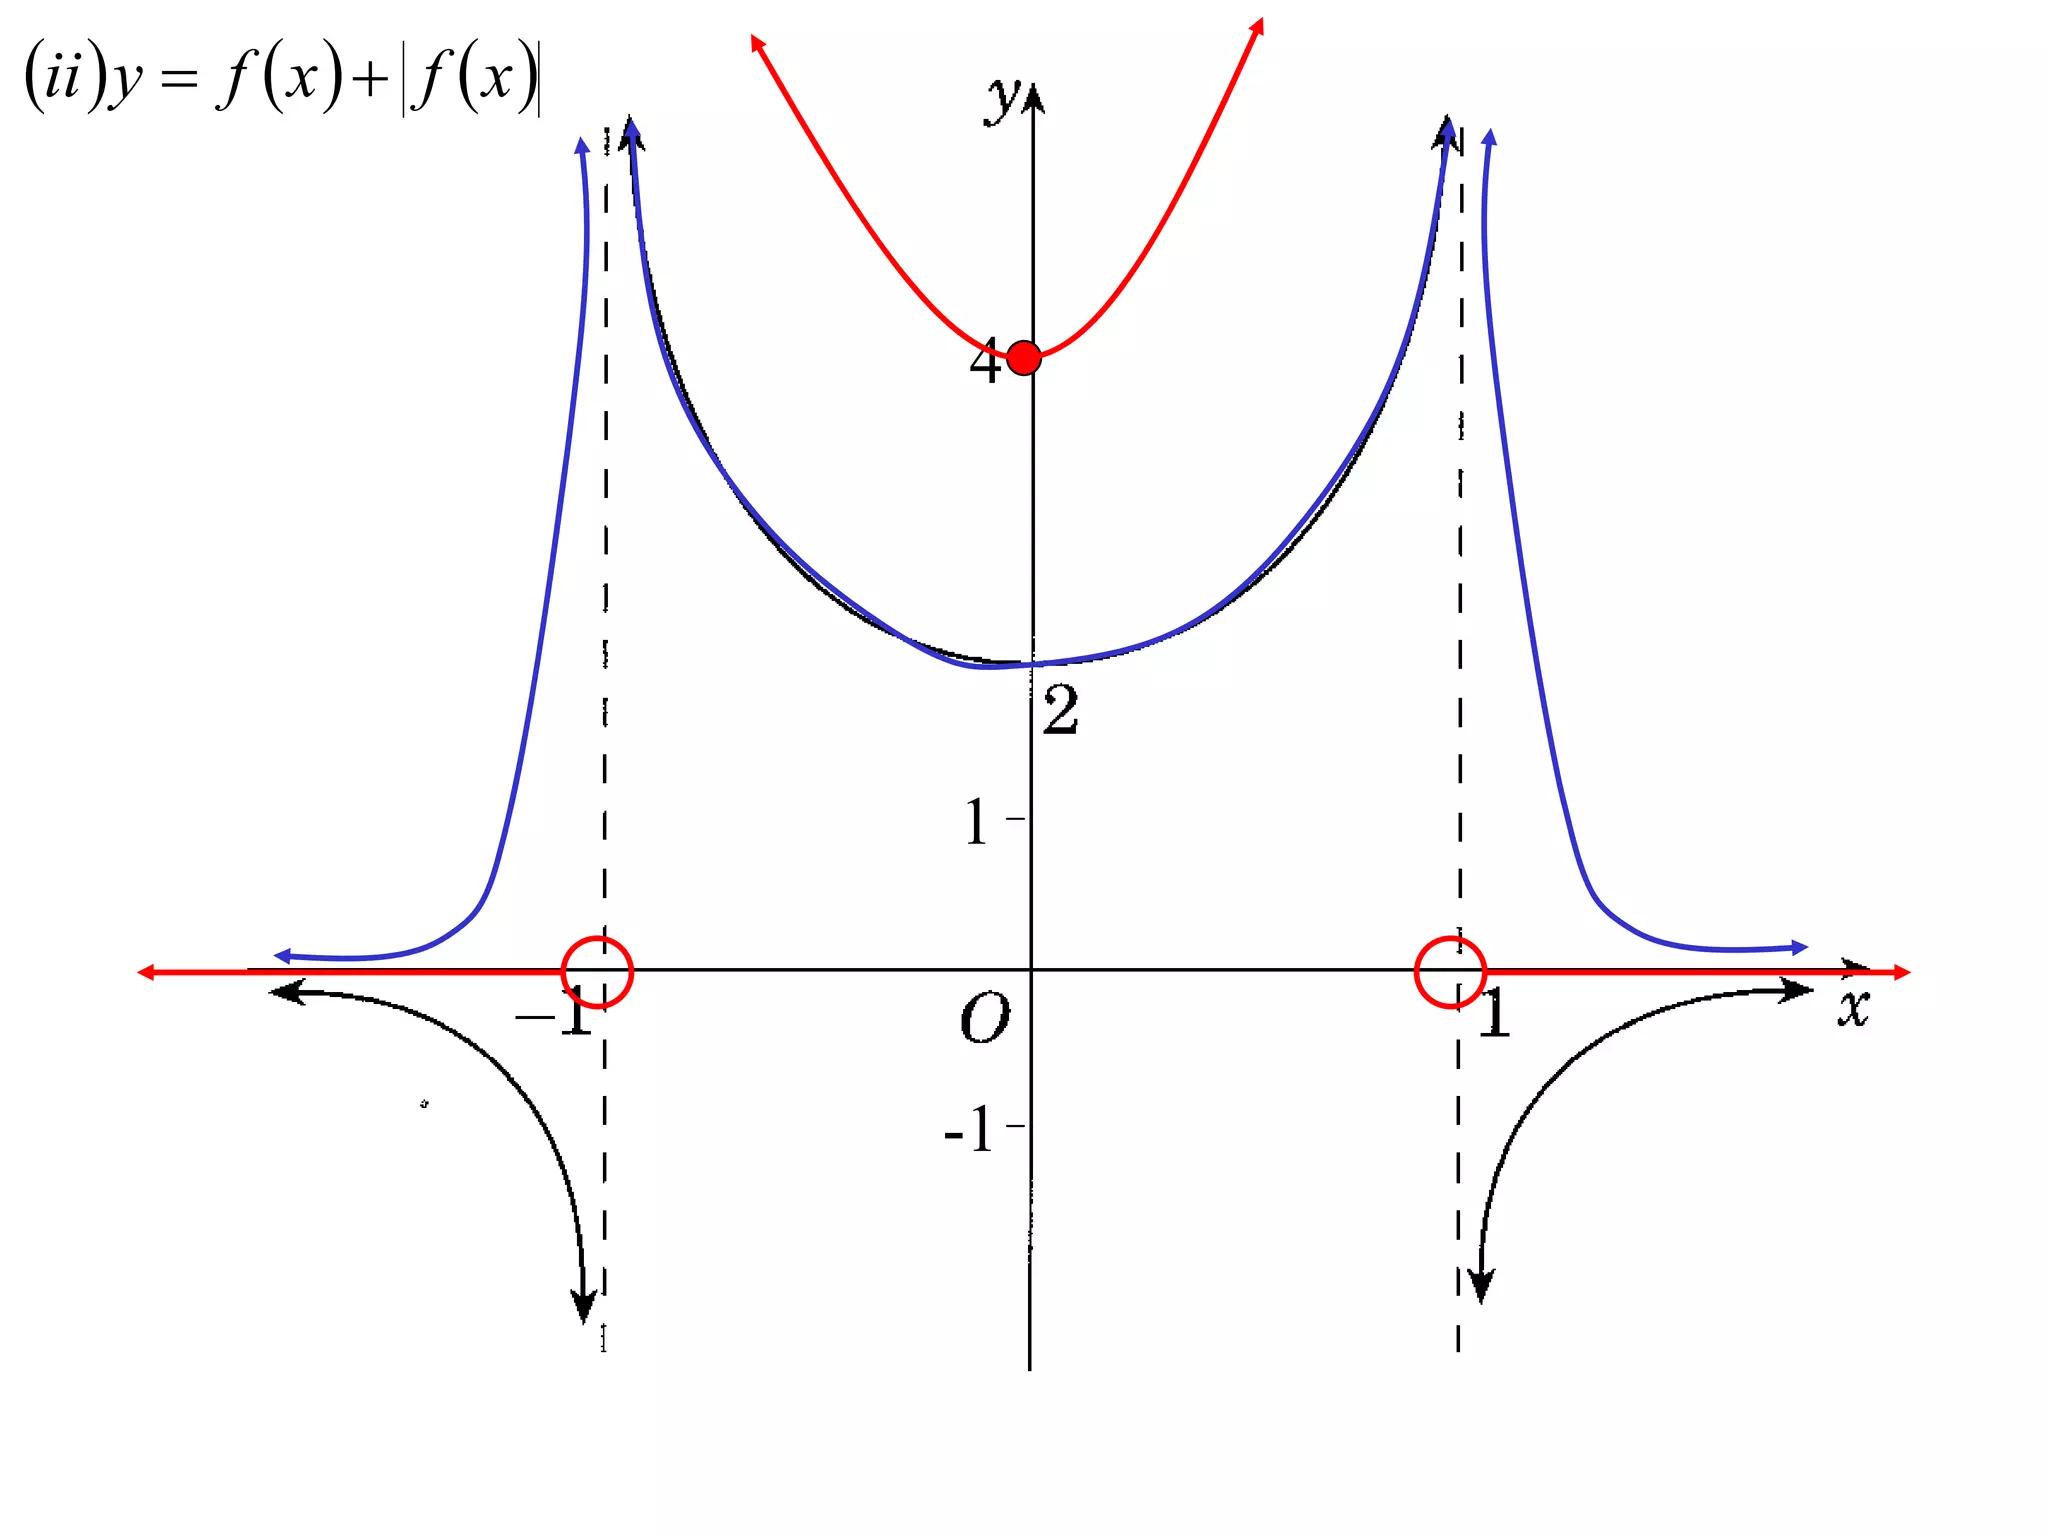
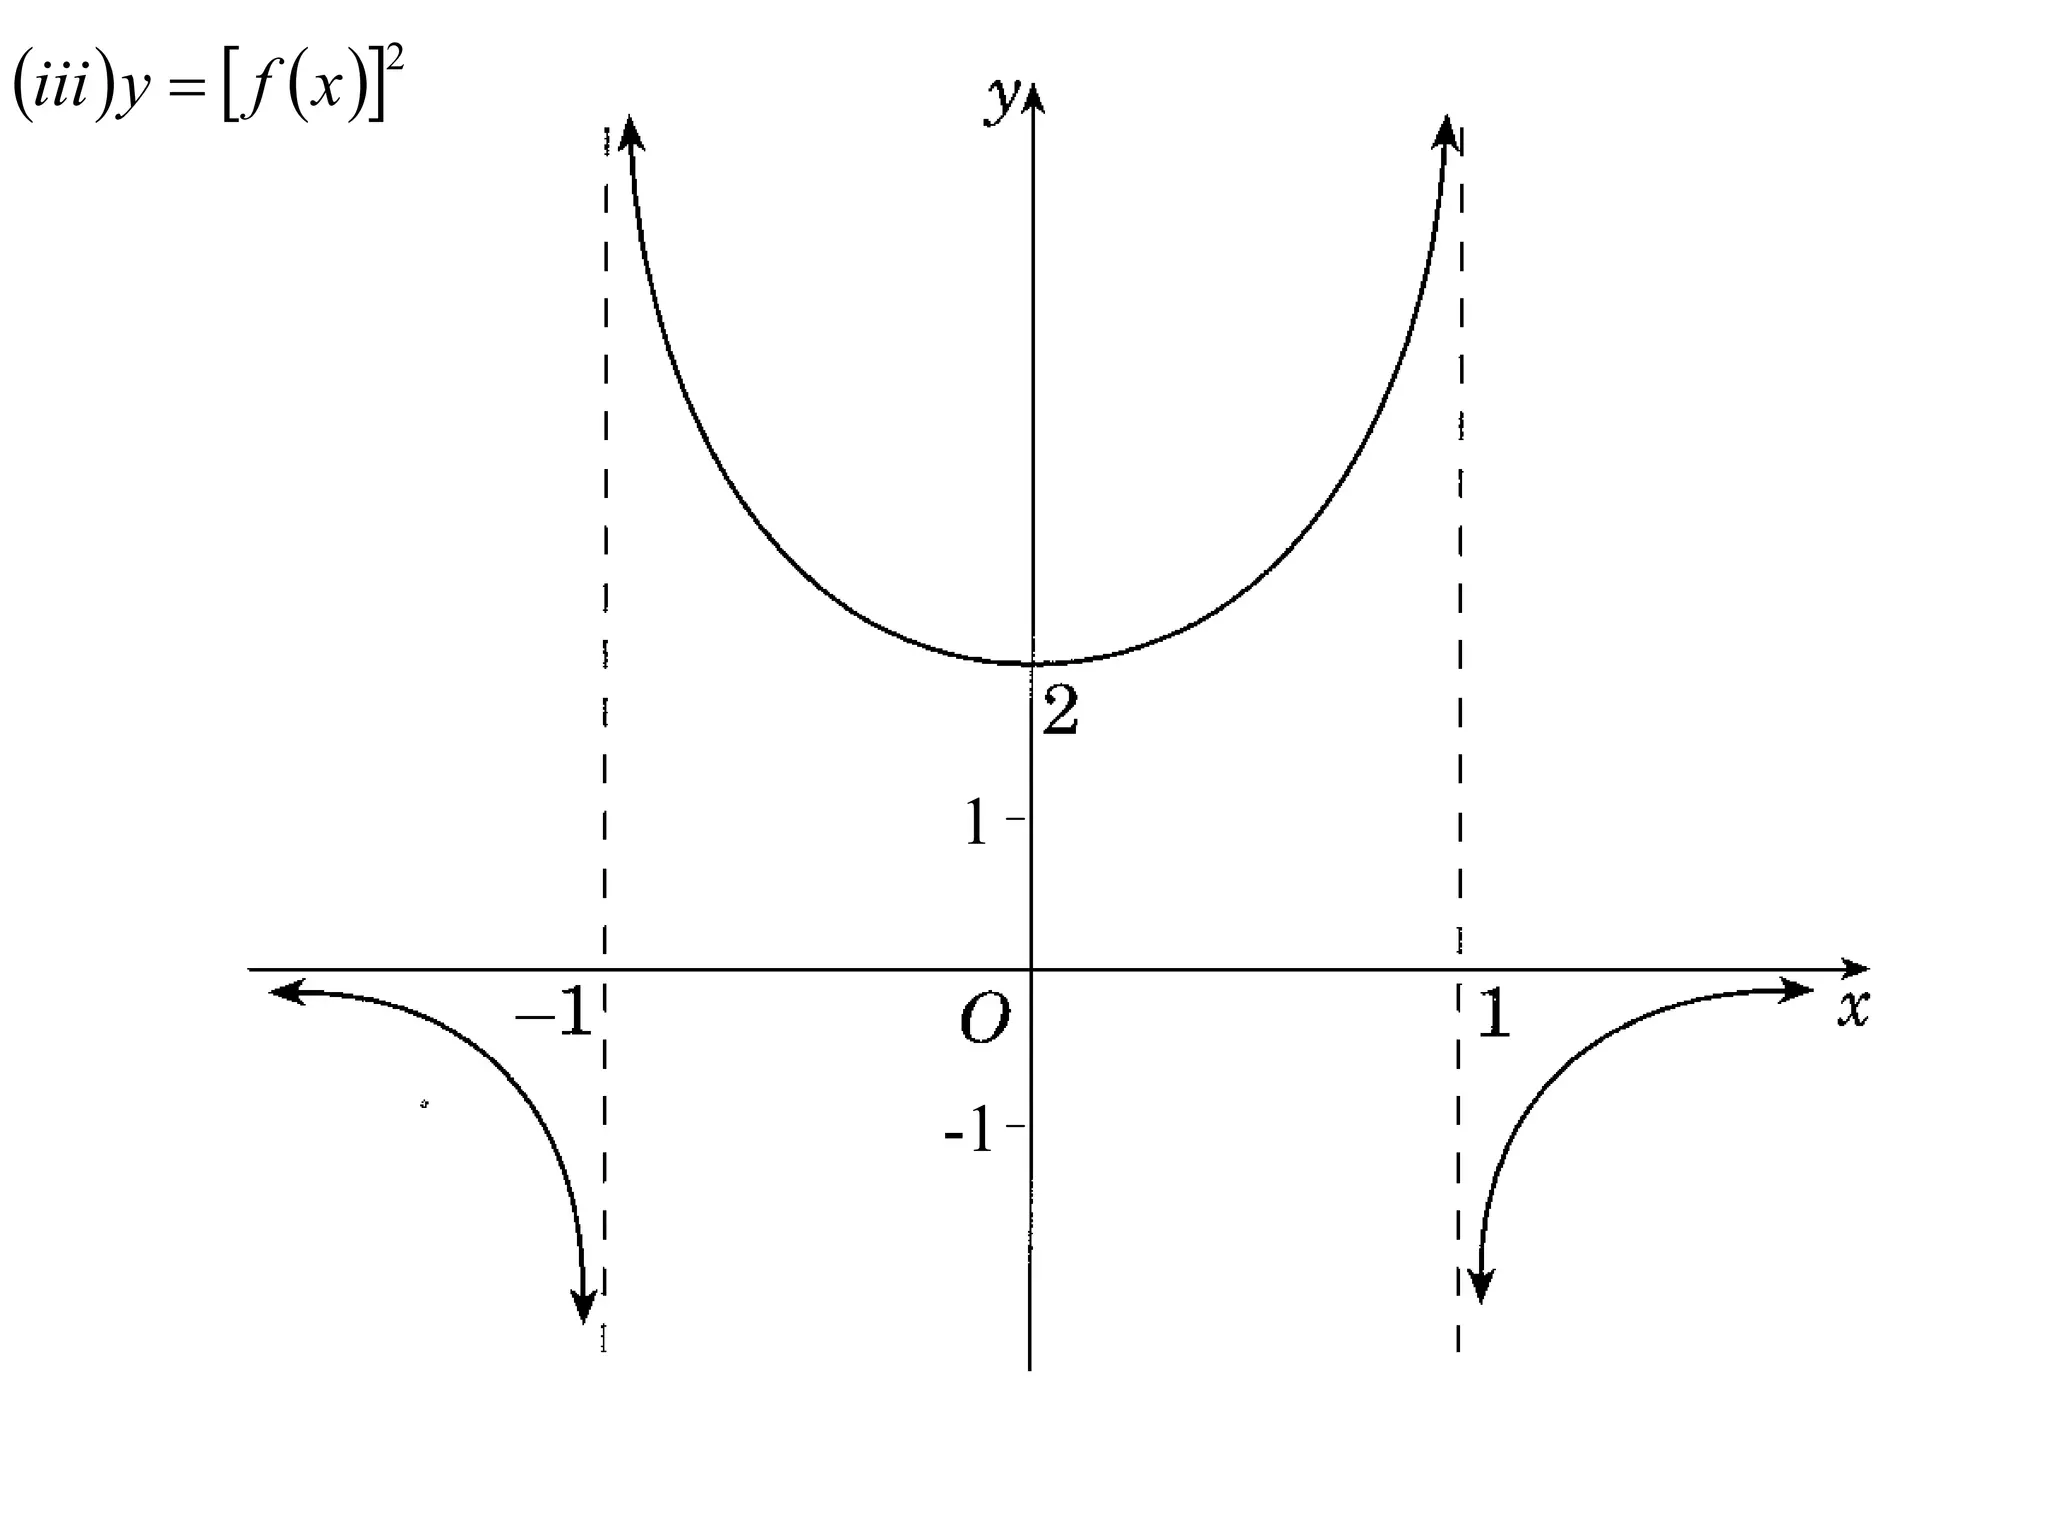
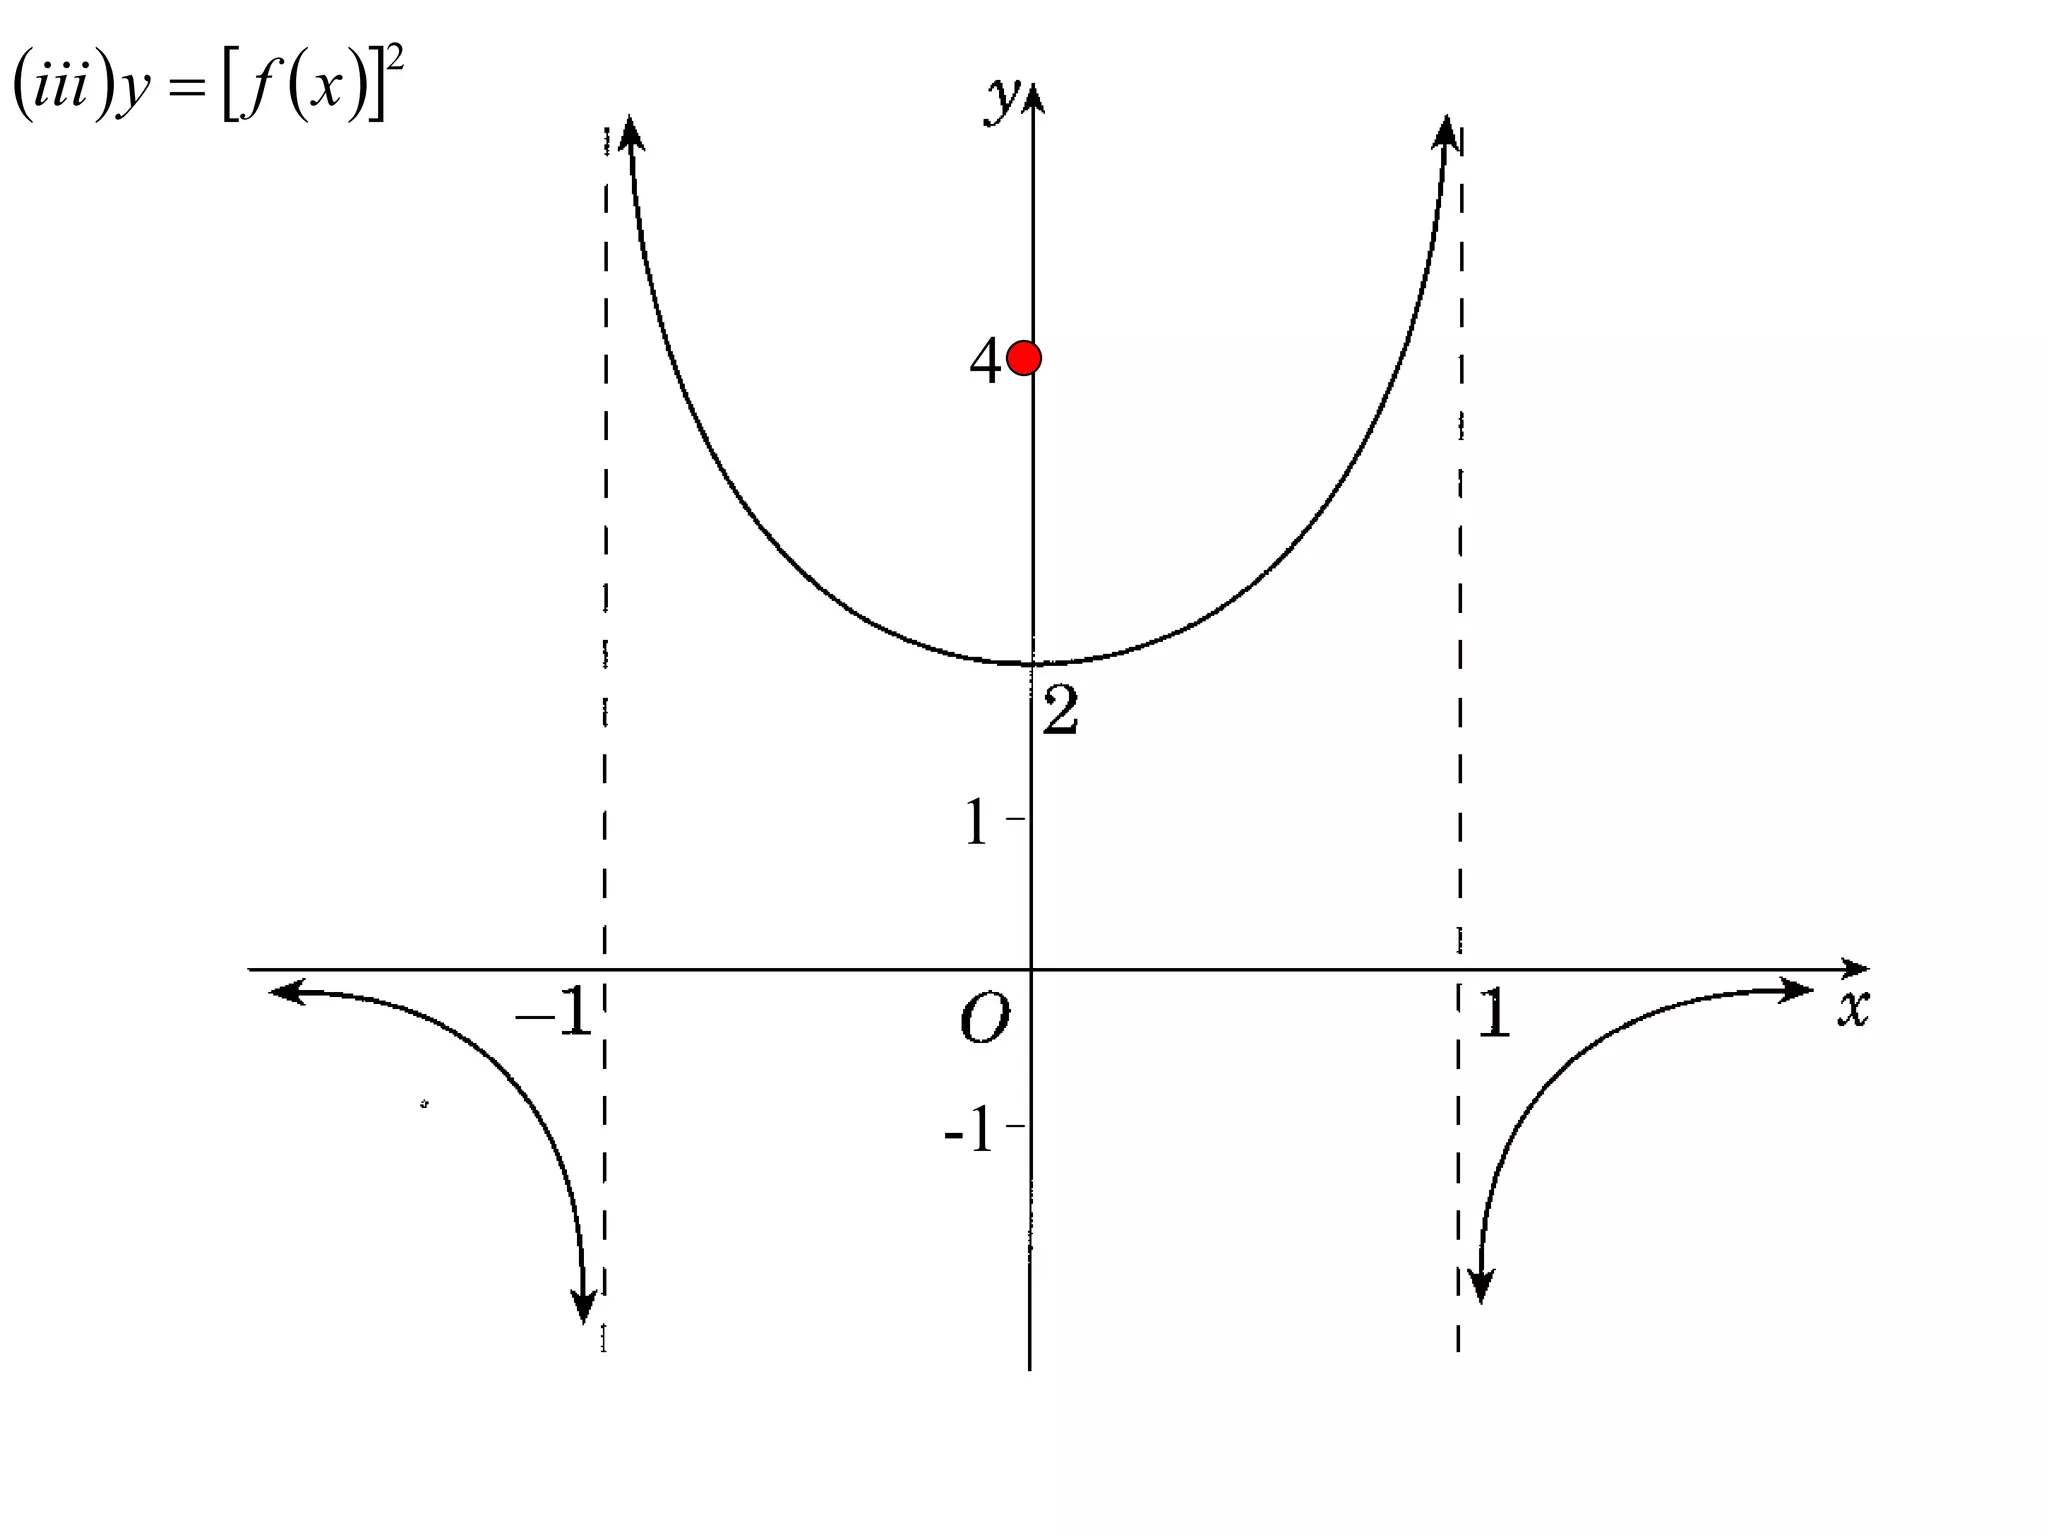
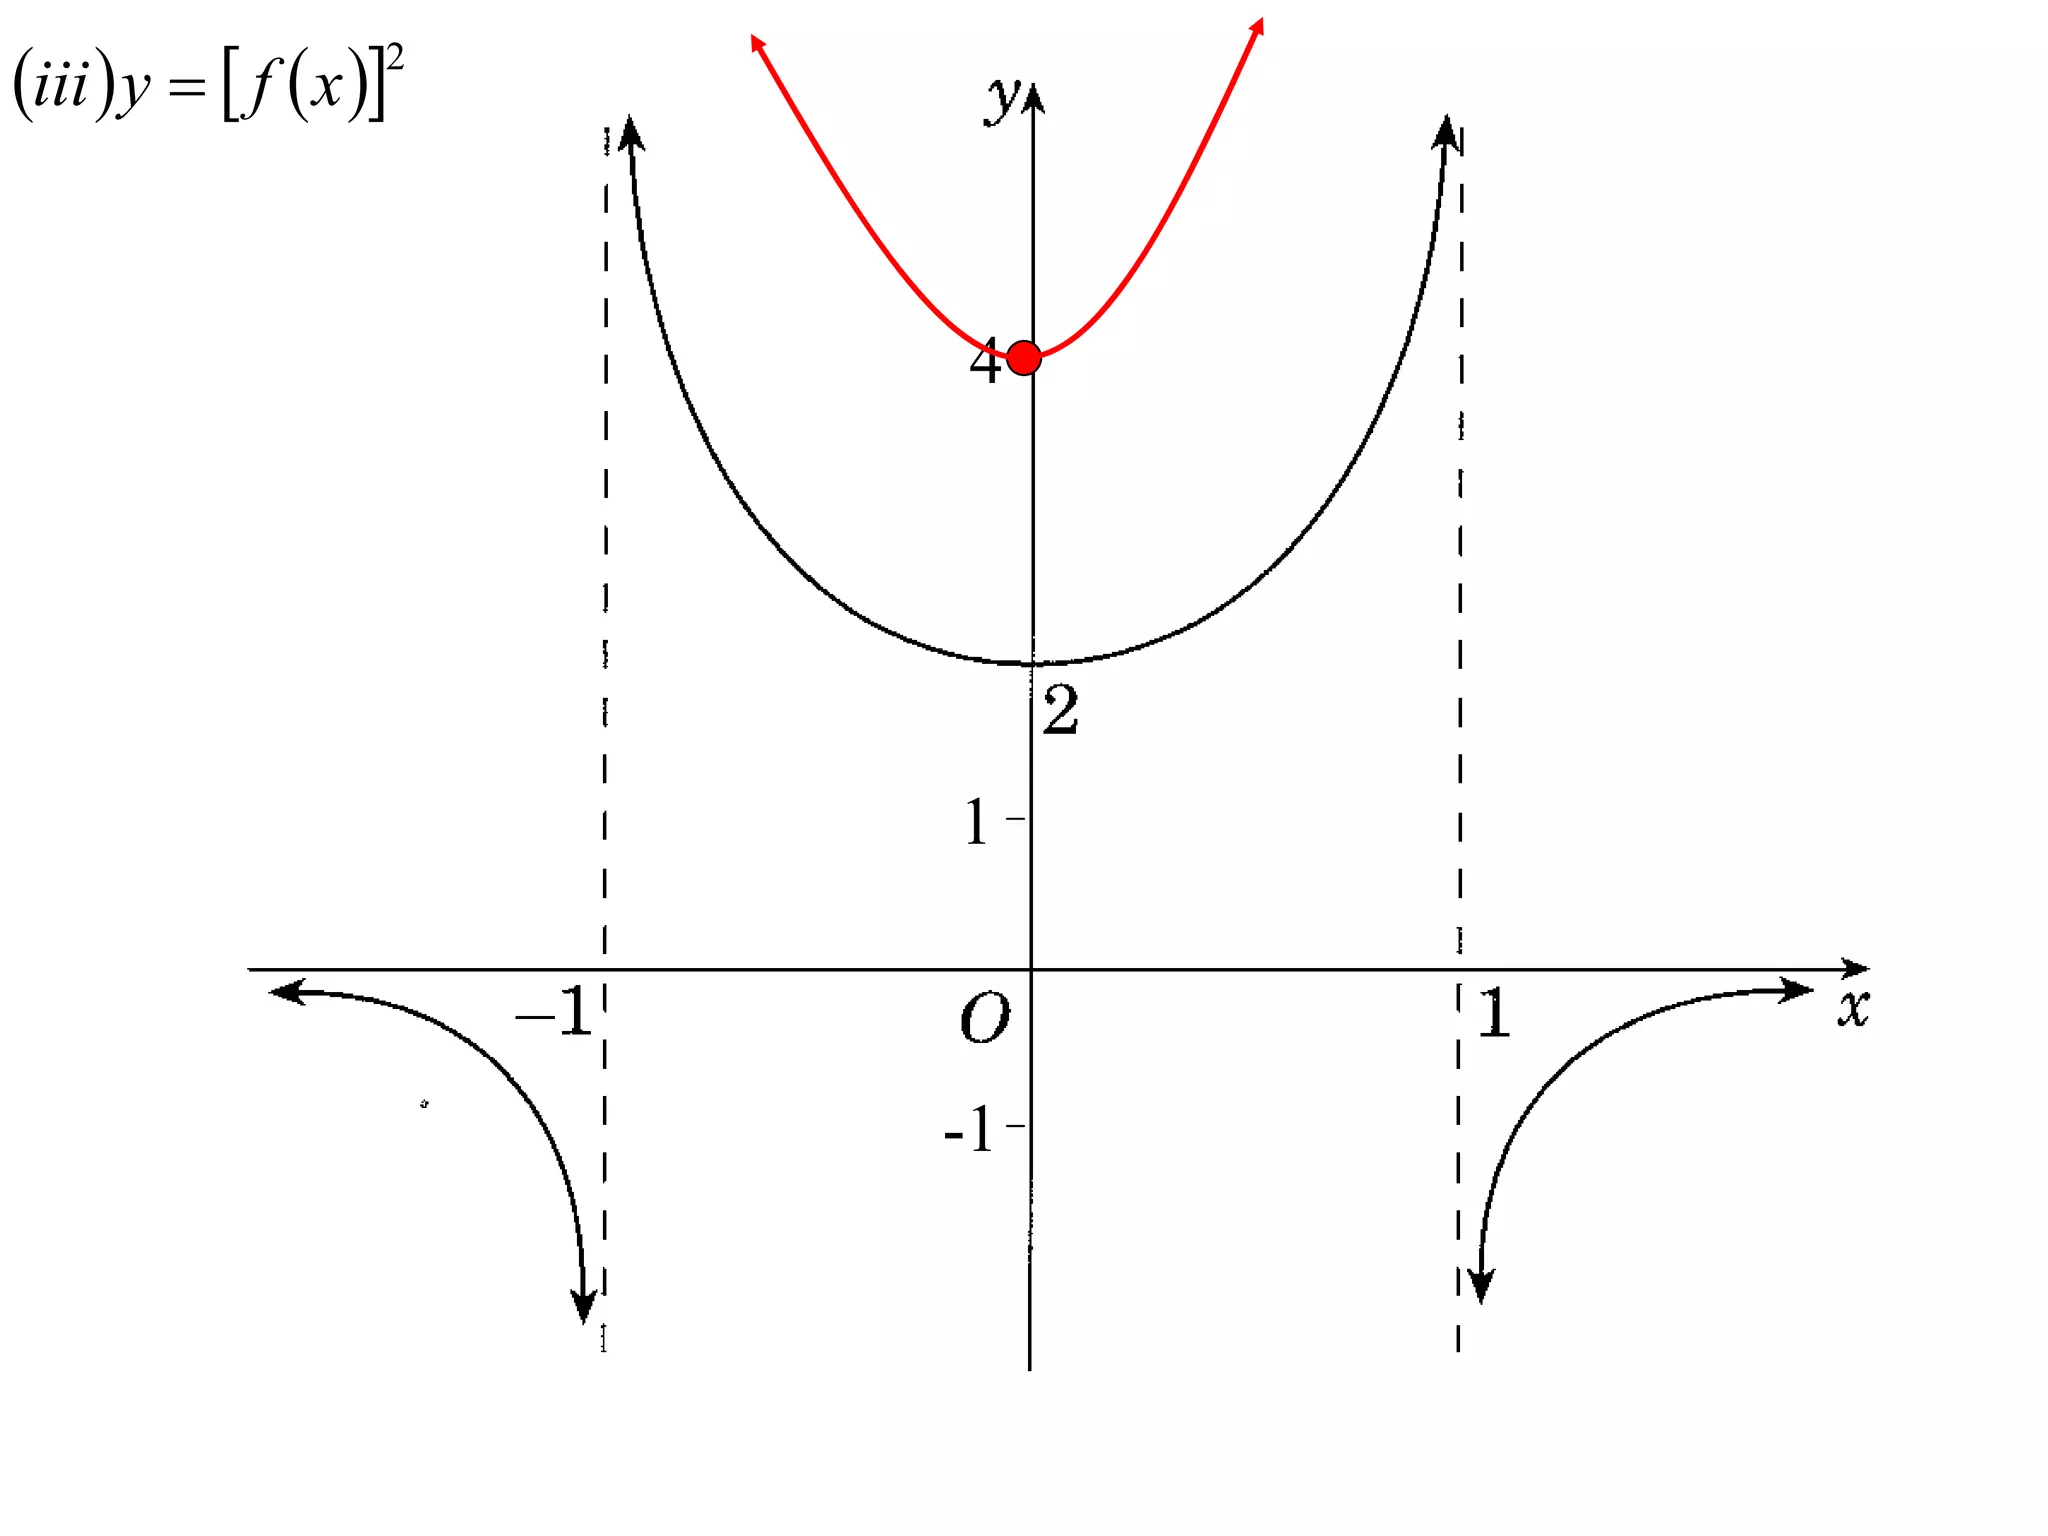
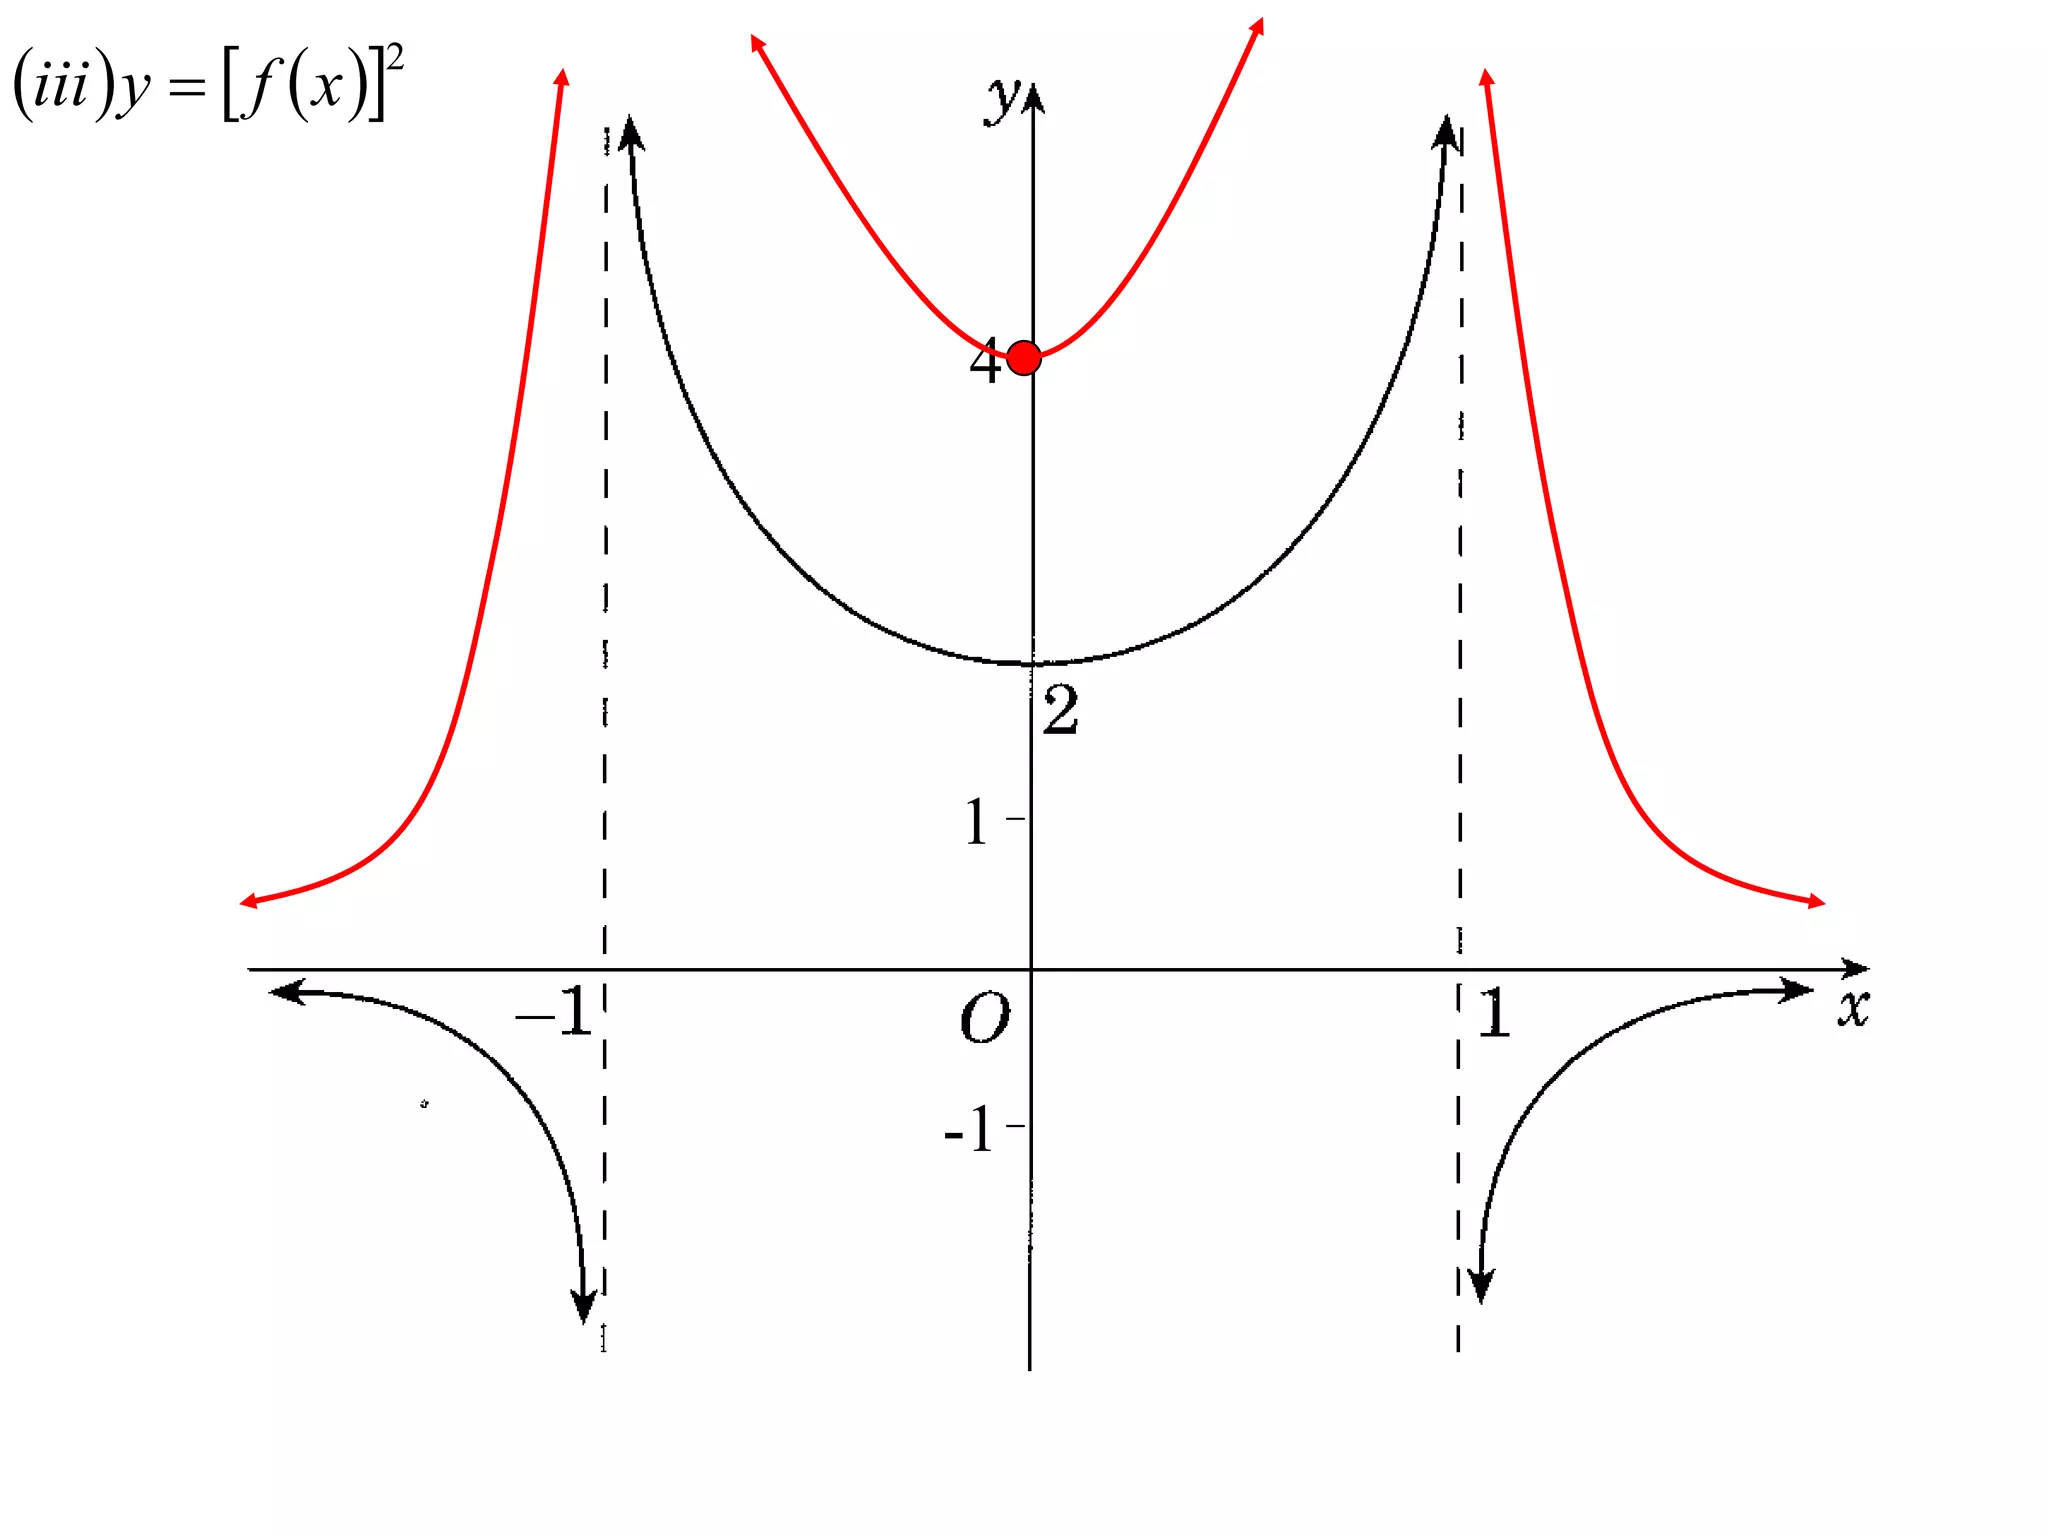
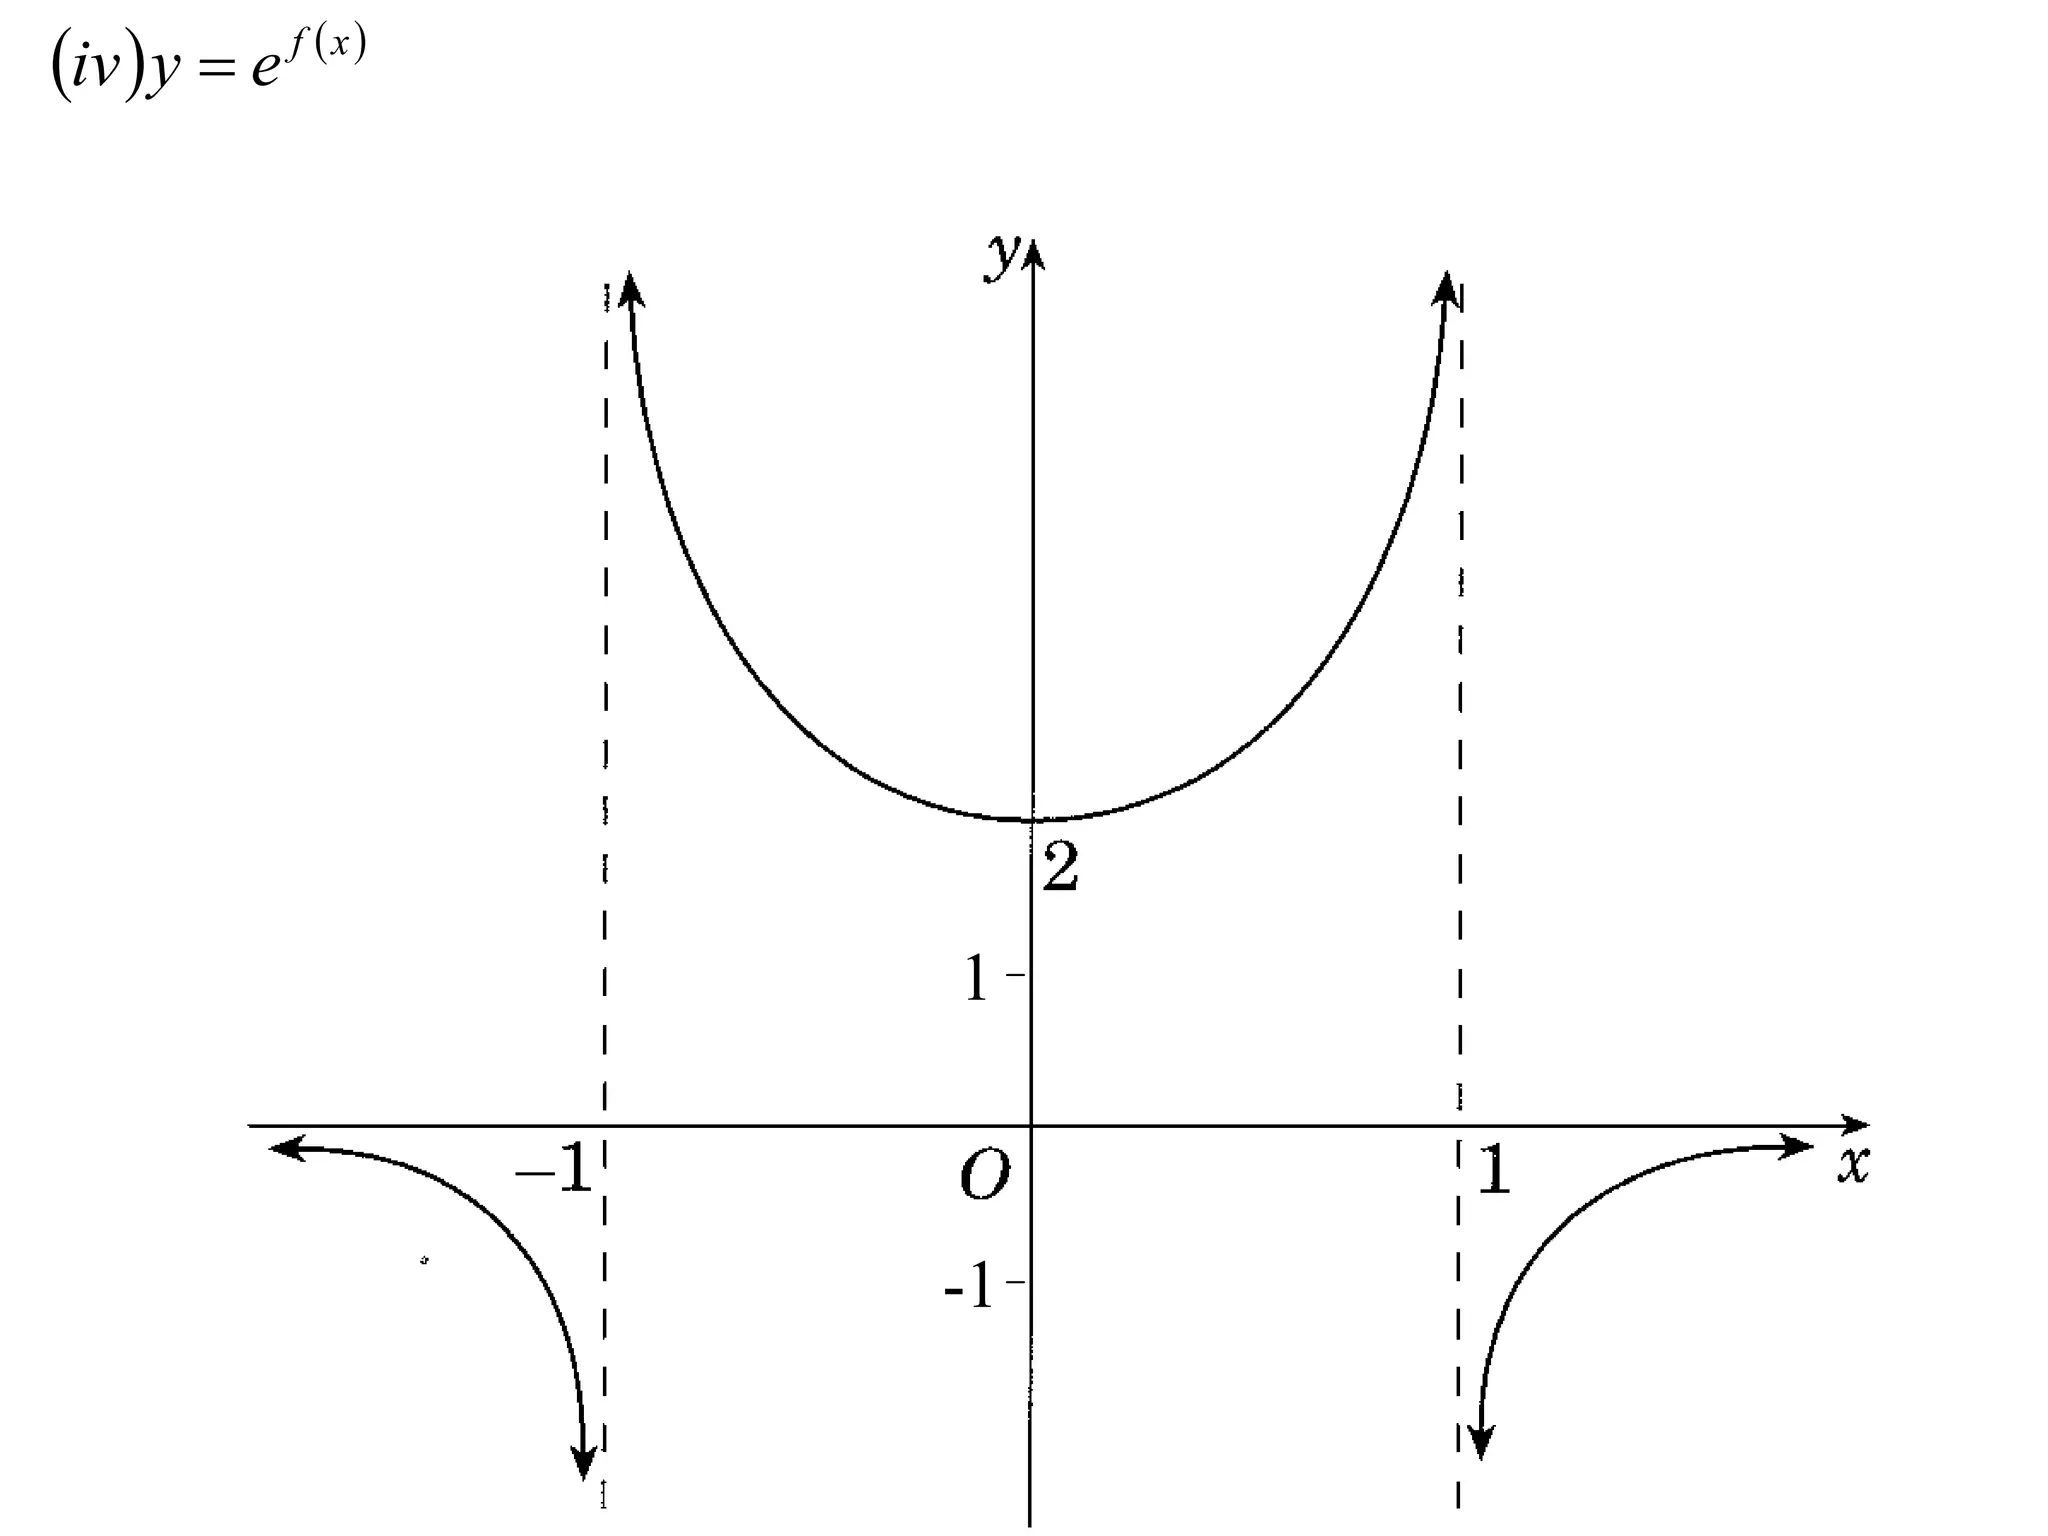
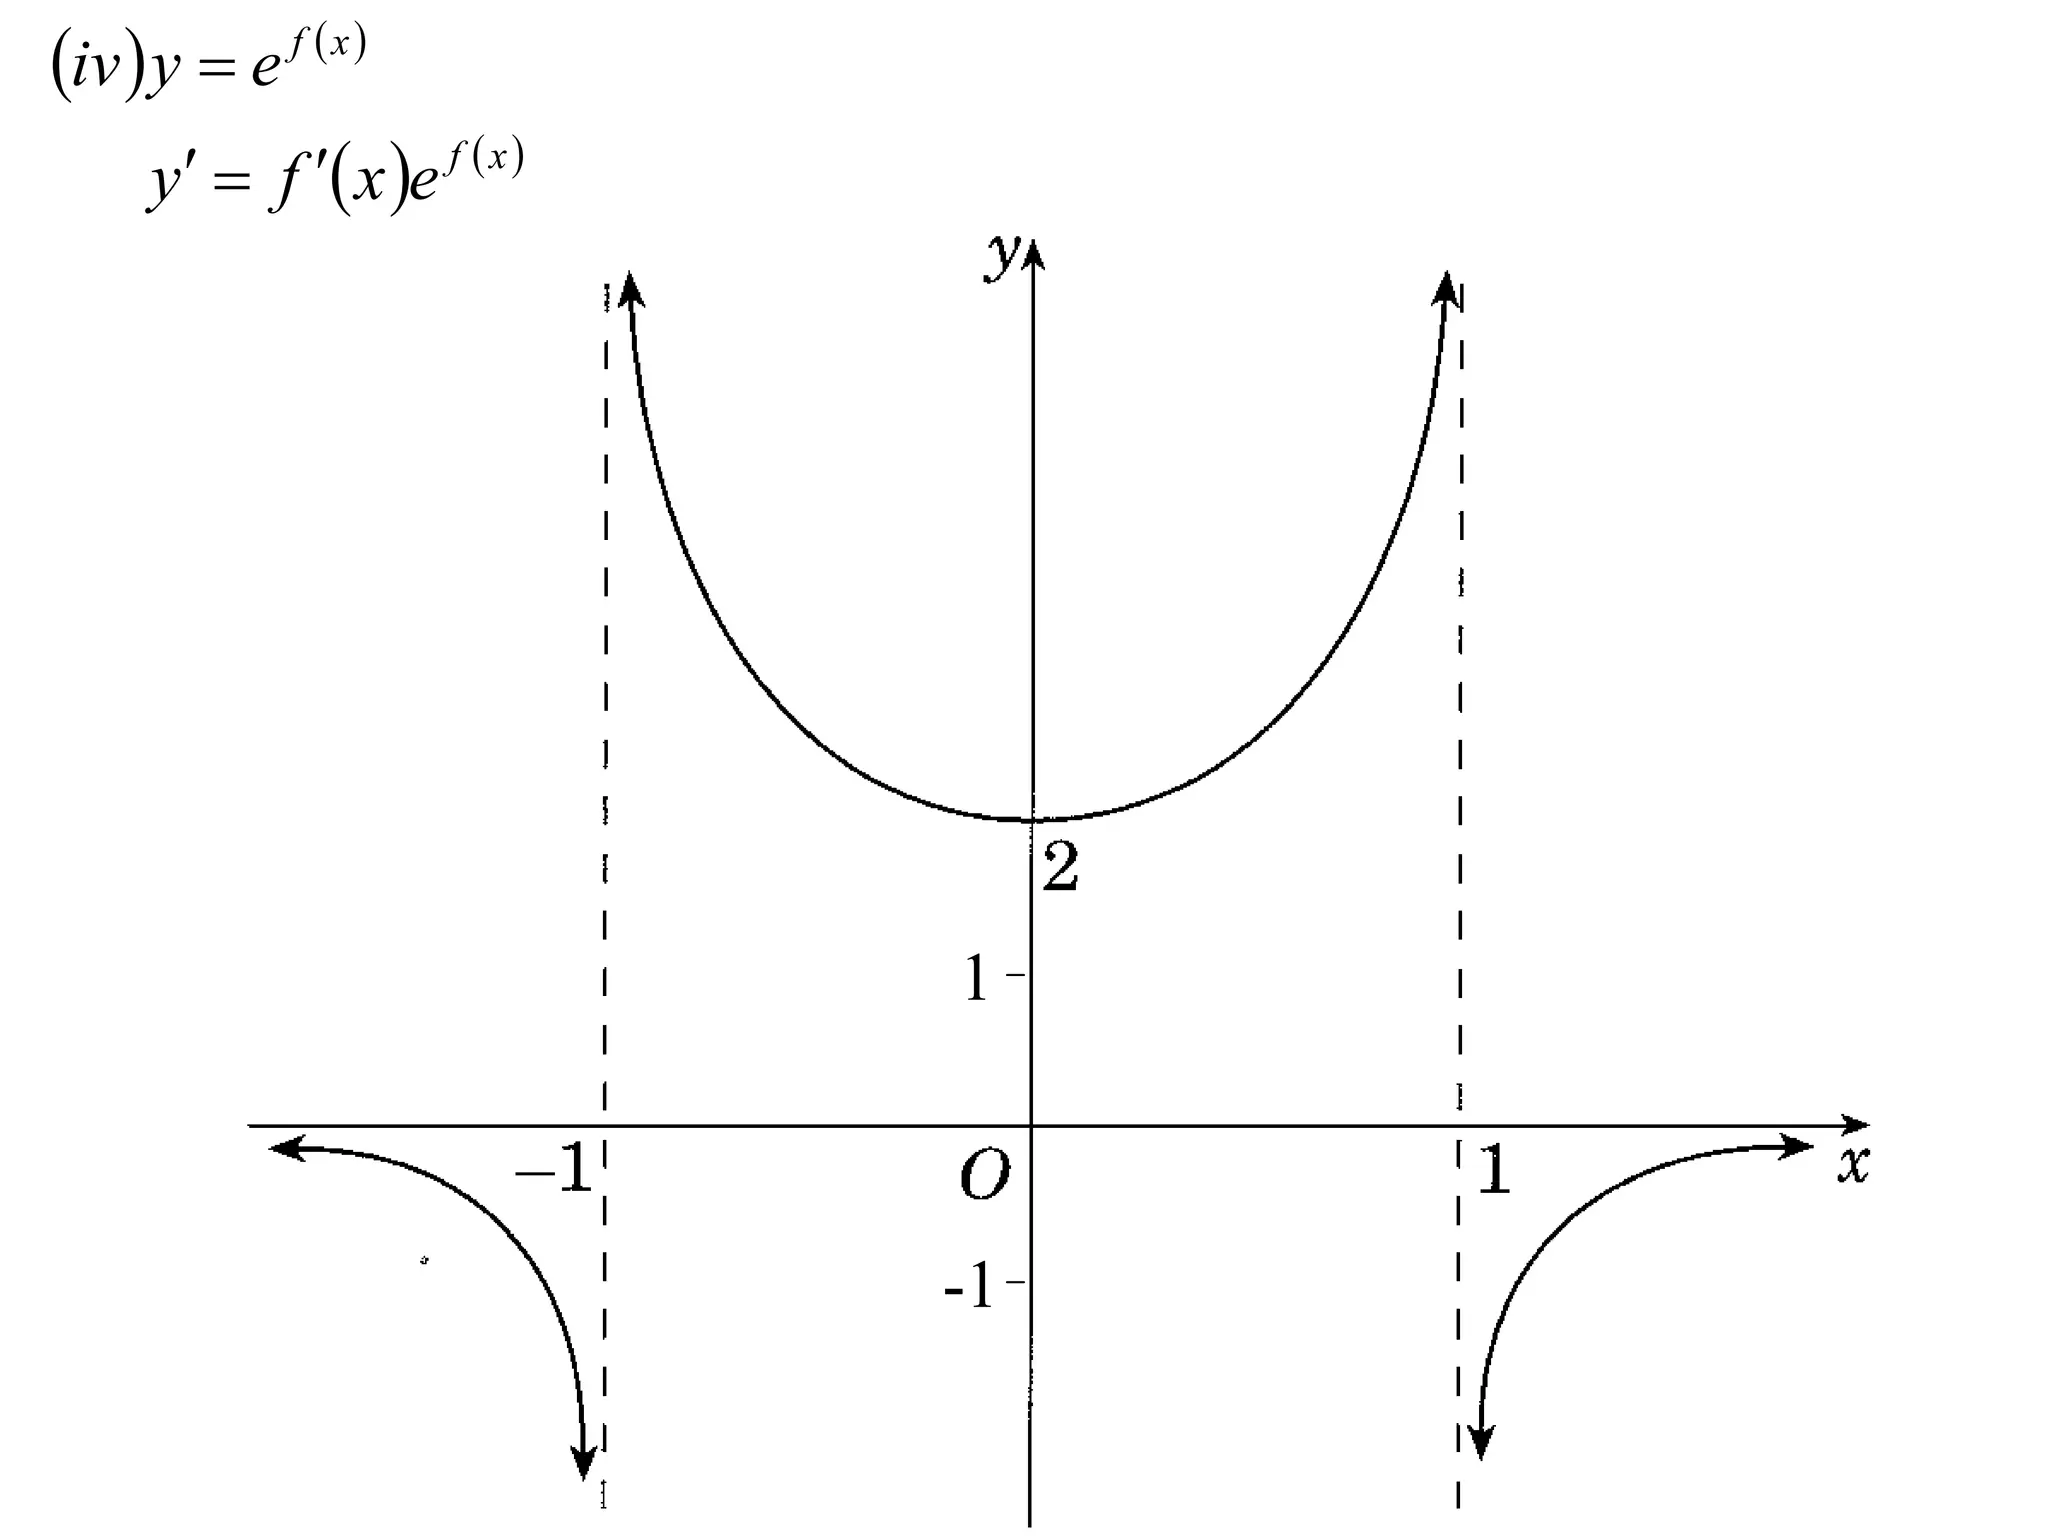
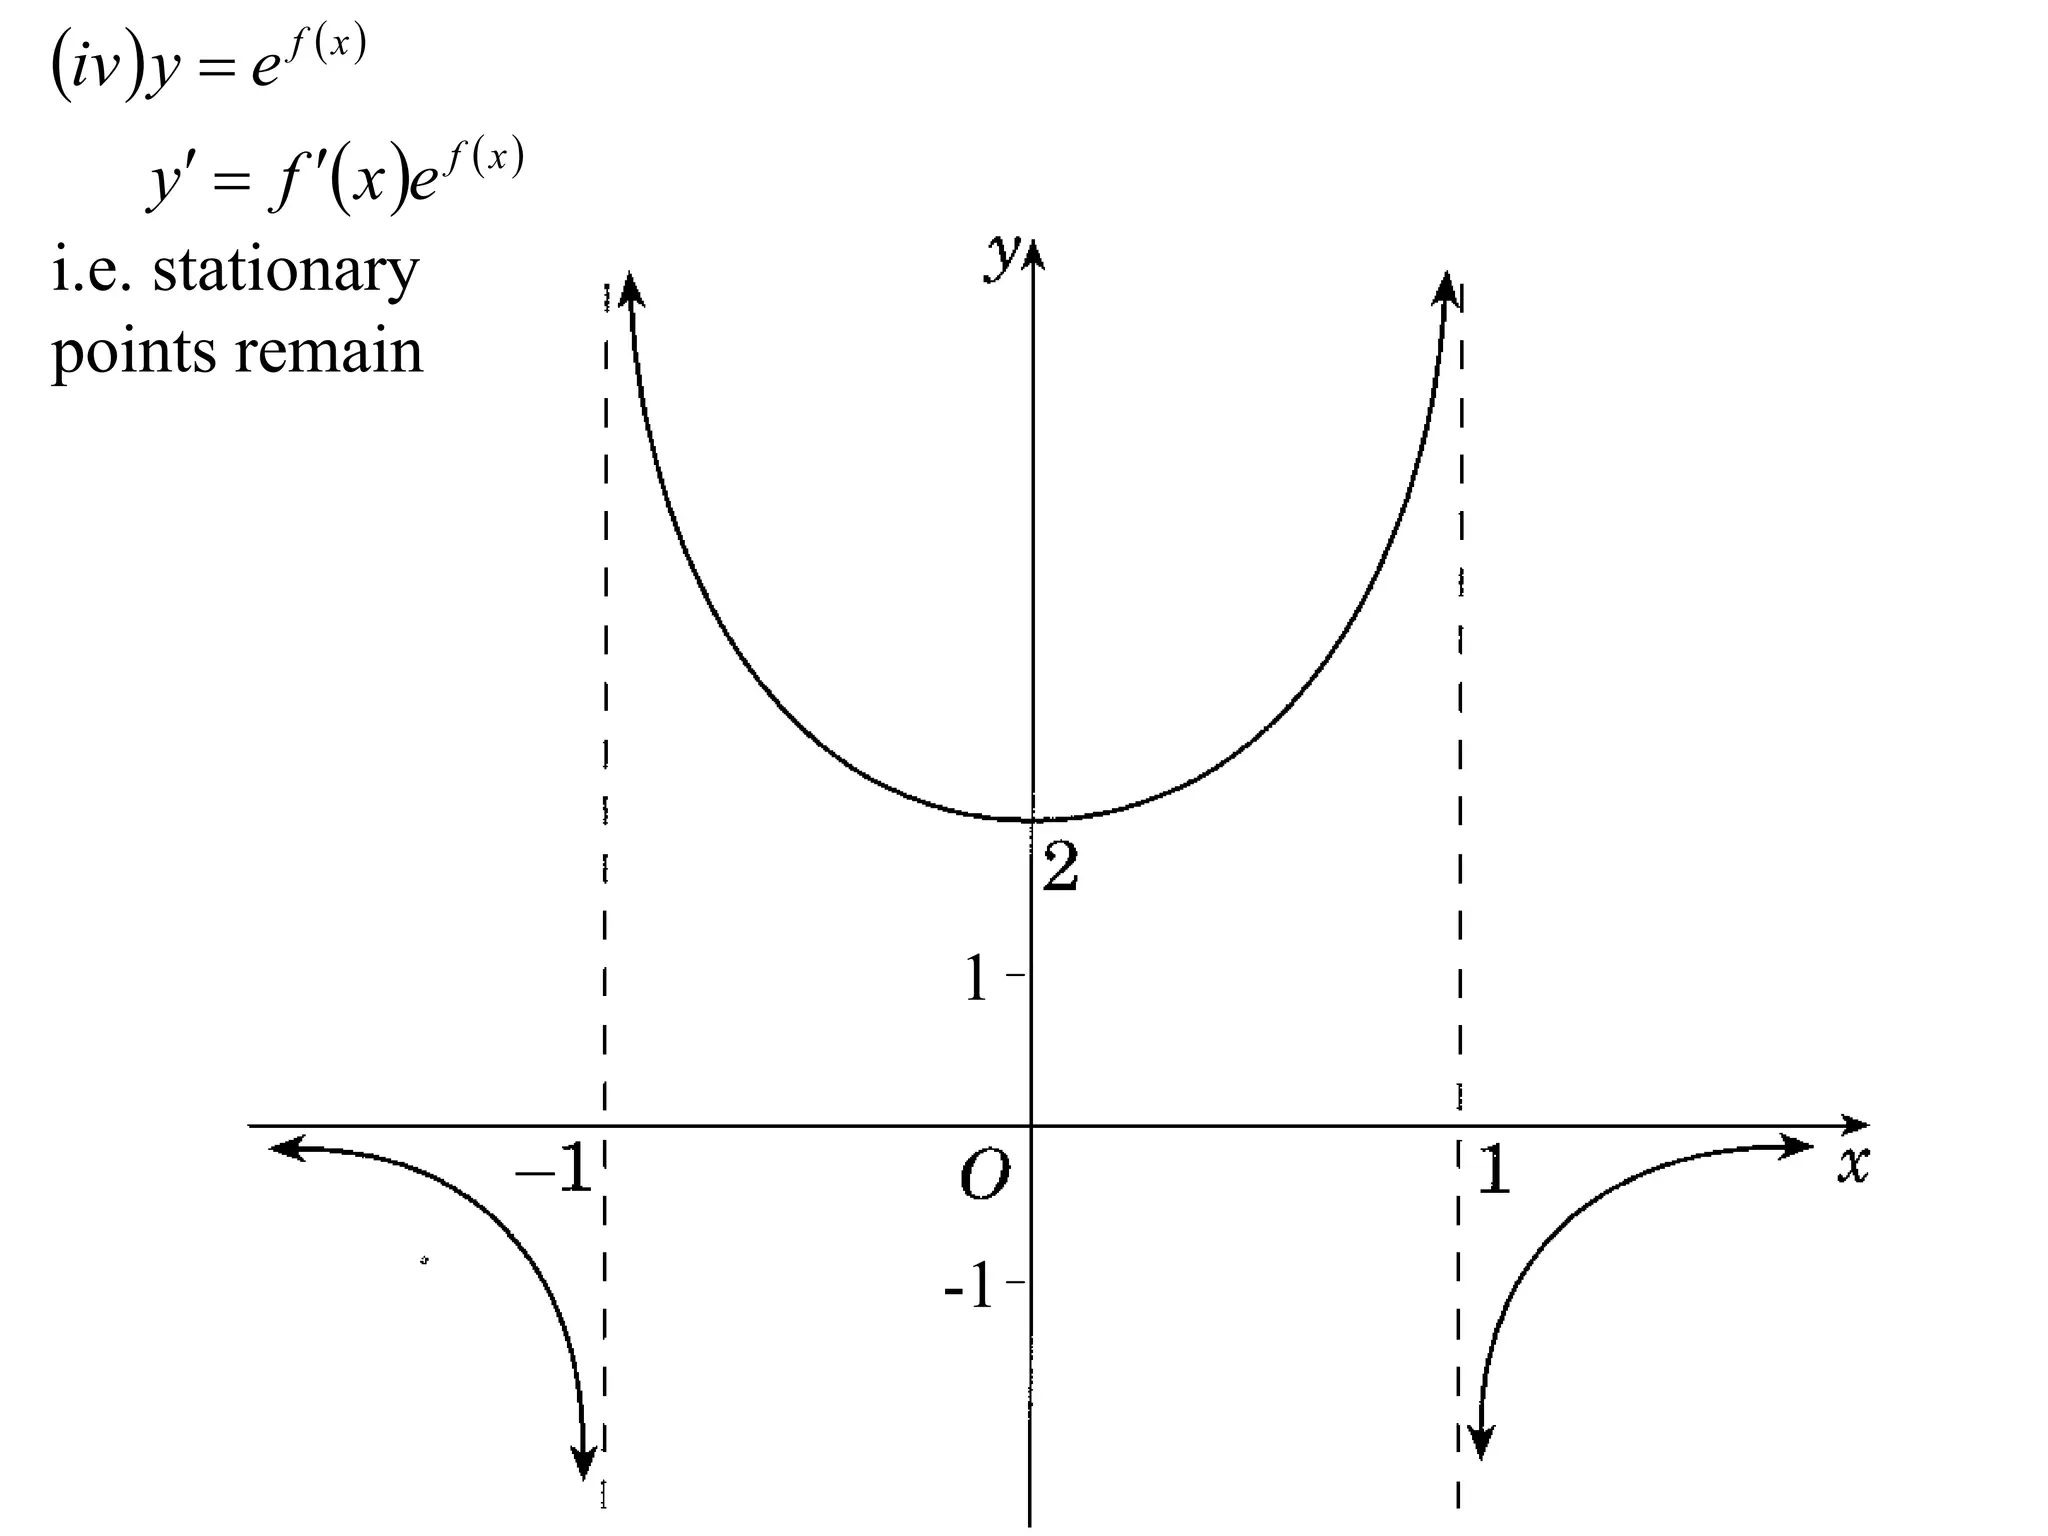
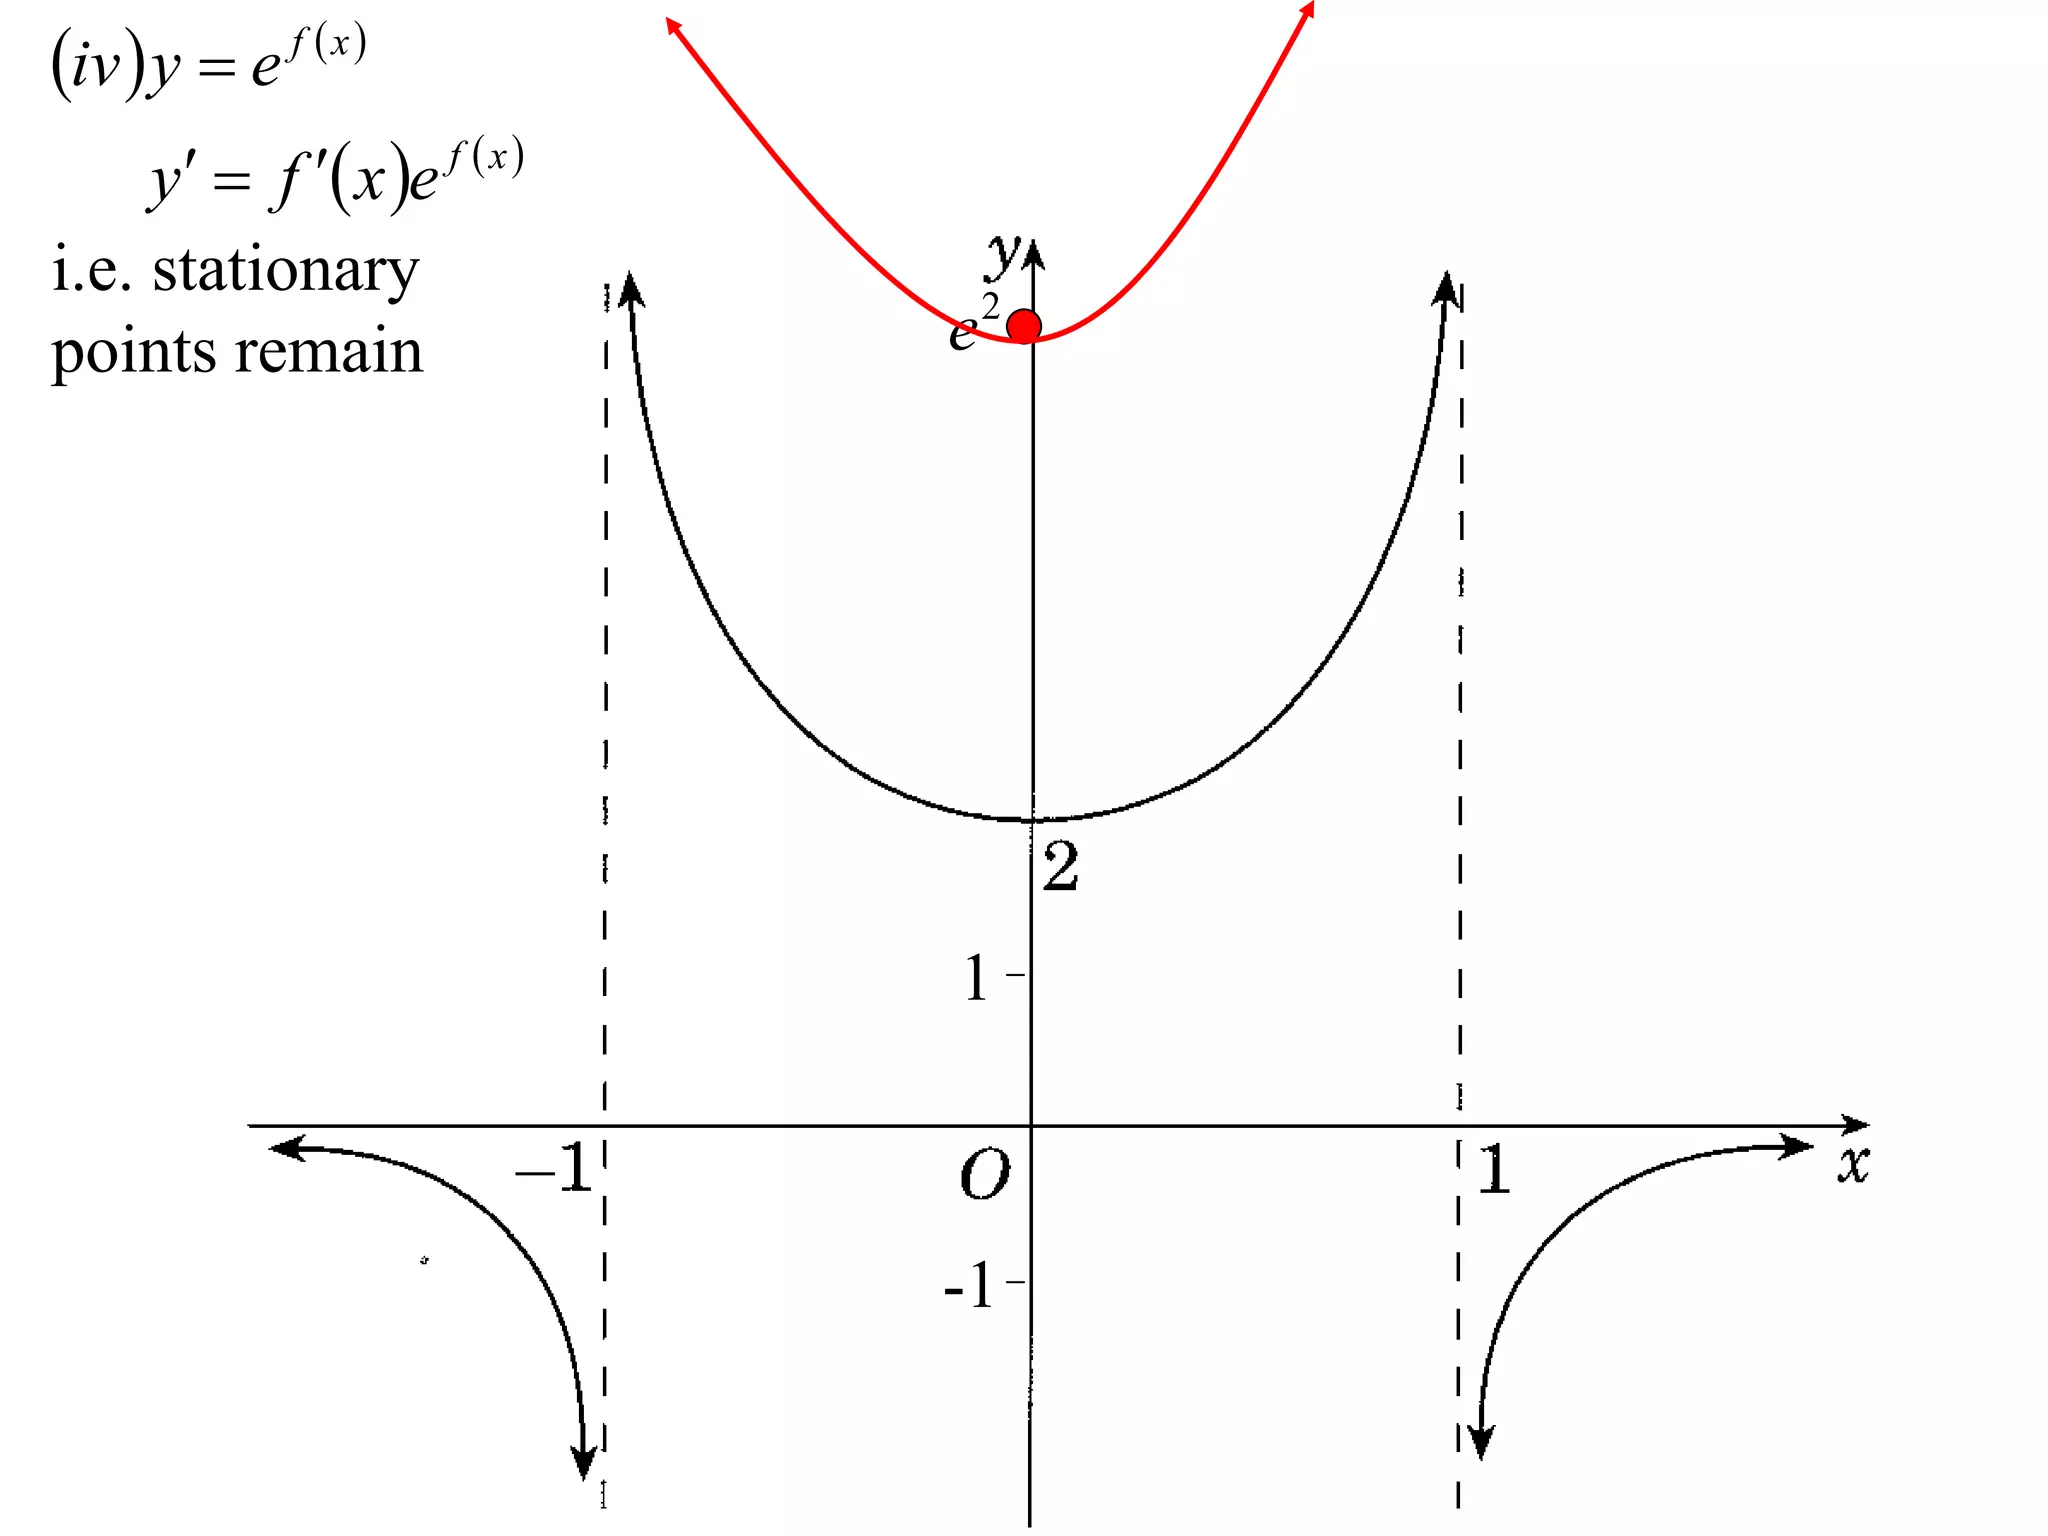
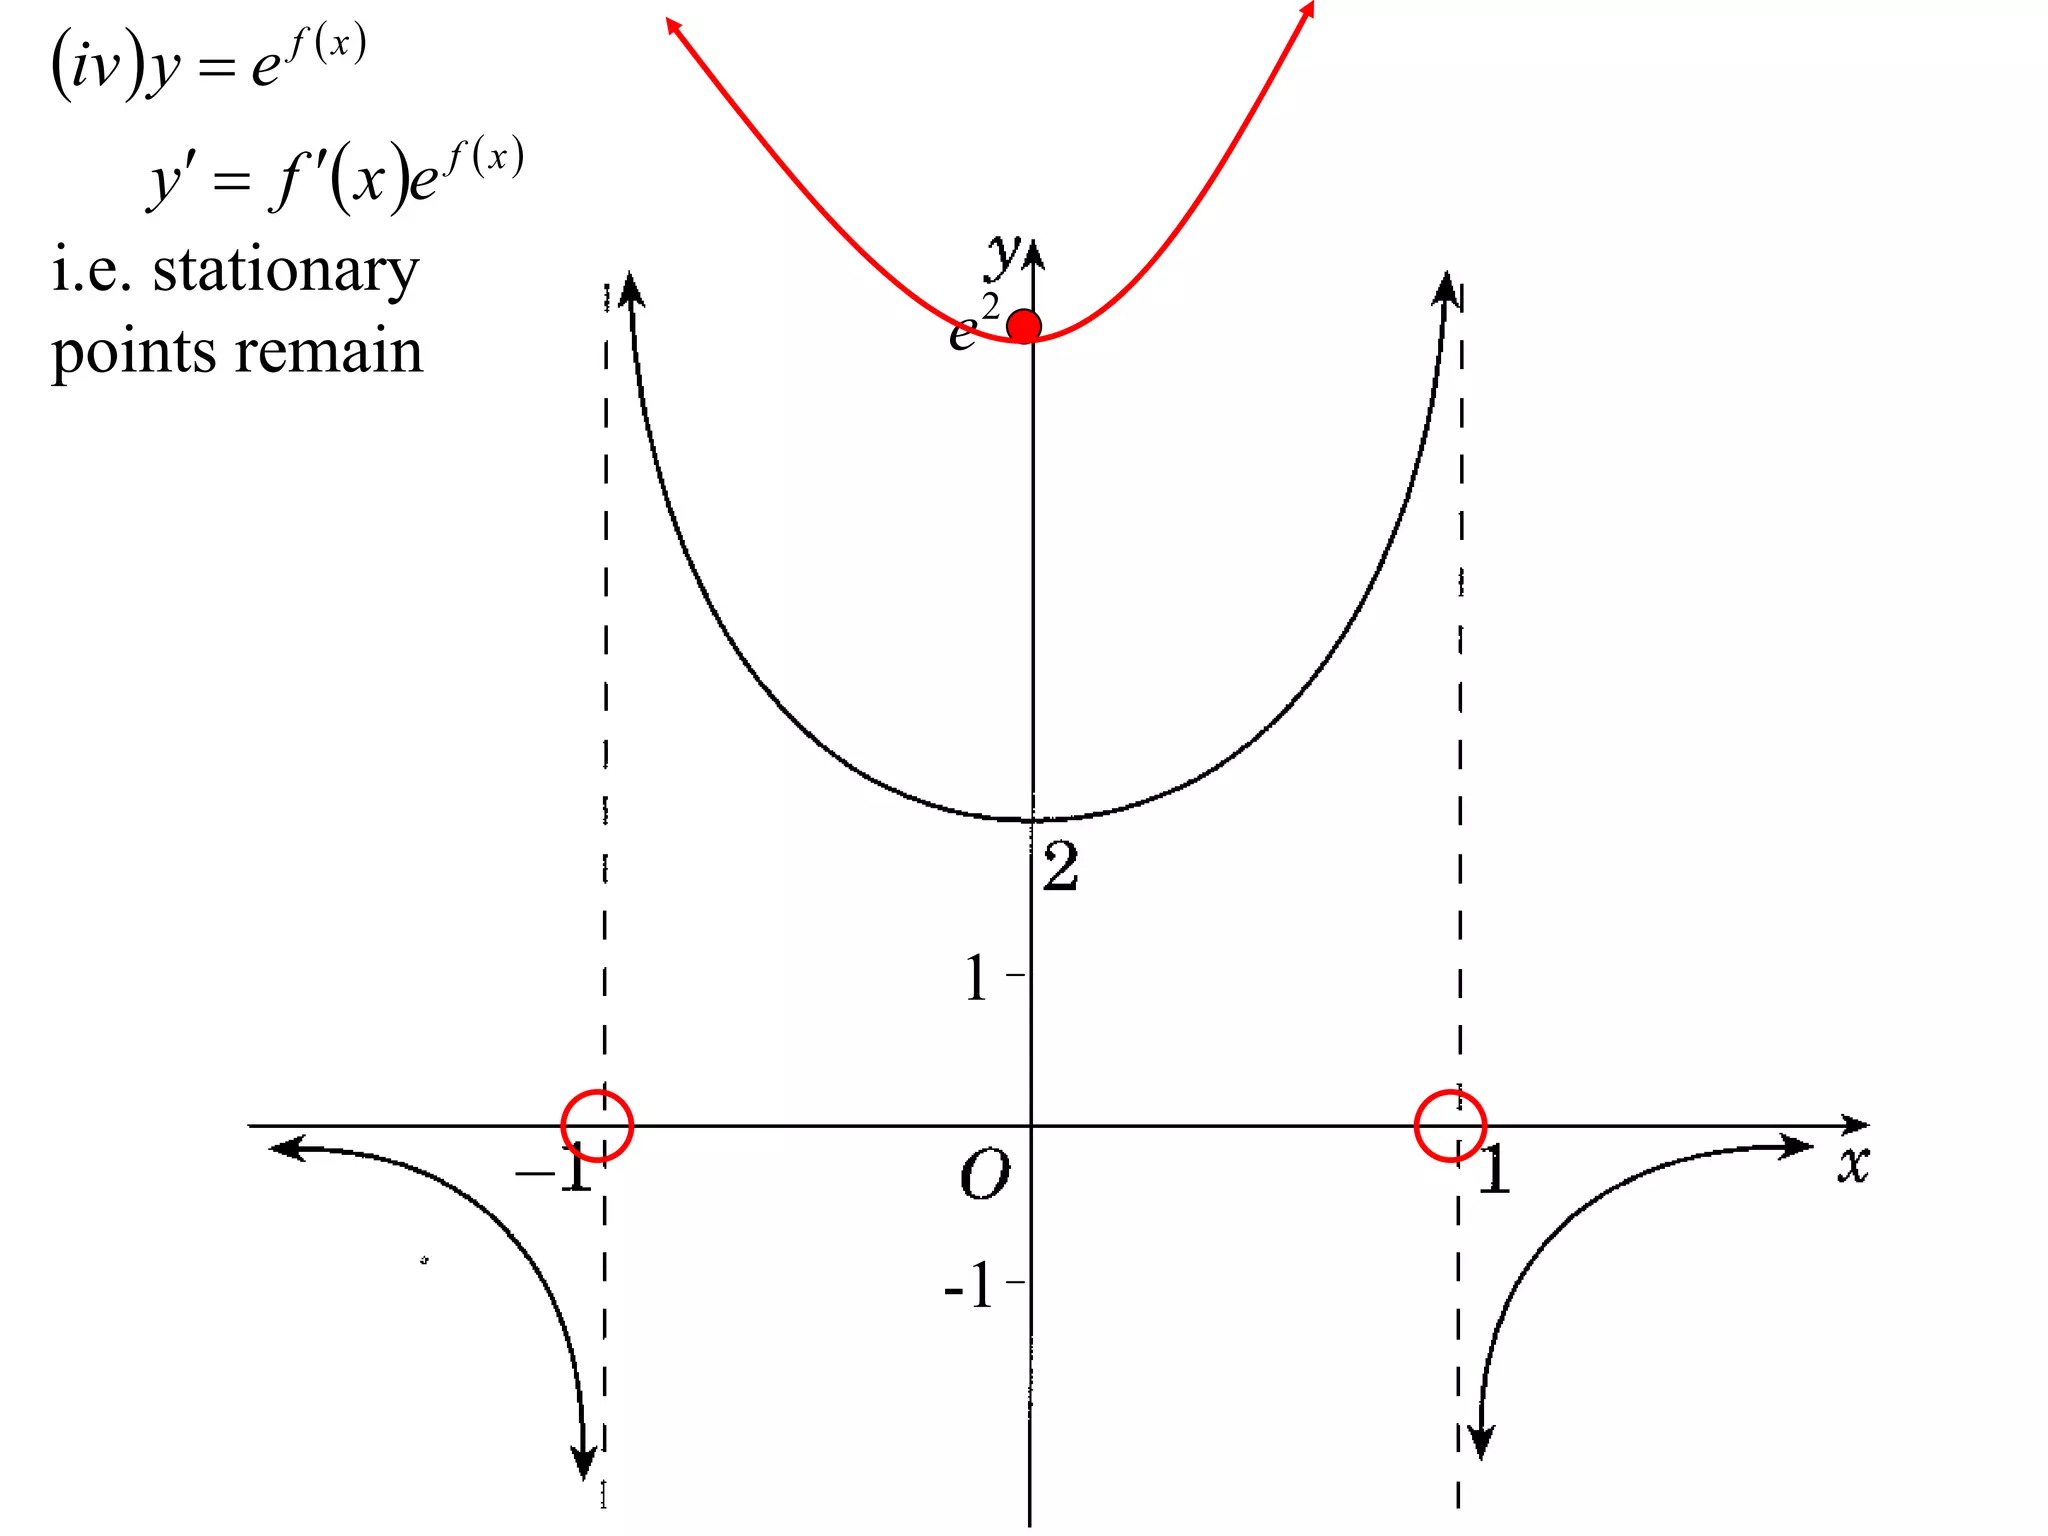
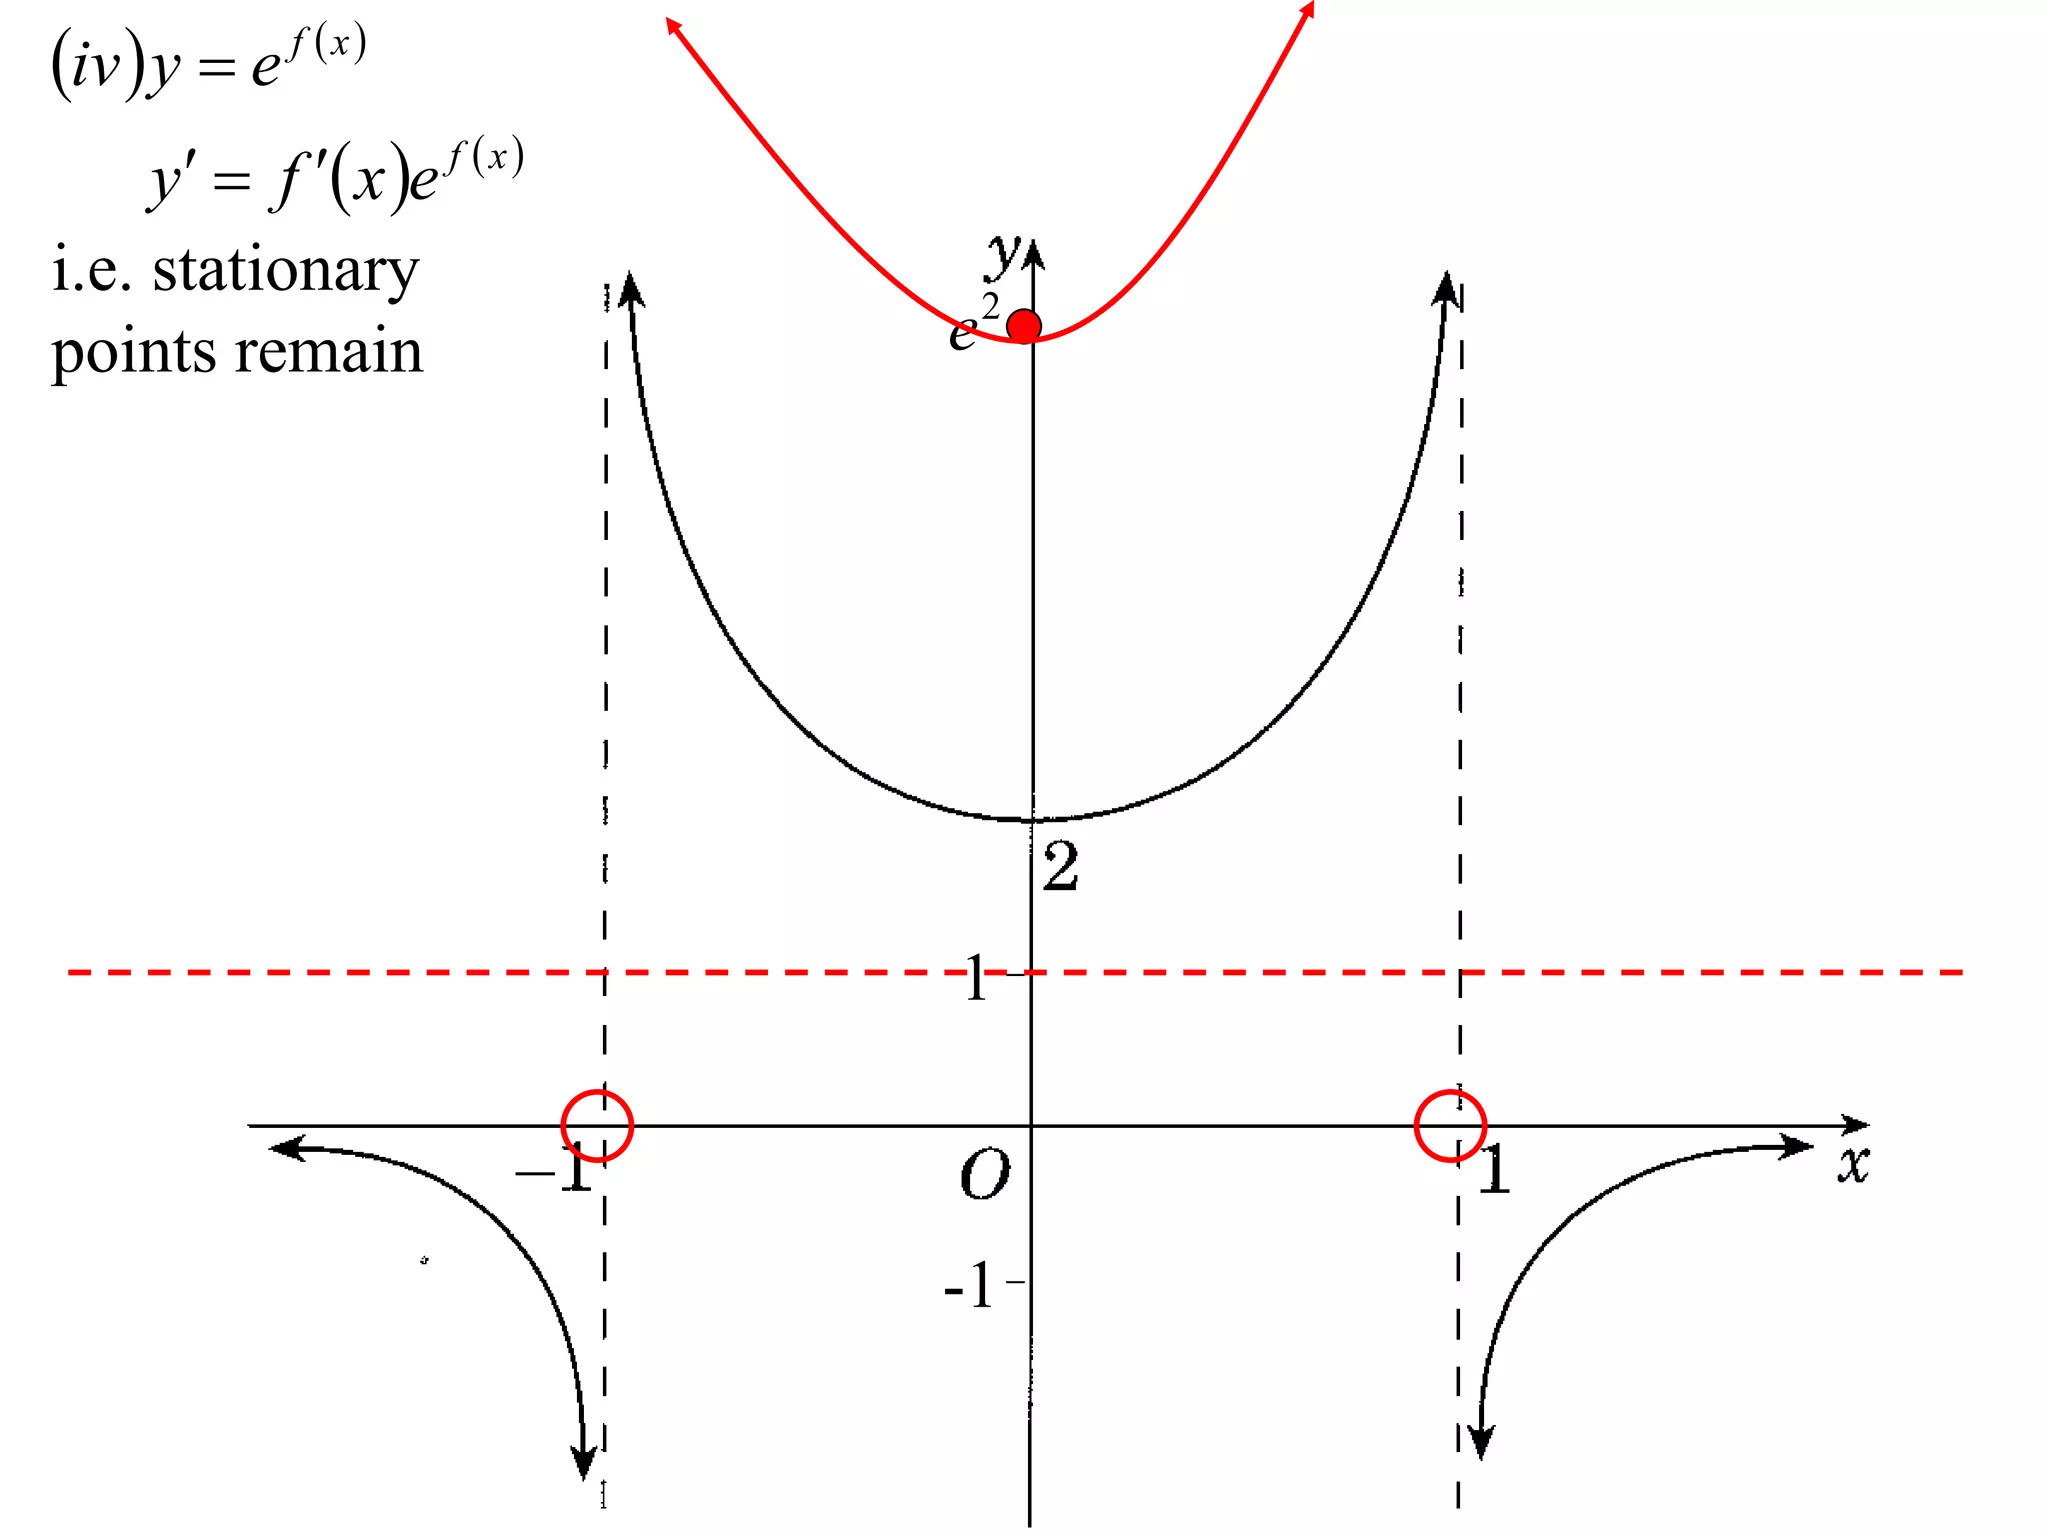
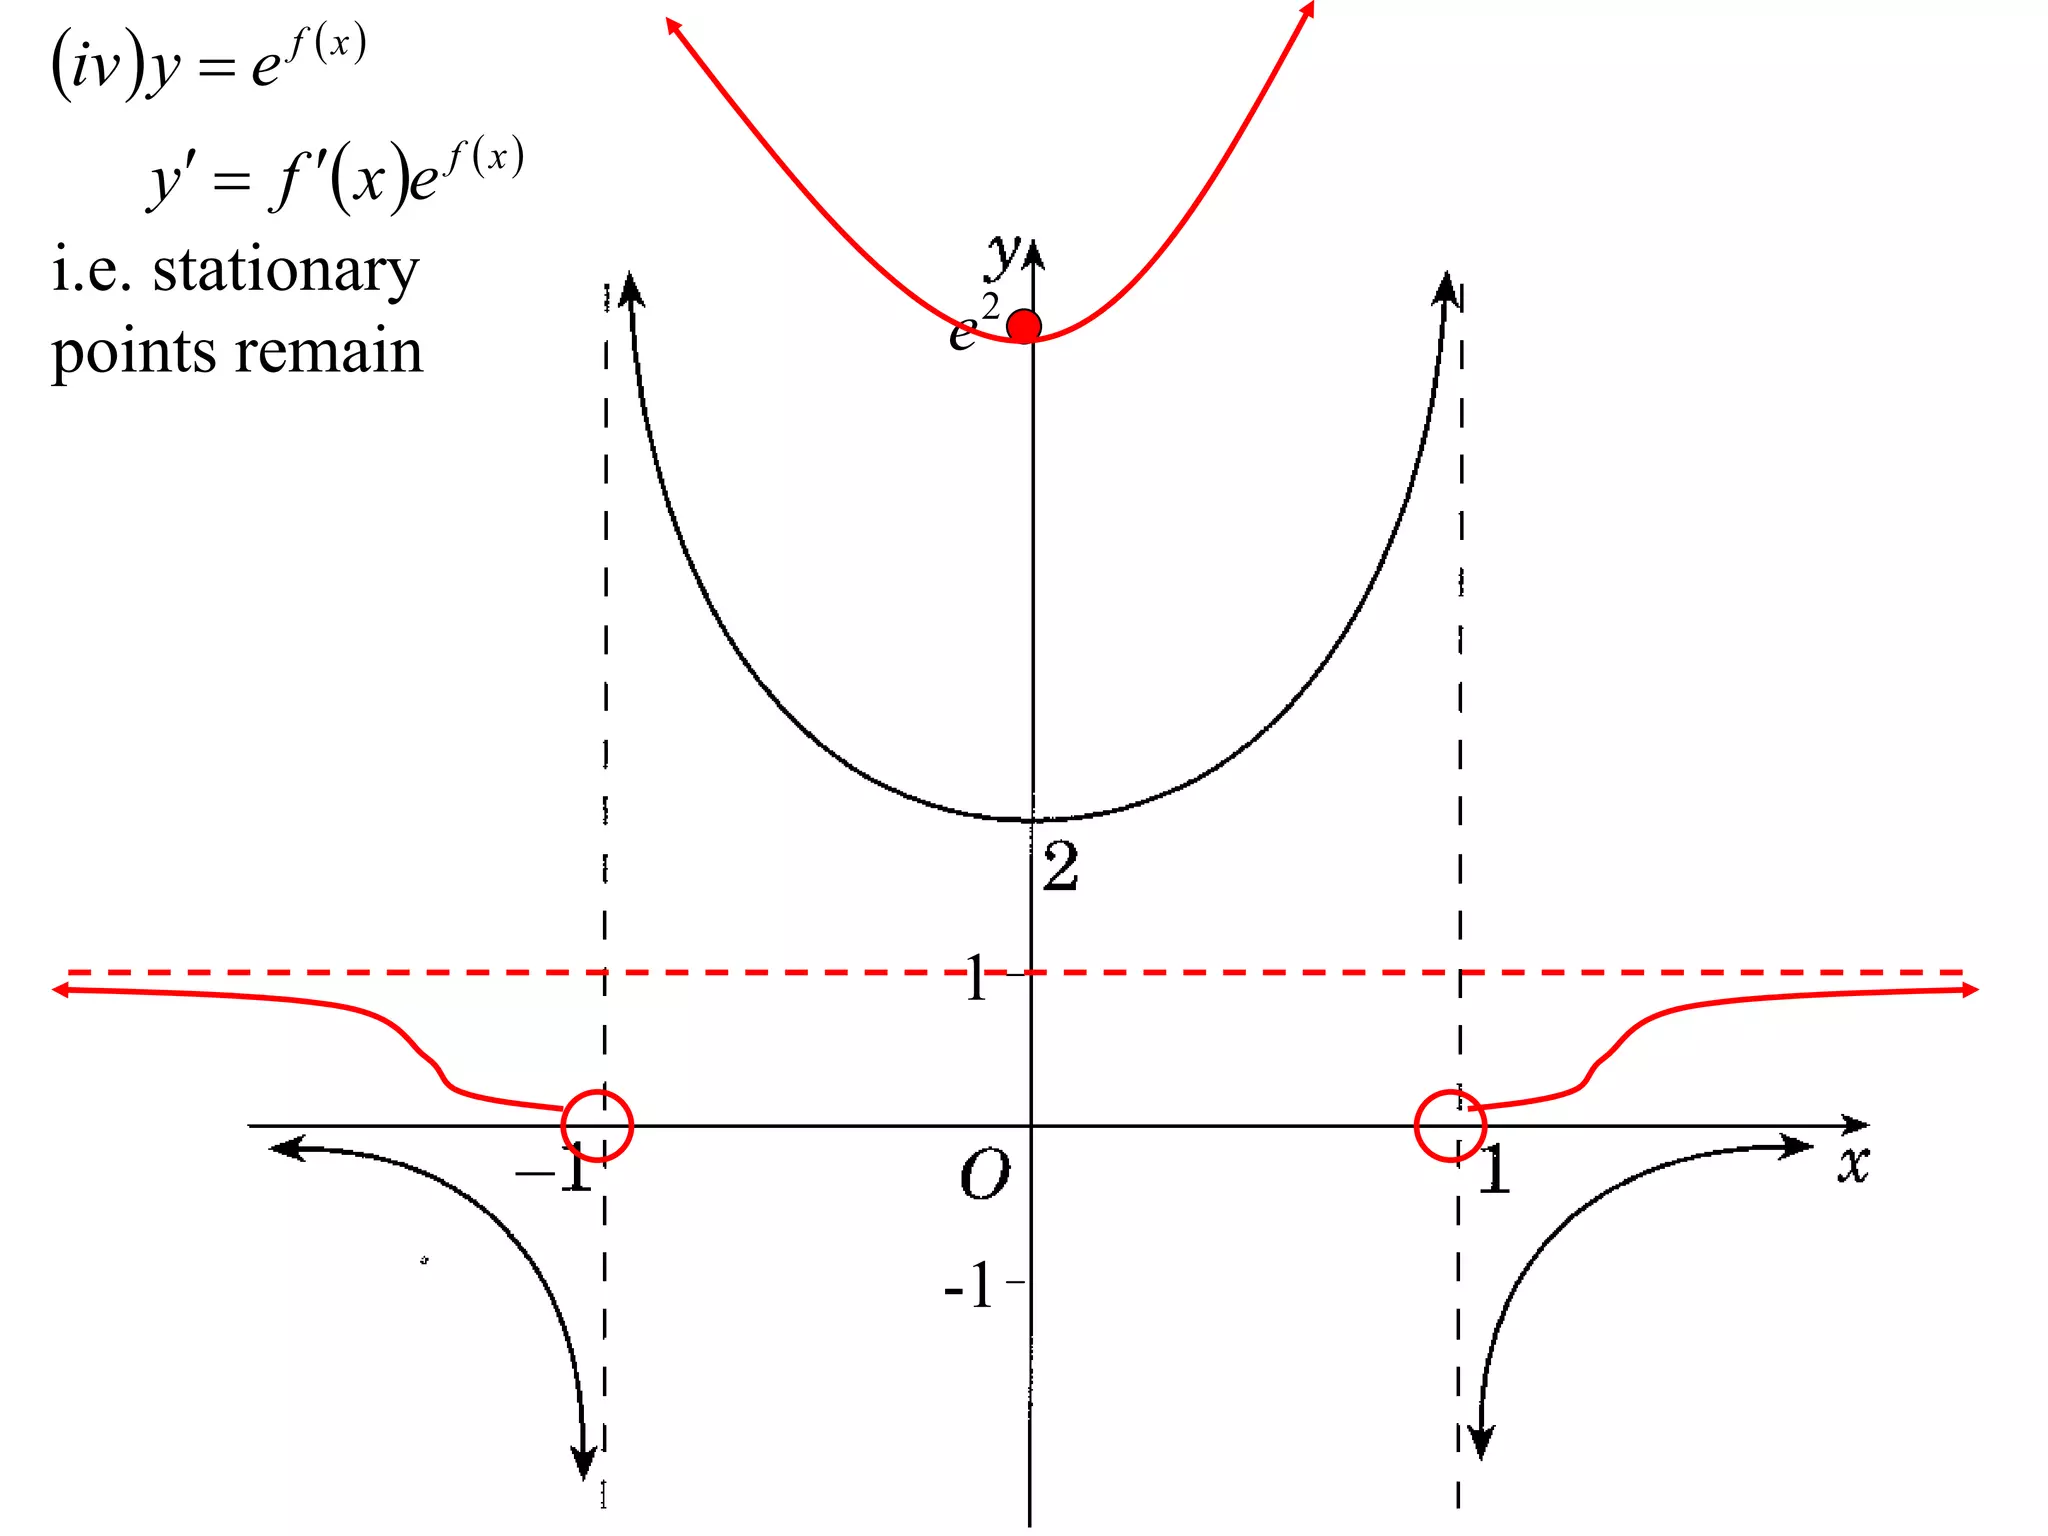
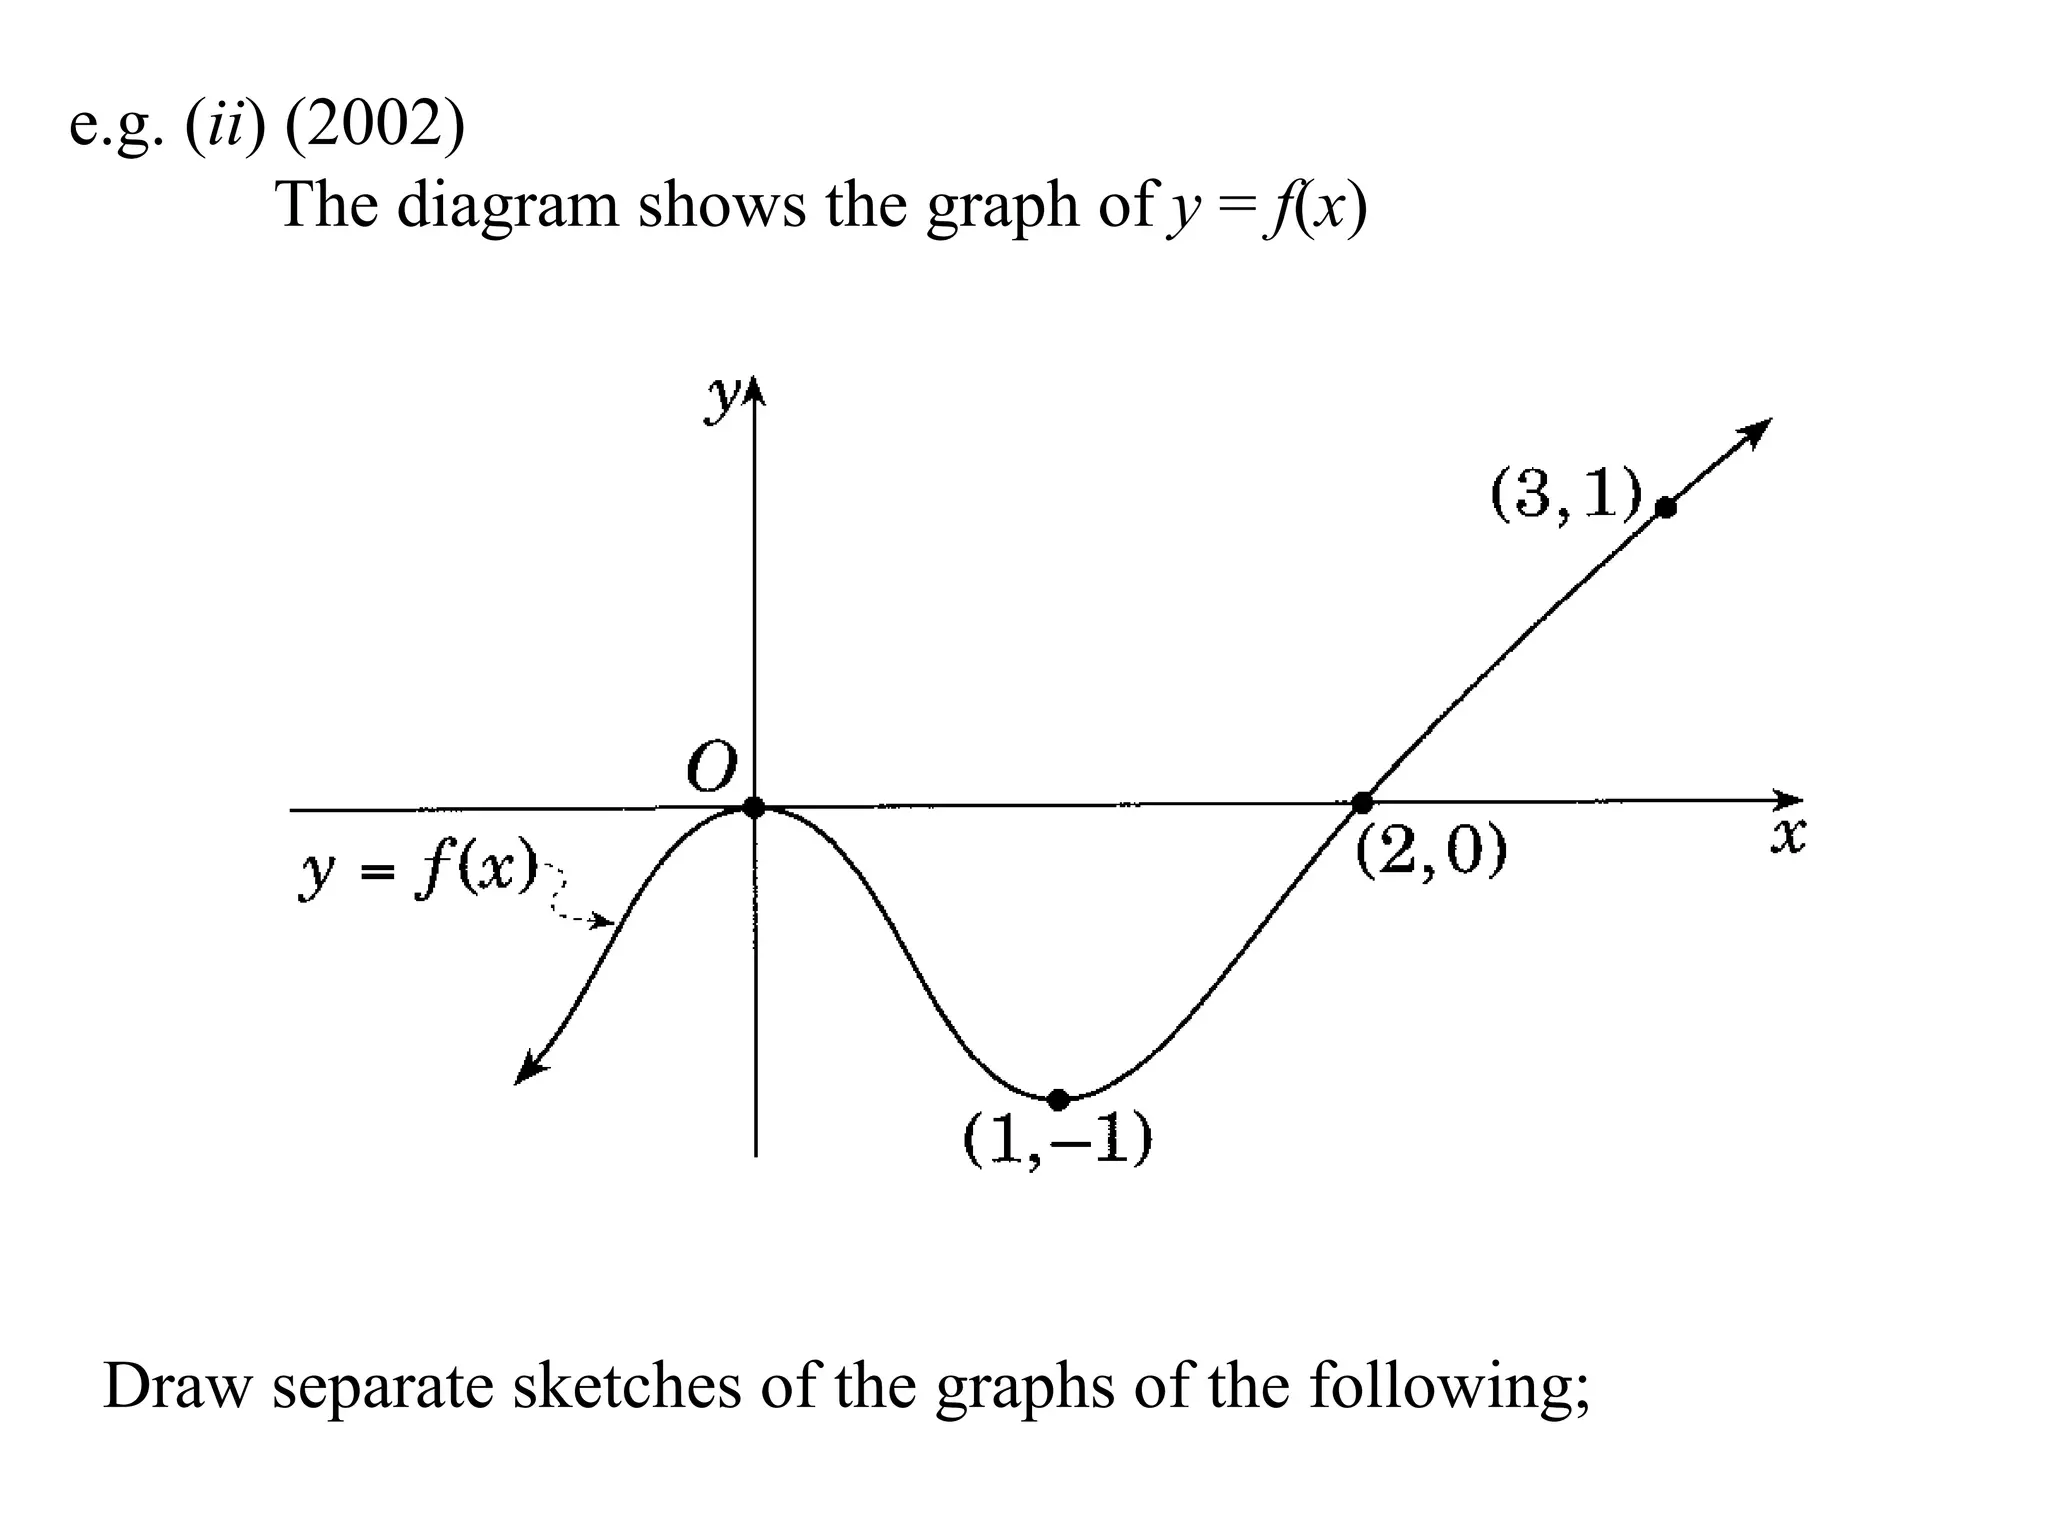
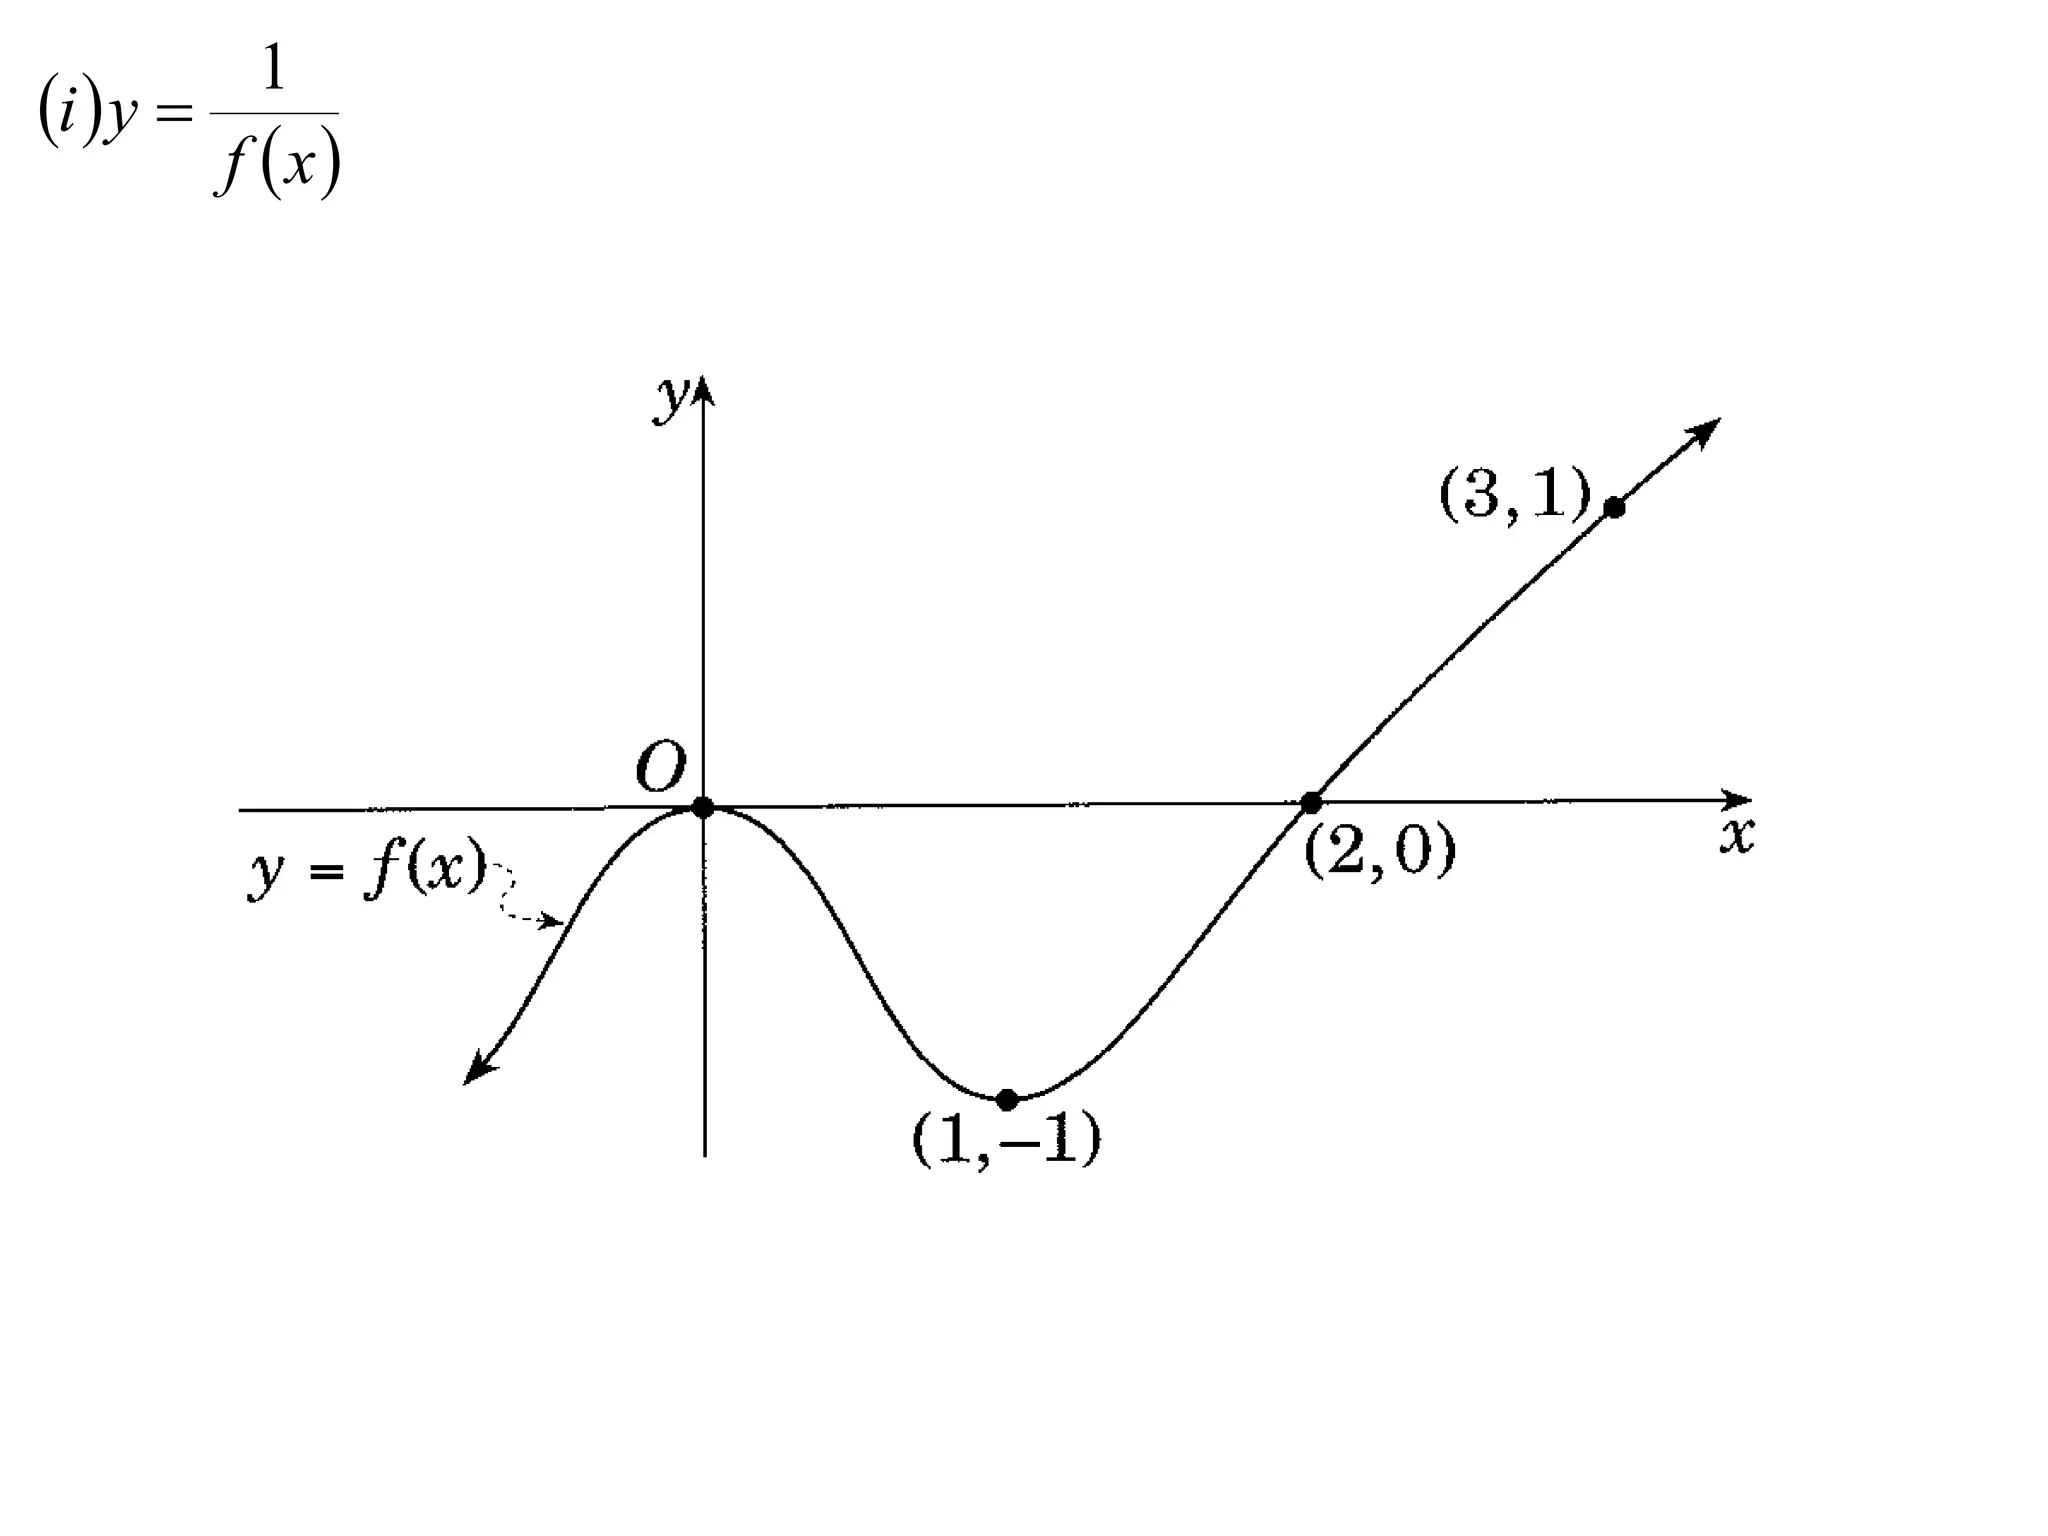
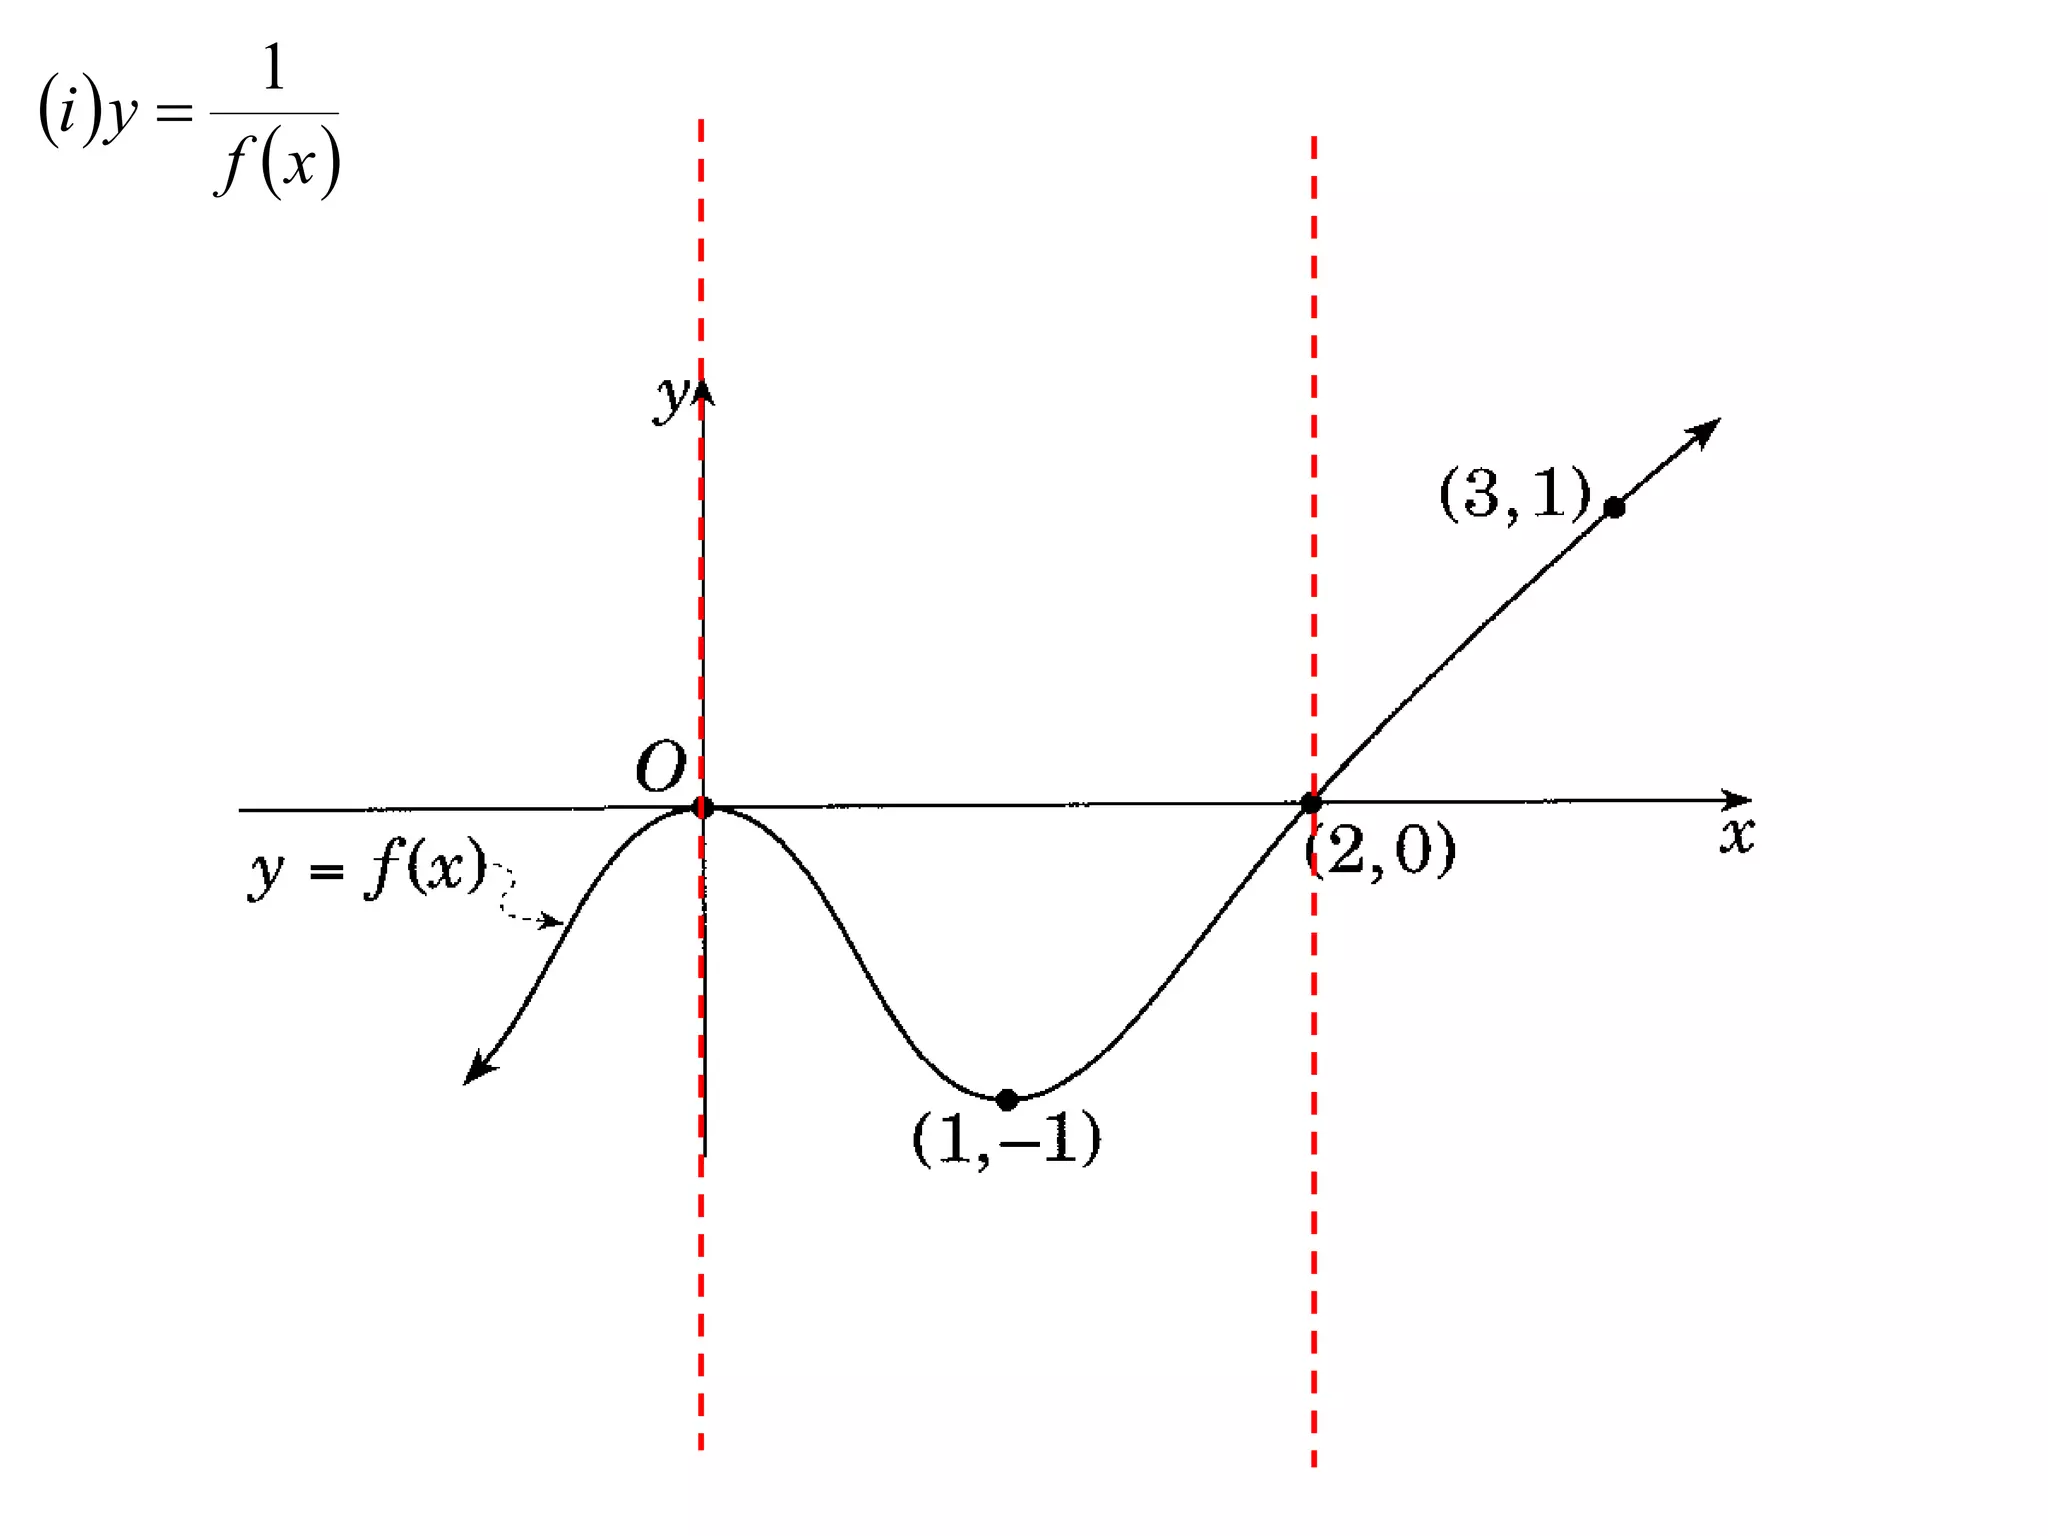
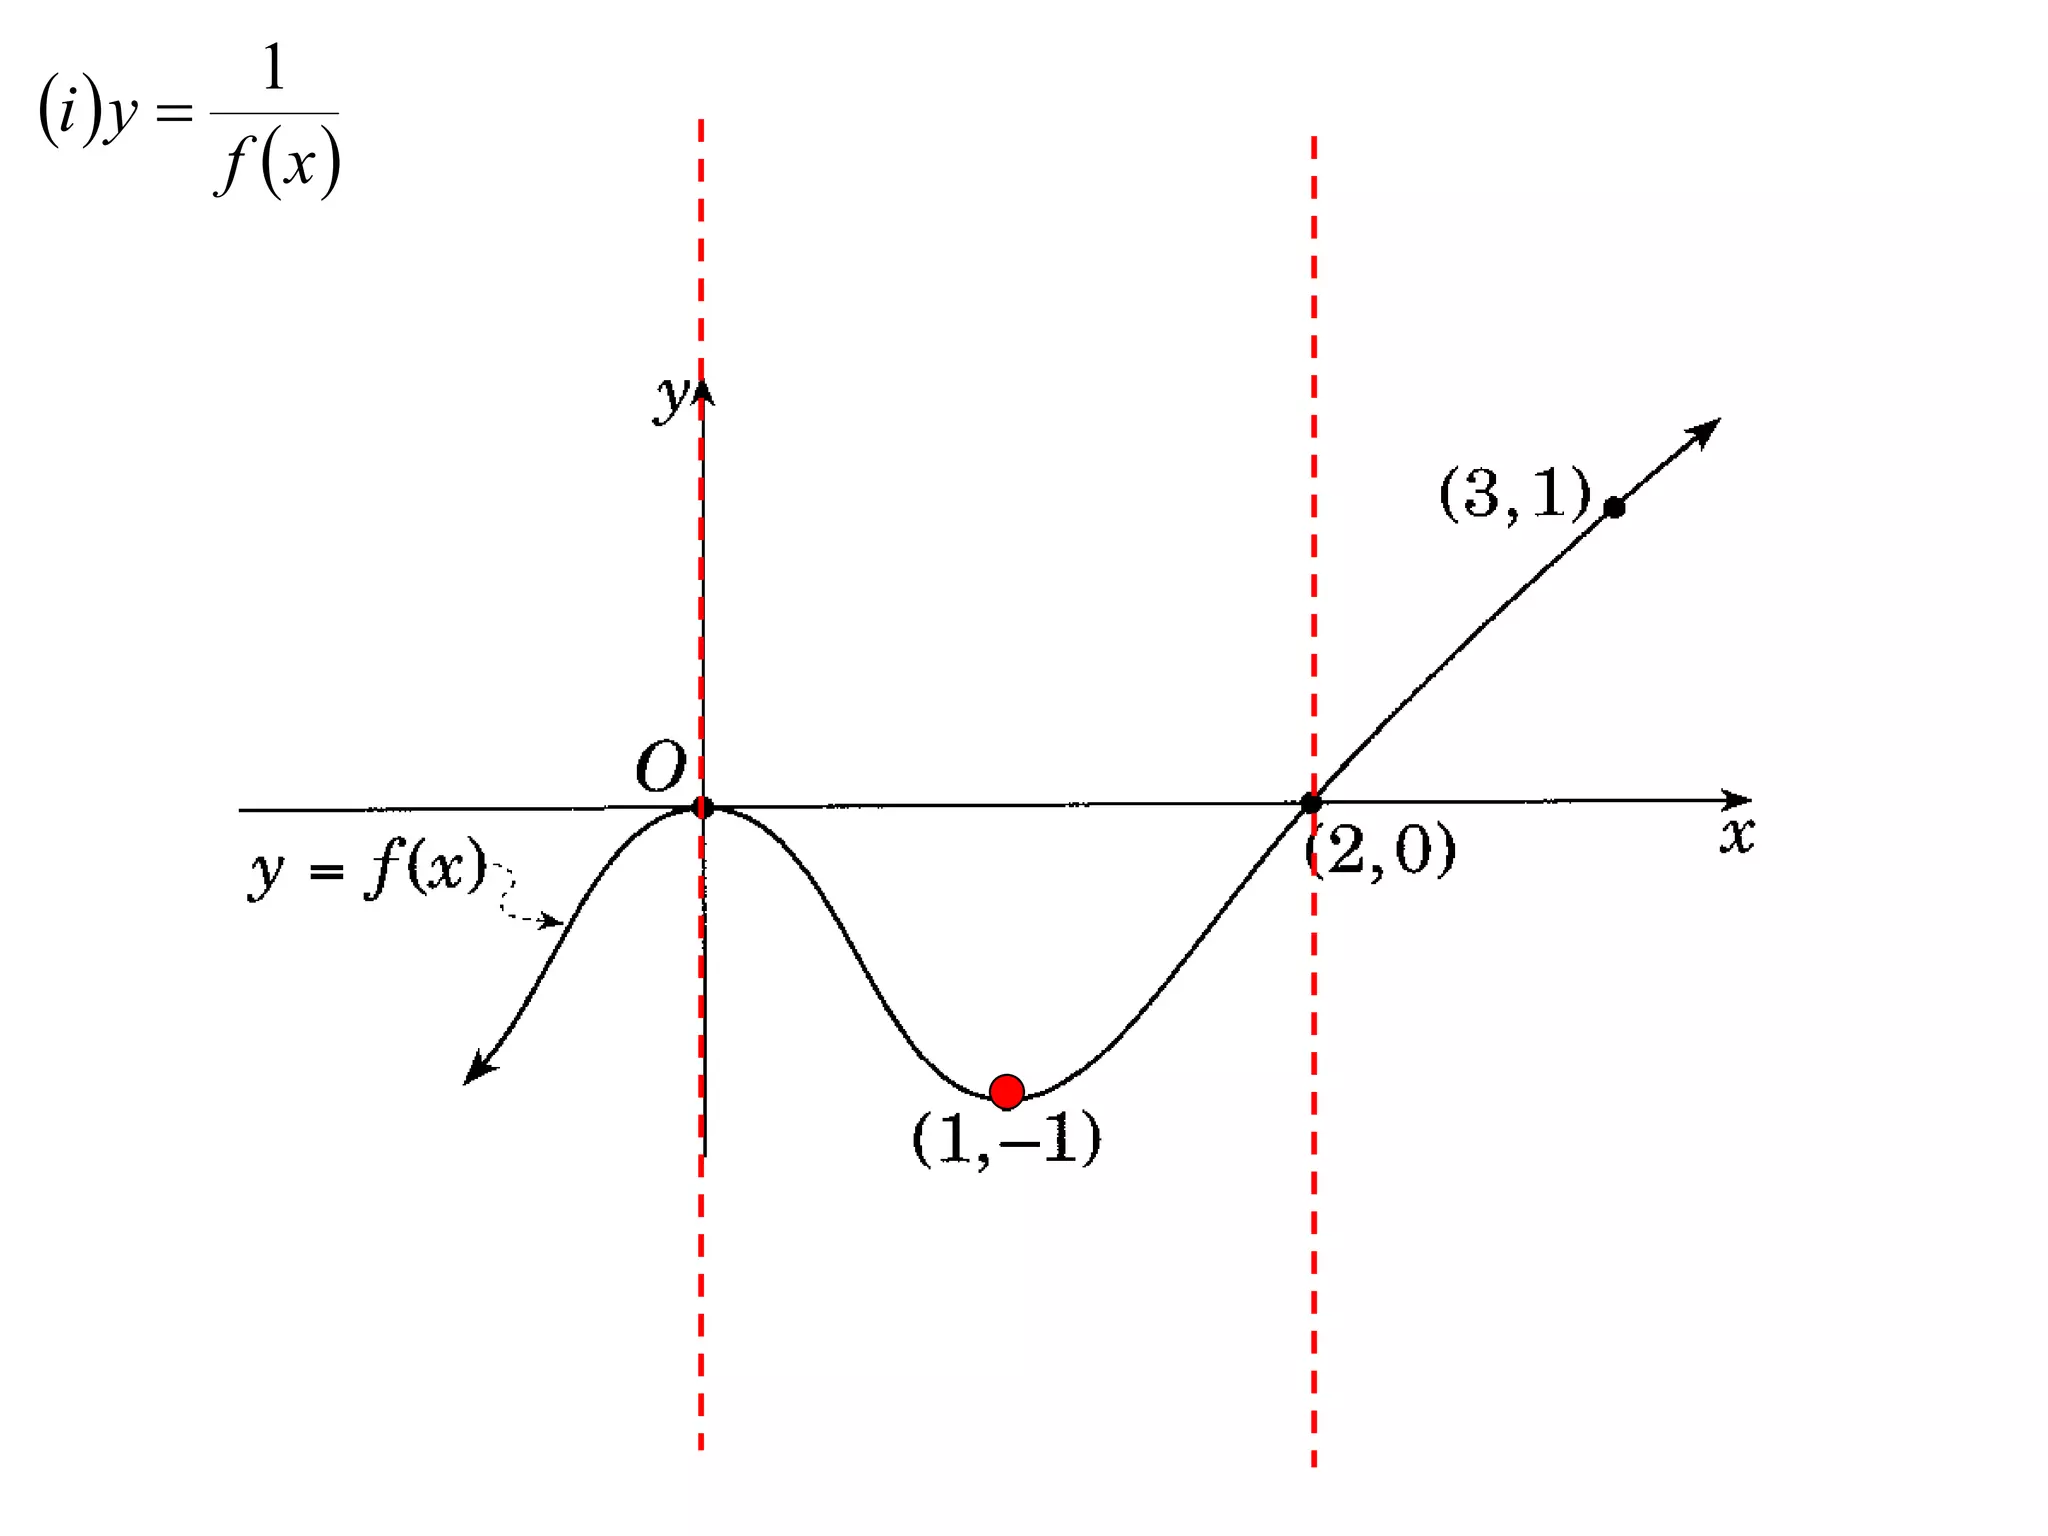
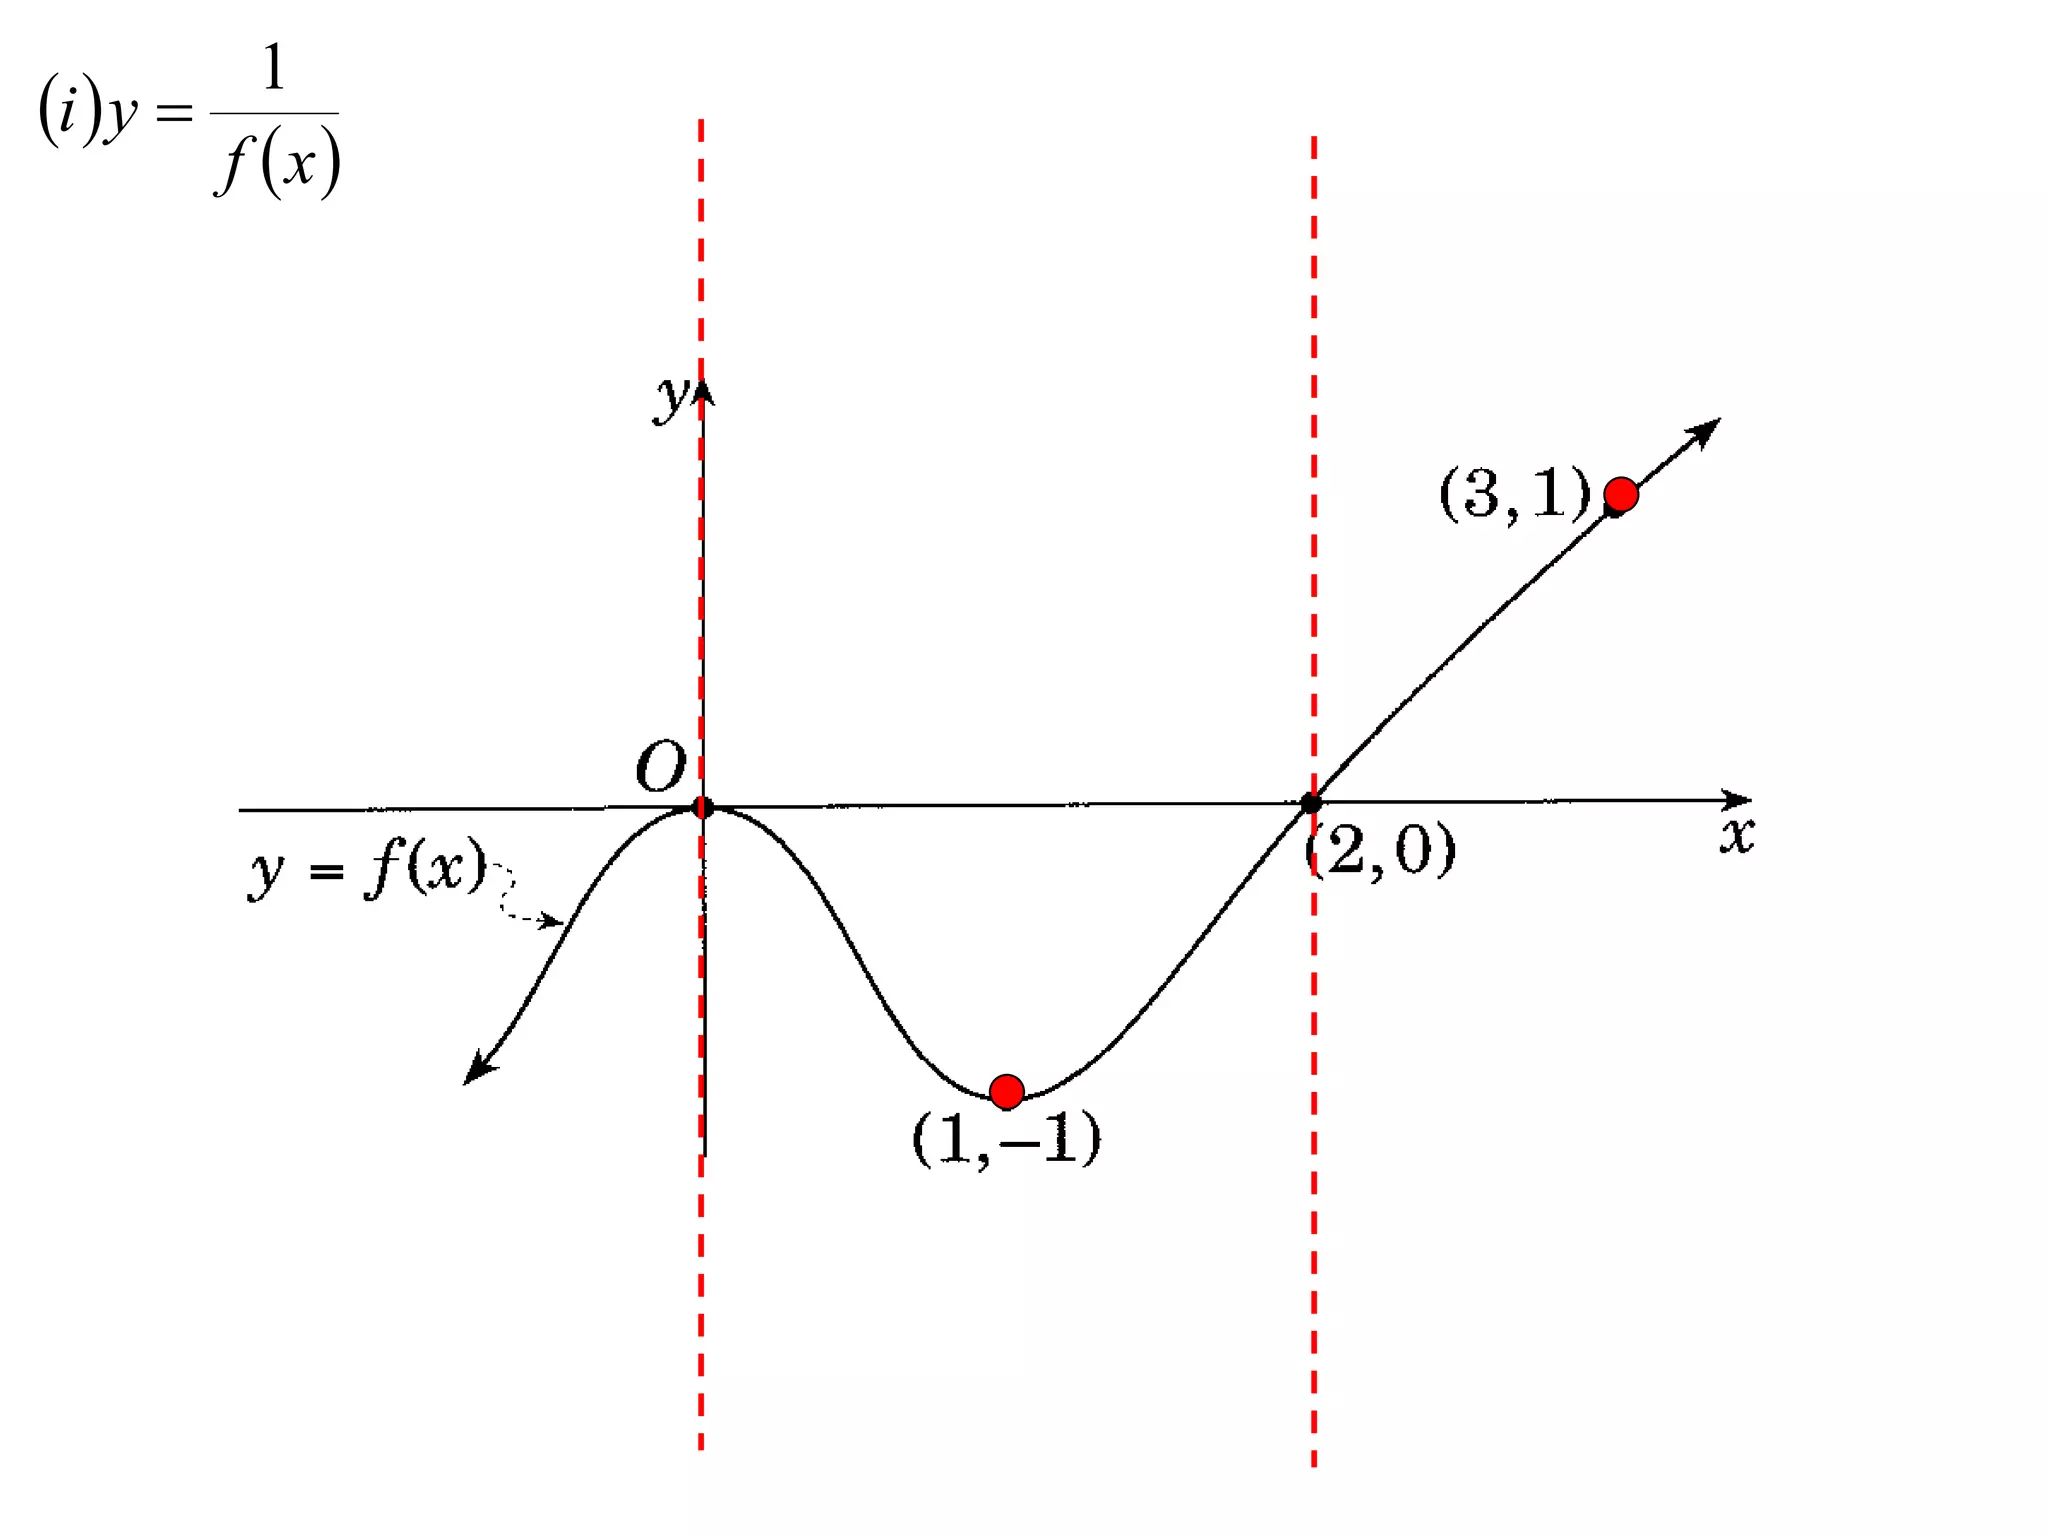
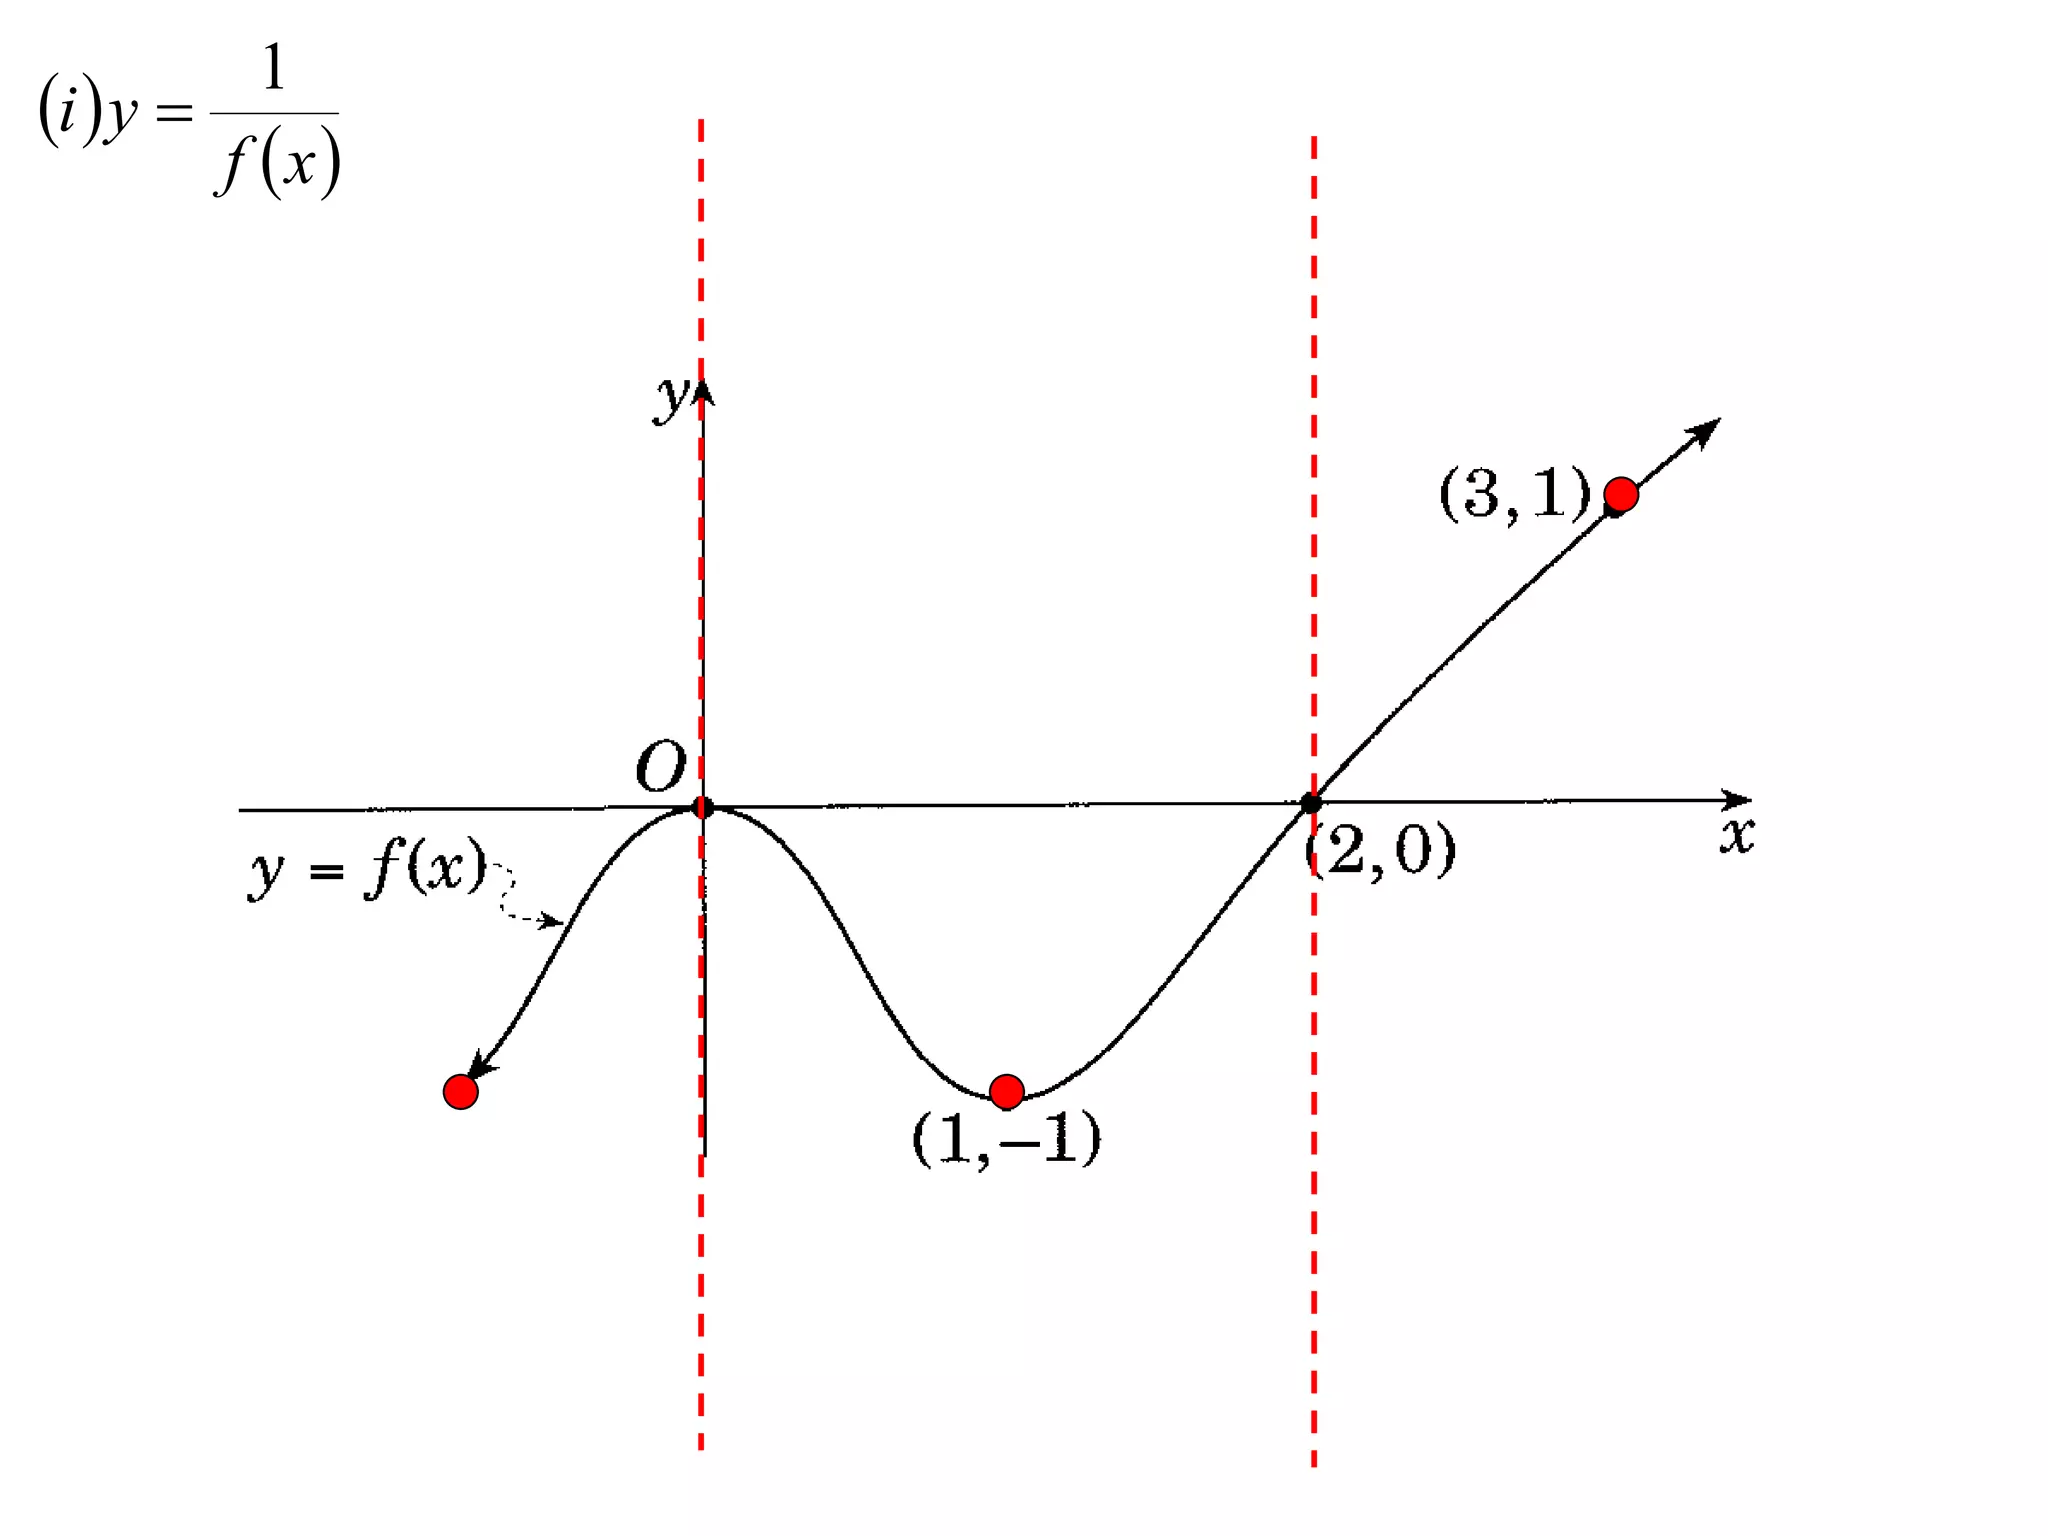
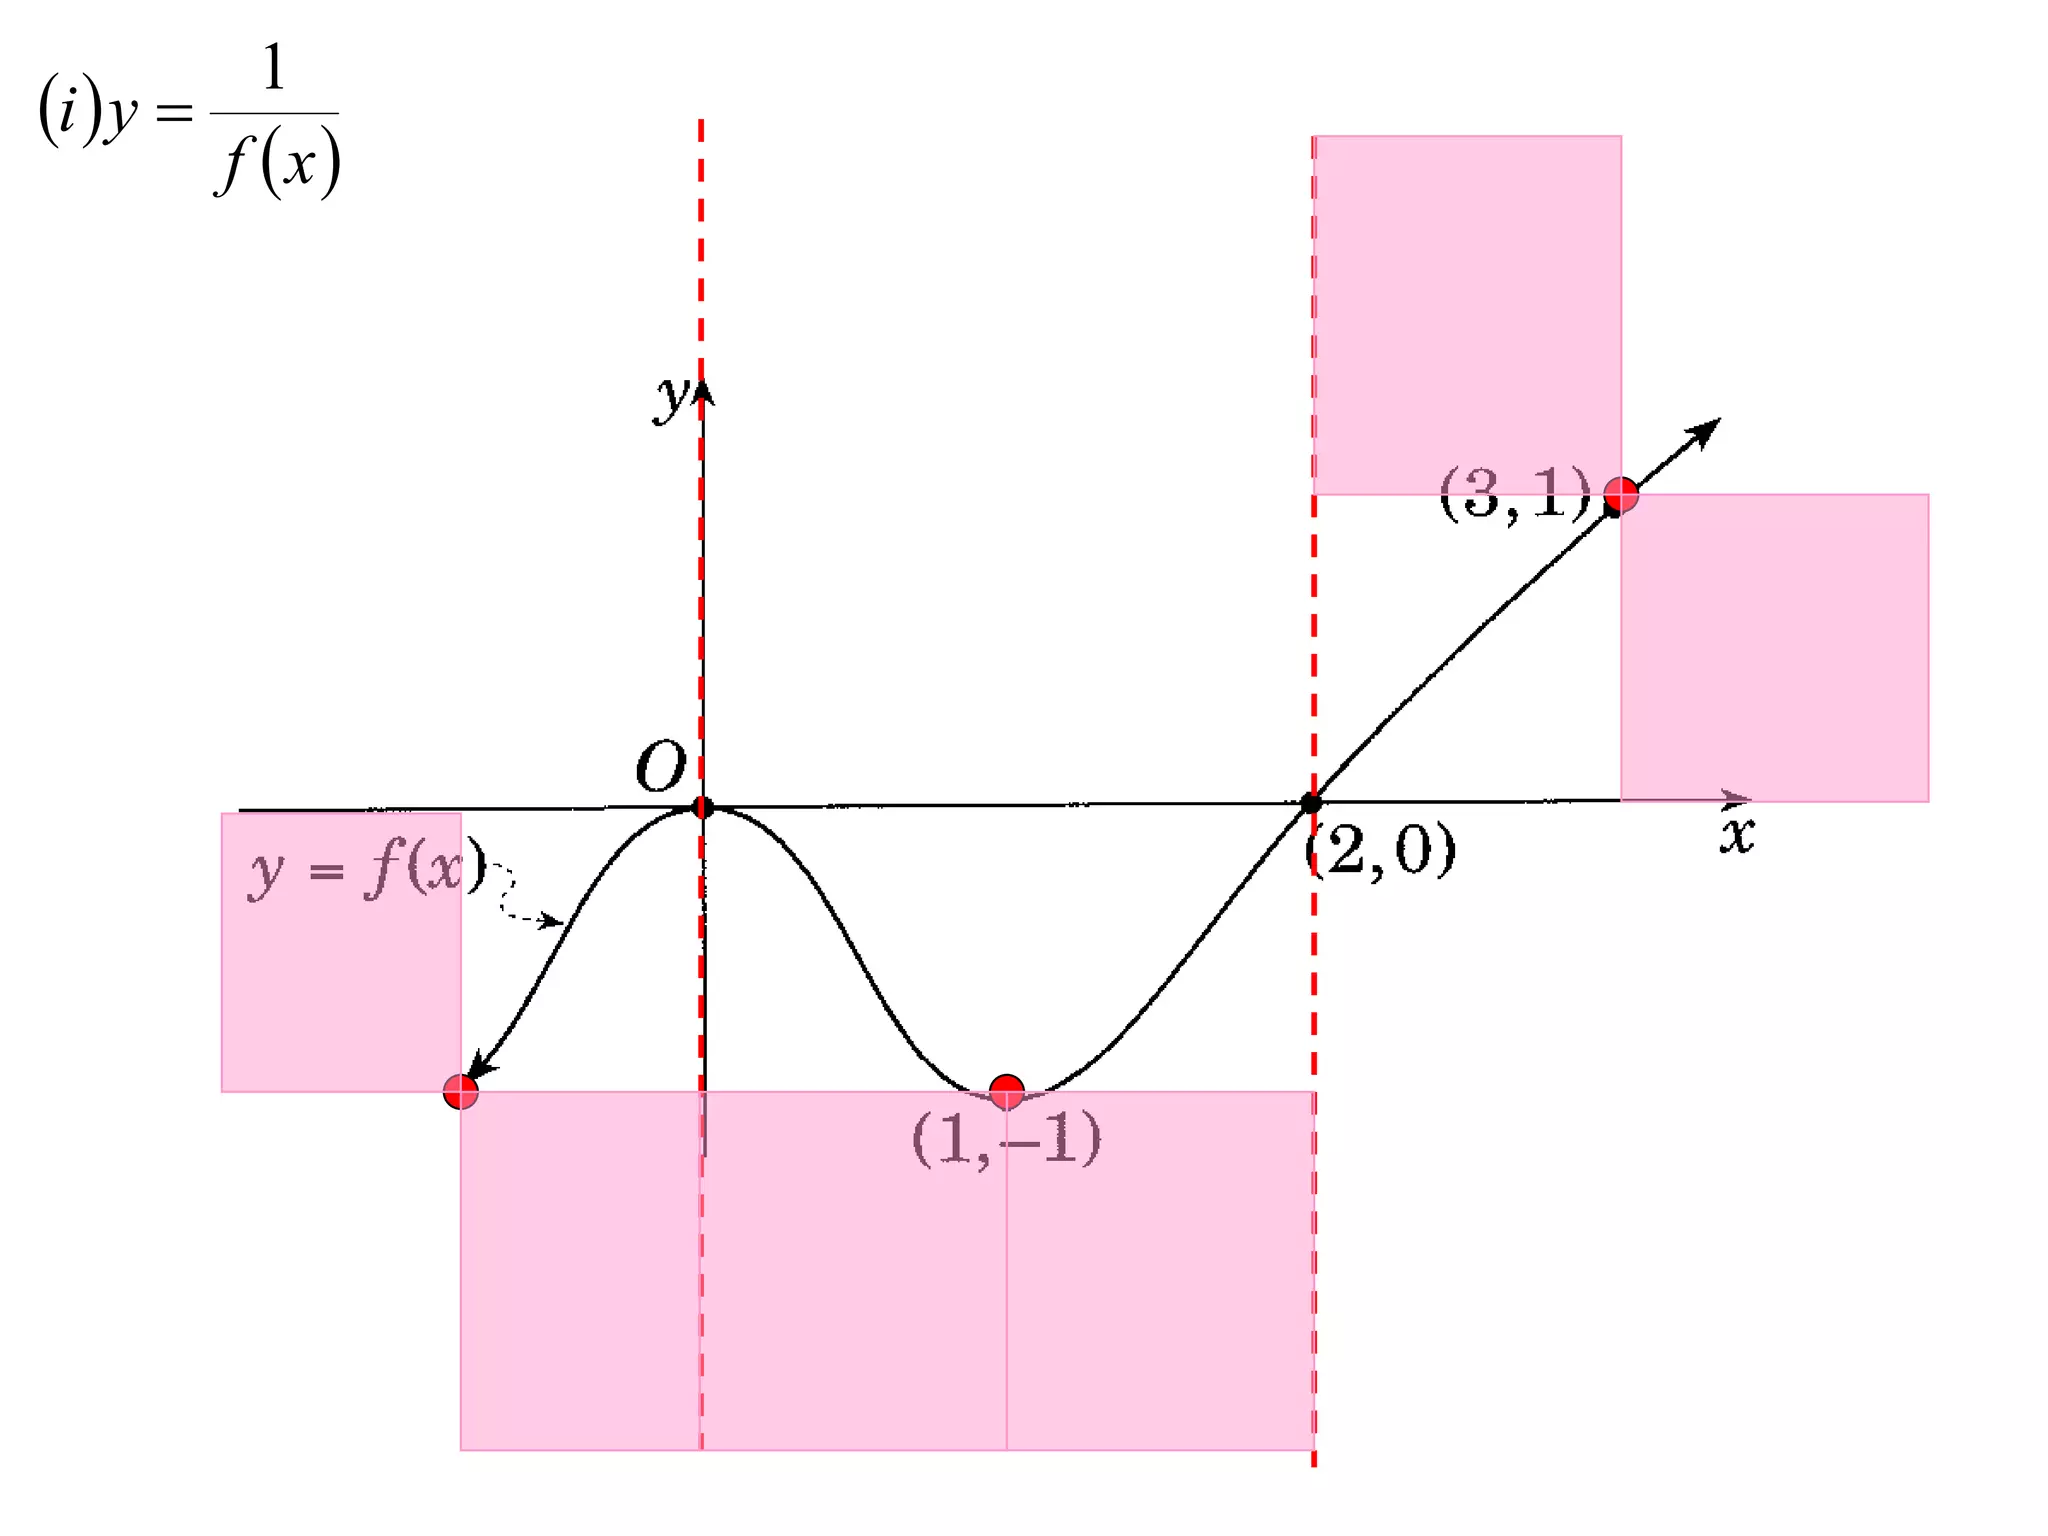
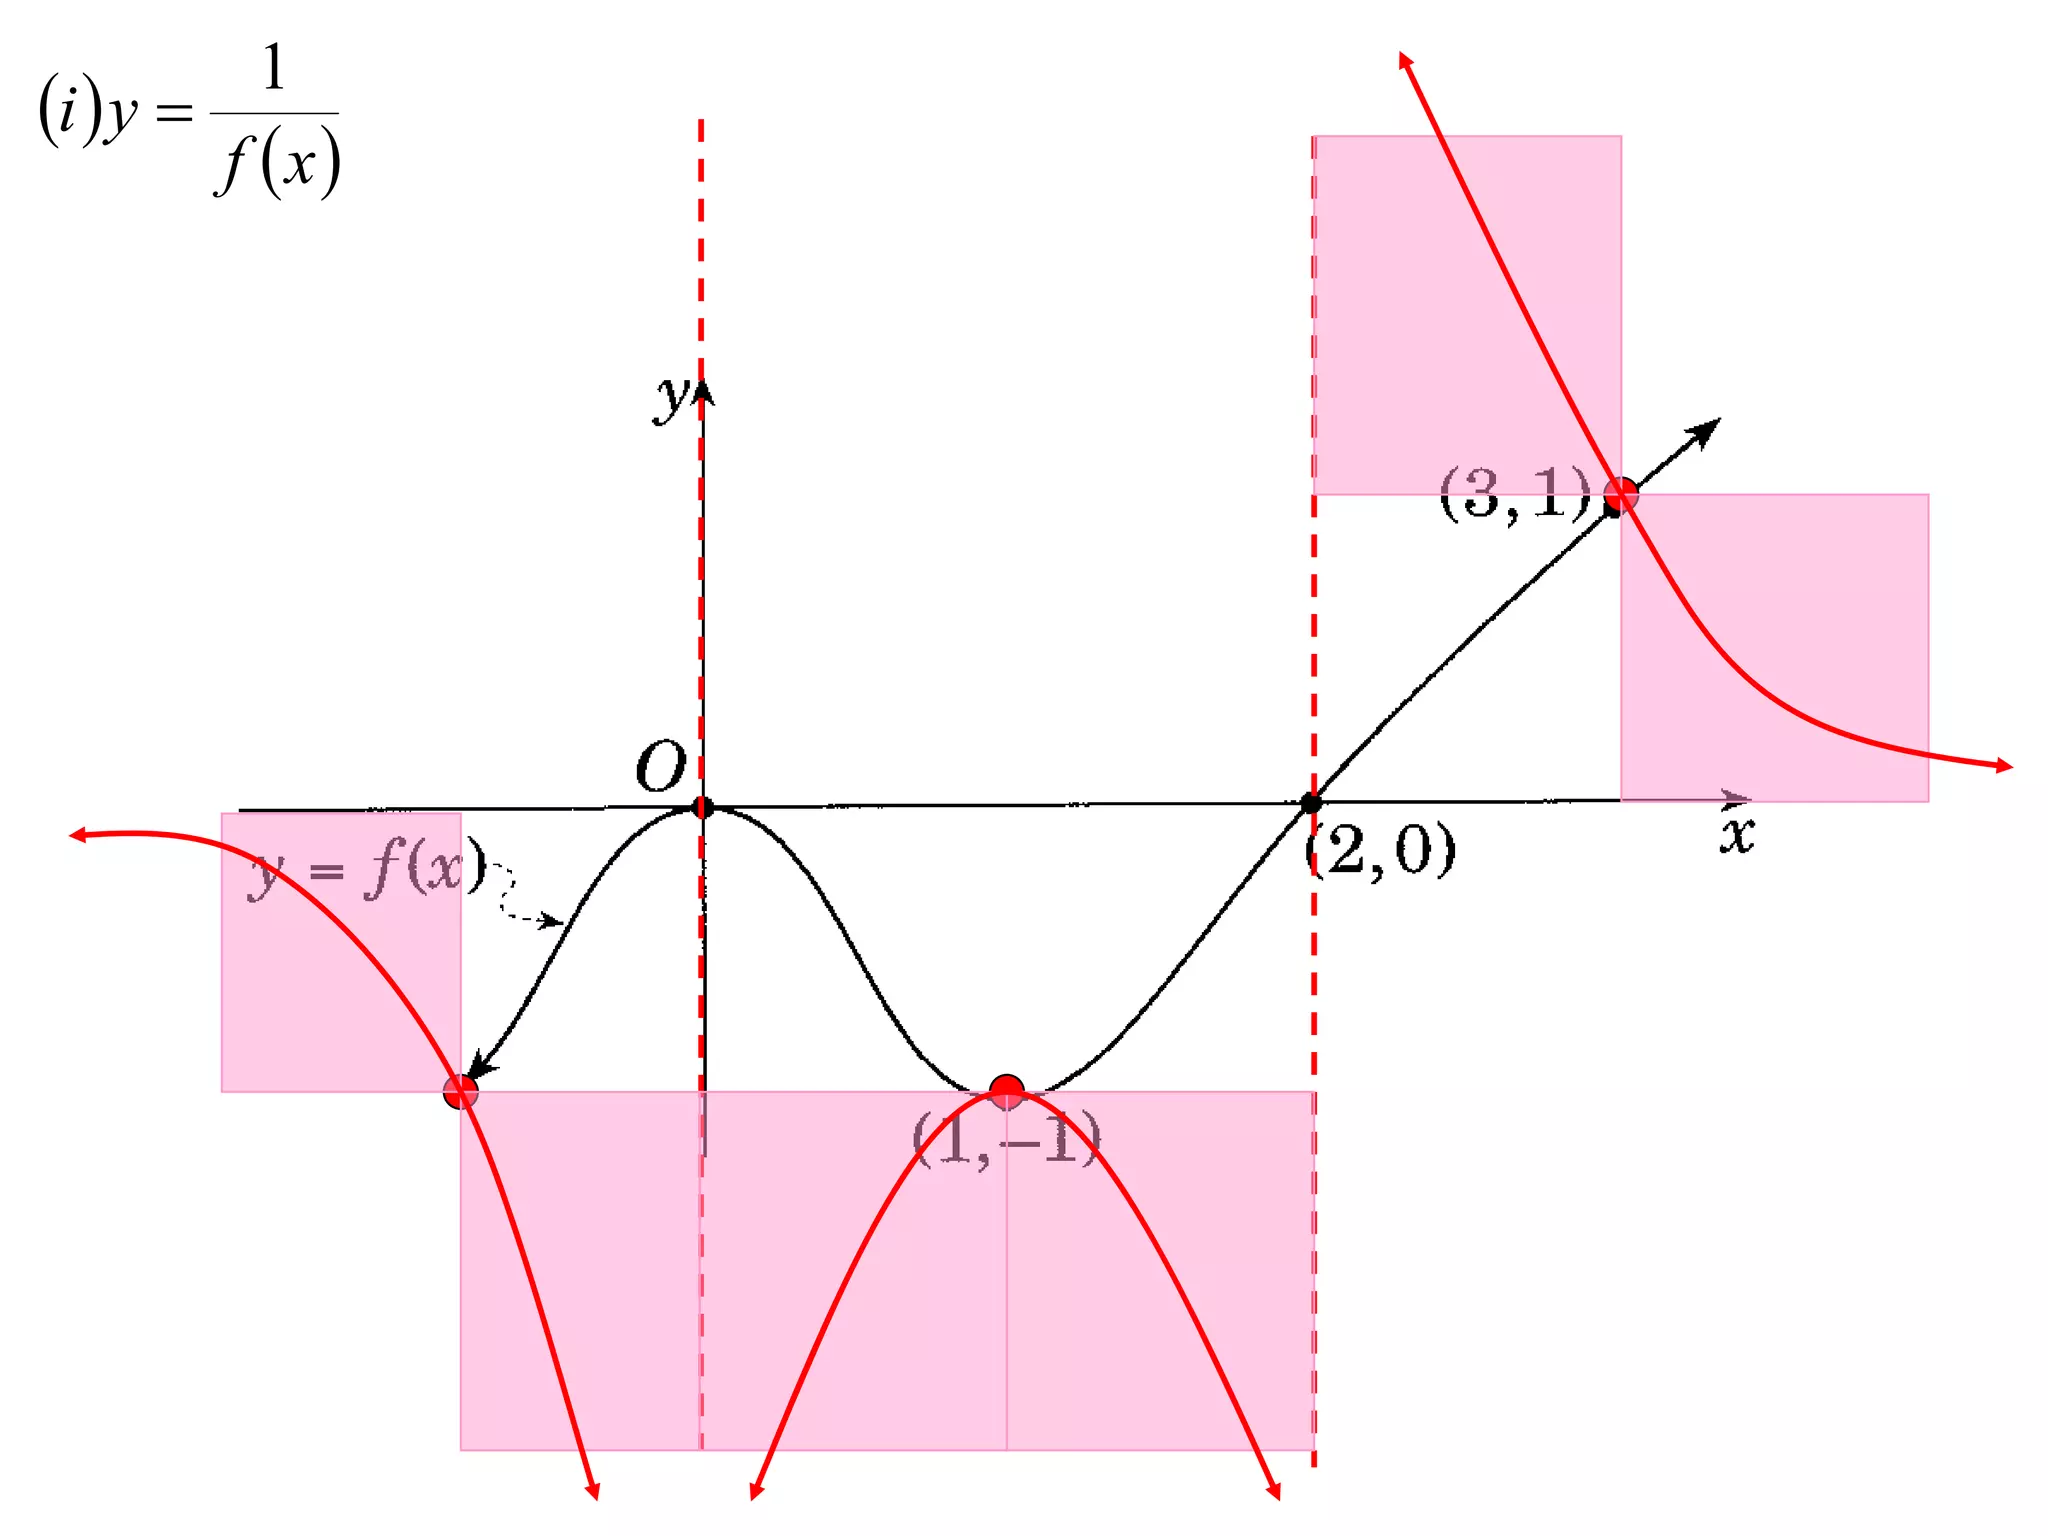
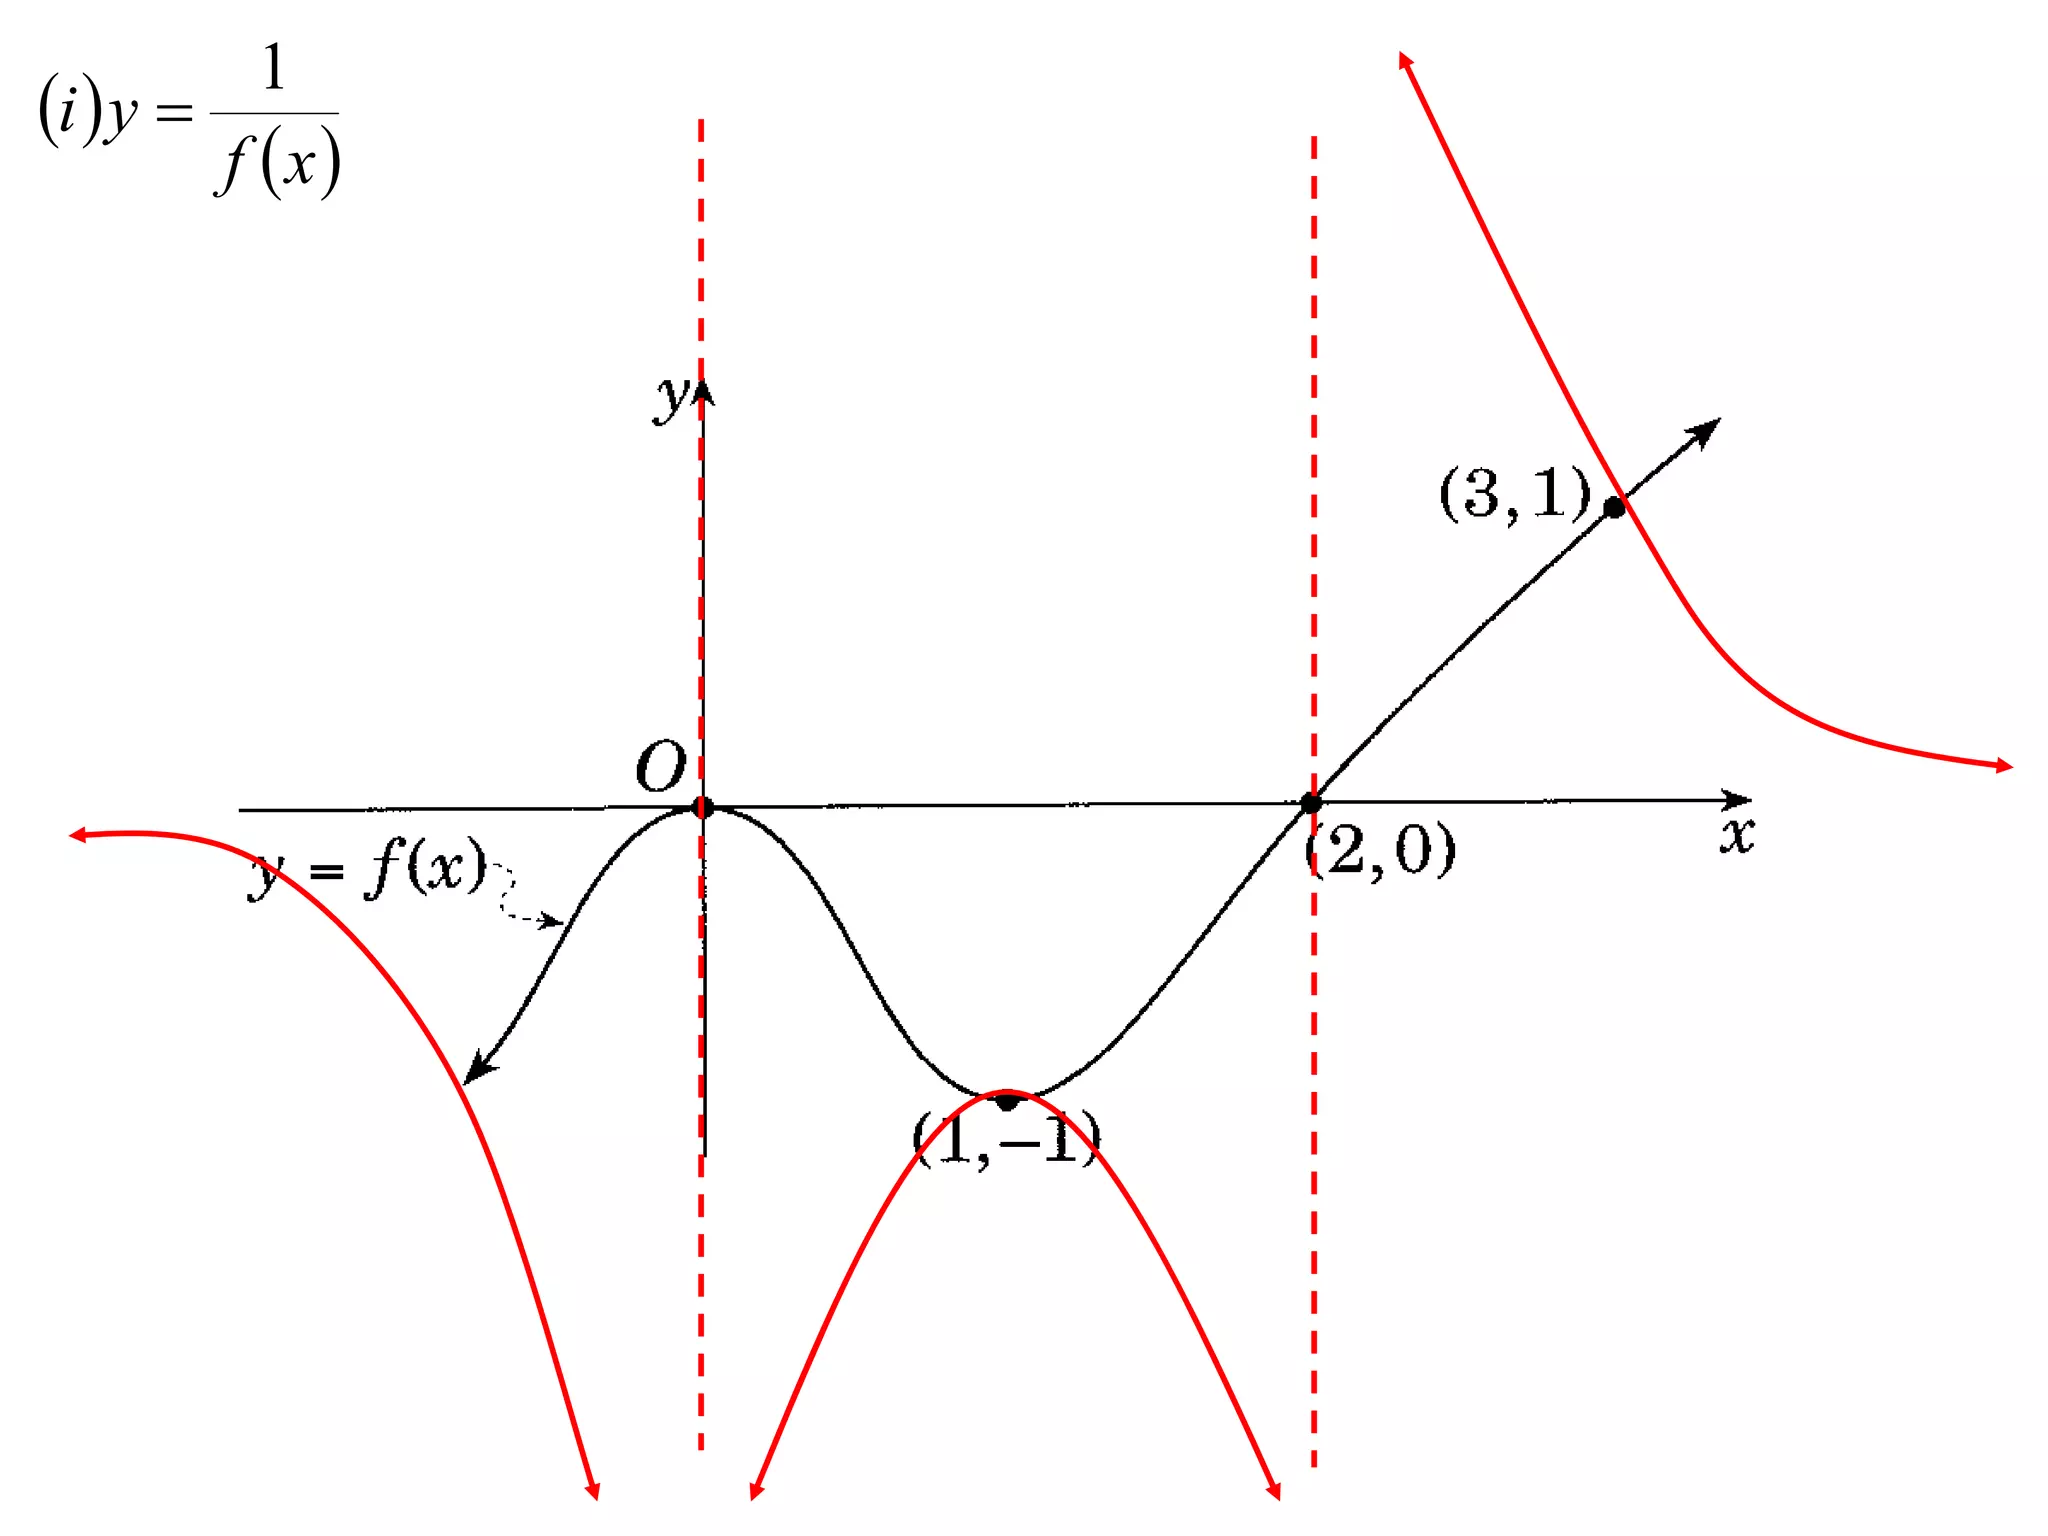
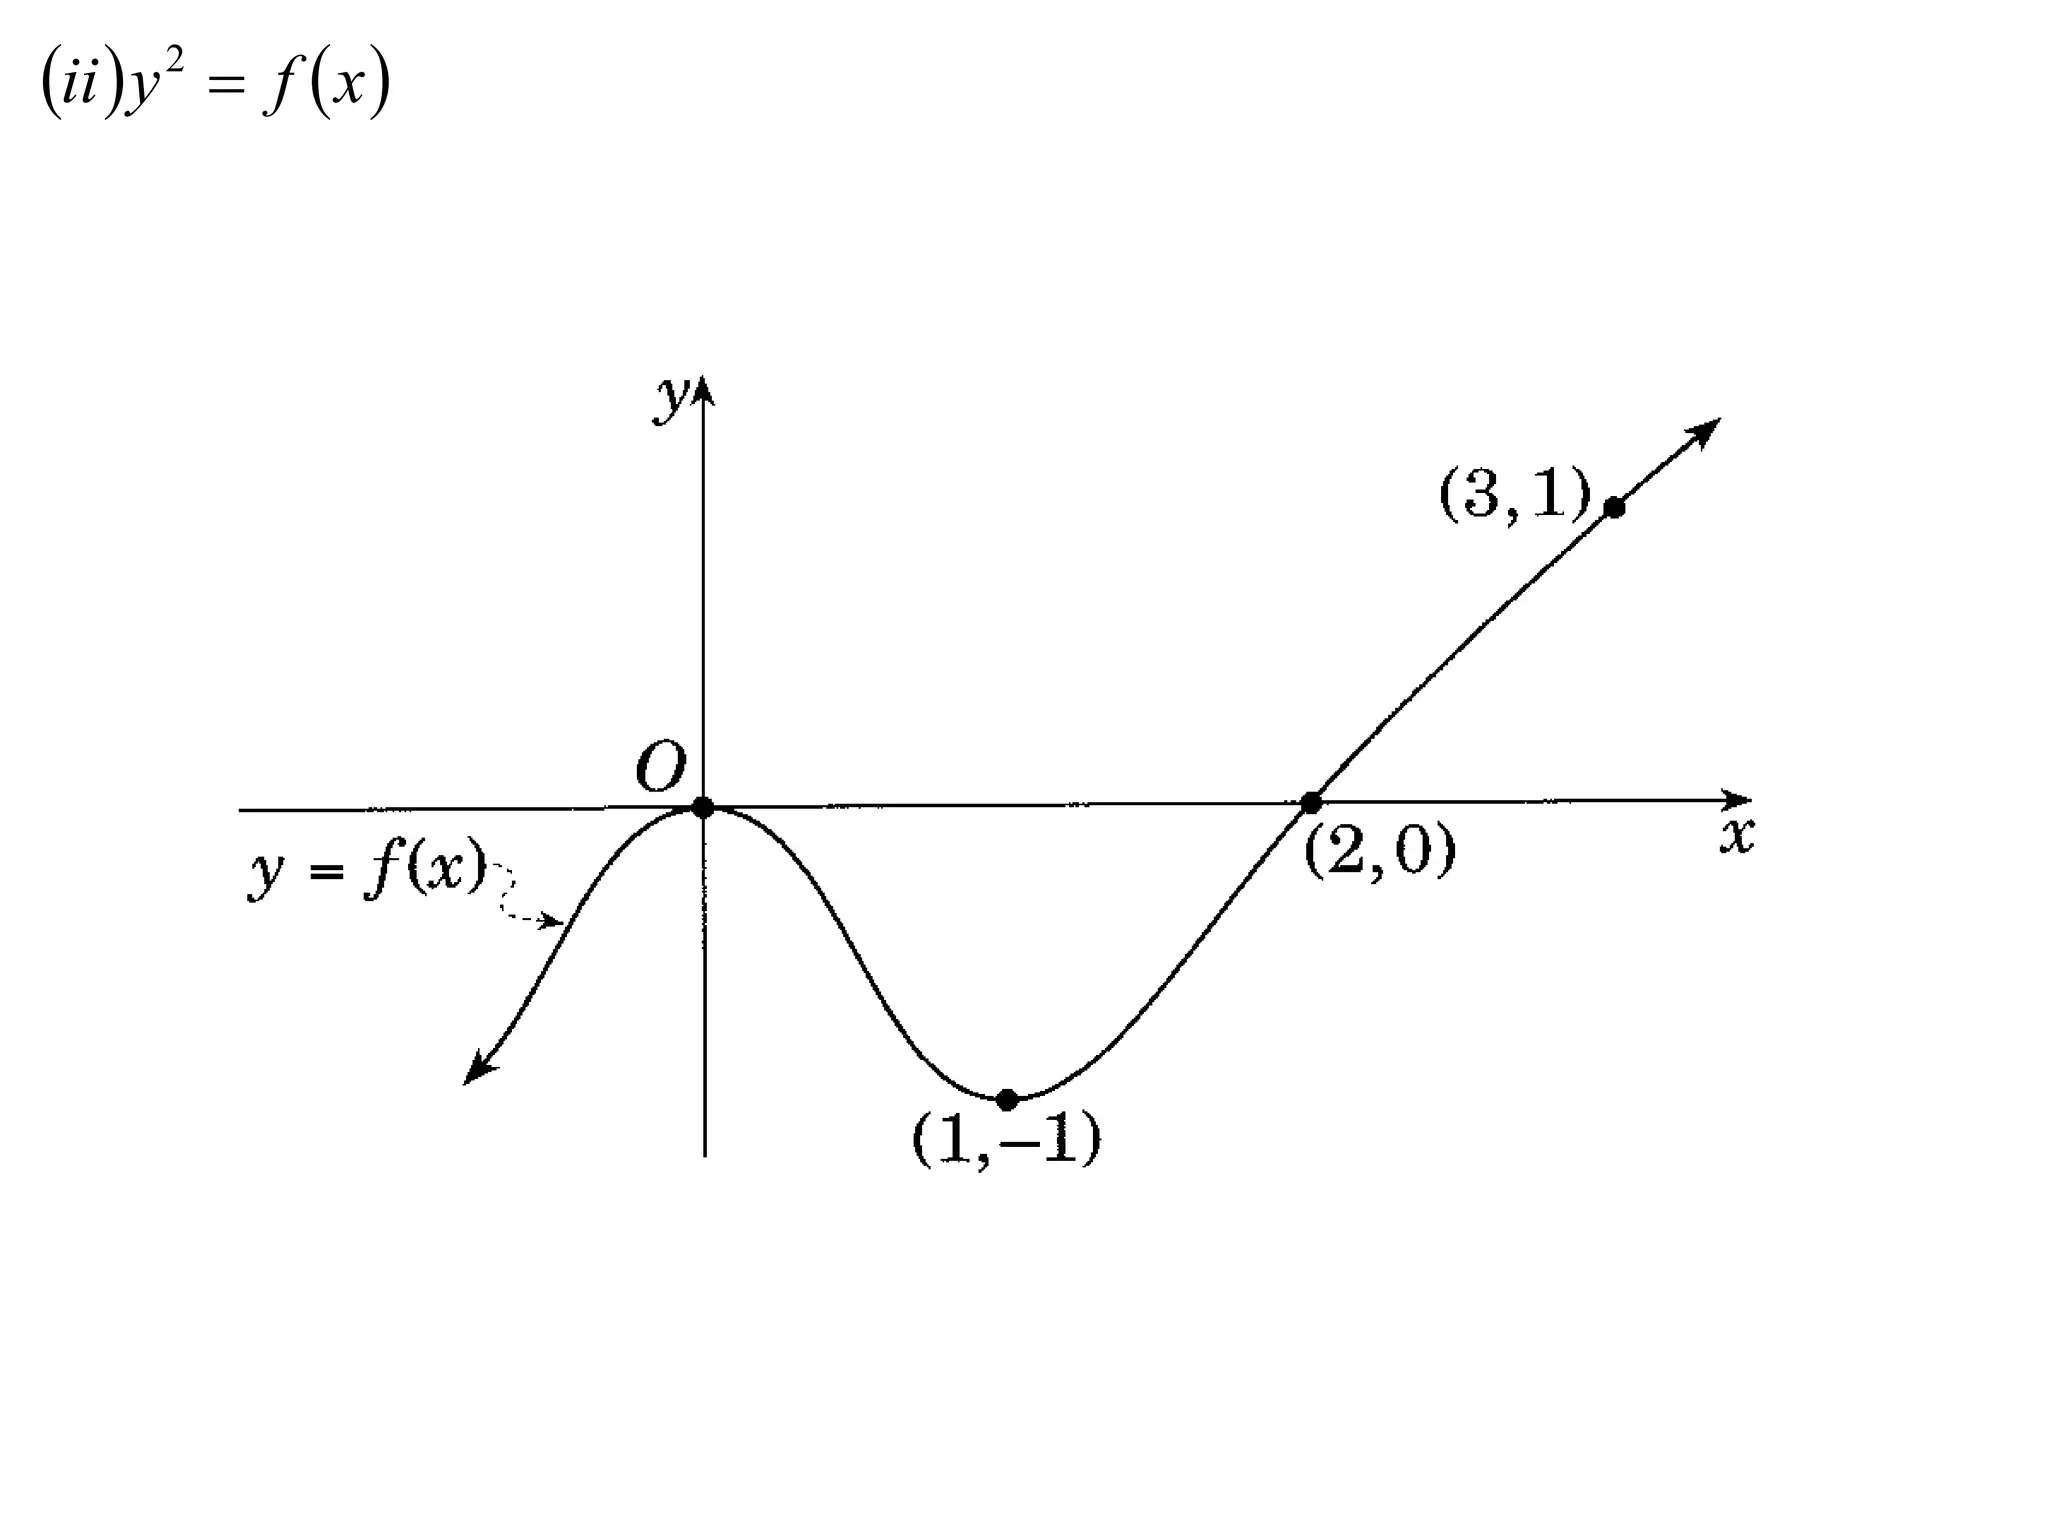
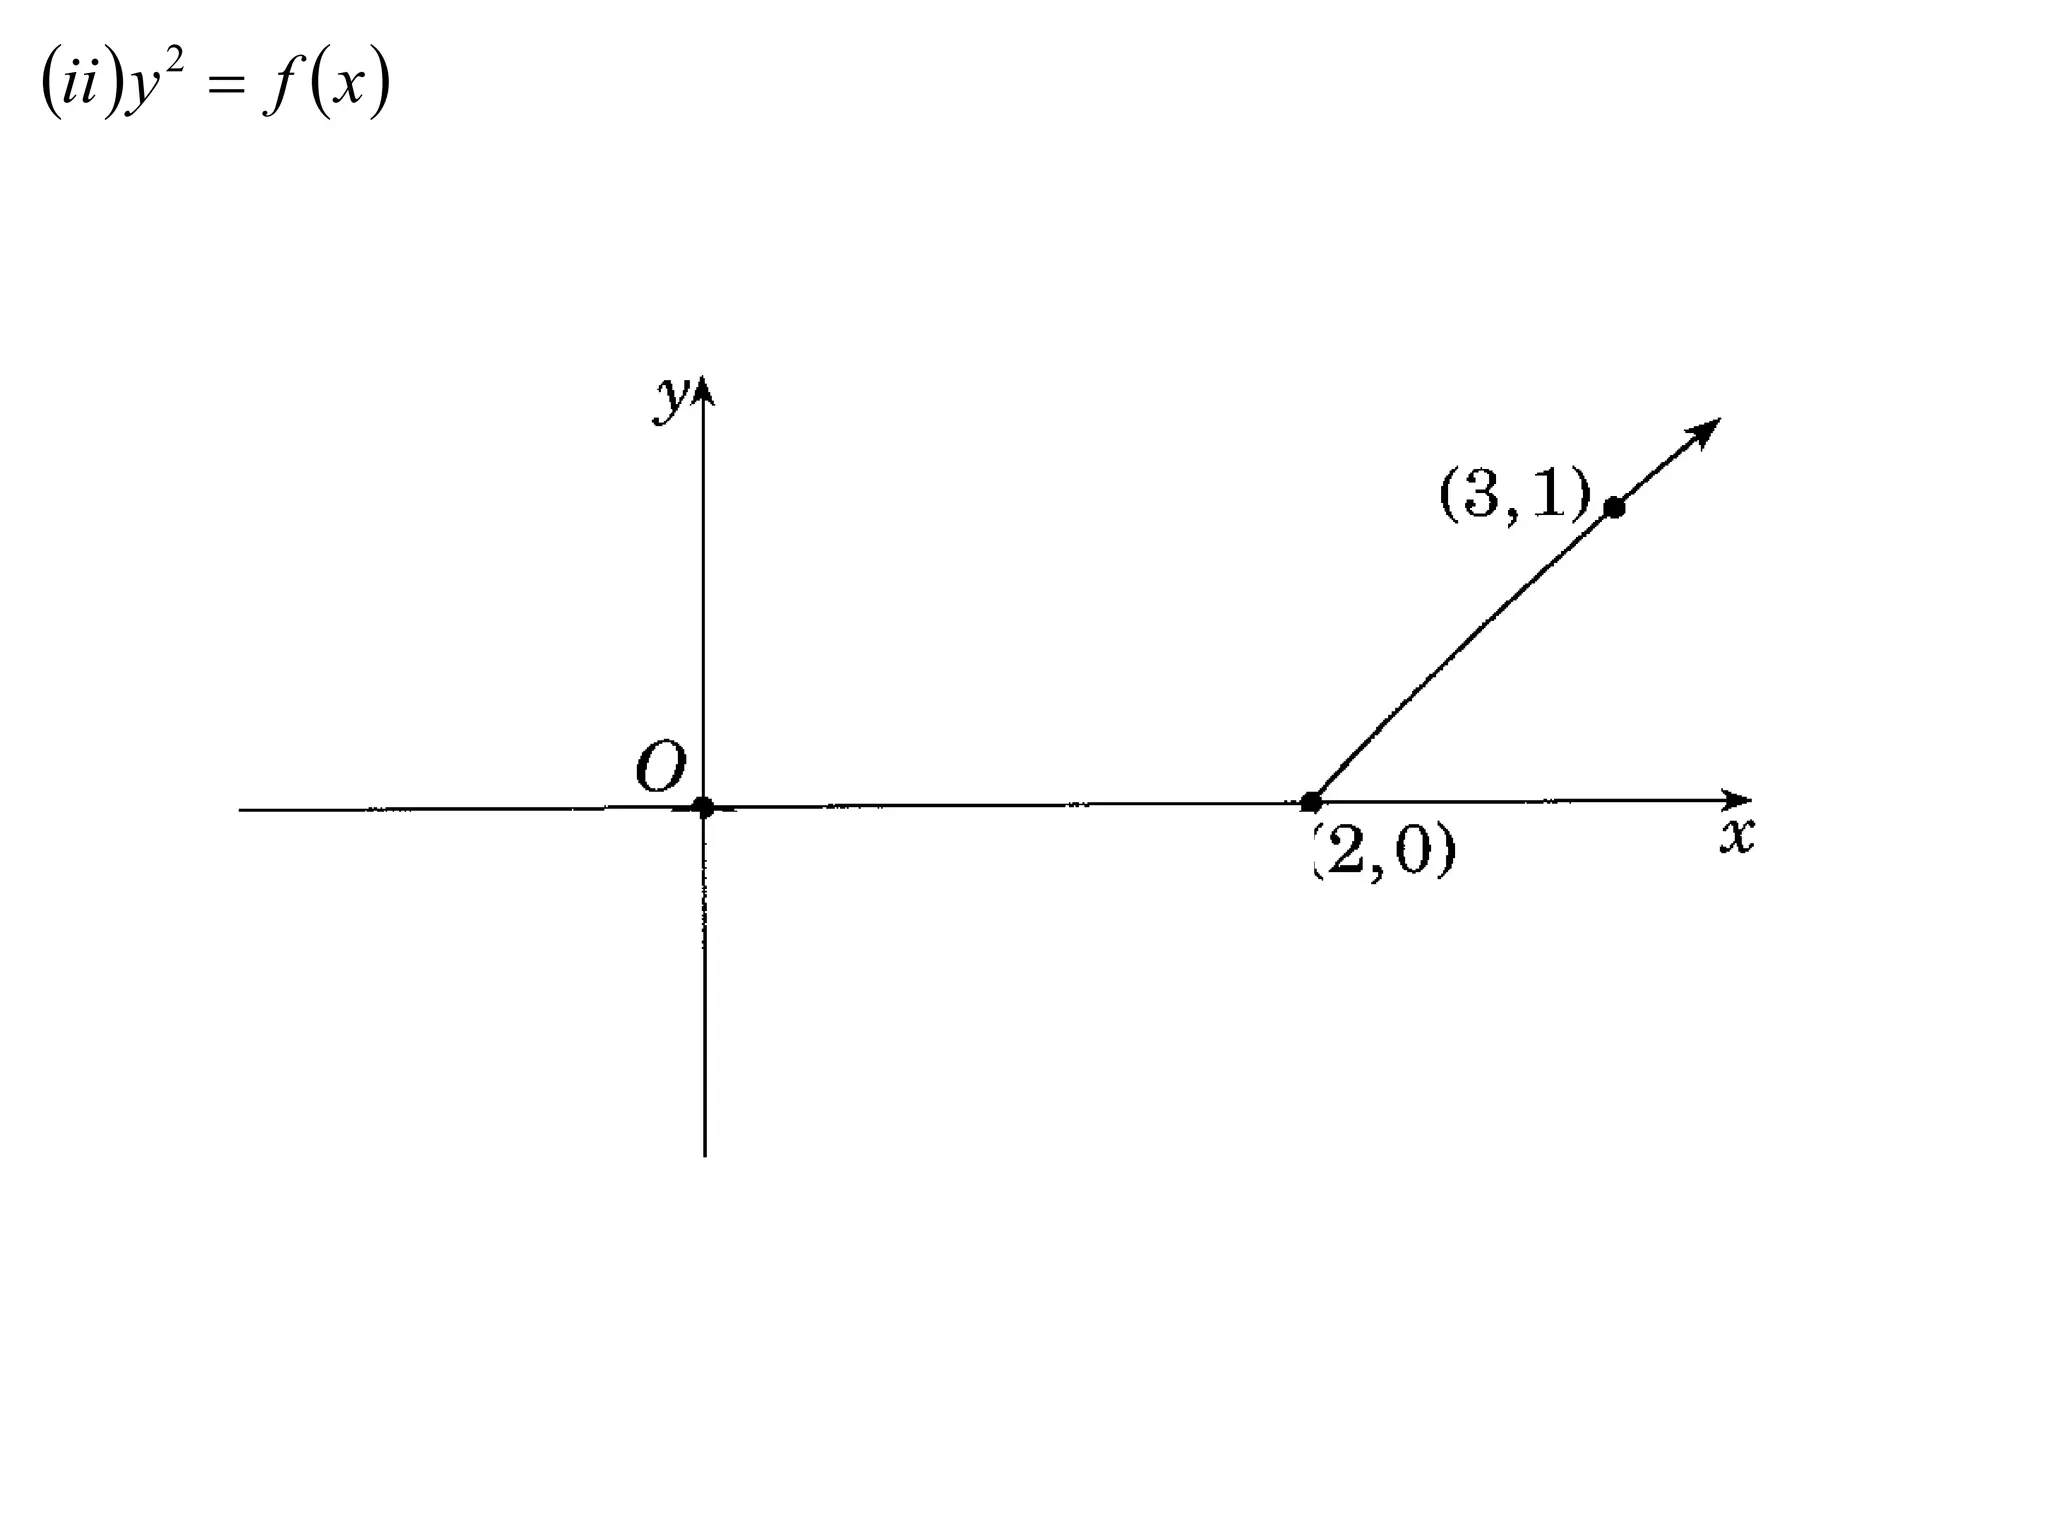
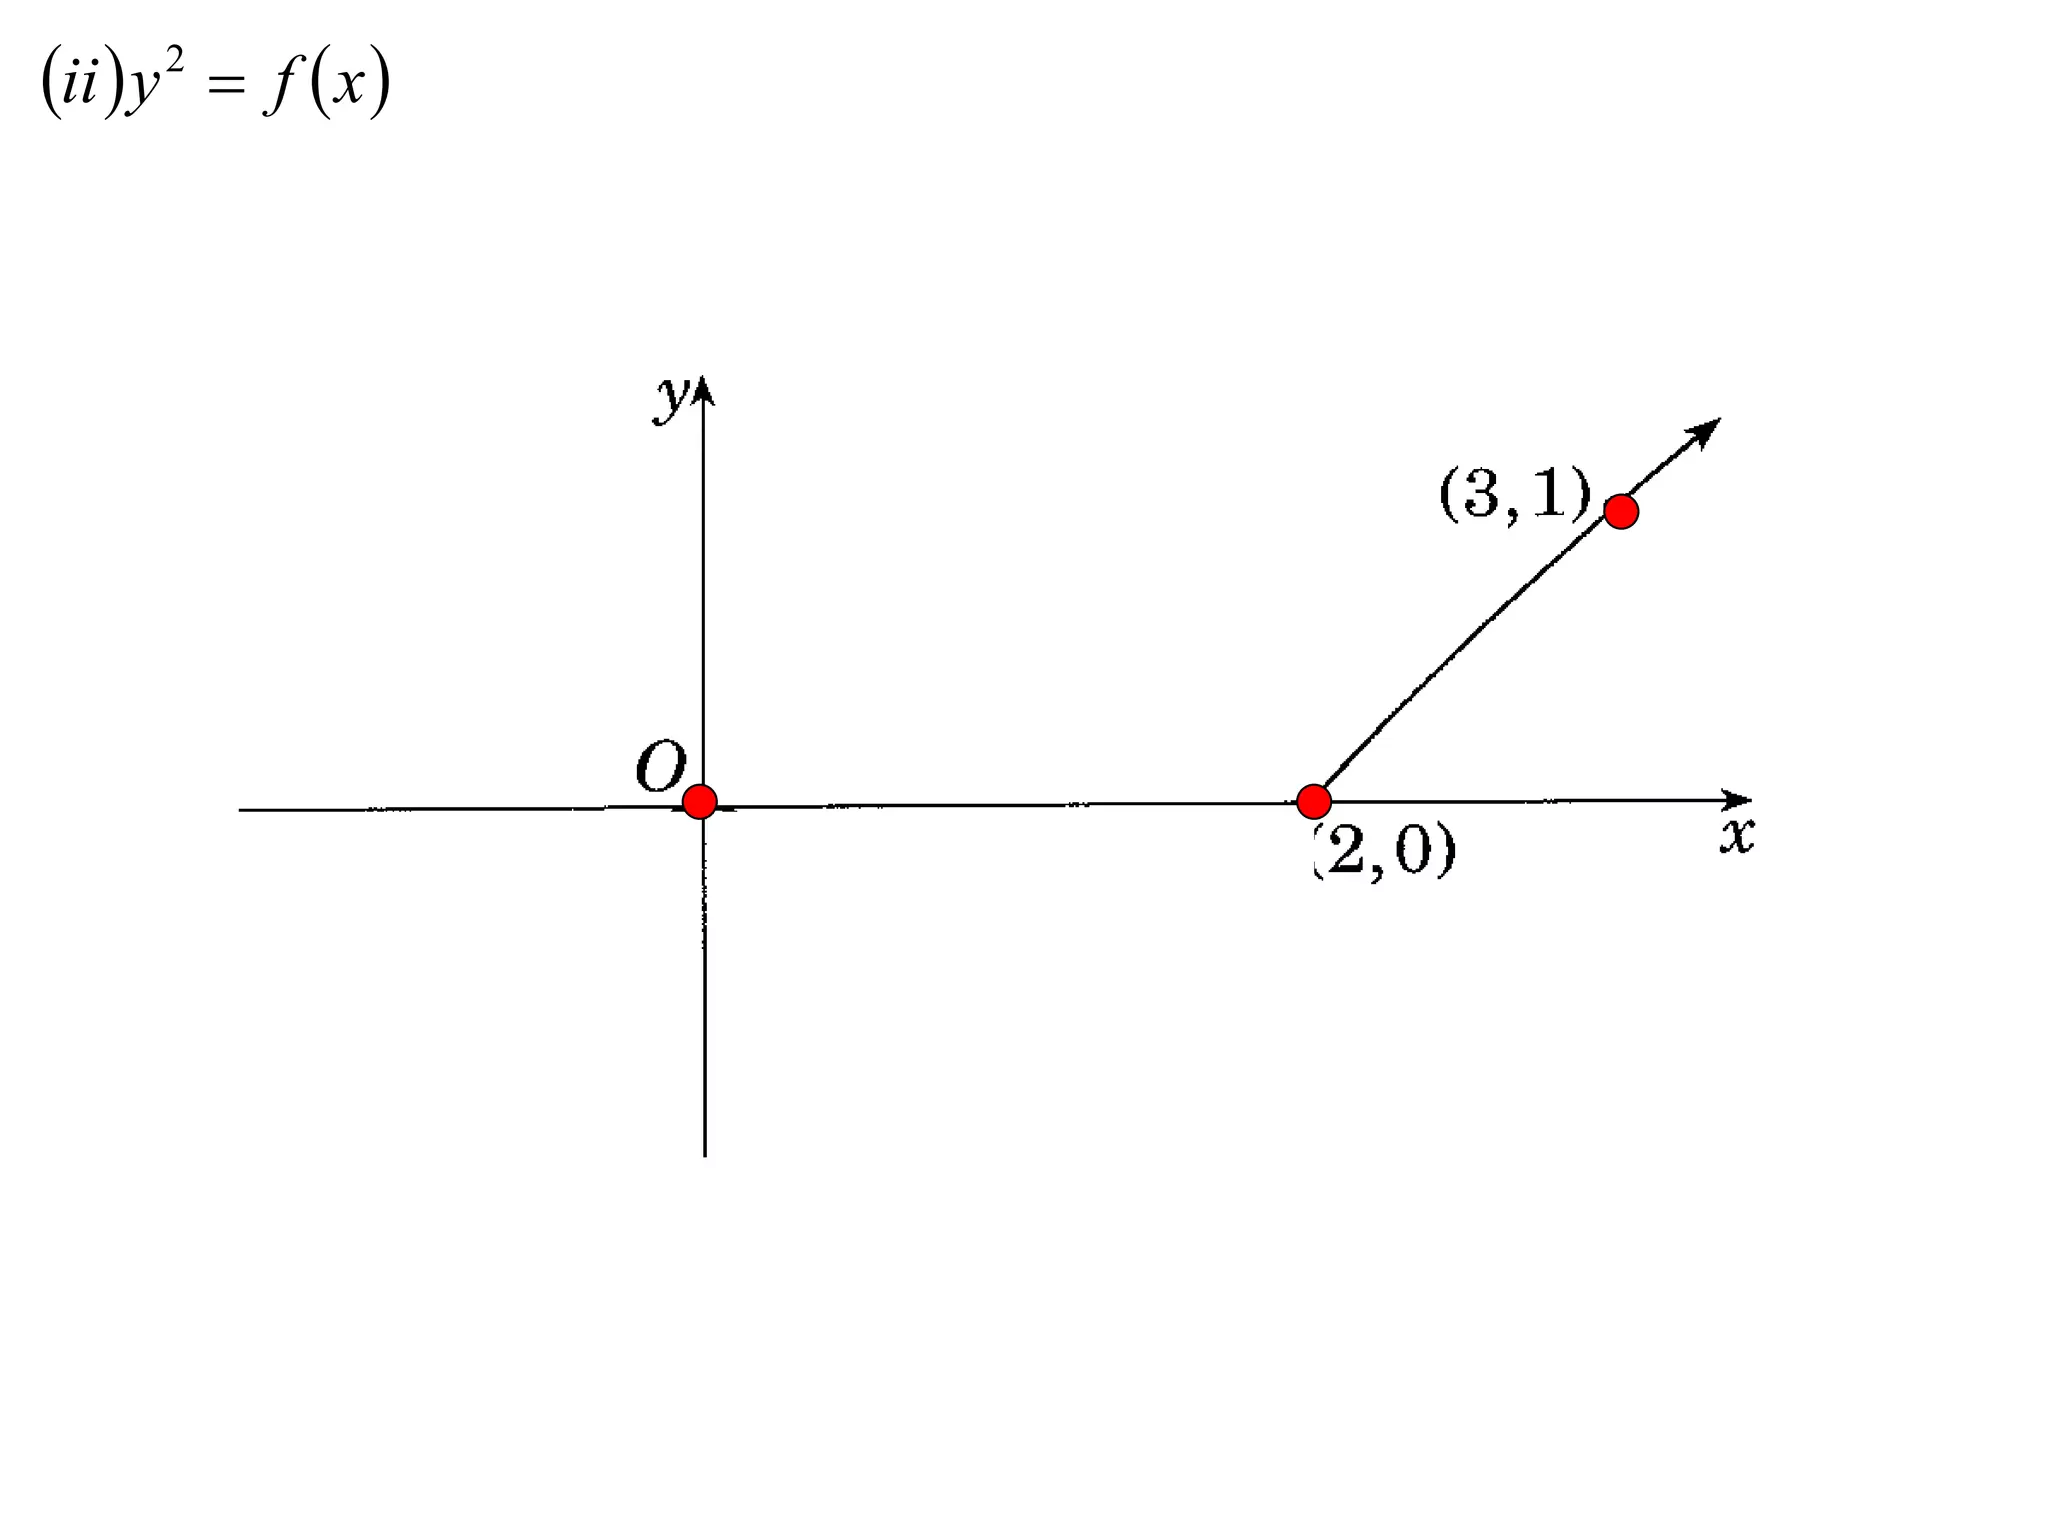
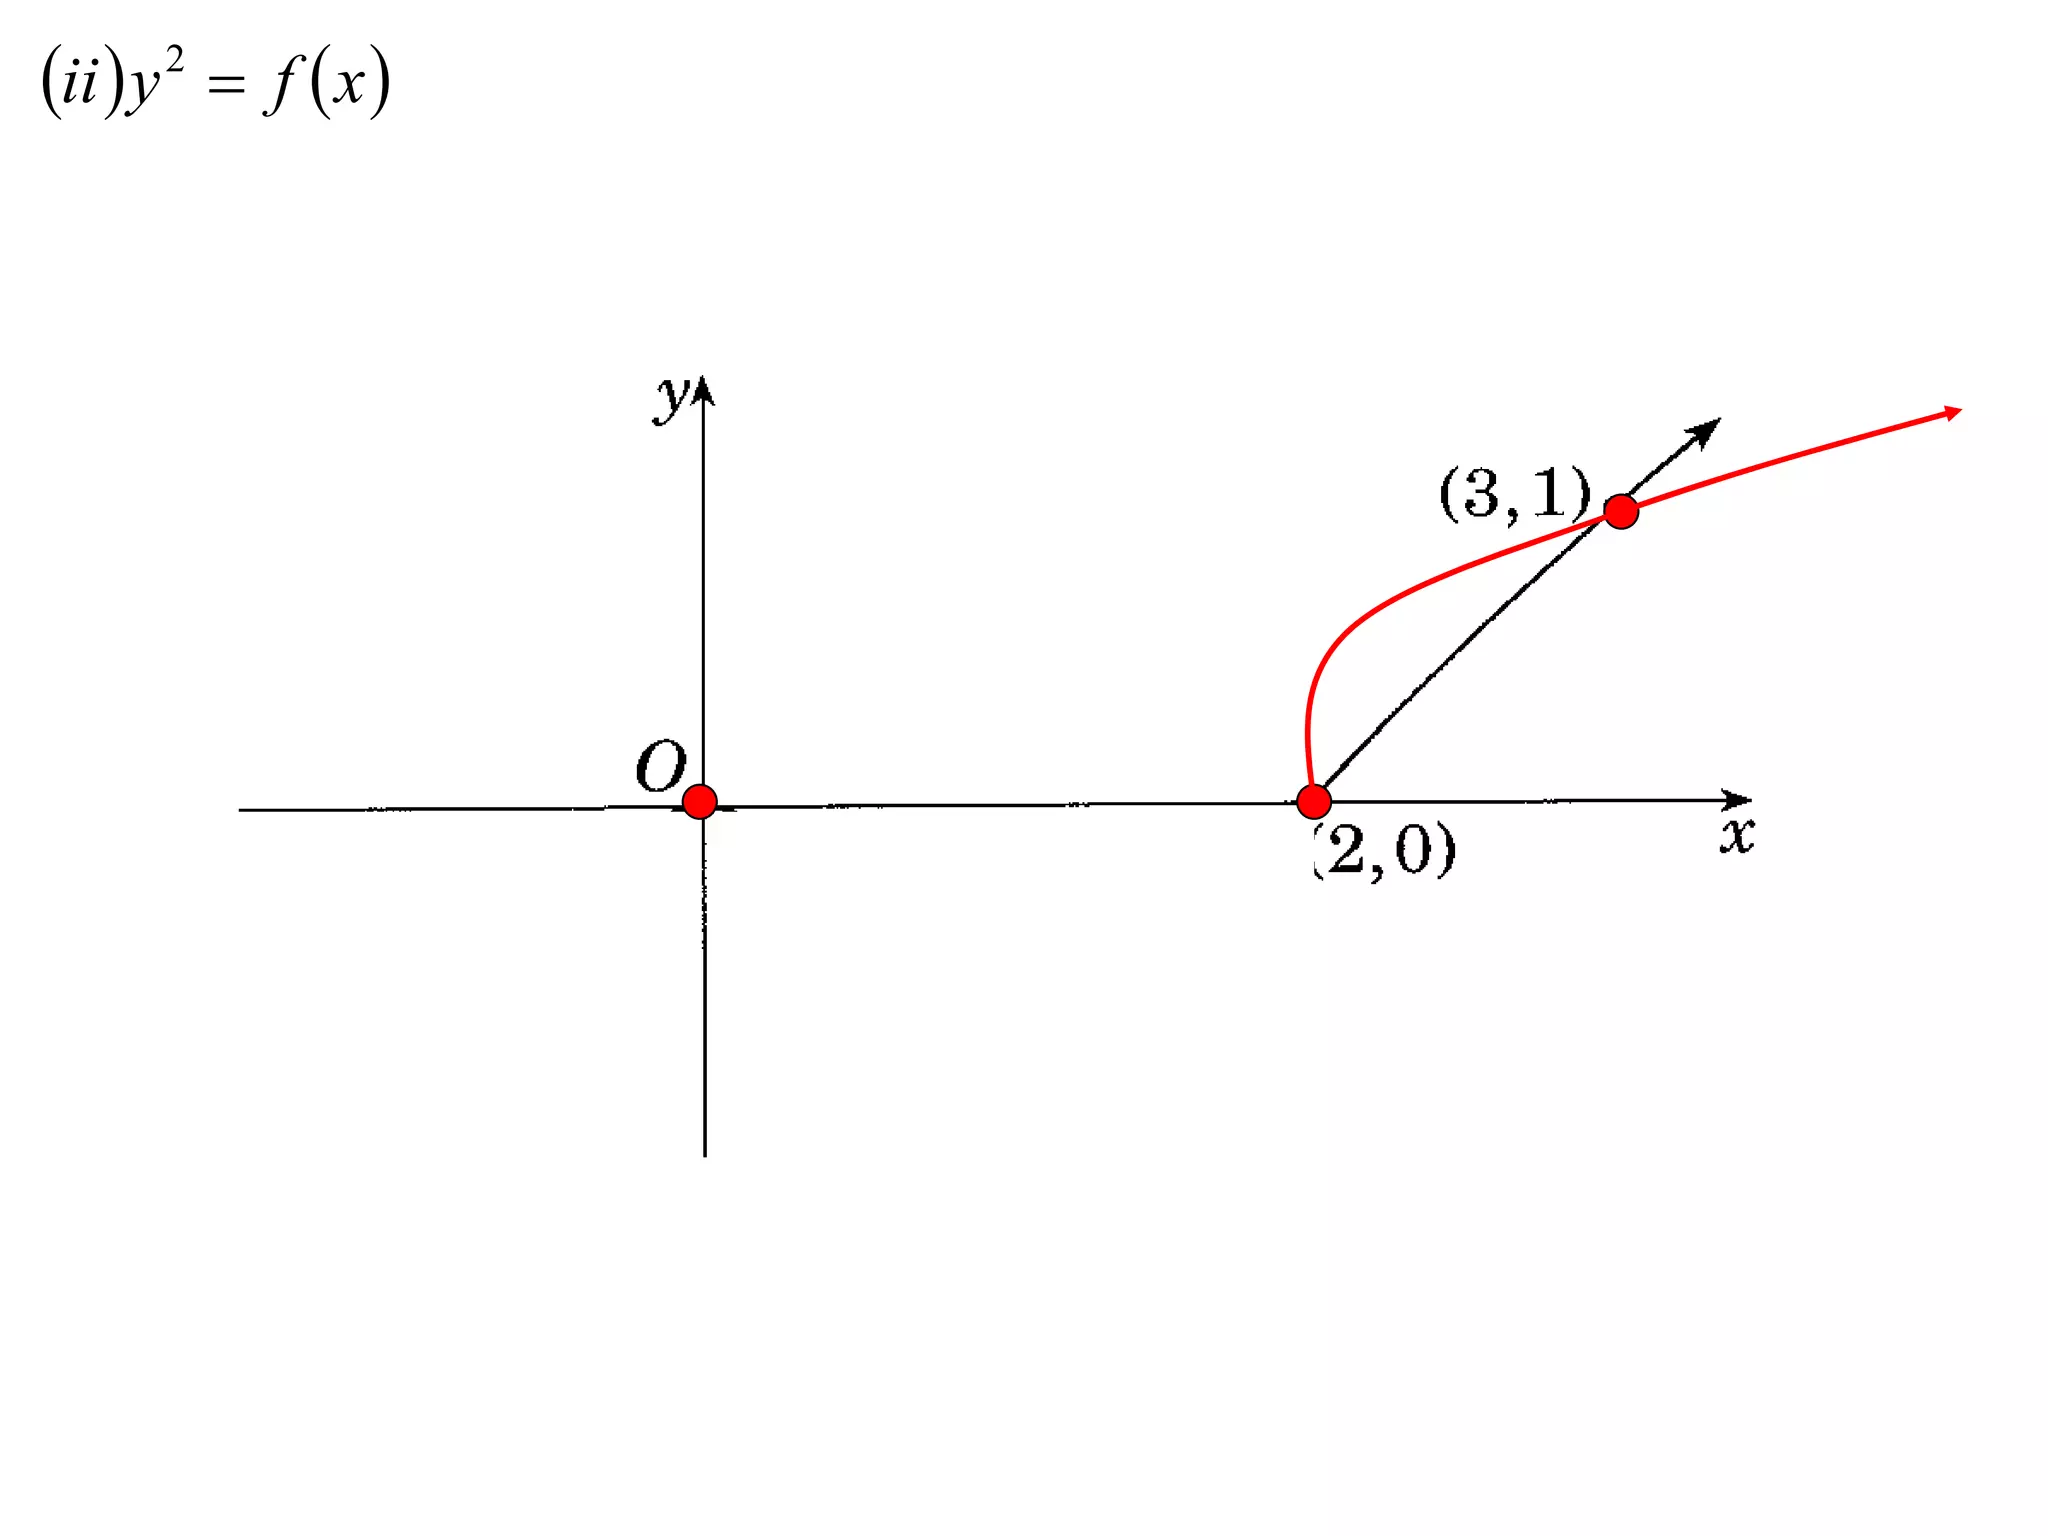
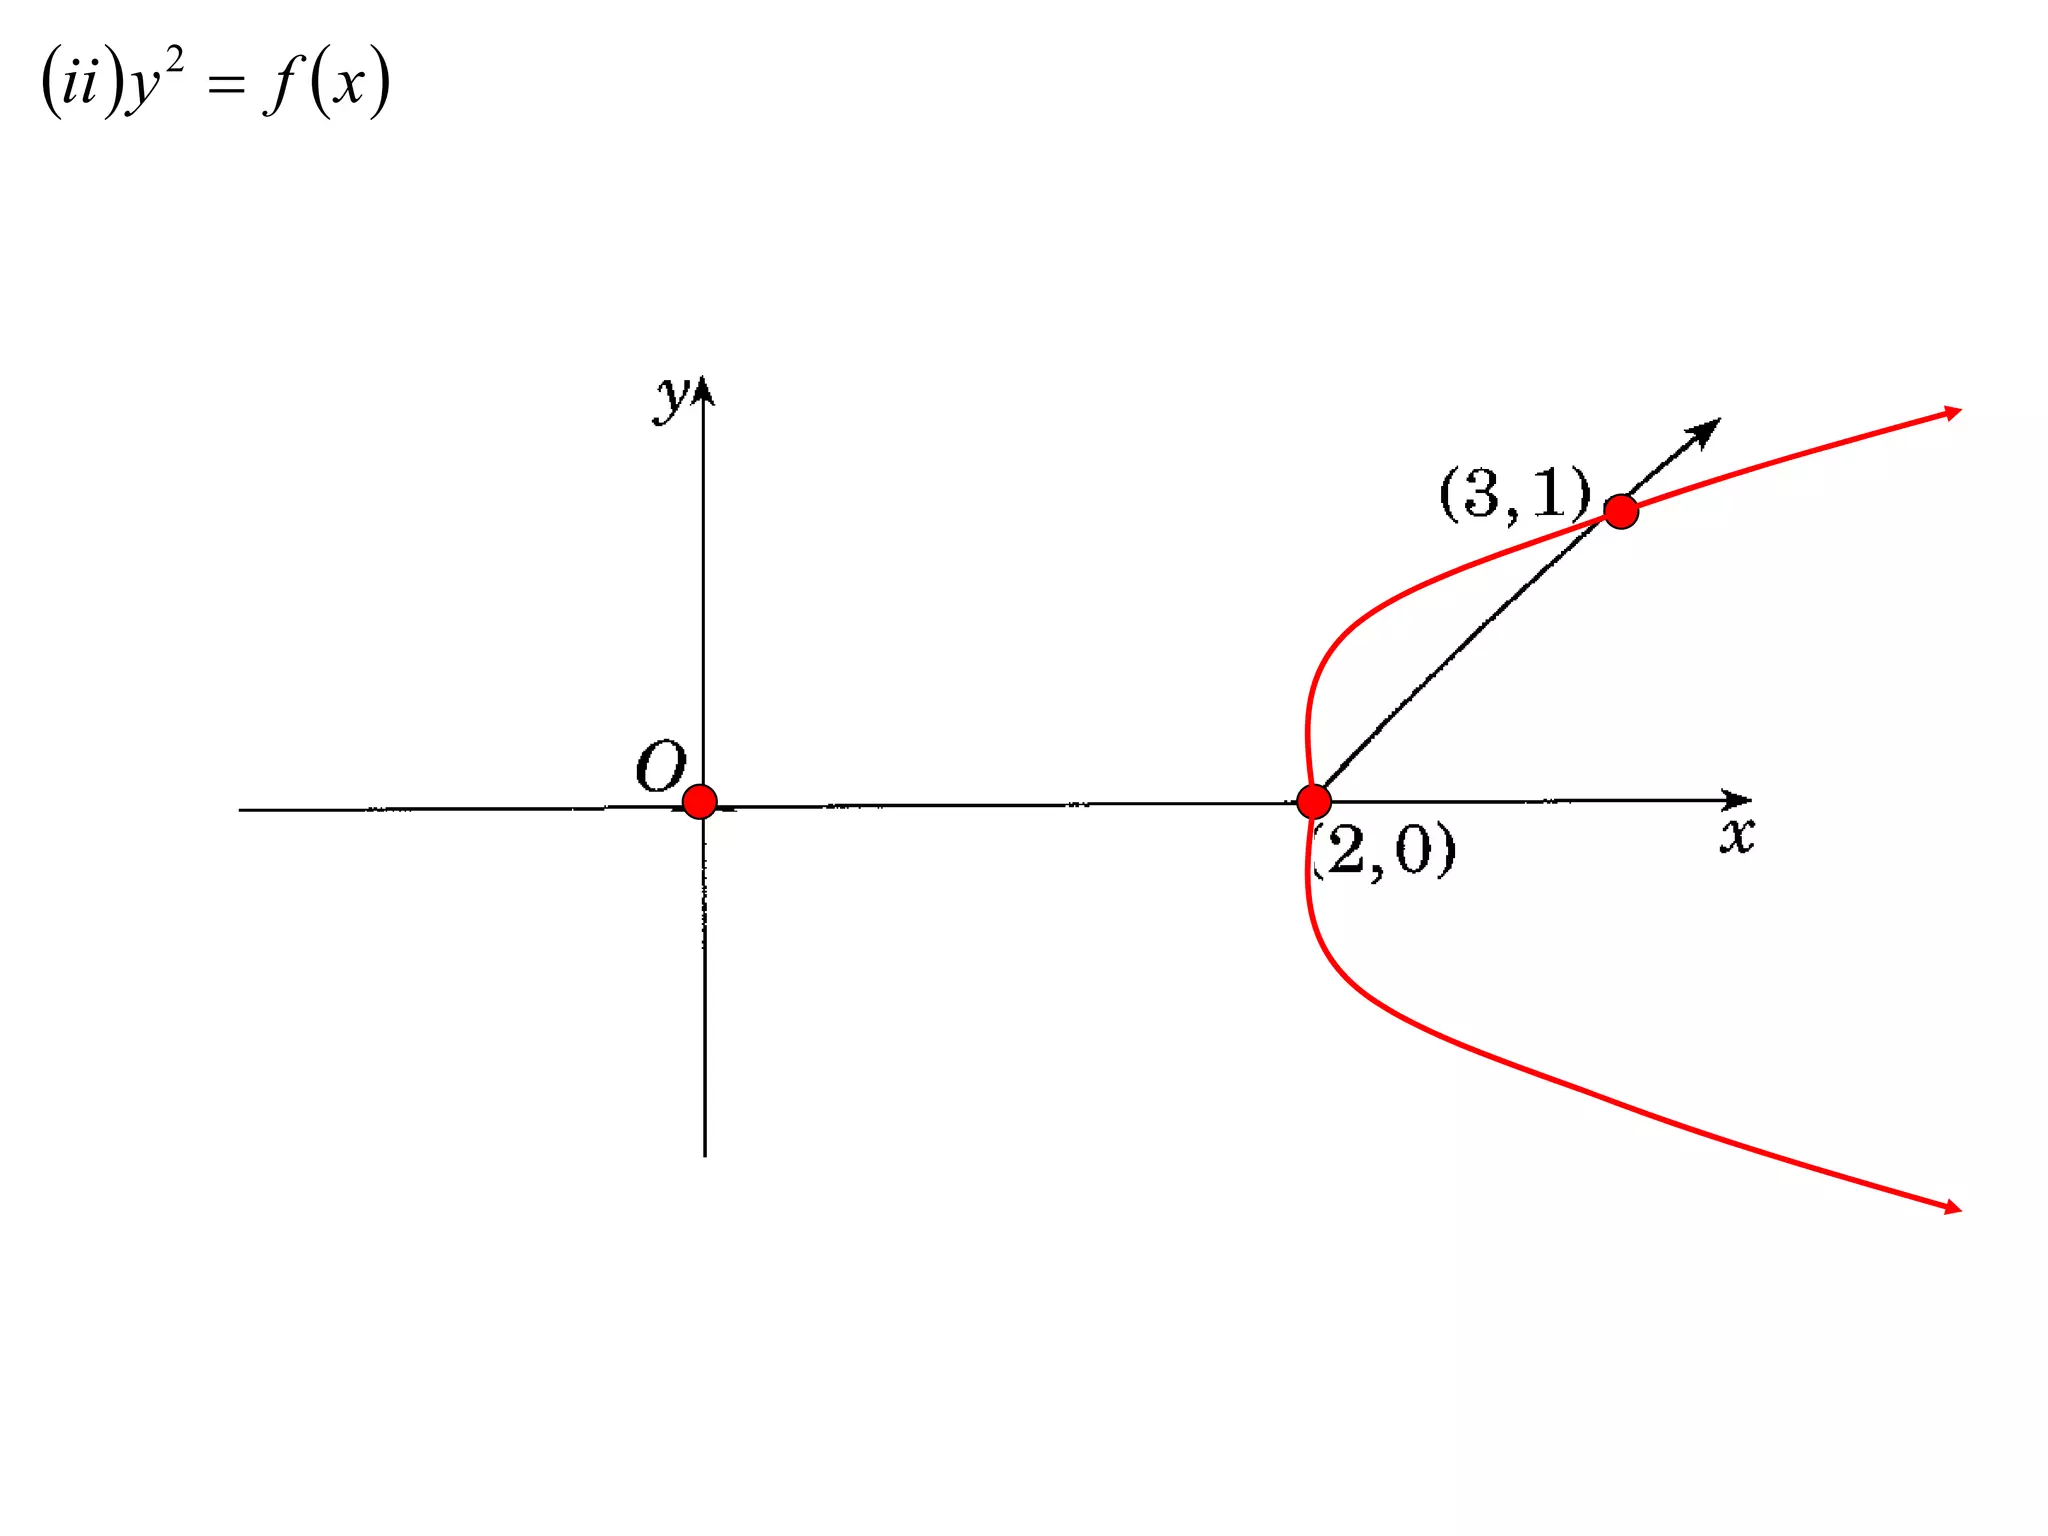
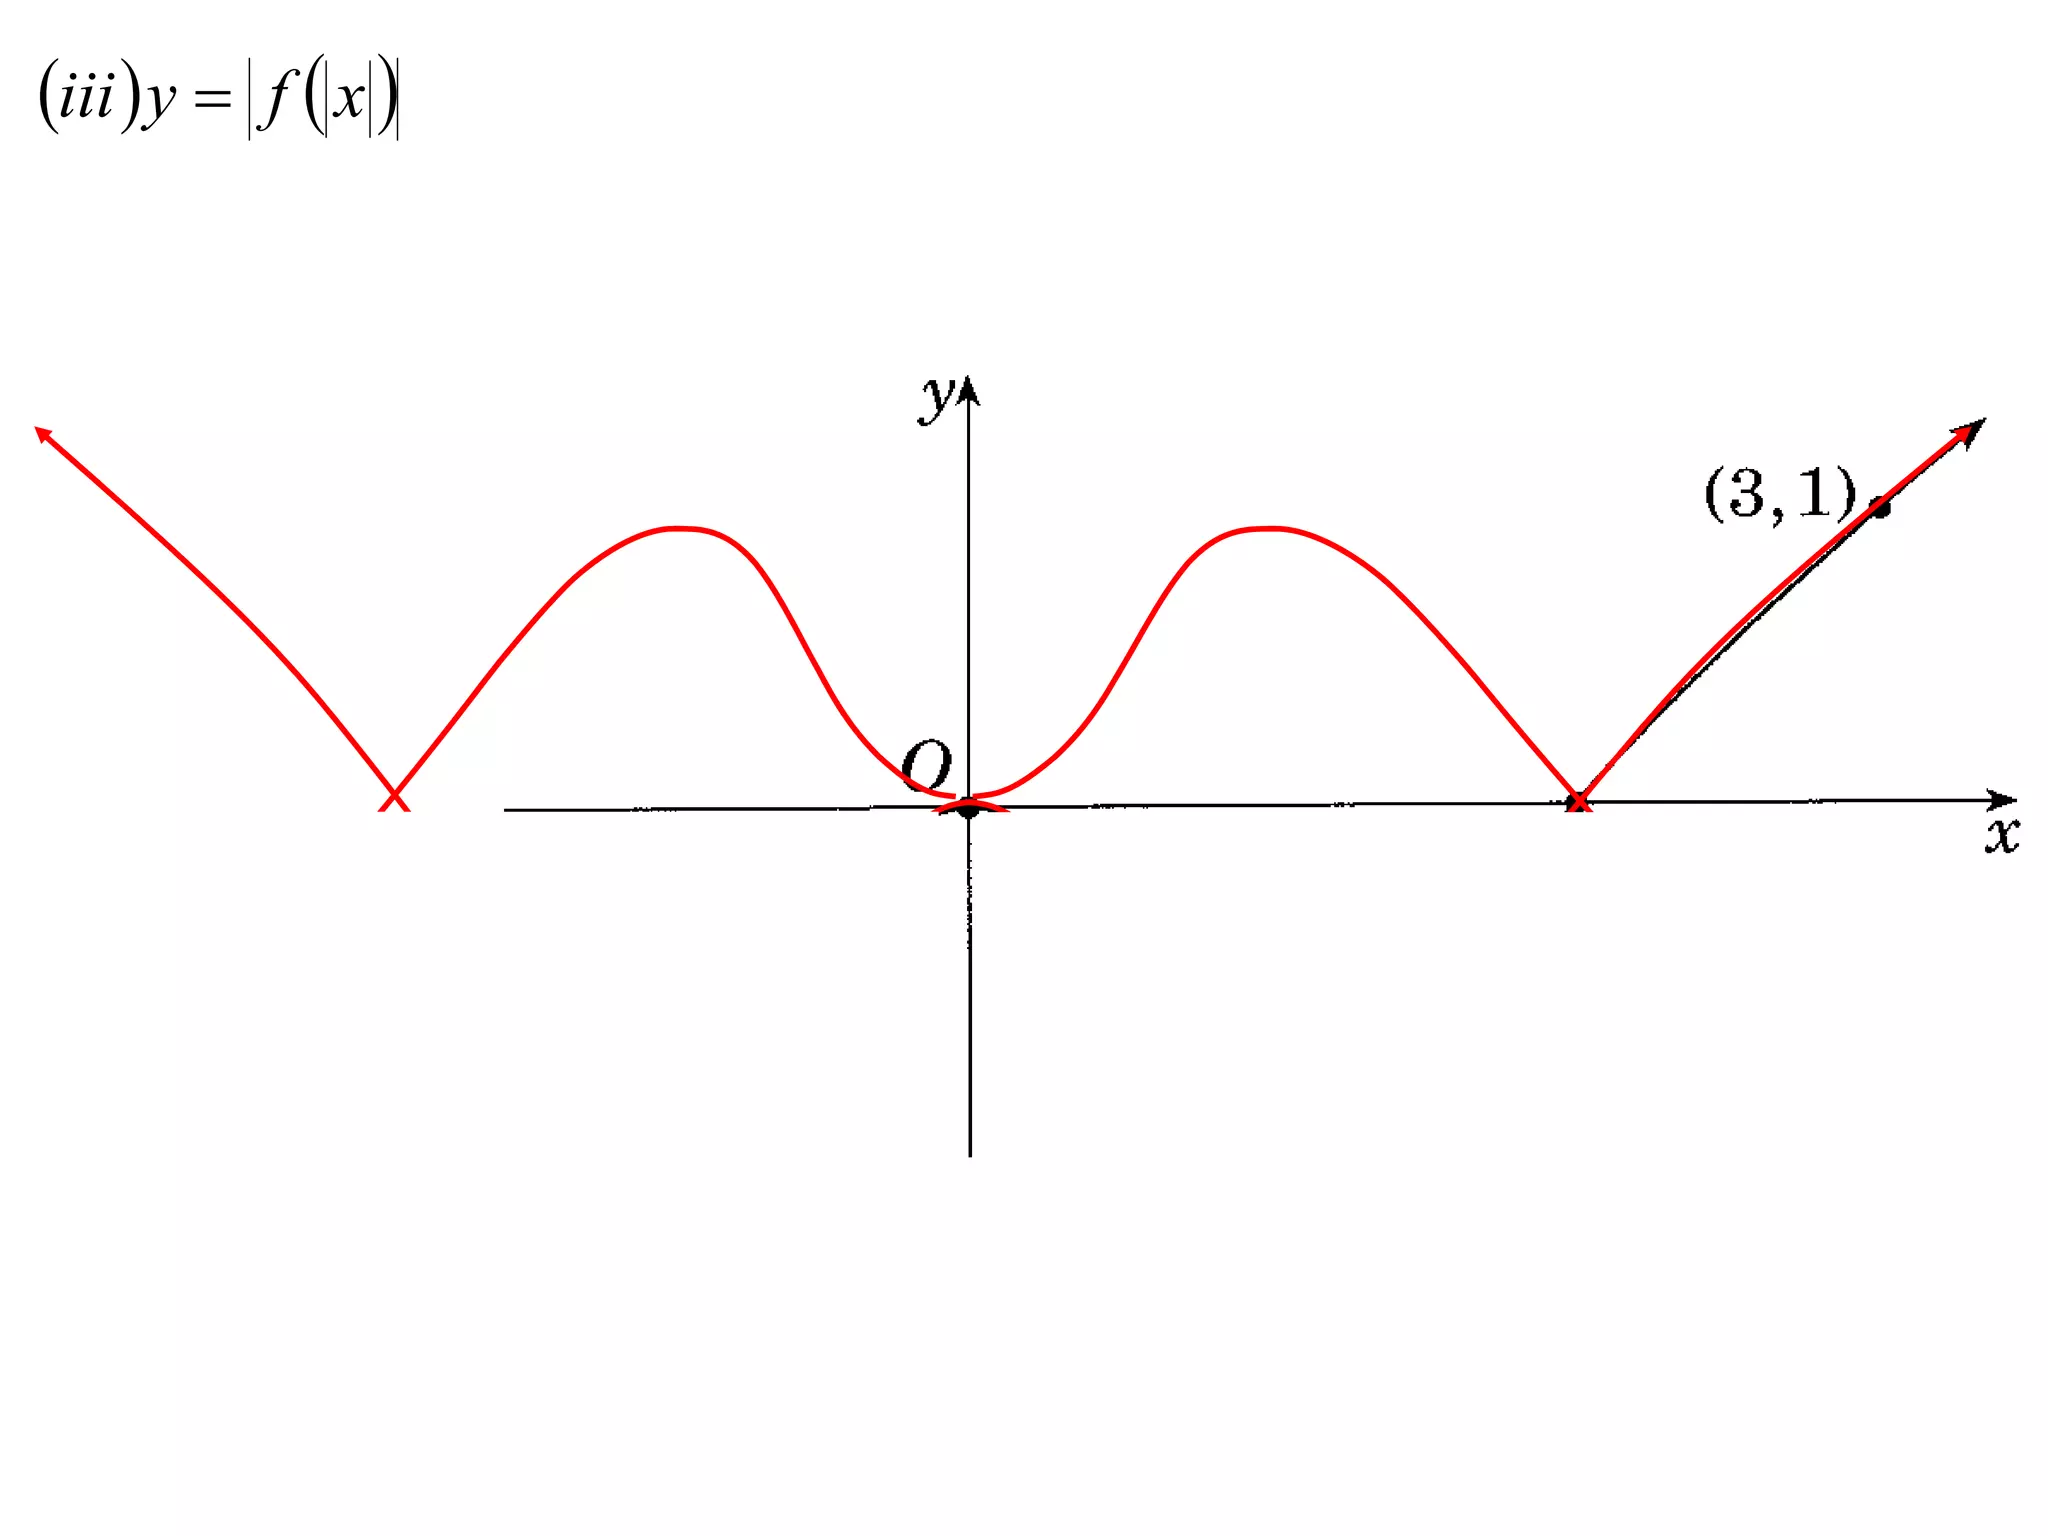
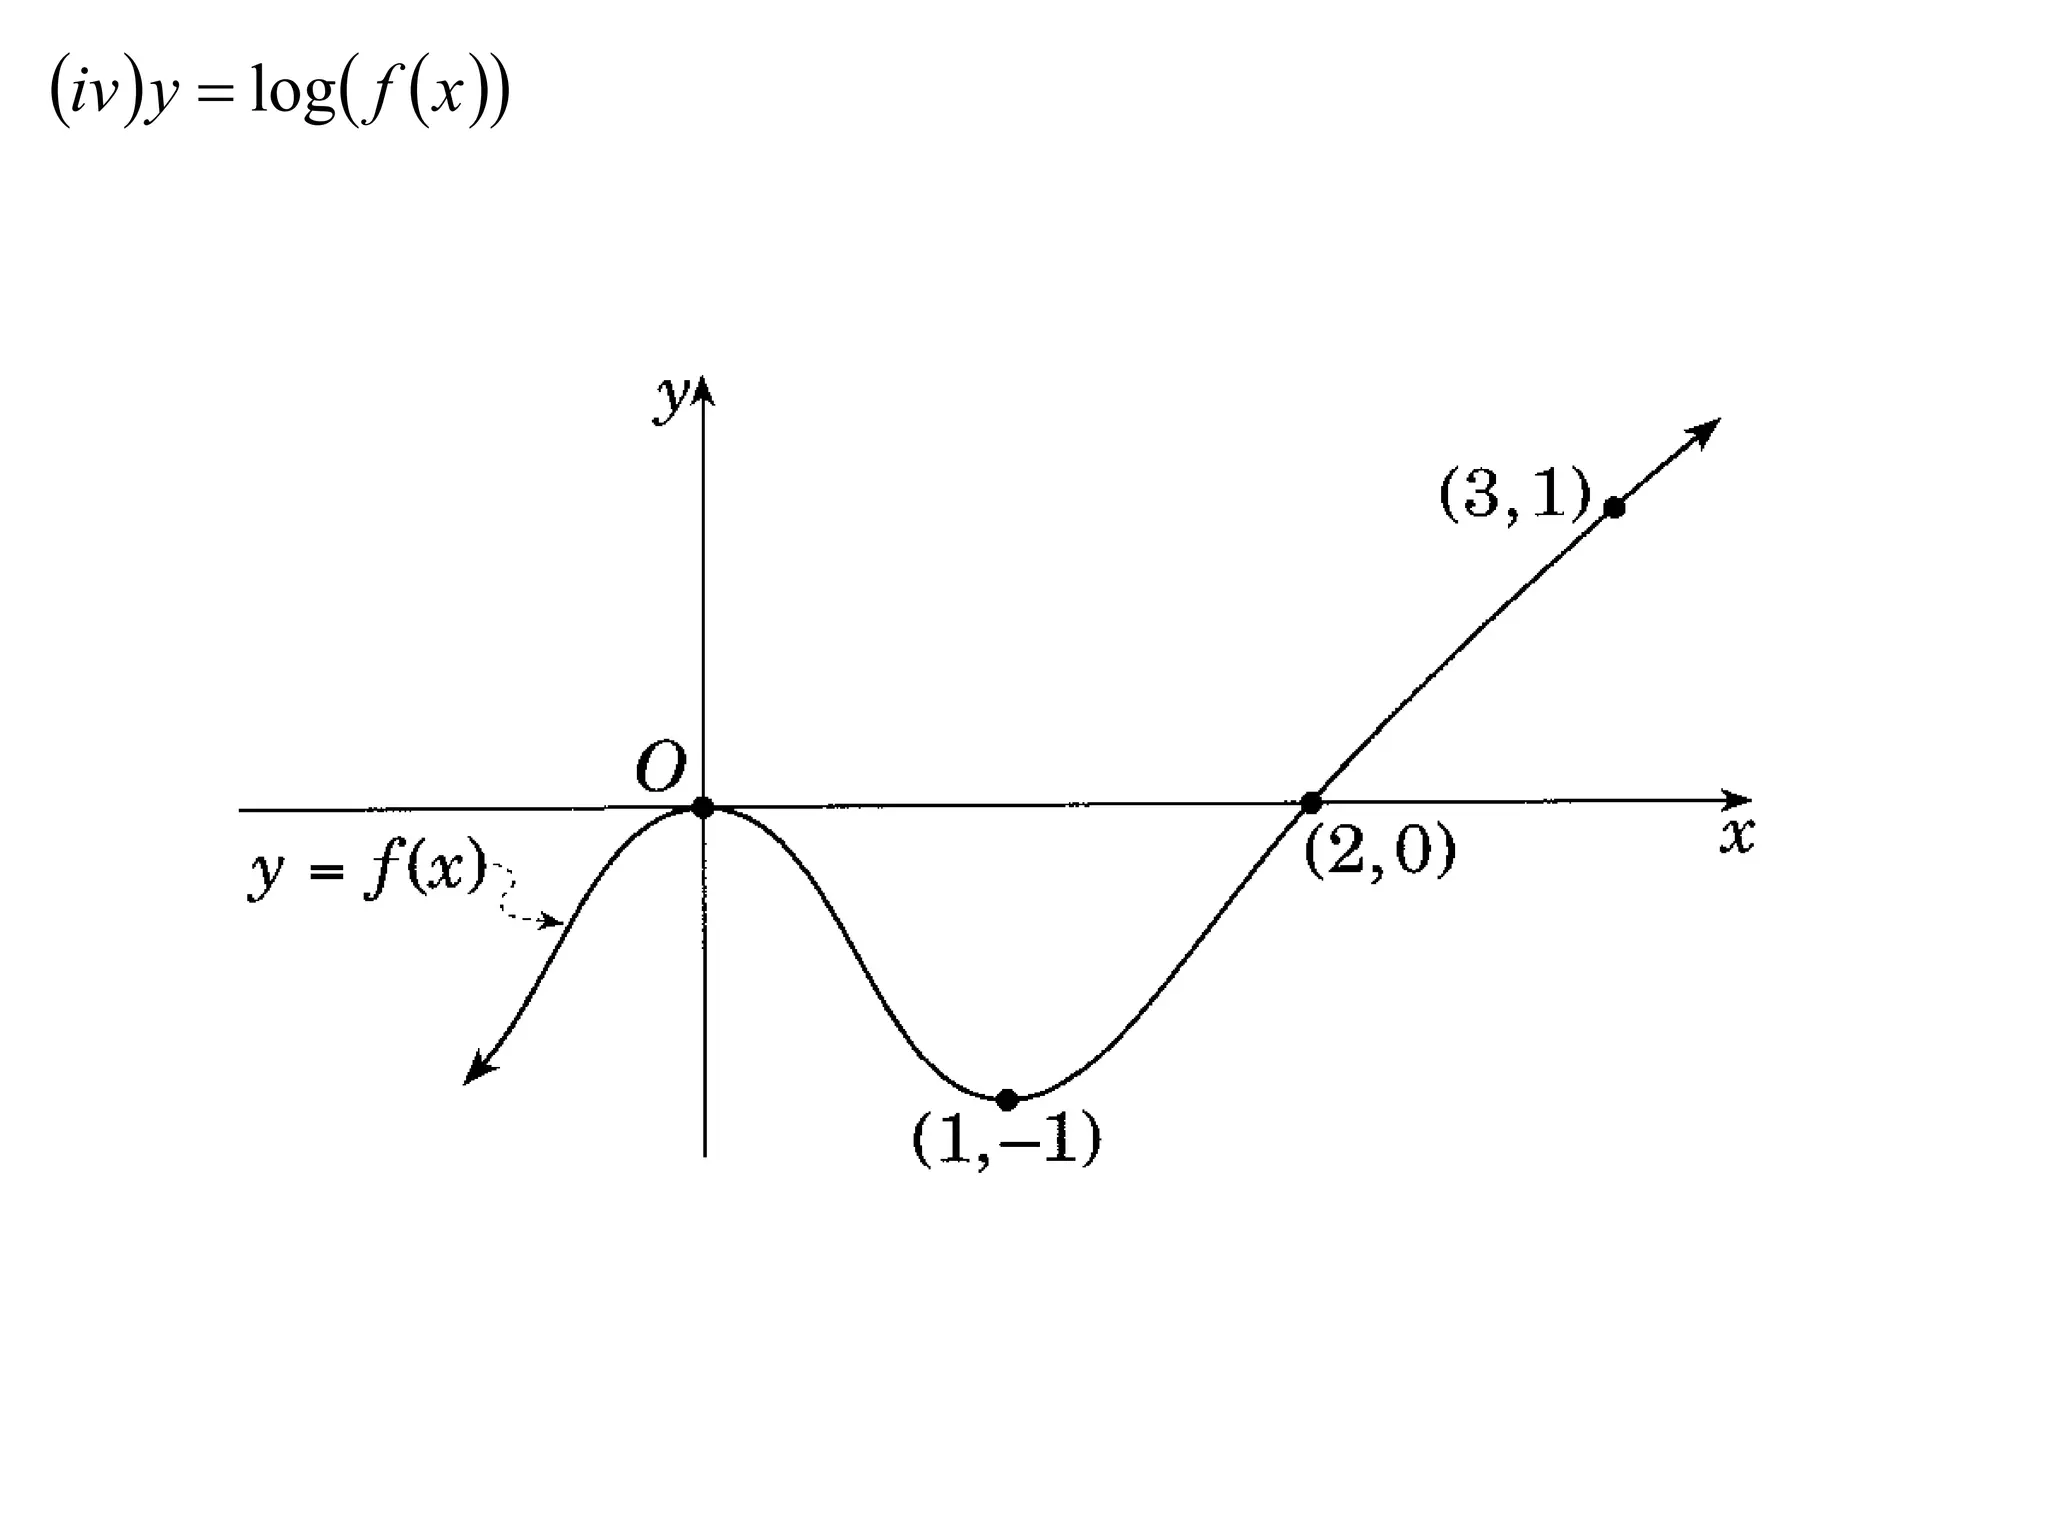
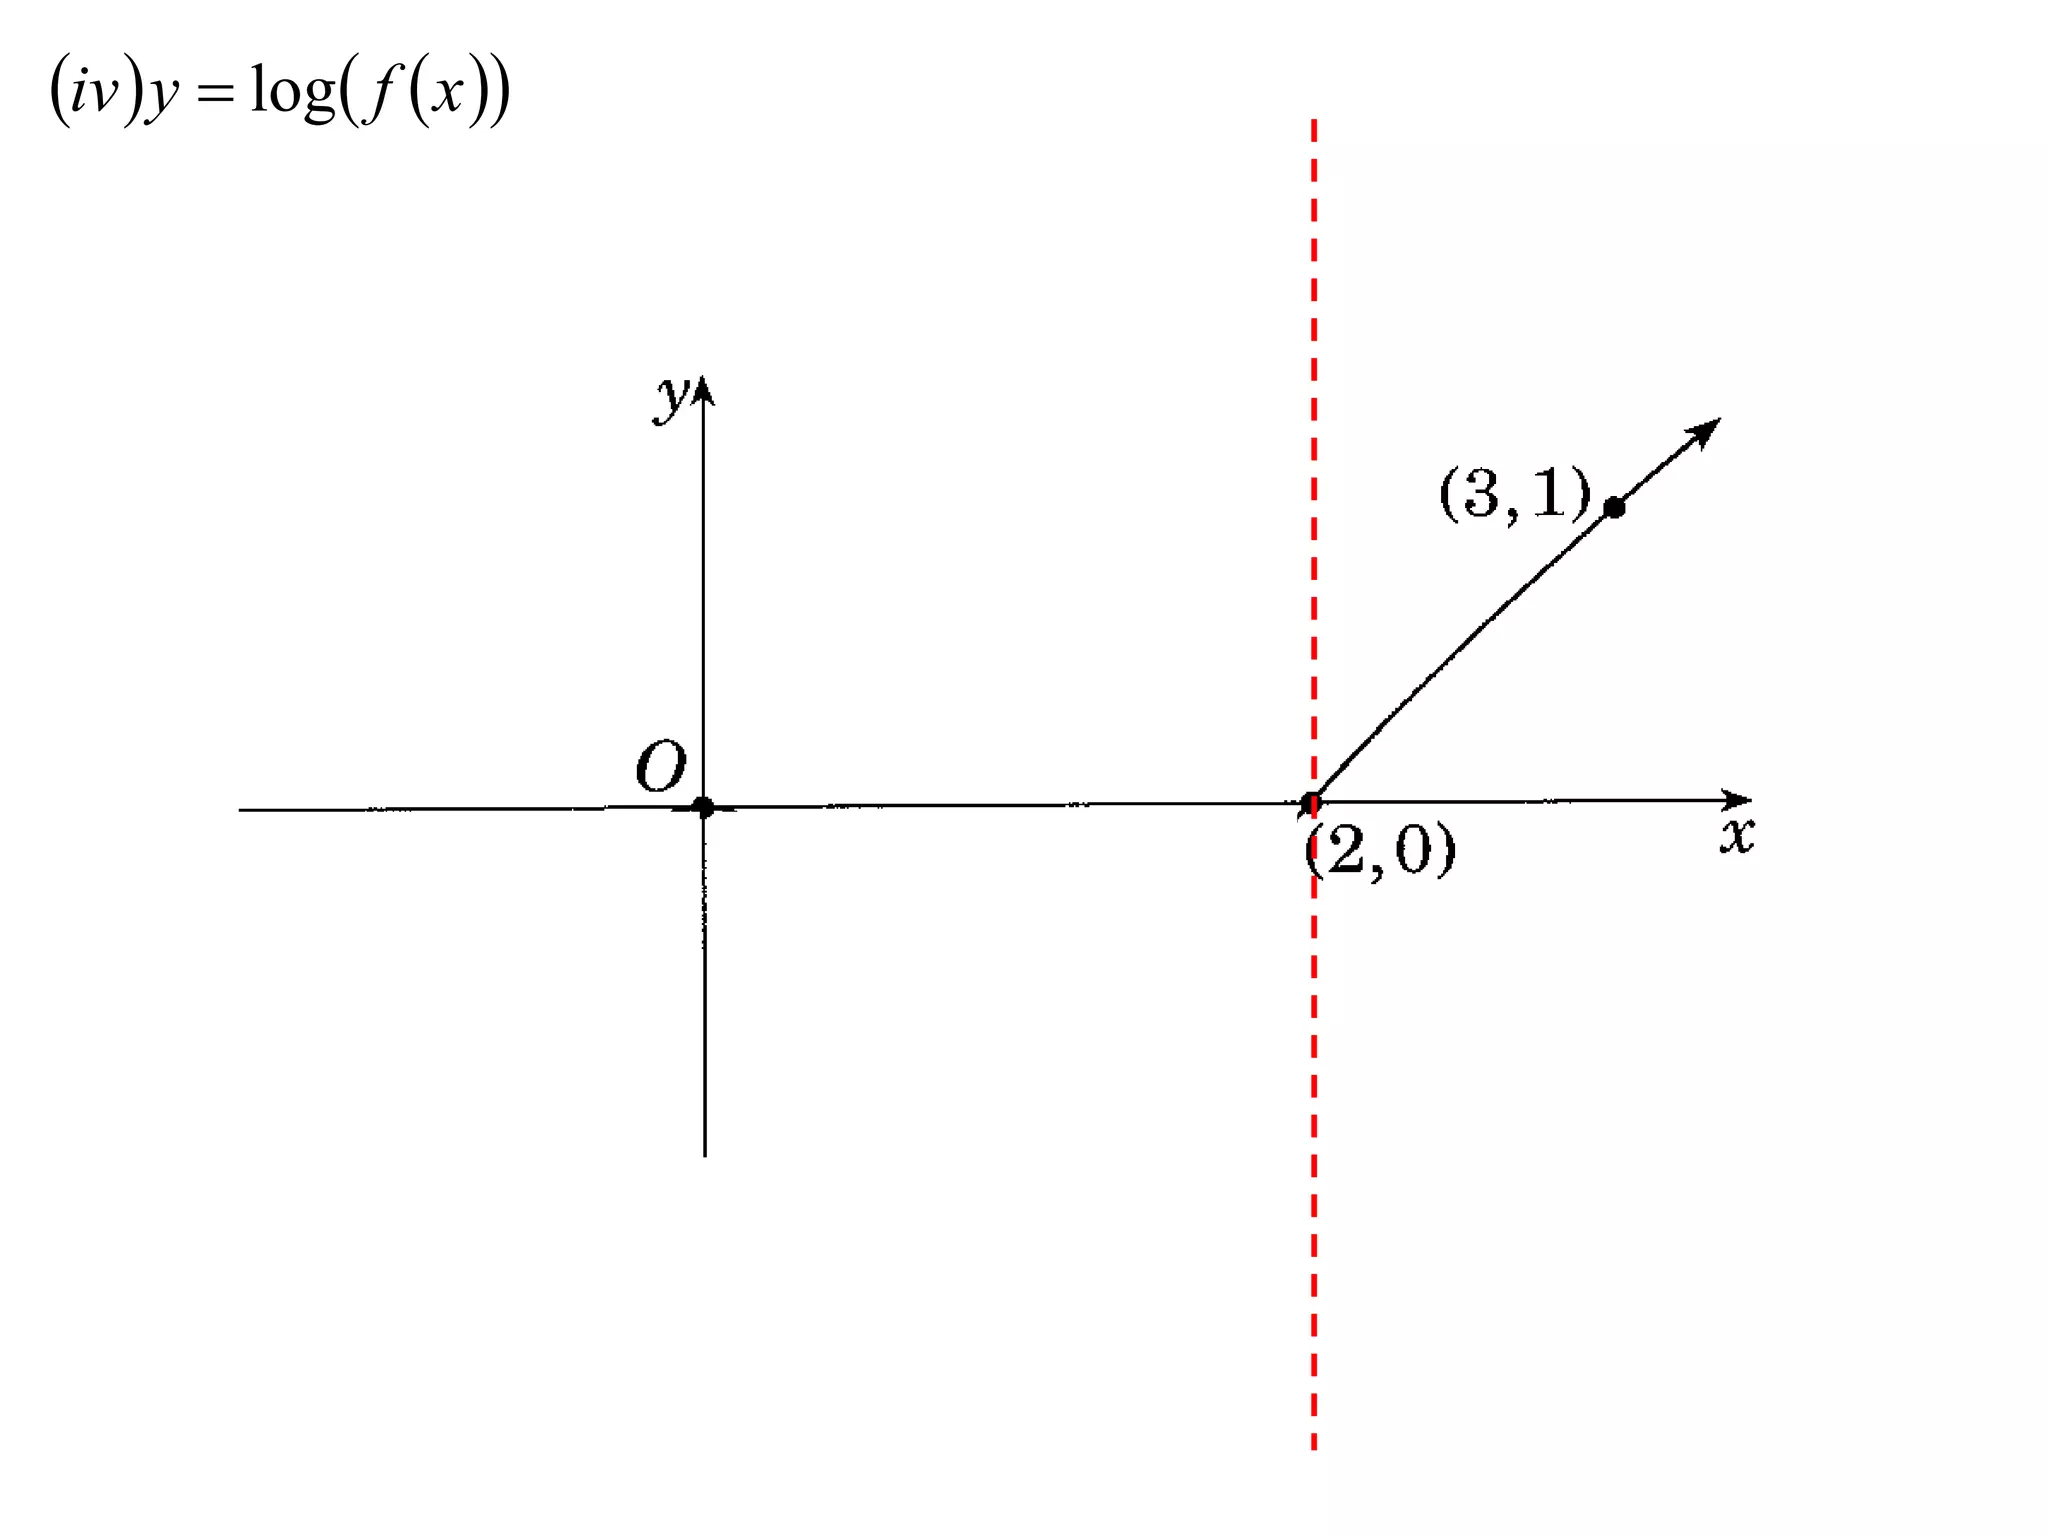
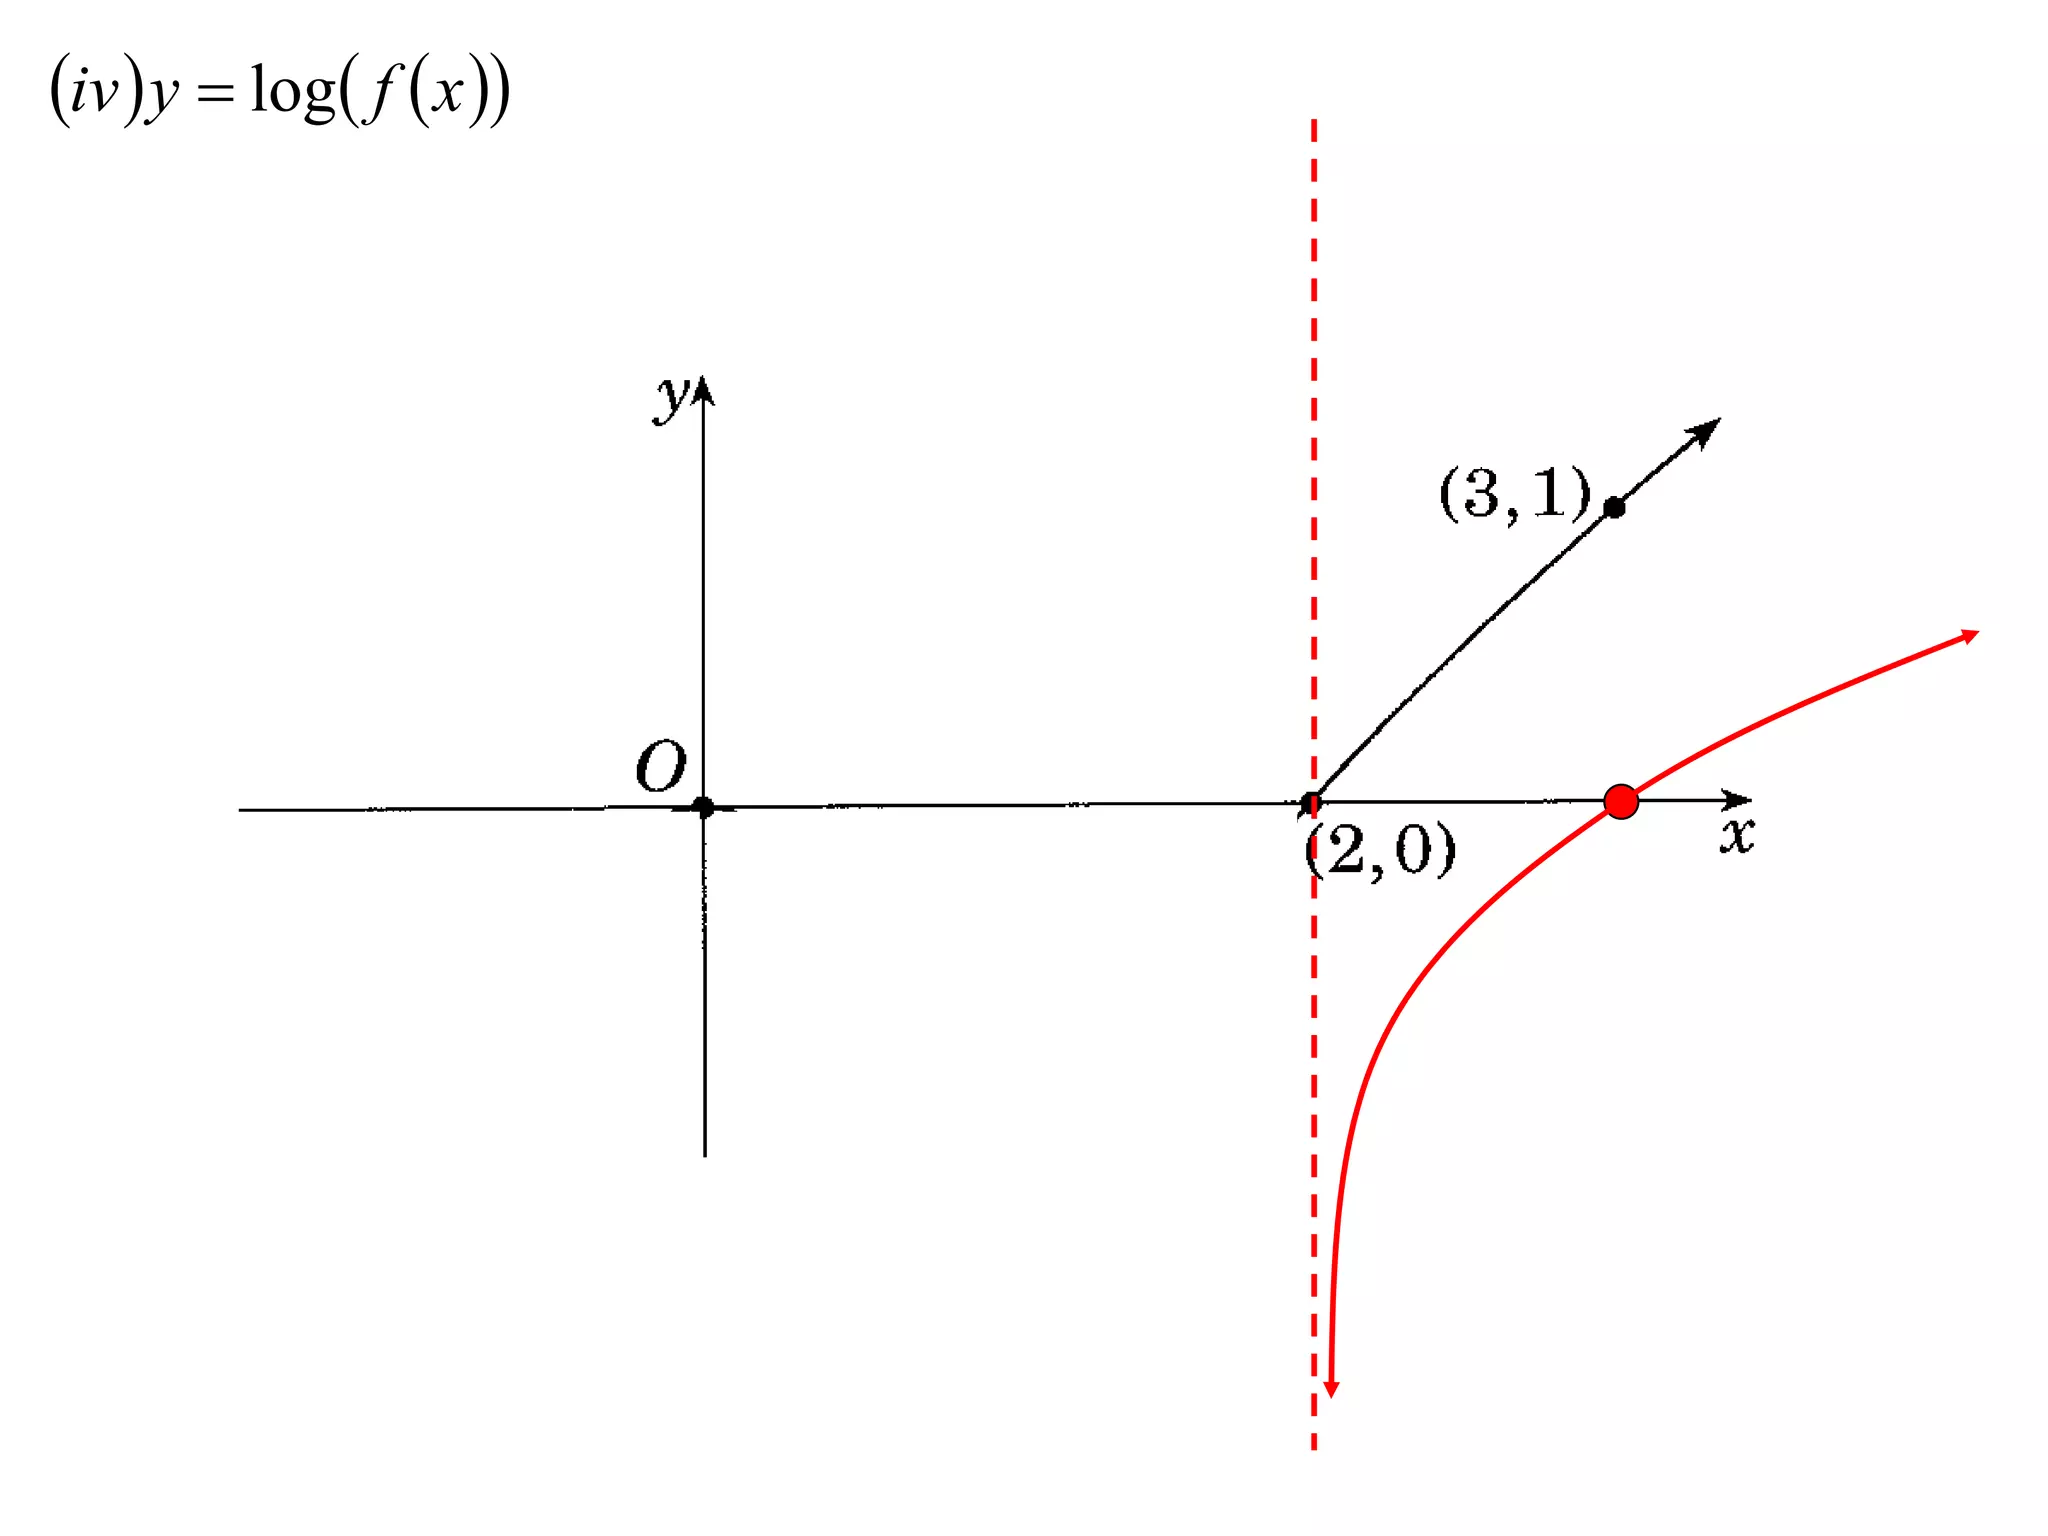
(J) Other Graphs
e.g. (i) (2003)
         The diagram shows the graph of y = f(x)


 Draw separate sketches of the graphs of the following;
1
i  y 
         f x
1
i  y 
         f x


                 1


                 -1
1
i  y 
         f x


                 1


                 -1
1
i  y 
         f x


                 1


                 -1
1
i  y 
         f x


                 1
                 1
                 2

                 -1
1
i  y 
         f x


                 1
                 1
                 2

                 -1
ii  y  f  x   f  x 


                              1


                              -1
ii  y  f  x   f  x 


                              1


                              -1
ii  y  f  x   f  x 


                              4


                              1


                              -1
ii  y  f  x   f  x 


                              4


                              1


                              -1
ii  y  f  x   f  x 


                              4


                              1


                              -1
iii  y   f  x 2


                         1


                         -1
iii  y   f  x 2


                         4


                         1


                         -1
iii  y   f  x 2


                         4


                         1


                         -1
iii  y   f  x 2


                         4


                         1


                         -1
iv  y  e f  x 


                      1


                      -1
iv  y  e f  x 
      y  f  x e f  x 


                               1


                               -1
iv  y  e f  x 
      y  f  x e f  x 
i.e. stationary
points remain


                               1


                               -1
iv  y  e f  x 
      y  f  x e f  x 
i.e. stationary
points remain                  e2


                               1


                               -1
iv  y  e f  x 
      y  f  x e f  x 
i.e. stationary
points remain                  e2


                               1


                               -1
iv  y  e f  x 
      y  f  x e f  x 
i.e. stationary
points remain                  e2


                               1


                               -1
iv  y  e f  x 
      y  f  x e f  x 
i.e. stationary
points remain                  e2


                               1


                               -1
iv  y  e f  x 
      y  f  x e f  x 
i.e. stationary
points remain                  e2


                               1


                               -1
e.g. (ii) (2002)
         The diagram shows the graph of y = f(x)


 Draw separate sketches of the graphs of the following;
1
i  y 
         f x
1
i  y 
         f x
1
i  y 
         f x
1
i  y 
         f x
1
i  y 
         f x
1
i  y 
         f x
1
i  y 
         f x
1
i  y 
         f x
ii  y 2  f  x 
ii  y 2  f  x 
ii  y 2  f  x 
ii  y 2  f  x 
ii  y 2  f  x 
iii  y  f  x 
iii  y  f  x 
iii  y  f  x 
iii  y  f  x 
iii  y  f  x 
iv  y  log f  x 
Exercise 1A; 9, 10, 11a, 12

Exercise 1B; 2bd, 9egh, 11ace, 13af, 14abf, 30, 32e, 34

X2 T07 07 other graphs (2011)