2016 Global Food Policy Report: Shifting the global food system
•
1 like•847 views

Presentation by Janet Ranganathan, Vice President for Science and Research at World Resources Institute (WRI), at the launch of the 2016 Global Food Policy Report on March 31, 2016 in Washington, DC

Recommended
Recommended
More Related Content
What's hot
What's hot (20)
Similar to 2016 Global Food Policy Report: Shifting the global food system
Similar to 2016 Global Food Policy Report: Shifting the global food system (20)
More from International Food Policy Research Institute (IFPRI)
More from International Food Policy Research Institute (IFPRI) (20)
Recently uploaded
Recently uploaded (20)
2016 Global Food Policy Report: Shifting the global food system
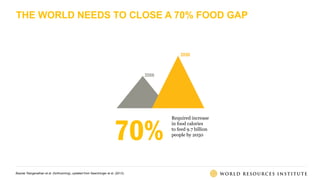
- 1. 70% Required increase in food calories to feed 9.7 billion people by 2050 THE WORLD NEEDS TO CLOSE A 70% FOOD GAP Source: Ranganathan et al. (forthcoming), updated from Searchinger et al. (2013).
- 2. Source: WRI analysis based on Bruinsma (2009) and Alexandratos and Bruinsma (2012). A MENU OF SOLUTIONS CAN HELP CLOSE THE FOOD GAP GLOBAL ANNUAL CROP PRODUCTION (KCAL TRILLION) 16,300 Available food (2006) Baseline availablefood needed (2050) 9,500 Reduce food loss& waste Shift diets Avoidbiofuel competitionfor crops& land Achieve replacement- levelfertility Increasecropland productivity ? Increase livestock& aquaculture productivity Expand onto low- environmental- opportunity-cost lands Reduceconsumption Increaseproduction ?
- 3. 0 10 20 30 40 50 60 70 80 90 100 ALL REGIONS CONSUME MORE PROTEIN THAN NEEDED G PROTEIN CONSUMED/CAPITA/DAY, 2009 Animal-based protein Plant-based protein Average daily protein requirement Source: GlobAgri model with source data from FAO (2015) and FAO (2011a). Width of bars is proportional to each region’s population. Average daily protein requirement of 50 g / day is based on an average adult body weight of 62 kg (Walpole et al. 2012) and recommended protein intake of 0.8 g / kg body weight / day (Paul 1989). Individuals’ energy requirements vary depending on age, sex, height, weight, pregnancy/lactation, and level of physical activity. India Asia (ex. China and India) Sub-Saharan Africa LatinAmerica(ex. Brazil) Fmr.SovietUnion China OECD(other) MiddleEastandNorthAfrica Brazil EuropeanUnion US&Canada
- 4. … AND DEMAND FOR ANIMAL-BASED PROTEIN IS PROJECTED TO GROW 80% BY 2050 United States European Union Brazil WORLD China India Indonesia Nigeria 0 10 20 30 40 50 60 70 80 1961 1970 1980 1990 2000 2010 2020 2030 2040 2050 Source: FAO (2015) for historical data 1961–2011, authors’ calculations based on Alexandratos and Bruinsma (2012) for 2050 projection, linear interpolation from 2012–2050. G ANIMAL-BASED PROTEIN AVAILABLE/CAPITA/DAY
- 5. ANIMAL-BASED FOODS ARE MORE RESOURCE-INTENSIVE THAN PLANT-BASED FOODS Compared to pulses (beans/peas/lentils), to produce a unit of edible protein… 1x 1x 2-3x3x 5x 2x 7x20x Pulses Pork/poultry Dairy Beef Land,GHG Water Sources: GlobAgri model (land use and greenhouse gas emissions), authors’ calculations from Mekonnen and Hoekstra (2011, 2012) (freshwater consumption).
- 6. WE ANALYSED SUCCESSFUL CONSUMPTION SHIFTS • Free Range Eggs • Laundry Detergent Compaction • Butter Alternatives • Fish Fingers • Low Alcohol Beer • CFL & LED Light bulbs • Milk Alternatives • Coffee Eco-Refills • Meat Alternatives • Shark Fin Soup in China • Organ meat in WWII America
- 7. WE CREATED A “SHIFT WHEEL” TO CHANGE CONSUMPTION