This document defines key statistical concepts:
- Statistics is the subject that deals with collecting, analyzing, and interpreting data. It can also refer to the data itself or summary measures calculated from samples.
- A population includes all individuals or objects with common characteristics being studied. A sample is a subset of a population selected to represent it.
- A parameter is a characteristic of the entire population, such as the population mean, which remains fixed. A statistic is a characteristic calculated from a sample, such as the sample mean, which can vary between samples.
Introducing Biostatistics
Objectives
A theend of the session the students should be able to:
Define Statistics, Population Sample,
Parameter, Statistic & their differences
2
3.
Definitions
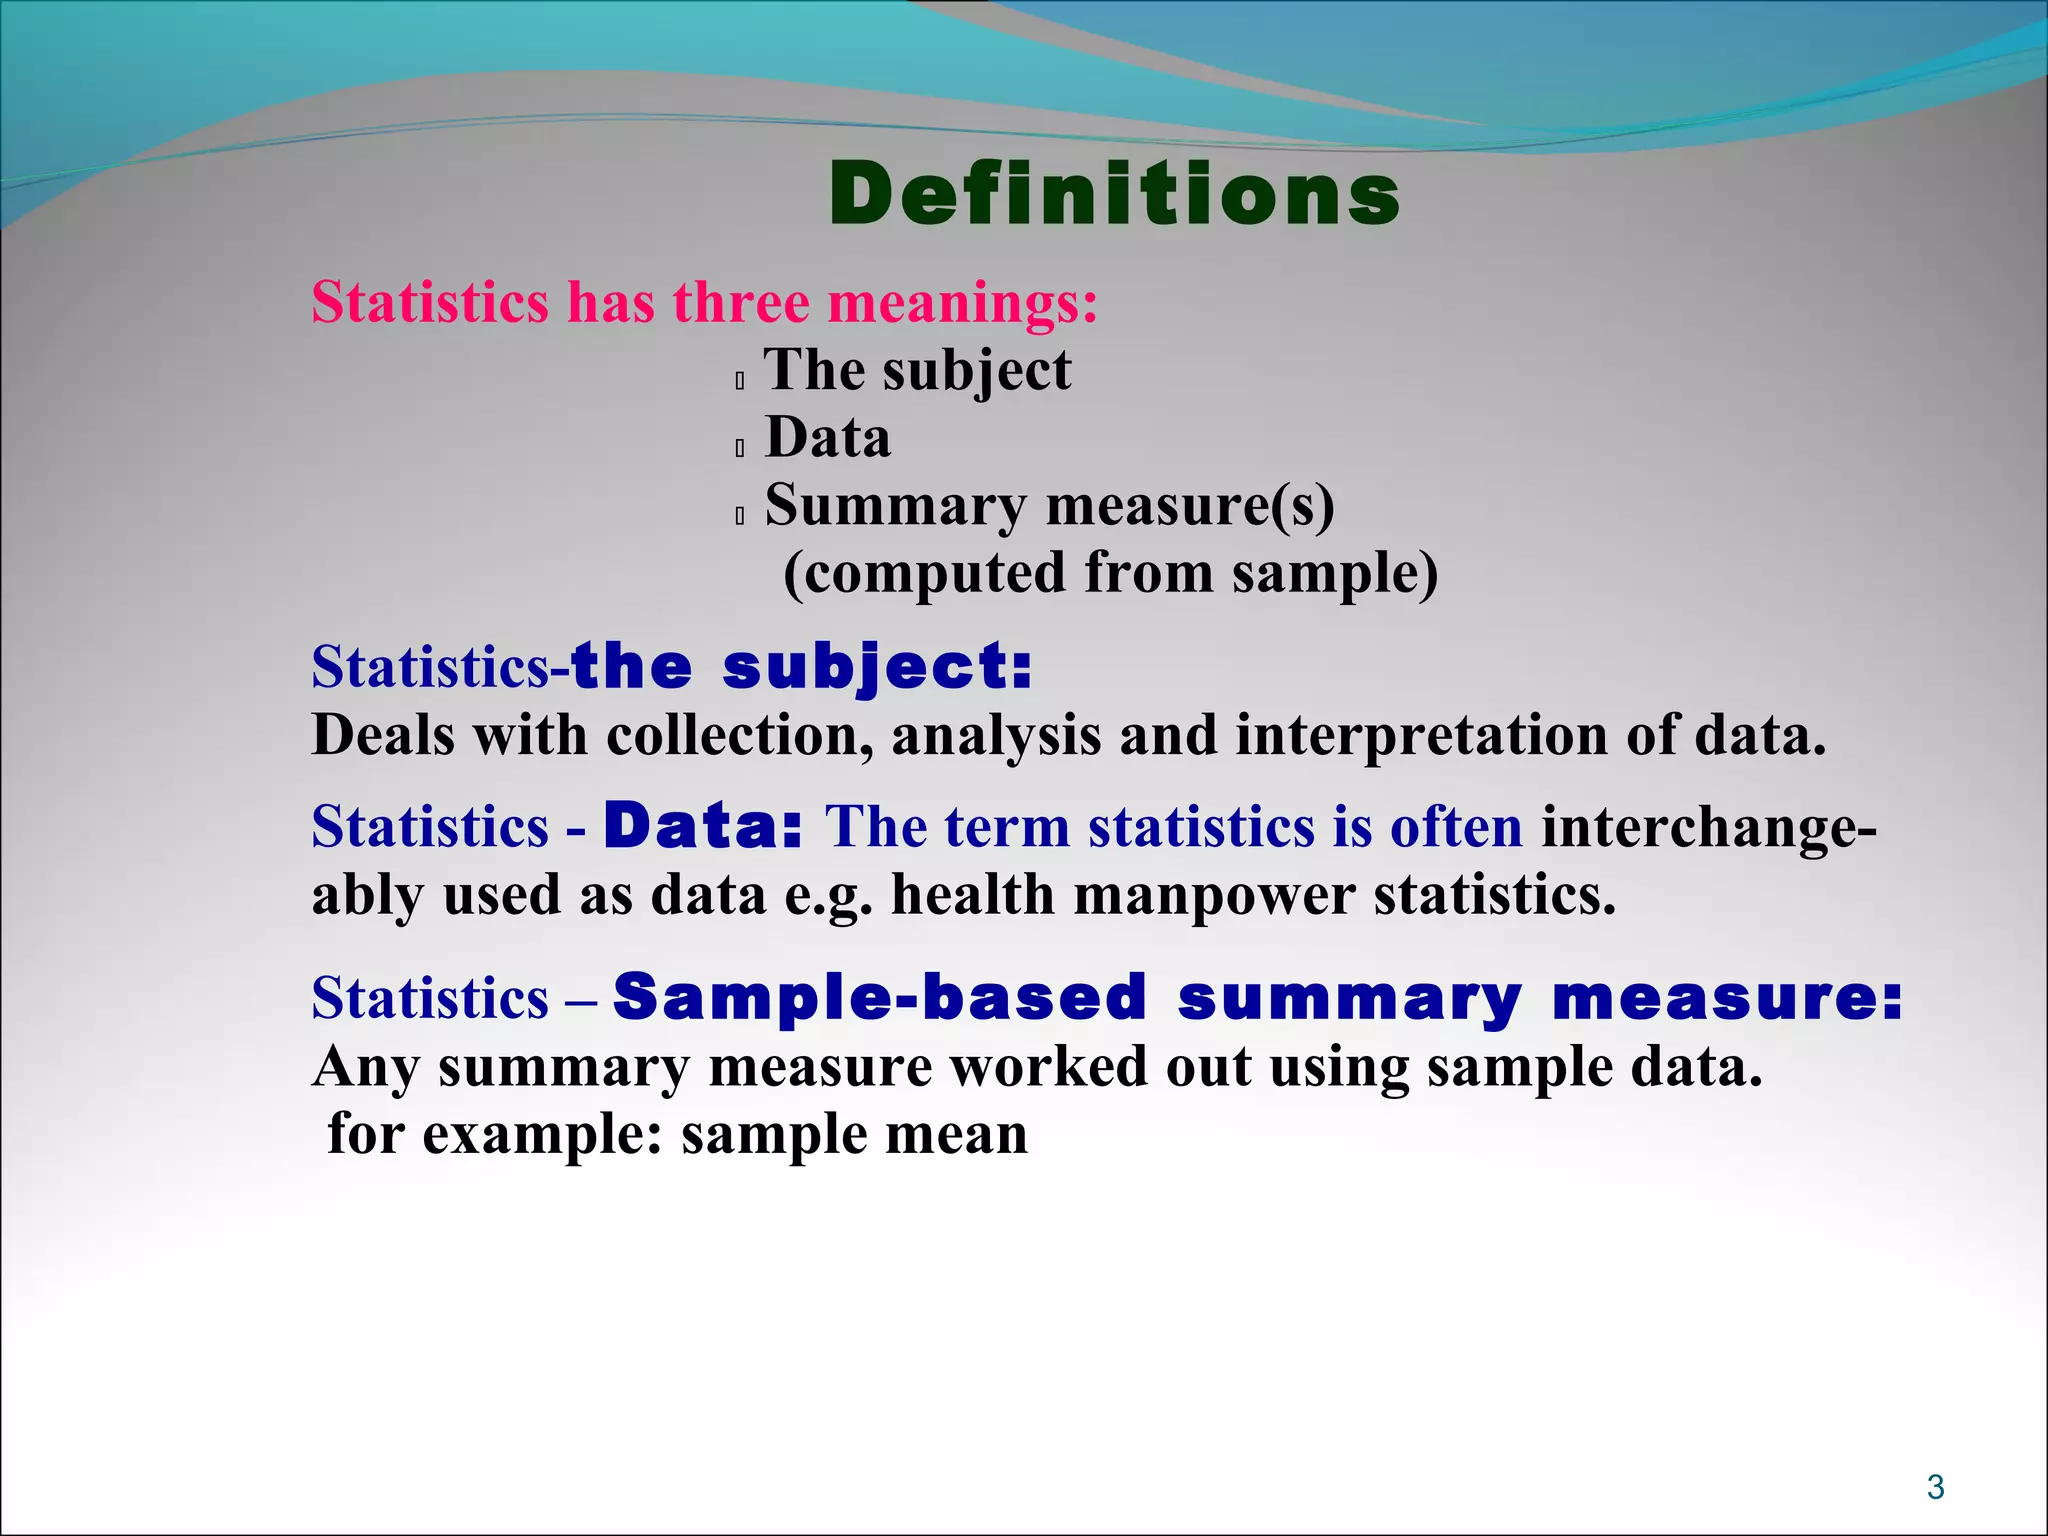
Statistics has threemeanings:
The subject
Data
Summary measure(s)
(computed from sample)
Statistics-the subject:
Deals with collection, analysis and interpretation of data.
Statistics - Data: The term statistics is often interchange-
ably used as data e.g. health manpower statistics.
Statistics – Sample-based summary measure:
Any summary measure worked out using sample data.
for example: sample mean
3
4.
Population
Definition:
A population isa complete set of individuals , objects , and
measurements having some common characteristics.
That is, A population consists of everything or everyone being studied
in an inference procedure. Populations can be large in size, although
this is not necessary. What is important is that a population includes
all of what we are curious about.
Population is denoted by N
4
5.
Example:
If we wantto know the mean weight of all 20 year olds in the
DIU, then the population is, all students who are 20 years old in
the DIU.
If we want to determine the mean I.Q. score of all ten year olds
in Bangladesh, then the population is all ten year old who are in
Bangladesh.
Limitations:
Although the population is what we wish to study, it is very
rare to be able to perform a census of every individual member
of the population. Due to constraints of resources it is nearly
impossible to perform a measurement on every subject in a
population.
5
6.
Sample
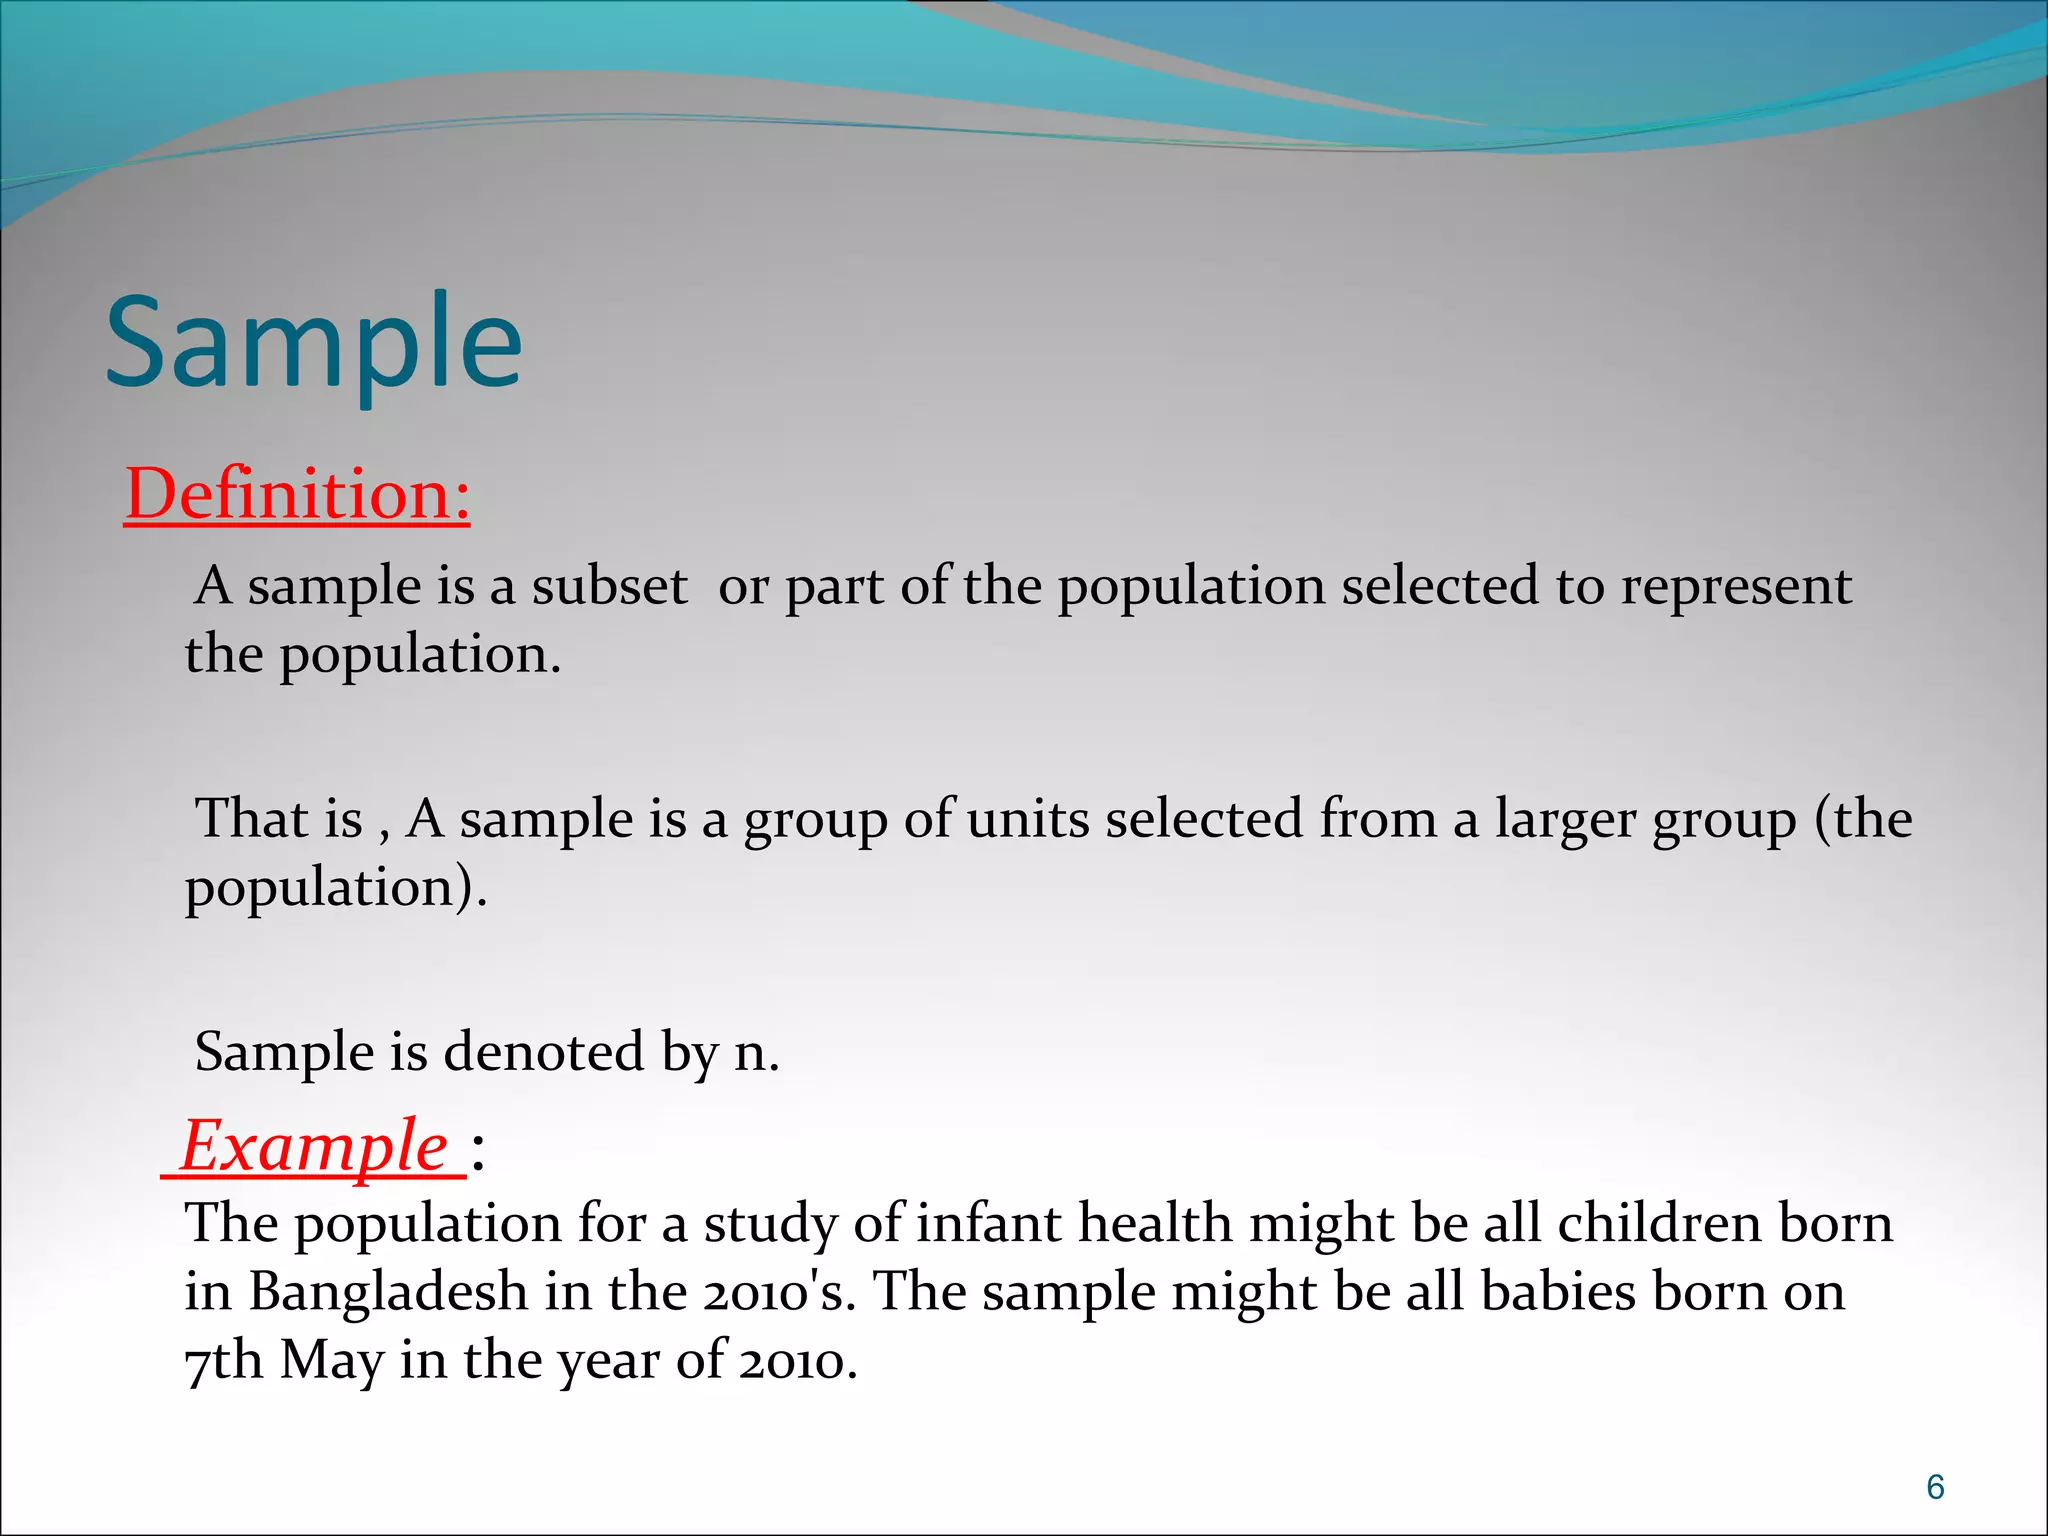
Definition:
A sample isa subset or part of the population selected to represent
the population.
That is , A sample is a group of units selected from a larger group (the
population).
Sample is denoted by n.
Example :
The population for a study of infant health might be all children born
in Bangladesh in the 2010's. The sample might be all babies born on
7th May in the year of 2010.
6
7.
Sample : Partof a population
Population: Totality of all the units
Unit : Smallest entity that has the
Characteristics under study
Symbols representing population and sample
Characteristics population sample
Size N n
Variable X X
Data set x x
7
8.
Population vs. Sample
PopulationSample
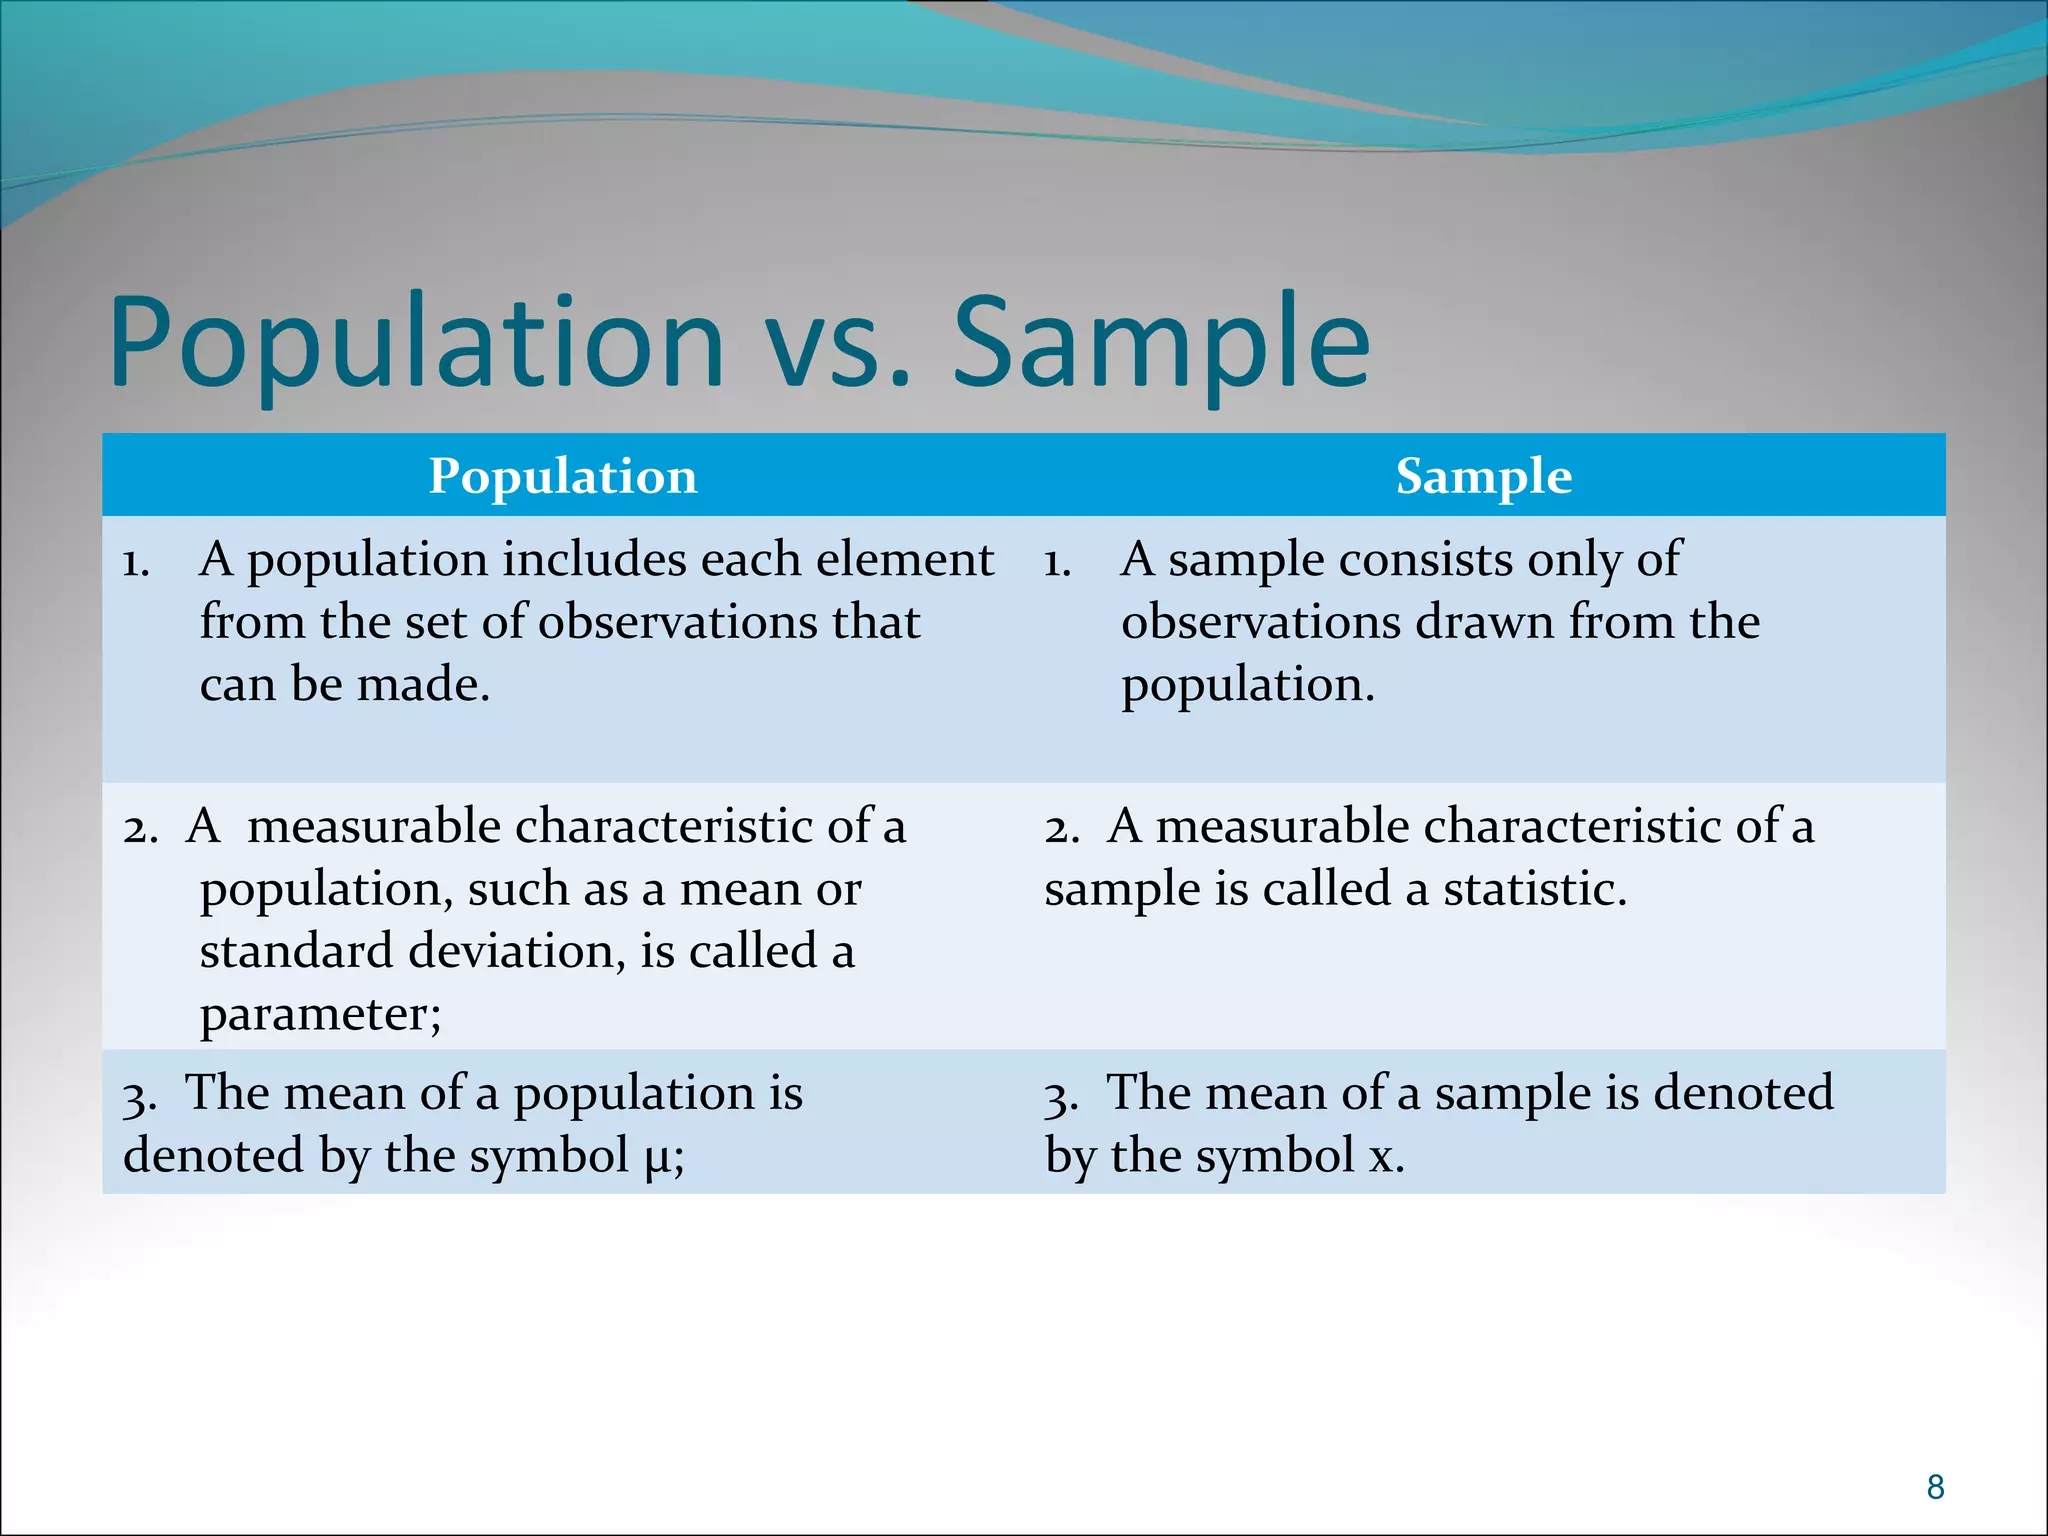
1. A population includes each element
from the set of observations that
can be made.
1. A sample consists only of
observations drawn from the
population.
2. A measurable characteristic of a
population, such as a mean or
standard deviation, is called a
parameter;
2. A measurable characteristic of a
sample is called a statistic.
3. The mean of a population is
denoted by the symbol μ;
3. The mean of a sample is denoted
by the symbol x.
8
9.
Parameter
Definition:
A parameter isa value, usually unknown (and which therefore has to
be estimated), used to represent a certain population characteristic.
Within a population, a parameter is a fixed value which does not vary.
That is , a population characteristics is called Parameter.
For example, the population mean is a parameter that is often used to
indicate the average value of a quantity.
Population mean is denoted by μ.
9
10.
statistic
Definition
A statistic isa quantity that is calculated from a sample of data.
It is used to give information about unknown values in the
corresponding population.
For example, the average of the data in a sample is used to give
information about the overall average in the population from which
that sample was drawn.
It is possible to draw more than one sample from the same
population and the value of a statistic will in general vary from sample
to sample.
10
11.
Parameter vs. Statistic
ParameterStatistic
1. A measurable characteristics of
population
1. A measurable characteristics of
sample
2. Constant 2. Variable
3 Usually unknown 3. It can be calculated.
11