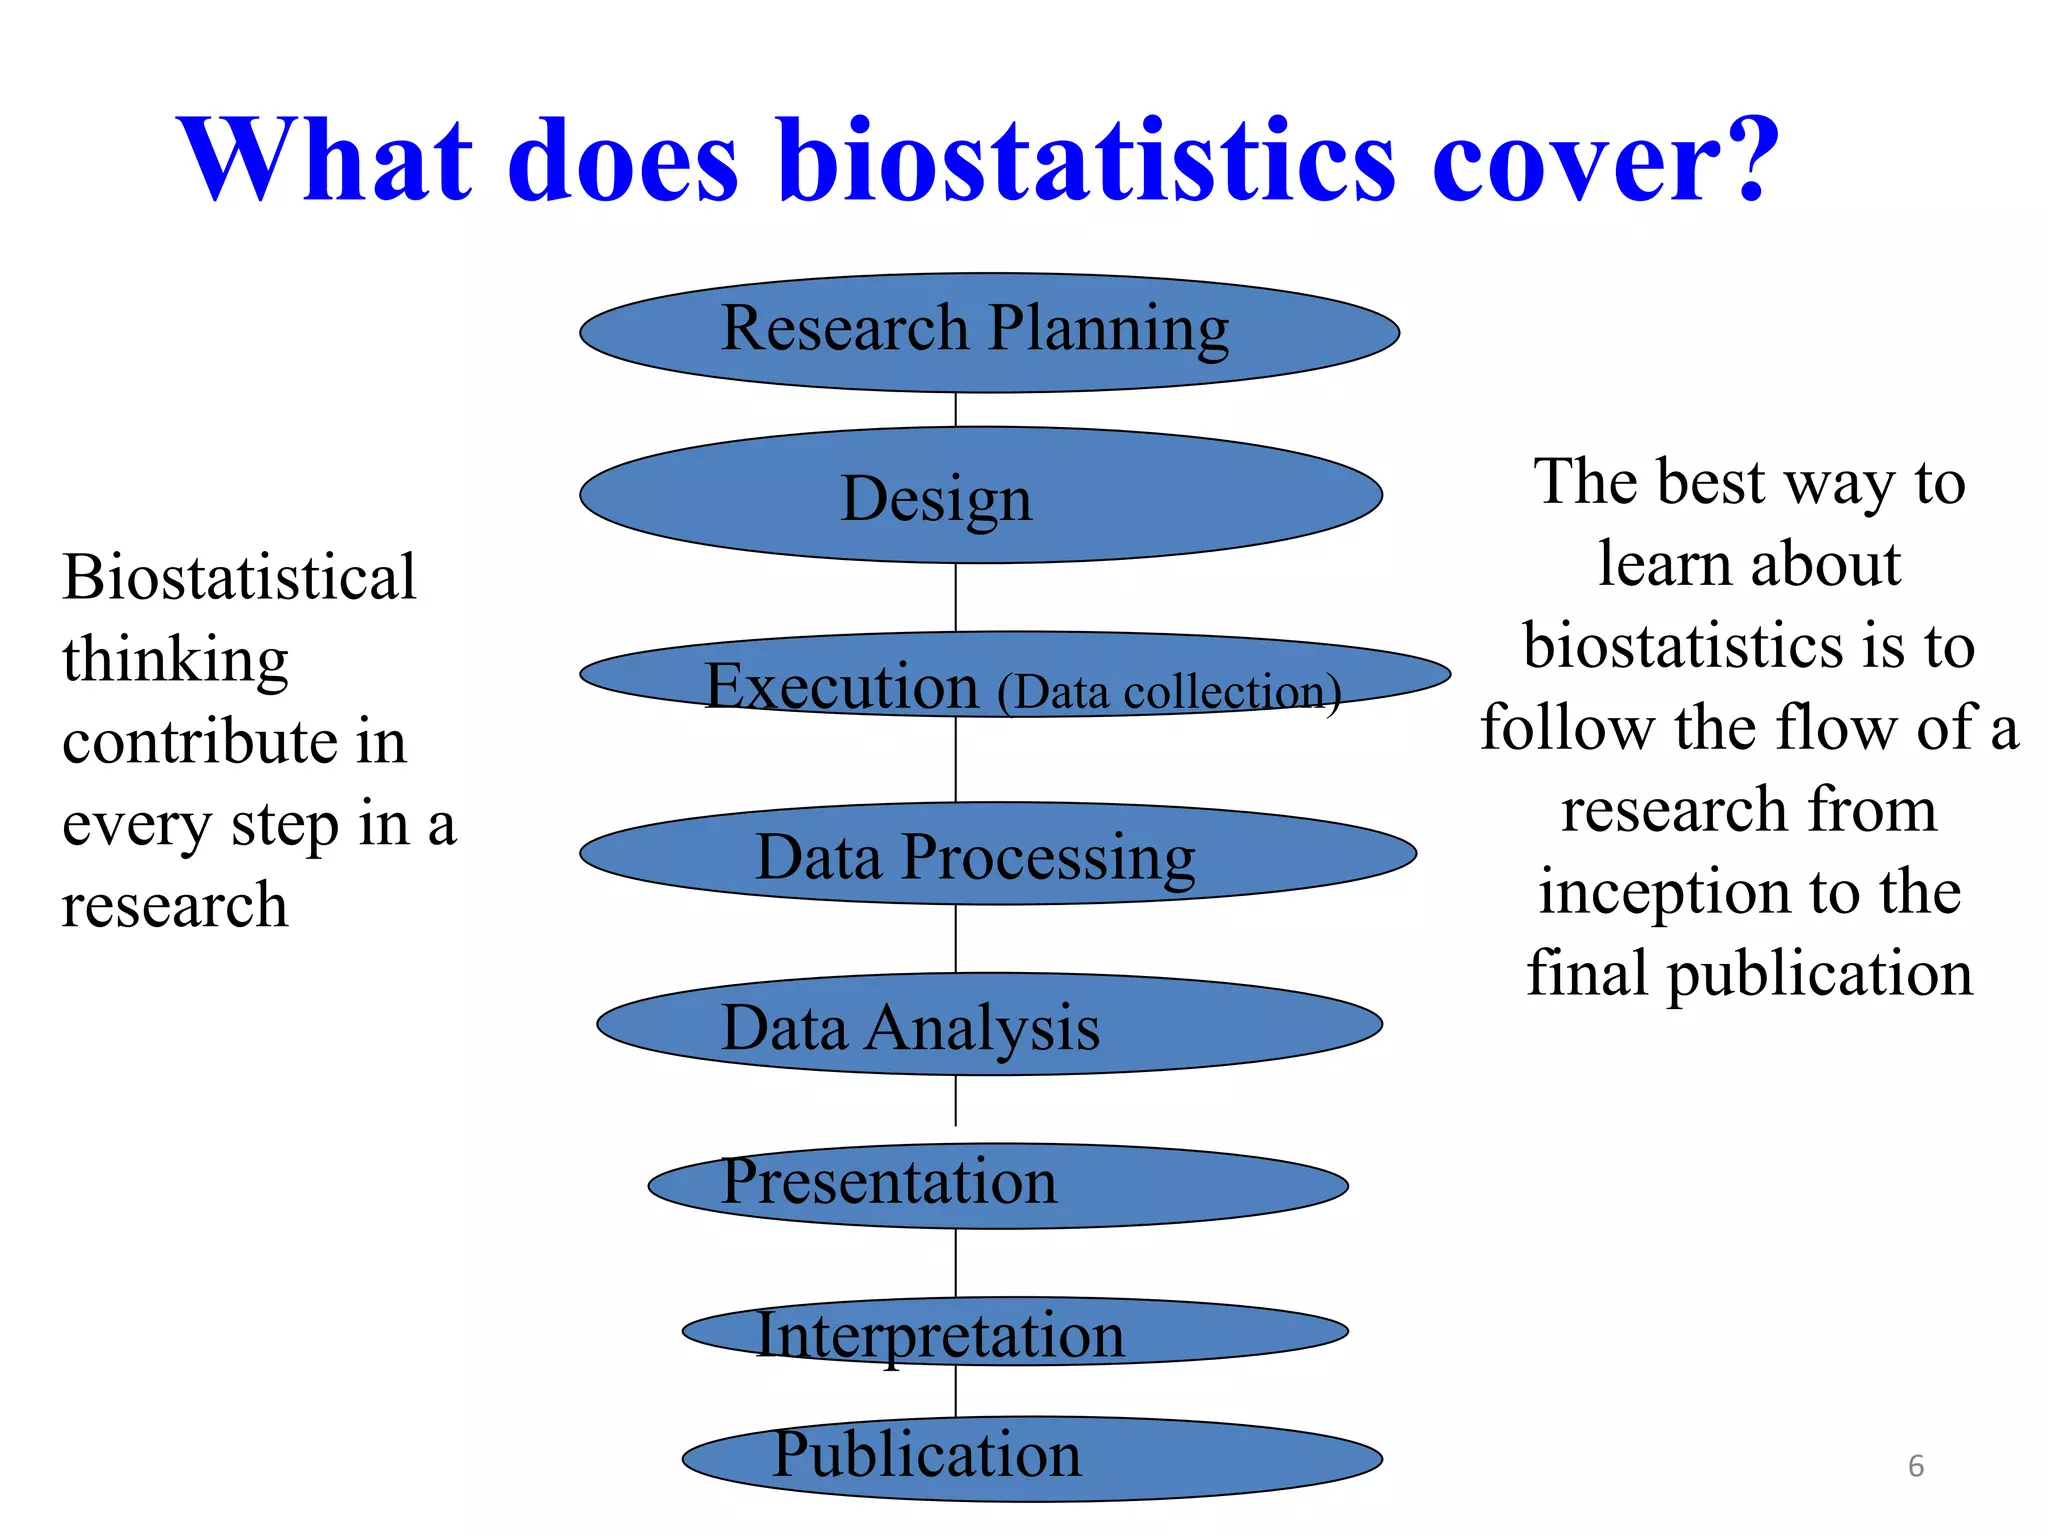
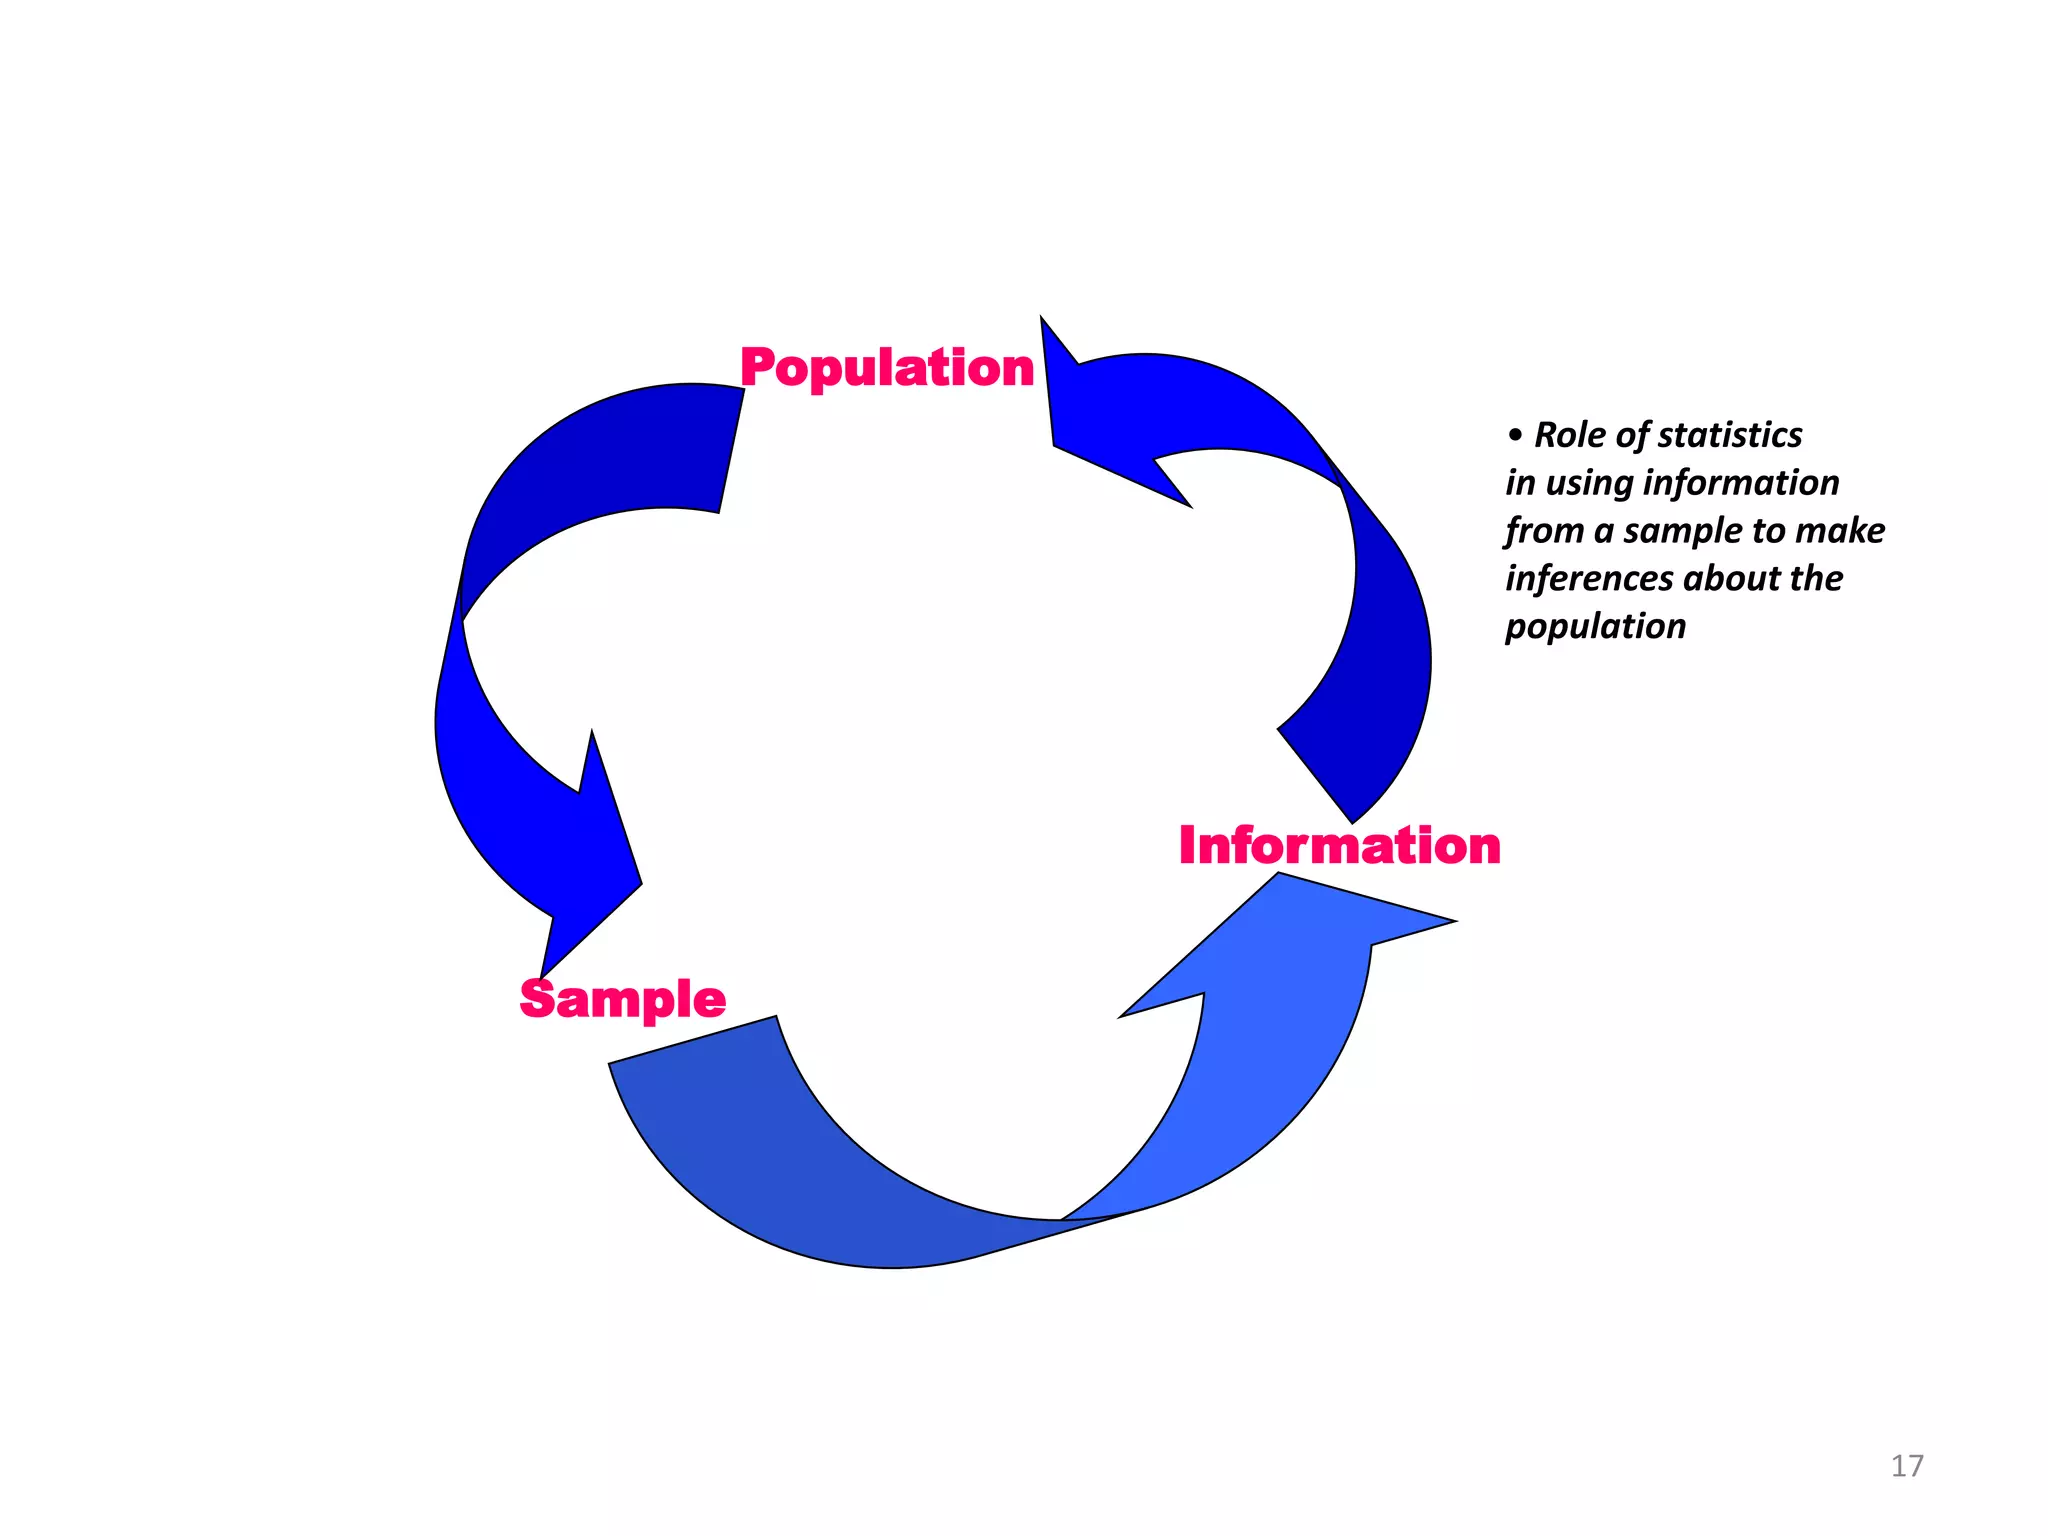
CHAPTER ONE
INTRODUCTION TO STATISTICS
2
Introduction
• What is statistics?
• Statistics: A field of study concerned with:
– collection, organization, analysis, summarization
and interpretation of numerical data, &
– the drawing of inferences about a body of data
when only a small part of the data is observed.
• Statistics helps us use numbers to
communicate ideas
 Biostatistics: The application of statistical
methods to the fields of biological and
medical sciences.
 Concerned with interpretation of biological
data & the communication of information
derived from these data
 Has central role in medical investigations
3
4
Importance of biostatistics in health
sciences
• Provide methods of organizing information
• Assessment of health status
• Health program evaluation
• Resource allocation
• Evaluation of magnitude of association
– Strong vs. weak association between exposure
and outcome
5
• Assessing risk factors
– Cause & effect relationship
• Evaluation of a new vaccine or drug
– What can be concluded if the proportion of
people free from the disease is greater among the
vaccinated than the unvaccinated?
– How effective is the vaccine (drug)?
– Is the effect due to chance or some bias?
• Drawing of inferences
– Information from sample to population
Importance of biostatistics in health
science
6
What does biostatistics cover?
Research Planning
Design
Execution (Data collection)
Data Processing
Data Analysis
Presentation
Interpretation
Publication
Biostatistical
thinking
contribute in
every step in a
research
The best way to
learn about
biostatistics is to
follow the flow of a
research from
inception to the
final publication
7
Research Design
• We can not study all subjects (all pregnant
women, or all people) living in a given
geographical area
– Sampling technique
– Inclusion/exclusion criteria
– Sample size calculation
– Study design
– Method of data collection
– Etc
8
Analysis
• Analysis part is the major part of learning
about biostatistics
– There are dozens of different methods of
analysis, which makes difficult the choice of the
correct method for a particular case
– It is necessary to consider the philosophy that
underlies all methods of analysis:
• Use data from a sample to draw inference about a
wider population
9
Interpretation
• Interpretation of results of statistical
analysis is not always straightforward, but is
simpler when the study has a clearer aim
• If the study has been well designed and
correctly analyzed the interpretation of
results can be fairly simple
Types of Statistics
1. Descriptive statistics:
• Ways of organizing and summarizing data
• Helps to identify the general features and
trends in a set of data and extracting useful
information
• Example: tables, graphs, numerical summary
measures
10
Types of Statistics
2. Inferential statistics:
• Methods used for drawing conclusions about
a population based on the information
obtained from a sample of observations
drawn from that population
• Example: point estimation, interval estimation
( e.g. confidence interval), comparison of two
or more means or proportions, hypothesis
testing, etc.
11
12
Data
• Data are numbers which can be measurements or
can be obtained by counting
• The raw material for statistics
• Can be obtained from:
– Routinely kept records, literature
– Surveys
– Counting
– Experiments
– Reports
– Observation
– Etc
The statistical data may be classified under two
categories, depending upon the sources.
1. Primary data: collected from the items or individual
respondents directly by the researcher for the
purpose of a study.
2. Secondary data: which had been collected by
certain people or organization, & statistically
treated and the information contained in it is used
for other purpose by other people
13
14
Population and Sample
• Population:
– Refers to any collection of objects
• Target population:
– A collection of items that have something in common
for which we wish to draw conclusions at a particular
time.
• E.g., All hospitals in Ethiopia
– The whole group of interest
15
Population and Sample
Study Population:
• The subset of the target population that has at least
some chance of being sampled
• The specific population group from which samples
are drawn and data are collected
16
Population and Sample
Sample:
. A subset of a study population, about which
information is actually obtained.
. The individuals who are actually measured and
comprise the actual data.
17
Population
Sample
Information
• Role of statistics
in using information
from a sample to make
inferences about the
population
18
Sample
Study Population
Target Population
E.g.: In a study of the prevalence
of HIV among adolescents in
Ethiopia, a random sample of
adolescents in Lideta Kifle
Ketema of AA were included.
Target Population: All
adolescents in Ethiopia
Study population: All
adolescents in Addis Ababa
Sample: Adolescents in Lideta
Kifle Ketema who were included
in the study
19
Generalizability
• Is a two-stage procedure:
• We need to be able to generalize from:
– the sample to the study population, &
– then from the study population to the target
population
• If the sample is not representative of the
population, the conclusions are restricted to
the sample & don’t have general applicability
20
Collect information
from a relatively
SMALL sample
Draw conclusions
about a rather
LARGE population
21
Parameter and Statistic
• Parameter: A descriptive measure computed
from the data of a population.
– E.g., the mean (µ) age of the target population
• Statistic: A descriptive measure computed
from the data of a sample.
– E.g., sample mean age ( )

introduction.pptx

  • 1.
  • 2.
    2 Introduction • What isstatistics? • Statistics: A field of study concerned with: – collection, organization, analysis, summarization and interpretation of numerical data, & – the drawing of inferences about a body of data when only a small part of the data is observed. • Statistics helps us use numbers to communicate ideas
  • 3.
     Biostatistics: Theapplication of statistical methods to the fields of biological and medical sciences.  Concerned with interpretation of biological data & the communication of information derived from these data  Has central role in medical investigations 3
  • 4.
    4 Importance of biostatisticsin health sciences • Provide methods of organizing information • Assessment of health status • Health program evaluation • Resource allocation • Evaluation of magnitude of association – Strong vs. weak association between exposure and outcome
  • 5.
    5 • Assessing riskfactors – Cause & effect relationship • Evaluation of a new vaccine or drug – What can be concluded if the proportion of people free from the disease is greater among the vaccinated than the unvaccinated? – How effective is the vaccine (drug)? – Is the effect due to chance or some bias? • Drawing of inferences – Information from sample to population Importance of biostatistics in health science
  • 6.
    6 What does biostatisticscover? Research Planning Design Execution (Data collection) Data Processing Data Analysis Presentation Interpretation Publication Biostatistical thinking contribute in every step in a research The best way to learn about biostatistics is to follow the flow of a research from inception to the final publication
  • 7.
    7 Research Design • Wecan not study all subjects (all pregnant women, or all people) living in a given geographical area – Sampling technique – Inclusion/exclusion criteria – Sample size calculation – Study design – Method of data collection – Etc
  • 8.
    8 Analysis • Analysis partis the major part of learning about biostatistics – There are dozens of different methods of analysis, which makes difficult the choice of the correct method for a particular case – It is necessary to consider the philosophy that underlies all methods of analysis: • Use data from a sample to draw inference about a wider population
  • 9.
    9 Interpretation • Interpretation ofresults of statistical analysis is not always straightforward, but is simpler when the study has a clearer aim • If the study has been well designed and correctly analyzed the interpretation of results can be fairly simple
  • 10.
    Types of Statistics 1.Descriptive statistics: • Ways of organizing and summarizing data • Helps to identify the general features and trends in a set of data and extracting useful information • Example: tables, graphs, numerical summary measures 10
  • 11.
    Types of Statistics 2.Inferential statistics: • Methods used for drawing conclusions about a population based on the information obtained from a sample of observations drawn from that population • Example: point estimation, interval estimation ( e.g. confidence interval), comparison of two or more means or proportions, hypothesis testing, etc. 11
  • 12.
    12 Data • Data arenumbers which can be measurements or can be obtained by counting • The raw material for statistics • Can be obtained from: – Routinely kept records, literature – Surveys – Counting – Experiments – Reports – Observation – Etc
  • 13.
    The statistical datamay be classified under two categories, depending upon the sources. 1. Primary data: collected from the items or individual respondents directly by the researcher for the purpose of a study. 2. Secondary data: which had been collected by certain people or organization, & statistically treated and the information contained in it is used for other purpose by other people 13
  • 14.
    14 Population and Sample •Population: – Refers to any collection of objects • Target population: – A collection of items that have something in common for which we wish to draw conclusions at a particular time. • E.g., All hospitals in Ethiopia – The whole group of interest
  • 15.
    15 Population and Sample StudyPopulation: • The subset of the target population that has at least some chance of being sampled • The specific population group from which samples are drawn and data are collected
  • 16.
    16 Population and Sample Sample: .A subset of a study population, about which information is actually obtained. . The individuals who are actually measured and comprise the actual data.
  • 17.
    17 Population Sample Information • Role ofstatistics in using information from a sample to make inferences about the population
  • 18.
    18 Sample Study Population Target Population E.g.:In a study of the prevalence of HIV among adolescents in Ethiopia, a random sample of adolescents in Lideta Kifle Ketema of AA were included. Target Population: All adolescents in Ethiopia Study population: All adolescents in Addis Ababa Sample: Adolescents in Lideta Kifle Ketema who were included in the study
  • 19.
    19 Generalizability • Is atwo-stage procedure: • We need to be able to generalize from: – the sample to the study population, & – then from the study population to the target population • If the sample is not representative of the population, the conclusions are restricted to the sample & don’t have general applicability
  • 20.
    20 Collect information from arelatively SMALL sample Draw conclusions about a rather LARGE population
  • 21.
    21 Parameter and Statistic •Parameter: A descriptive measure computed from the data of a population. – E.g., the mean (µ) age of the target population • Statistic: A descriptive measure computed from the data of a sample. – E.g., sample mean age ( )