1. `
Page 1 of 6
Market Review and Outlook QSE Index and Volume
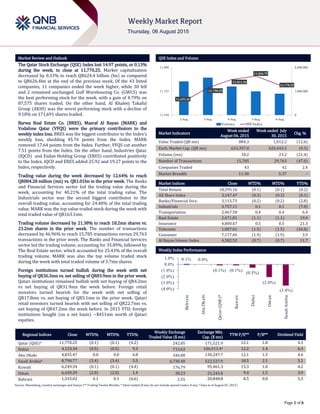
The Qatar Stock Exchange (QSE) Index lost 14.97 points, or 0.13%
during the week, to close at 11,770.25. Market capitalization
decreased by 0.33% to reach QR624.4 billion (bn) as compared
to QR626.4bn at the end of the previous week. Of the 43 listed
companies, 11 companies ended the week higher, while 30 fell
and 2 remained unchanged. Gulf Warehousing Co. (GWCS) was
the best performing stock for the week, with a gain of 4.79% on
87,575 shares traded. On the other hand, Al Khaleej Takaful
Group (AKHI) was the worst performing stock with a decline of
9.18% on 171,691 shares traded.
Barwa Real Estate Co. (BRES), Masraf Al Rayan (MARK) and
Vodafone Qatar (VFQS) were the primary contributors to the
weekly index loss. BRES was the biggest contributor to the Index’s
weekly loss, shedding 45.76 points from the Index. MARK
removed 17.64 points from the Index. Further, VFQS cut another
7.51 points from the Index. On the other hand, Industries Qatar
(IQCD) and Ezdan Holding Group (ERES) contributed positively
to the Index. IQCD and ERES added 25.92 and 19.27 points to the
Index, respectively.
Trading value during the week decreased by 12.64% to reach
QR884.28 million (mn) vs. QR1.01bn in the prior week. The Banks
and Financial Services sector led the trading value during the
week, accounting for 40.21% of the total trading value. The
Industrials sector was the second biggest contributor to the
overall trading value, accounting for 24.48% of the total trading
value. MARK was the top value traded stock during the week with
total traded value of QR163.1mn.
Trading volume decreased by 21.38% to reach 18.2mn shares vs.
23.2mn shares in the prior week. The number of transactions
decreased by 46.96% to reach 15,785 transactions versus 29,763
transactions in the prior week. The Banks and Financial Services
sector led the trading volume, accounting for 35.89%, followed by
The Real Estate sector, which accounted for 25.43% of the overall
trading volume. MARK was also the top volume traded stock
during the week with total traded volume of 3.7mn shares.
Foreign institutions turned bullish during the week with net
buying of QR36.3mn vs. net selling of QR83.9mn in the prior week.
Qatari institutions remained bullish with net buying of QR4.2mn
vs net buying of QR31.9mn the week before. Foreign retail
investors turned bearish for the week with net selling of
QR17.8mn vs. net buying of QR5.1mn in the prior week. Qatari
retail investors turned bearish with net selling of QR22.7mn vs.
net buying of QR47.2mn the week before. In 2015 YTD, foreign
institutions bought (on a net basis) ~$451mn worth of Qatari
equities.
Market Indicators
Week ended
August 06, 2015
Week ended July
30, 2015
Chg. %
Value Traded (QR mn) 884.3 1,012.2 (12.6)
Exch. Market Cap. (QR mn) 624,397.0 626,443.3 (0.3)
Volume (mn) 18.2 23.2 (21.4)
Number of Transactions 15,785 29,763 (47.0)
Companies Traded 43 42 2.4
Market Breadth 11:30 5:37 –
Market Indices Close WTD% MTD% YTD%
Total Return 18,295.16 (0.1) (0.1) (0.2)
All Share Index 3,147.47 (0.3) (0.3) (0.1)
Banks/Financial Svcs. 3,115.75 (0.2) (0.2) (2.8)
Industrials 3,757.11 0.1 0.1 (7.0)
Transportation 2,467.58 0.4 0.4 6.4
Real Estate 2,671.81 (1.1) (1.1) 19.0
Insurance 4,800.67 0.5 0.5 21.3
Telecoms 1,087.01 (1.5) (1.5) (26.8)
Consumer 7,177.06 (1.9) (1.9) 3.9
Al Rayan Islamic Index 4,582.52 (0.7) (0.7) 11.7
Market Indices
Weekly Index Performance
Regional Indices Close WTD% MTD% YTD%
Weekly Exchange
Traded Value ($ mn)
Exchange Mkt.
Cap. ($ mn)
TTM P/E** P/B** Dividend Yield
Qatar (QSE)* 11,770.25 (0.1) (0.1) (4.2) 242.85 171,521.9 12.1 1.8 4.3
Dubai 4,123.34 (0.5) (0.5) 9.3 713.63 106,013.4# 12.2 1.4 6.3
Abu Dhabi 4,835.47 0.0 0.0 6.8 346.08 130,247.7 12.1 1.5 4.6
Saudi Arabia# 8,790.77 (3.4) (3.4) 5.5 6,730.40 522,527.9 18.5 2.1 3.1
Kuwait 6,249.34 (0.1) (0.1) (4.4) 176.79 95,461.3 15.3 1.0 4.2
Oman 6,430.29 (2.0) (2.0) 1.4 38.23 25,245.8 9.4 1.5 3.9
Bahrain 1,333.02 0.1 0.1 (6.6) 2.55 20,848.8 8.5 0.8 5.3
Source: Bloomberg, country exchanges and Zawya (** Trailing Twelve Months; * Value traded ($ mn) do not include special trades, if any; # Data as of August 05, 2015)
11,651.26
11,750.29
11,811.56
11,836.75
11,770.25
0
3,000,000
6,000,000
11,550
11,725
11,900
2-Aug 3-Aug 4-Aug 5-Aug 6-Aug
Volume QSEIndex
0.1% 0.0%
(0.1%) (0.1%)
(0.5%)
(2.0%)
(3.4%)(4.0%)
(3.0%)
(2.0%)
(1.0%)
0.0%
1.0%
Bahrain
AbuDhabi
Qatar(QSE)*
Kuwait
Dubai
Oman
SaudiArabia
2. Page 2 of 6
News
Economic News
QNBK: Qatar’s crude production goes up – According to QNB
Group’s (QNBK) monthly economic monitor, Qatar’s crude oil
production rose to 642,000 barrels per day (bpd) in May 2015
from 635,000 bpd in April. The production is expected to stabilize
in the coming months. The Brent crude oil price is also expected
to average $56.2 per barrel, close to its average so far in 2015.
Qatar’s overall balance of payments recorded a small deficit in
4Q2014 of $0.5bn. The current account surplus narrowed
($10.5bn in 4Q2014) on lower hydrocarbon exports. The capital
and financial account recorded a deficit of $9.5bn in 4Q2014.
QNBK expects the current account surplus to shrink to $3.7bn in
2015 (4.6% of GDP) due to lower oil prices, before recovering
slightly in 2016-17 in line with the recovery in oil prices. Qatar’s
international reserves rose to $42bn in June 2015 from $41.8bn
in May. In months of prospective import cover, international
reserves were stable at 7.5 months of imports. QNBK expects the
accumulation of international reserves to continue, reaching
$46bn, or 8 months of import cover at end-2015. Bank deposits
growth accelerated to 8.9% YoY in June 2015 from 7.7% in May.
Public sector deposits contracted by 5.9% YoY in June; private
sector deposits grew by 10.1%; non-resident deposits doubled,
growing by 104.5%. QNBK expects double-digit deposit growth of
11.3% in 2015 reflecting strong population growth. Bank assets
growth accelerated to 11.2% in June from 7.9% in May, driven by
strong lending growth. Foreign assets grew by 9.3% YoY, driven
by expansion in credit; while domestic assets grew by 11.4%,
driven mainly by the growth in domestic credit (11.6%). Bank
assets are expected to rise by 10% in 2015, increasingly driven by
project lending. (Peninsula Qatar)
Market & Corporate News
QEWS: Raising price target to QR256.00 – We are raising our
target price to reflect Facility D project beginning in 2017. We
expect this 2,520 MW and 136.5 MIGD project to add about QR23
per share to QEWS’ fair value. QEWS is a low-risk play deeply
linked to Qatar’s growth story. We retain our long-term bullish
stance on QEWS with an Accumulate rating. Highlights: 1)
Seasonality boosted revenue and net income on a sequential basis
in 2Q2015. QEWS reported a 2Q2015 bottom-line of QR391mn
(+13% QoQ, -6% YoY) versus our estimate of QR423mn and
Reuters mean estimate of QR429mn. The company generated
revenue of QR753mn (+13% QoQ, flattish YoY excluding the
impact of satellite stations but down 3% otherwise), which was
only 4% shy of our estimate of QR787mn. Reported revenue was
impacted by discontinuation of satellite stations by YE2014
(already reflected in our model) and a lower tariff regime for RAF
A, which is subjected a new two-year PWPA from 2015 onward;
2) Operating margins generally softened and came in below our
estimates. Direct costs expanded during the quarter, lowering the
gross margin to 58.8% vs. 60.8% in 1Q2015/2Q2014; EBITDA
came in at QR399mn (+10% QoQ, -1% YoY) lowering the EBITDA
margin to 53.0% vs. 54.4% in 1Q2015 and 53.6% in 2Q2014. EBIT
margins advanced to 38.9% vs. 38.8% in March 2015 and 38.4%
in the year-ago quarter benefiting from lower depreciation
charges given RAF A has been fully depreciated as of YE2014; 3)
Net income grew sequentially but declined vs. 2Q2014 given one-
offs. The second quarter of 2014 benefited from QR44mn in
claims settlement; however, in 2Q2015, QEWS recorded a gain
from sale of less than QR1mn from the IPO of Phoenix Power
(running the Sur Power plant in Oman) that reduced the
company’s stake to 9.75% from 15%. In 2Q2015, QEWS had to
forego around QR7mn in net income that it recorded last year
from its satellite stations; however, the impact of the new RAF A
tariff regime was a wash on net income with lower revenue being
offset by reduced depreciation expenses; 4) Updating our model
and factoring in Facility D: QEWS owns 60% of this $3bn, 2,520
MW and 136.5 MIGD project, which is likely to be funded by 85%
debt. We expect contribution to begin through Phase I in 2017,
followed by full operations in 2018. Consequently, we raise our
2017 and 2018 net income estimates by 4% and 10%,
respectively.
IQCD net income surges 54.9% QoQ in 2Q2015, beat our estimates
– Significant uptick in steel revenue and petrochemical profitability
drives earnings upside. IQCD posted QR1.47bn in net income for
2Q2015, which beat our estimate of QR1.21bn by 21% and
Bloomberg mean estimate of QR1.13bn by 31%. While we were
surprised by the 20% QoQ uptick in steel revenue, steel margins
came in below estimates at 20% (net margin) vs. our model of
25%. Petrochemical net margin expanded to 52% from 34% in
1Q2015 with segment net income jumping by more than 130%
QoQ benefiting from improved product prices and higher volume
growth. The fertilizer segment top line came in line with our
estimate. Further, in its disclosure, IQCD mentioned that Qatar
Steel has opted to sell its 50% stake in the JV Qatar Steel
International to its partner without disclosing the deal price. With
Brent prices taking another swoon and going below $50/b, we
believe the stock will continue to face negative sentiment despite
2Q2015’s upside. We rate IQCD a Market Perform. We remain of
the view IQCD holds long-term potential. However, any
meaningful recovery in the stock will likely come only when
optimism regarding oil prices resurfaces. Highlight: 1) IQCD net
income surges 55% QoQ in 2Q2015. The QoQ profit growth was on
the back of a strong increase in revenue and JV income. IQCD also
reported a strong YoY sales growth of 17.1 % in 1H2015 as most
of its production facilities were on extensive planned and
warranty maintenance shutdown during 1H2014.
GISS 2Q2015 net profit hit by lower QoQ revenue, came below our
estimates – Gulf International Services’ (GISS) net profit dropped
29.8% QoQ (-53.8% YoY) to QR249.7mn in 2Q2015, 10.6% below
our forecast of QR279.2mn (consensus mean estimate was a
higher QR300mn due to another broker forecast of QR321mn).
The QoQ profitability decline stemmed from lower group revenue
that stood at QR1.08bn vs. our estimate of QR1.14bn, reflecting a
10.4% QoQ decline mainly due to drop in drilling and catering
segments revenue. As a result, gross profit shrank 29.4% QoQ to
QR301.1mn. We maintain our Accumulate rating and QR93.00
price target. (QNBFS Research, QSE, Company Press Release)
MPHC net profit increases by 146.7% QoQ to QR286.6mn in
2Q2015 – Qatar Petroleum’s subsidiary, Mesaieed Petrochemical
Holding Company’s (MPHC) net profit soared 146.7% QoQ (down
34.5% YoY) to QR286.6mn in 2Q2015, mainly due to increase in
sales volumes following successful completion of the planned
major maintenance shutdowns in 1Q2015. The company’s profit
was also aided by a tax refund of QR23.3mn in 2Q2015, indicating
an increase of 65.9% QoQ. MPHC’s share of profit from joint
ventures (JV) stood at QR266.8mn in 2Q2015, reflecting an
increase of 156.6% QoQ (down 33.8% YoY). Earnings per share
(EPS) amounted to QR0.23 in 2Q2015 versus QR0.09 in 1Q2015.
(QSE, QNBFS Research)
3. Page 3 of 6
Qatar Stock Exchange
Top Gainers Top Decliners
Source: Qatar Stock Exchange (QSE) Source: Qatar Stock Exchange (QSE)
Most Active Shares by Value (QR Million) Most Active Shares by Volume (Million)
Source: Qatar Stock Exchange (QSE) Source: Qatar Stock Exchange (QSE)
Investor Trading Percentage to Total Value Traded Net Traded Value by Nationality (QR Million)
Source: Qatar Stock Exchange (QSE) Source: Qatar Stock Exchange (QSE)
4.8%
2.8%
2.2% 2.2%
1.9%
0.0%
2.0%
4.0%
6.0%
Gulf
Warehousing
Commercial
Bank of Qatar
Qatar
Insurance
Qatar & Oman
Investment
Industries
Qatar
-9.2%
-7.0%
-6.4%
-5.0%
-4.5%
-12.0%
-8.0%
-4.0%
0.0%
Al Khaleej
Takaful Insurance
Barwa Real Estate Medicare Group Dlala Holding Islamic Holding
Group
163.1
84.9 83.5
70.9 69.5
0.0
60.0
120.0
180.0
Masraf Al
Rayan
Gulf
International
Services
Barwa Real
Estate
QNB Group Industries
Qatar
3.7
2.0
1.7
1.5
1.2
0.0
1.5
3.0
4.5
Masraf Al
Rayan
Vodafone
Qatar
Barwa Real
Estate
Ezdan Real
Estate
Gulf
International
Services
0%
20%
40%
60%
80%
100%
Buy Sell
35.57% 38.14%
19.92% 19.45%
12.95% 14.96%
31.55% 27.45%
Qatari Individuals Qatari Institutions
Non-Qatari Individuals Non-Qatari Institutions
491
394
509
375
(19)
18
(100) - 100 200 300 400 500 600
Qatari
Non-Qatari
Net Investment Total Sold Total Bought
4. Page 4 of 6
TECHNICAL ANALYSIS OF THE QSE INDEX
Source: Bloomberg
The QSE Index continued its negative trend and lost 0.13% vs. the previous week. The index failed to reclaim the 11,800 level, and slipped further down. The
MACD is growing more bearish, while the RSI is still flat close to the neutral line. As a result, the index is likely to remain under pressure. We reiterate our
previous weekly support and resistance levels between 11,230 and 12,000 points, respectively.
DEFINITIONS OF KEY TERMS USED IN TECHNICAL ANALYSIS
RSI (Relative Strength Index) indicator – RSI is a momentum oscillator that measures the speed and change of price movements. The RSI oscillates between 0 to
100. The index is deemed to be overbought once the RSI approaches the 70 level, indicating that a correction is likely. On the other hand, if the RSI approaches
30, it is an indication that the index may be getting oversold and therefore likely to bounce back.
MACD (Moving Average Convergence Divergence) indicator – The indicator consists of the MACD line and a signal line. The divergence or the convergence of the
MACD line with the signal line indicates the strength in the momentum during the uptrend or downtrend, as the case may be. When the MACD crosses the signal
line from below and trades above it, it gives a positive indication. The reverse is the situation for a bearish trend.
Candlestick chart – A candlestick chart is a price chart that displays the high, low, open, and close for a security. The ‘body’ of the chart is portion between the
open and close price, while the high and low intraday movements form the ‘shadow’. The candlestick may represent any time frame. We use a one-day
candlestick chart (every candlestick represents one trading day) in our analysis.
Doji candlestick pattern – A Doji candlestick is formed when a security's open and close are practically equal. The pattern indicates indecisiveness, and based on
preceding price actions and future confirmation, may indicate a bullish or bearish trend reversal.
Shooting Star/Inverted Hammer candlestick patterns – These candlestick patterns have a small real body (open price and close price are near to each other),
and a long upper shadow (large intraday movement on the upside). The Shooting Star is a bearish reversal pattern that forms after a rally. The Inverted Hammer
looks exactly like a Shooting Star, but forms after a downtrend. Inverted Hammers represent a potential bullish trend reversal.
5. Page 5 of 6
Source: Bloomberg
Company Name
Price
(August 06)
% Change 5-
Day
% Change
YTD
Market Cap.
QR Million TTM P/E P/B Div. Yield
Qatar National Bank 182.40 (0.05) (14.33) 127,631 11.6 2.3 4.1
Qatar Islamic Bank 110.30 0.73 7.93 26,063 14.9 1.8 3.9
Commercial Bank of Qatar 55.70 2.77 (10.55) 18,193 9.7 1.1 5.7
Doha Bank 52.70 (0.57) (7.54) 13,616 9.9 1.0 7.6
Al Ahli Bank 48.65 (3.66) (1.99) 8,841 13.9 2.1 2.8
Qatar International Islamic Bank 77.70 (0.26) (4.90) 11,761 13.7 2.3 5.1
Masraf Al Rayan 44.30 (1.56) 0.23 33,225 15.8 3.3 4.0
Al Khaliji Bank 22.69 1.16 2.90 8,168 13.4 1.4 4.4
National Leasing 18.16 (1.89) (9.20) 899 32.4 0.7 4.7
Dlala Holding 24.80 (4.98) (25.83) 705 12.5 2.4 N/A
Qatar & Oman Investment 16.19 2.15 5.13 510 16.6 1.5 4.9
Islamic Holding Group 126.20 (4.54) 1.37 505 34.7 8.1 2.4
Banking and Financial Services 250,117
Zad Holding 98.50 (1.20) 17.26 1,288 11.7 1.6 4.1
Qatar German Co. for Medical Devices 15.74 (2.90) 55.07 182 N/A 1.1 N/A
Salam International Investment 13.85 (0.93) (12.62) 1,583 20.3 1.0 4.3
Medicare Group 174.60 (6.43) 49.23 4,914 25.0 5.6 1.0
Qatar Cinema & Film Distribution 42.00 (1.18) 5.00 264 21.2 1.8 2.2
Qatar Fuel 162.40 (1.40) (20.51) 13,716 12.0 2.1 5.5
Qatar Meat and Livestock 61.00 (0.97) 0.99 1,098 20.3 4.2 4.1
Al Meera Consumer Goods 275.00 1.66 37.50 5,500 23.9 4.4 3.3
Consumer Goods and Services 28,545
Qatar Industrial Manufacturing 45.60 (0.87) 5.19 2,167 13.1 1.5 6.6
Qatar National Cement 119.00 0.00 (0.83) 6,427 15.1 2.4 3.1
Industries Qatar 137.90 1.92 (17.92) 83,430 14.1 2.6 5.1
Qatari Investors Group 48.60 (2.99) 17.39 6,042 25.9 2.6 1.5
Qatar Electricity and Water 218.70 (1.00) 16.64 24,057 15.1 3.6 3.4
Mannai Corp. 110.50 1.28 1.38 5,041 9.3 2.5 5.4
Aamal 14.60 (0.27) 0.92 9,198 14.5 1.3 6.5
Gulf International Services 68.50 (0.72) (29.45) 12,730 8.2 3.4 8.0
Mesaieed Petrochemical Holding 22.60 (3.87) -23.4 28,393 21.9 2.1 4.9
Industrials 177,485
Qatar Insurance 100.50 2.24 27.57 18,554 19.7 3.2 2.2
Doha Insurance 25.80 (0.77) (11.03) 1,290 14.5 1.2 3.9
Qatar General Insurance & Reinsurance 53.20 (4.14) 3.69 4,232 4.5 0.8 3.3
Al Khaleej Takaful Insurance 38.10 (9.18) (13.75) 973 17.1 1.6 3.4
Qatar Islamic Insurance 81.90 (0.36) 3.67 1,229 14.6 4.3 4.9
Insurance 26,278
United Development 25.40 0.40 7.67 8,994 13.2 0.8 4.9
Barw a Real Estate 46.50 (7.00) 10.98 18,094 2.9 1.0 4.7
Ezdan Real Estate 17.79 1.37 19.24 47,188 32.3 1.6 2.2
Mazaya Qatar Real Estate Development 17.88 (0.67) (1.96) 1,877 10.9 1.4 1.6
Real Estate 76,153
Qatar Telecom 80.30 (0.37) (35.19) 25,722 18.0 1.2 5.0
Vodafone Qatar 15.07 (4.20) (8.39) 12,740 N/A 2.4 1.4
Telecoms 38,462
Qatar Navigation (Milaha) 99.00 (0.60) (0.50) 11,338 9.5 0.8 5.6
Gulf Warehousing 76.60 4.79 35.82 3,643 22.7 4.1 2.0
Qatar Gas Transport (Nakilat) 22.10 0.00 (4.33) 12,376 13.0 3.1 5.4
Transportation 27,357
Qatar Exchange 624,397
6. Contacts
Saugata Sarkar Sahbi Kasraoui QNB Financial Services SPC
Head of Research Head of HNI Contact Center: (+974) 4476 6666
Tel: (+974) 4476 6534 Tel: (+974) 4476 6544 PO Box 24025
saugata.sarkar@qnbfs.com.qa sahbi.alkasraoui@qnbfs.com.qa Doha, Qatar
Disclaimer and Copyright Notice: This publication has been prepared by QNB Financial Services SPC (“QNBFS”) a wholly-owned subsidiary of QNB SAQ (“QNB”). QNBFS is regulated by the Qatar
Financial Markets Authority and the Qatar Exchange QNB SAQ is regulated by the Qatar Central Bank. This publication expresses the views and opinions of QNBFS at a given time only. It is not an offer,
promotion or recommendation to buy or sell securities or other investments, nor is it intended to constitute legal, tax, accounting, or financial advice. QNBFS accepts no liability whatsoever for any
direct or indirect losses arising from use of this report. Any investment decision should depend on the individual circumstances of the investor and be based on specifically engaged investment advice.
We therefore strongly advise potential investors to seek independent professional advice before making any investment decision. Although the information in this report has been obtained from
sources that QNBFS believes to be reliable, we have not independently verified such information and it may not be accurate or complete. QNBFS does not make any representations or warranties as to
the accuracy and completeness of the information it may contain, and declines any liability in that respect. For reports dealing with Technical Analysis, expressed opinions and/or recommendations
may be different or contrary to the opinions/recommendations of QNBFS Fundamental Research as a result of depending solely on the historical technical data (price and volume). QNBFS reserves the
right to amend the views and opinions expressed in this publication at any time. It may also express viewpoints or make investment decisions that differ significantly from, or even contradict, the views
and opinions included in this report. This report may not be reproduced in whole or in part without permission from QNBFS
COPYRIGHT: No part of this document may be reproduced without the explicit written permission of QNBFS.
Page 6 of 6