Downloaded 32 times
![22
After putting in a blazing performance on the benchmark test,
Sun issued a glowing press release claiming that it had
outperformed Windows NT systems on the test.
Pendragon president Ivan Phillips cried foul, saying the results
weren't representative of real-world Java performance and that
Sun had gone so far as to duplicate the test's code within Sun's
Just-In-Time compiler. That's cheating, says Phillips, who claims
that benchmark tests and real-world applications aren't
the same thing.
Did Sun issue a denial or a mea culpa? Initially, Sun neither
denied optimizing for the benchmark test nor apologized for
it. "If the test results are not representative of real-world Java
applications, then that's a problem with the benchmark,"
Sun's Brian Croll said.
After taking a beating in the press, though, Sun retreated and
issued an apology for the optimization.[Excerpted from PC Online 1997]](https://image.slidesharecdn.com/ch1-140507123537-phpapp02/75/computer-architecture-22-2048.jpg)
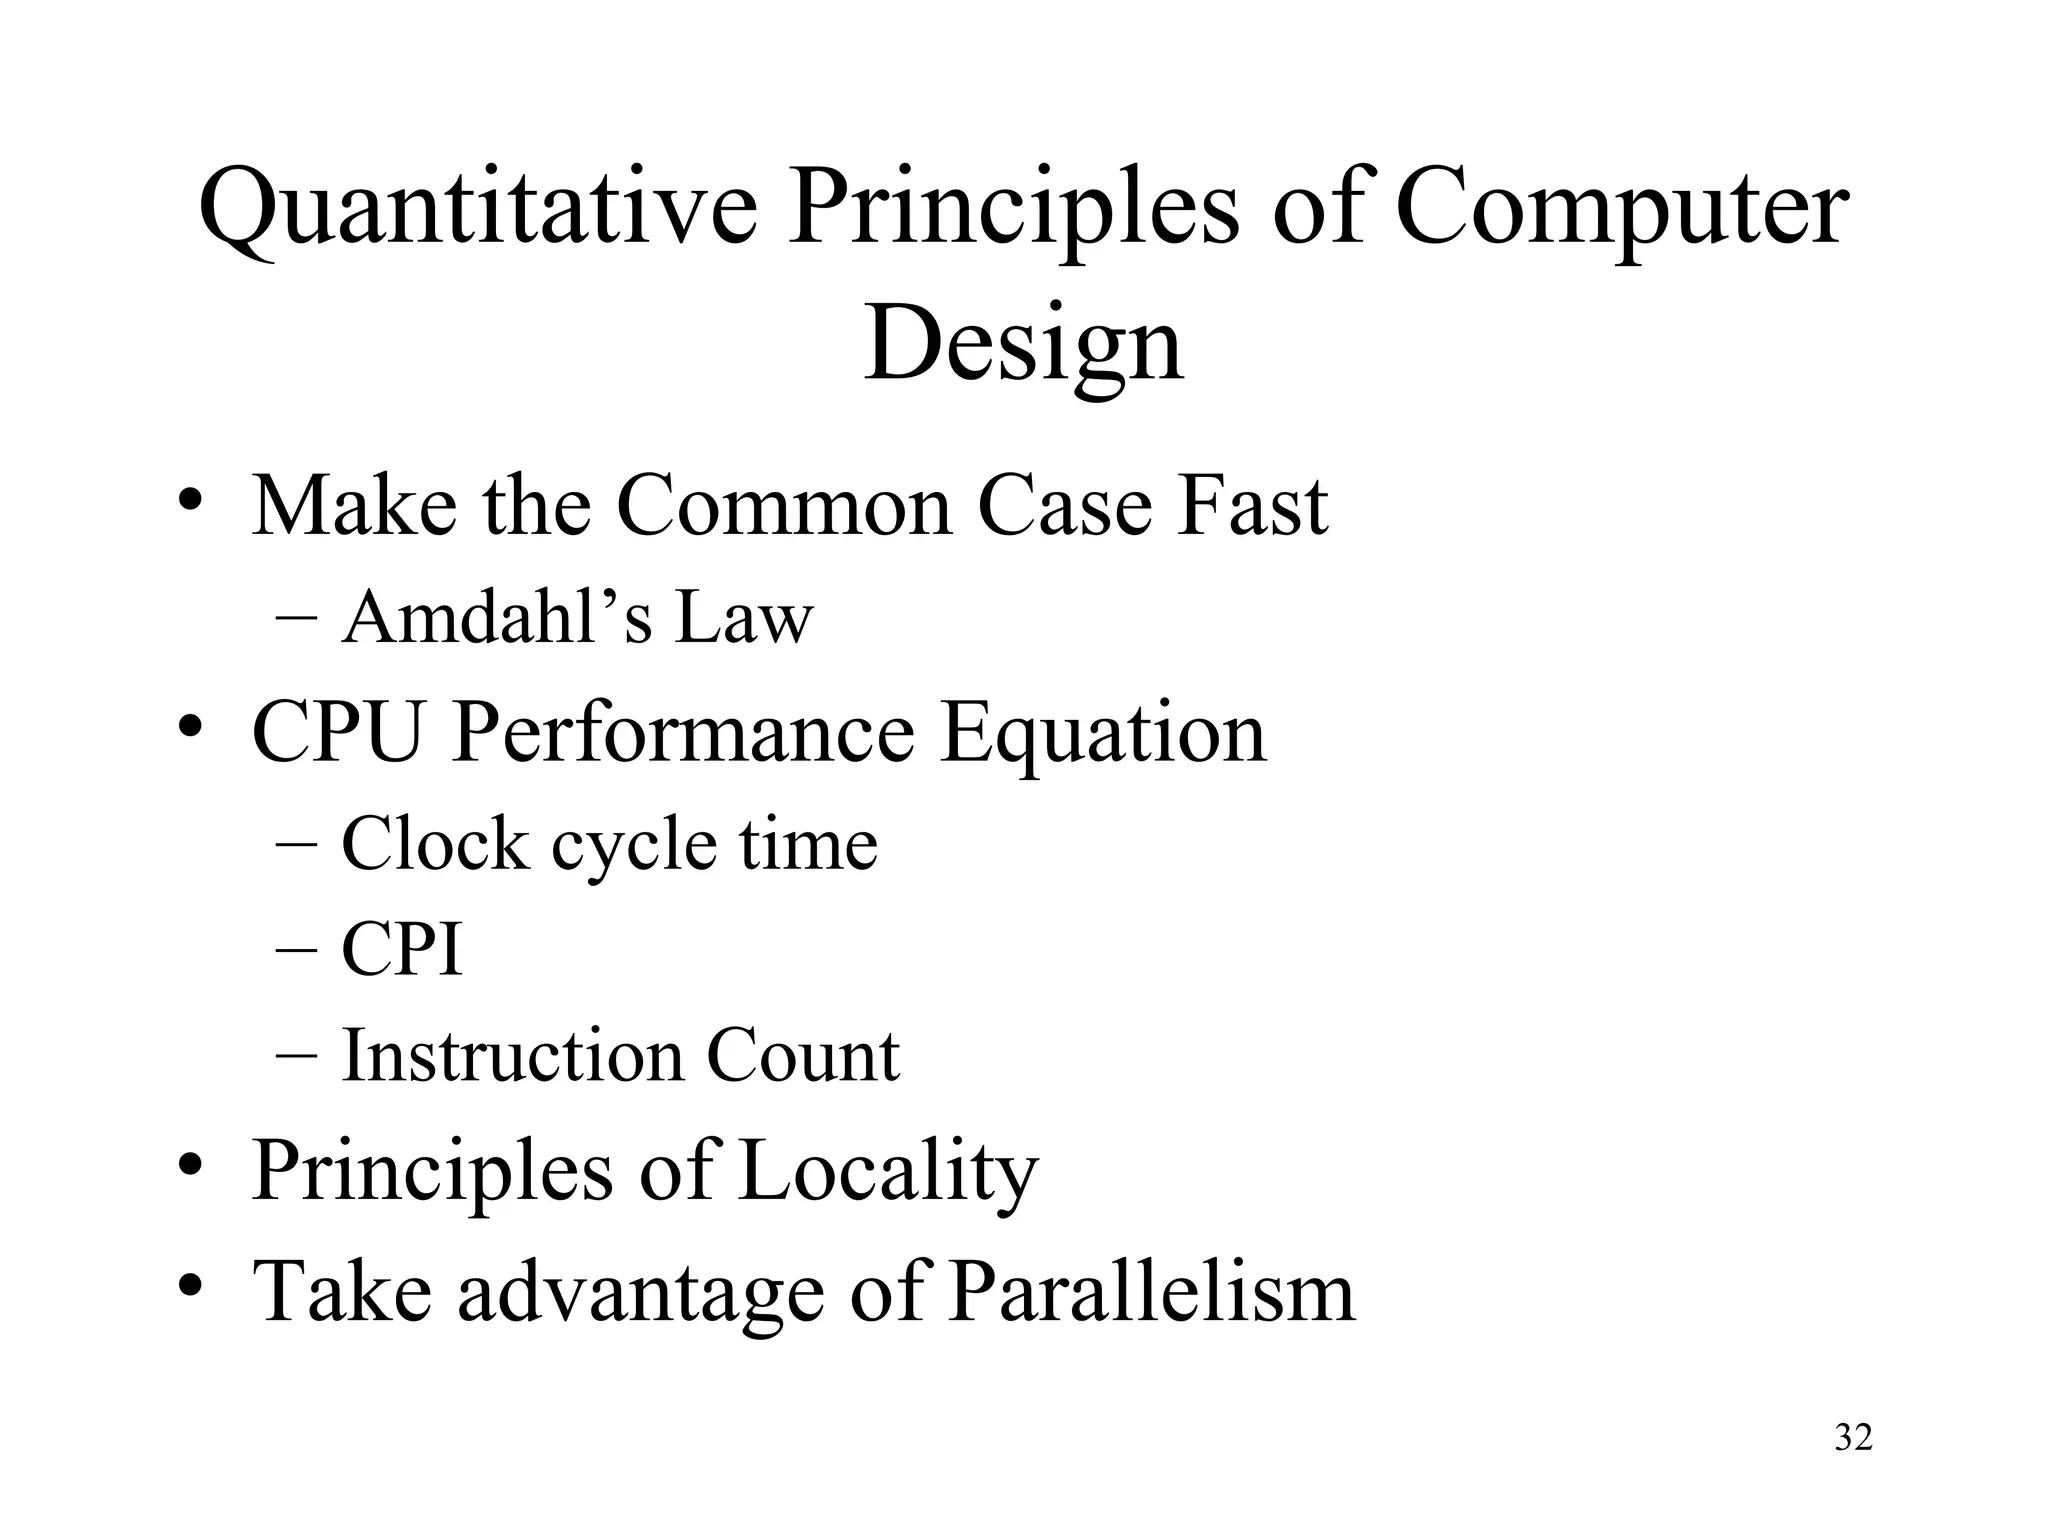
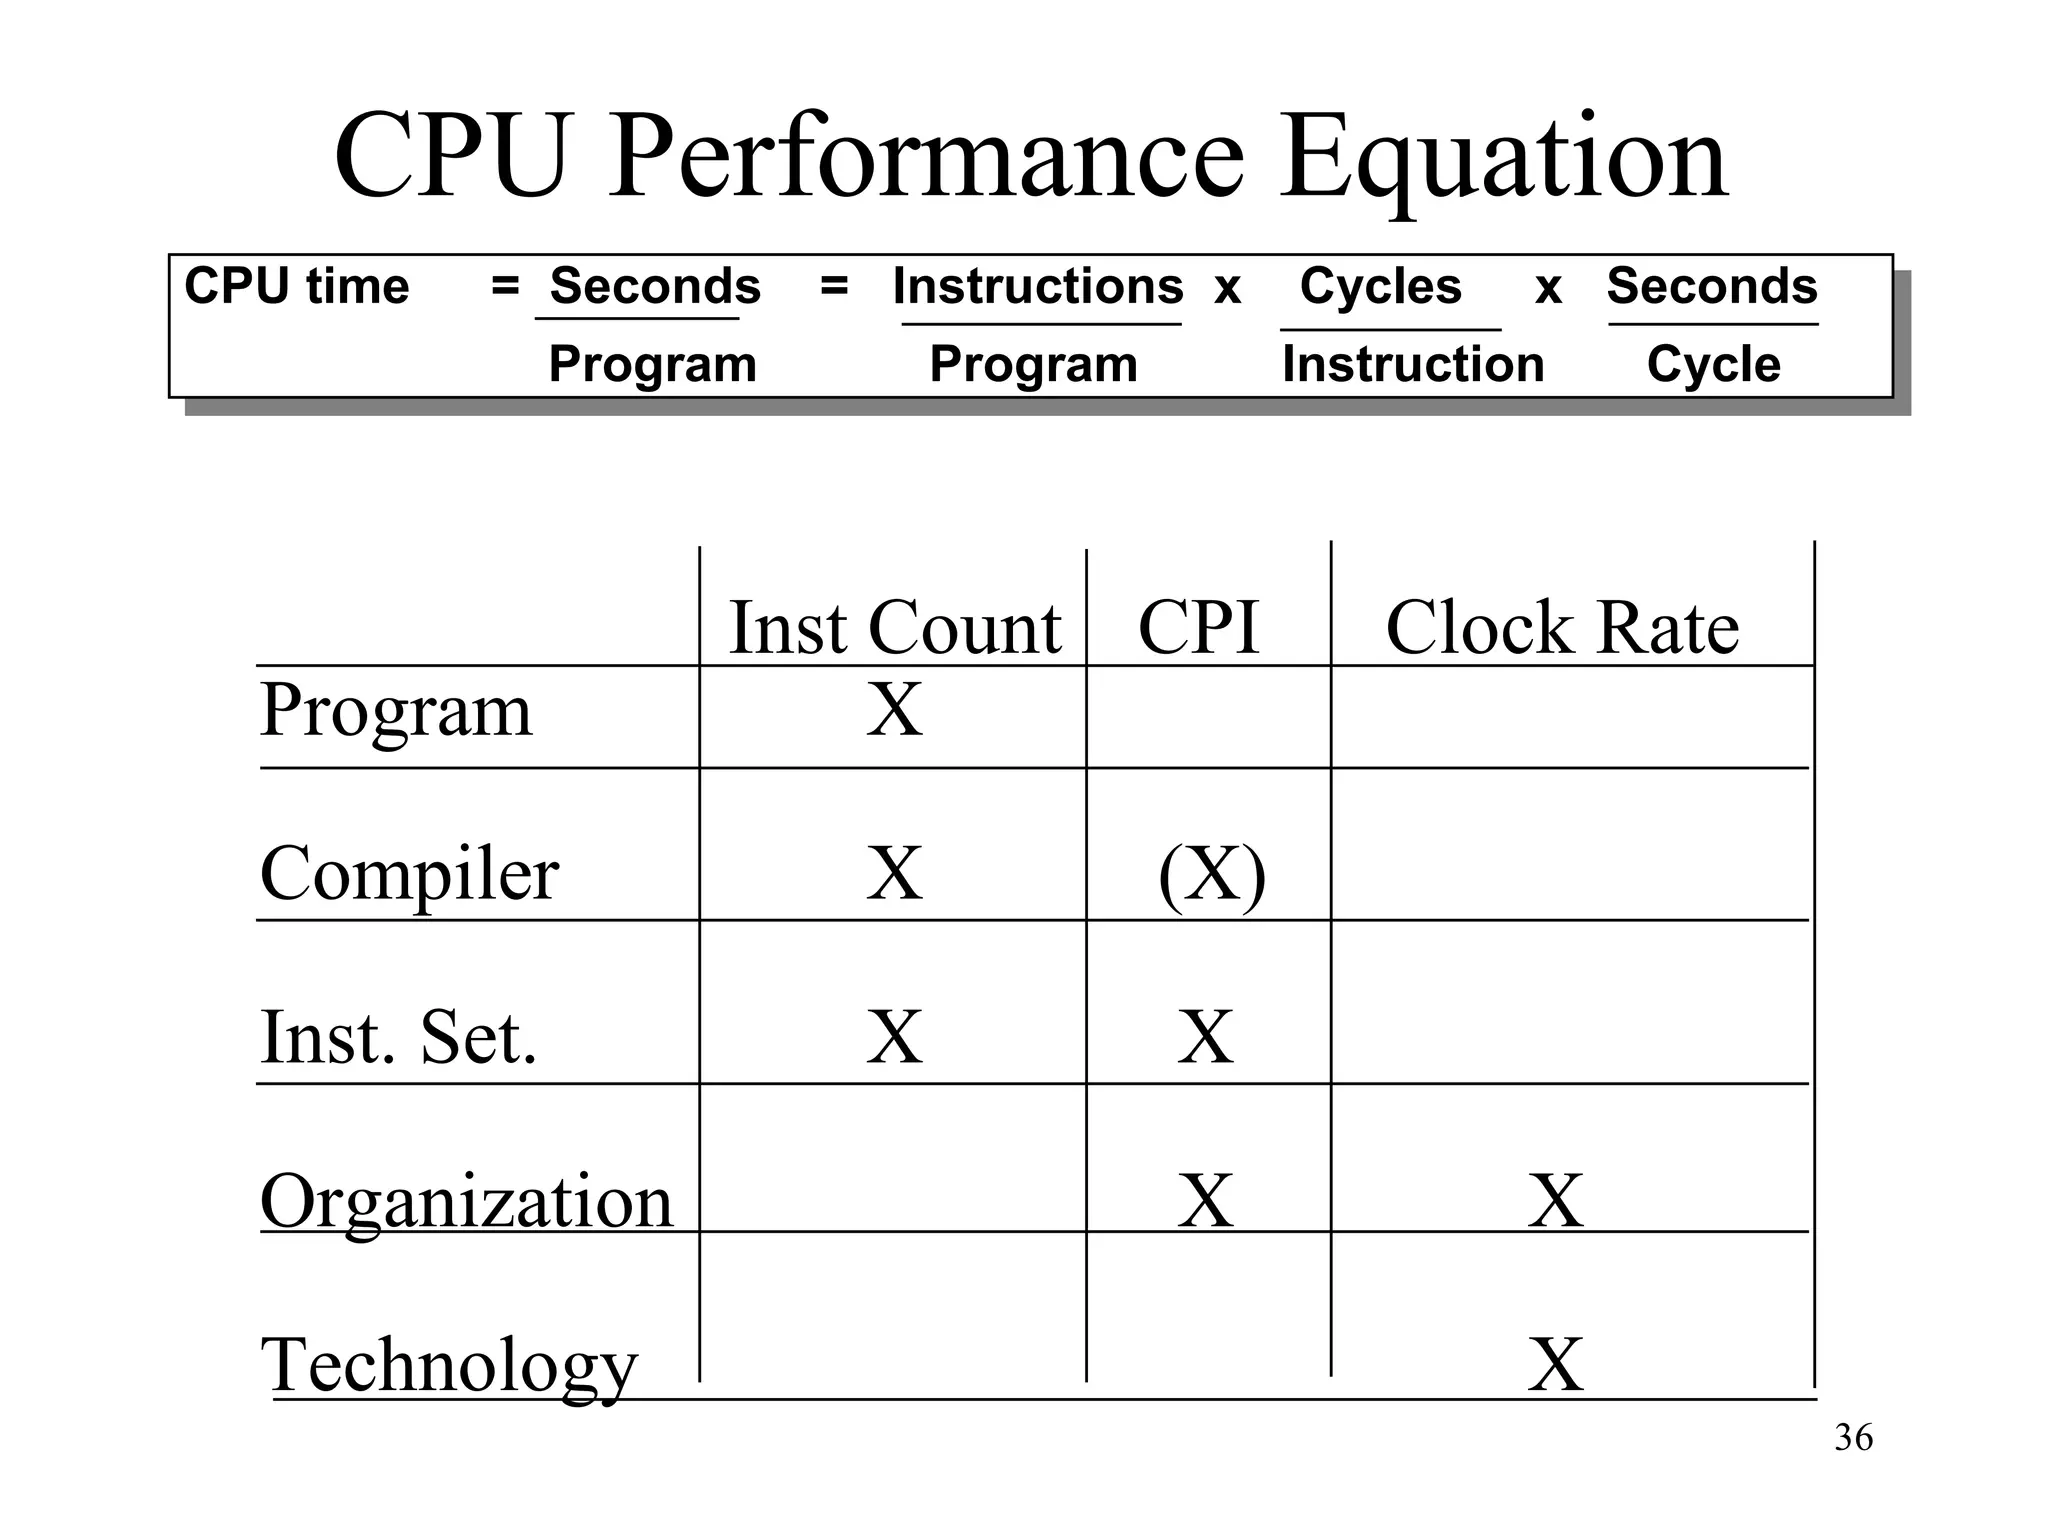
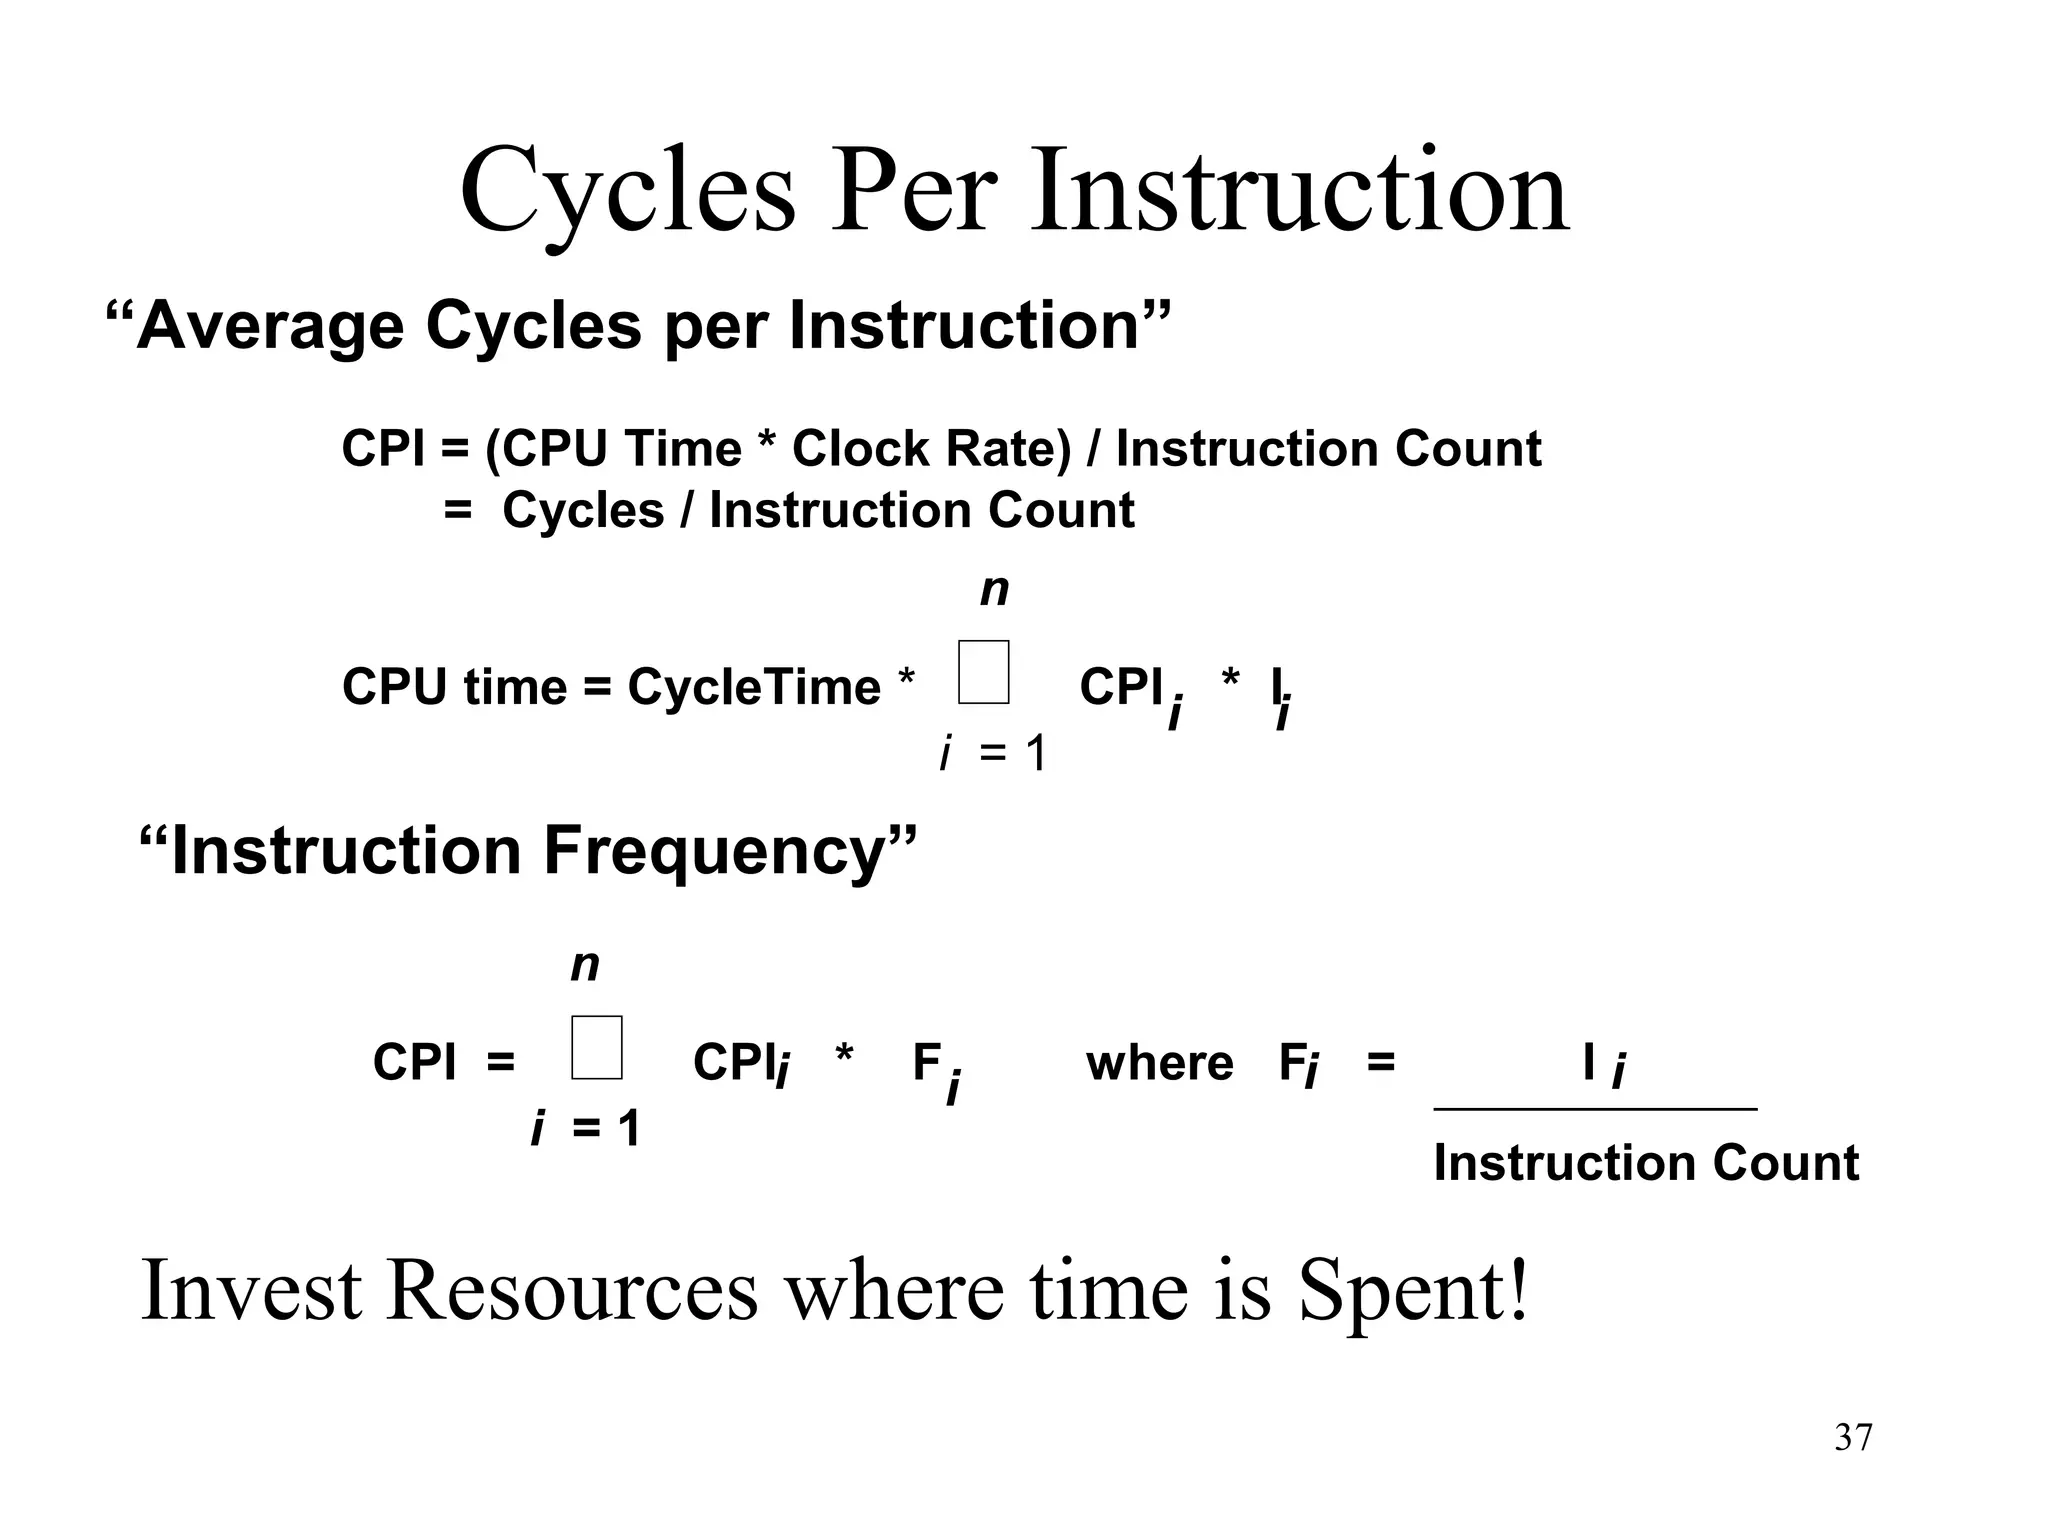
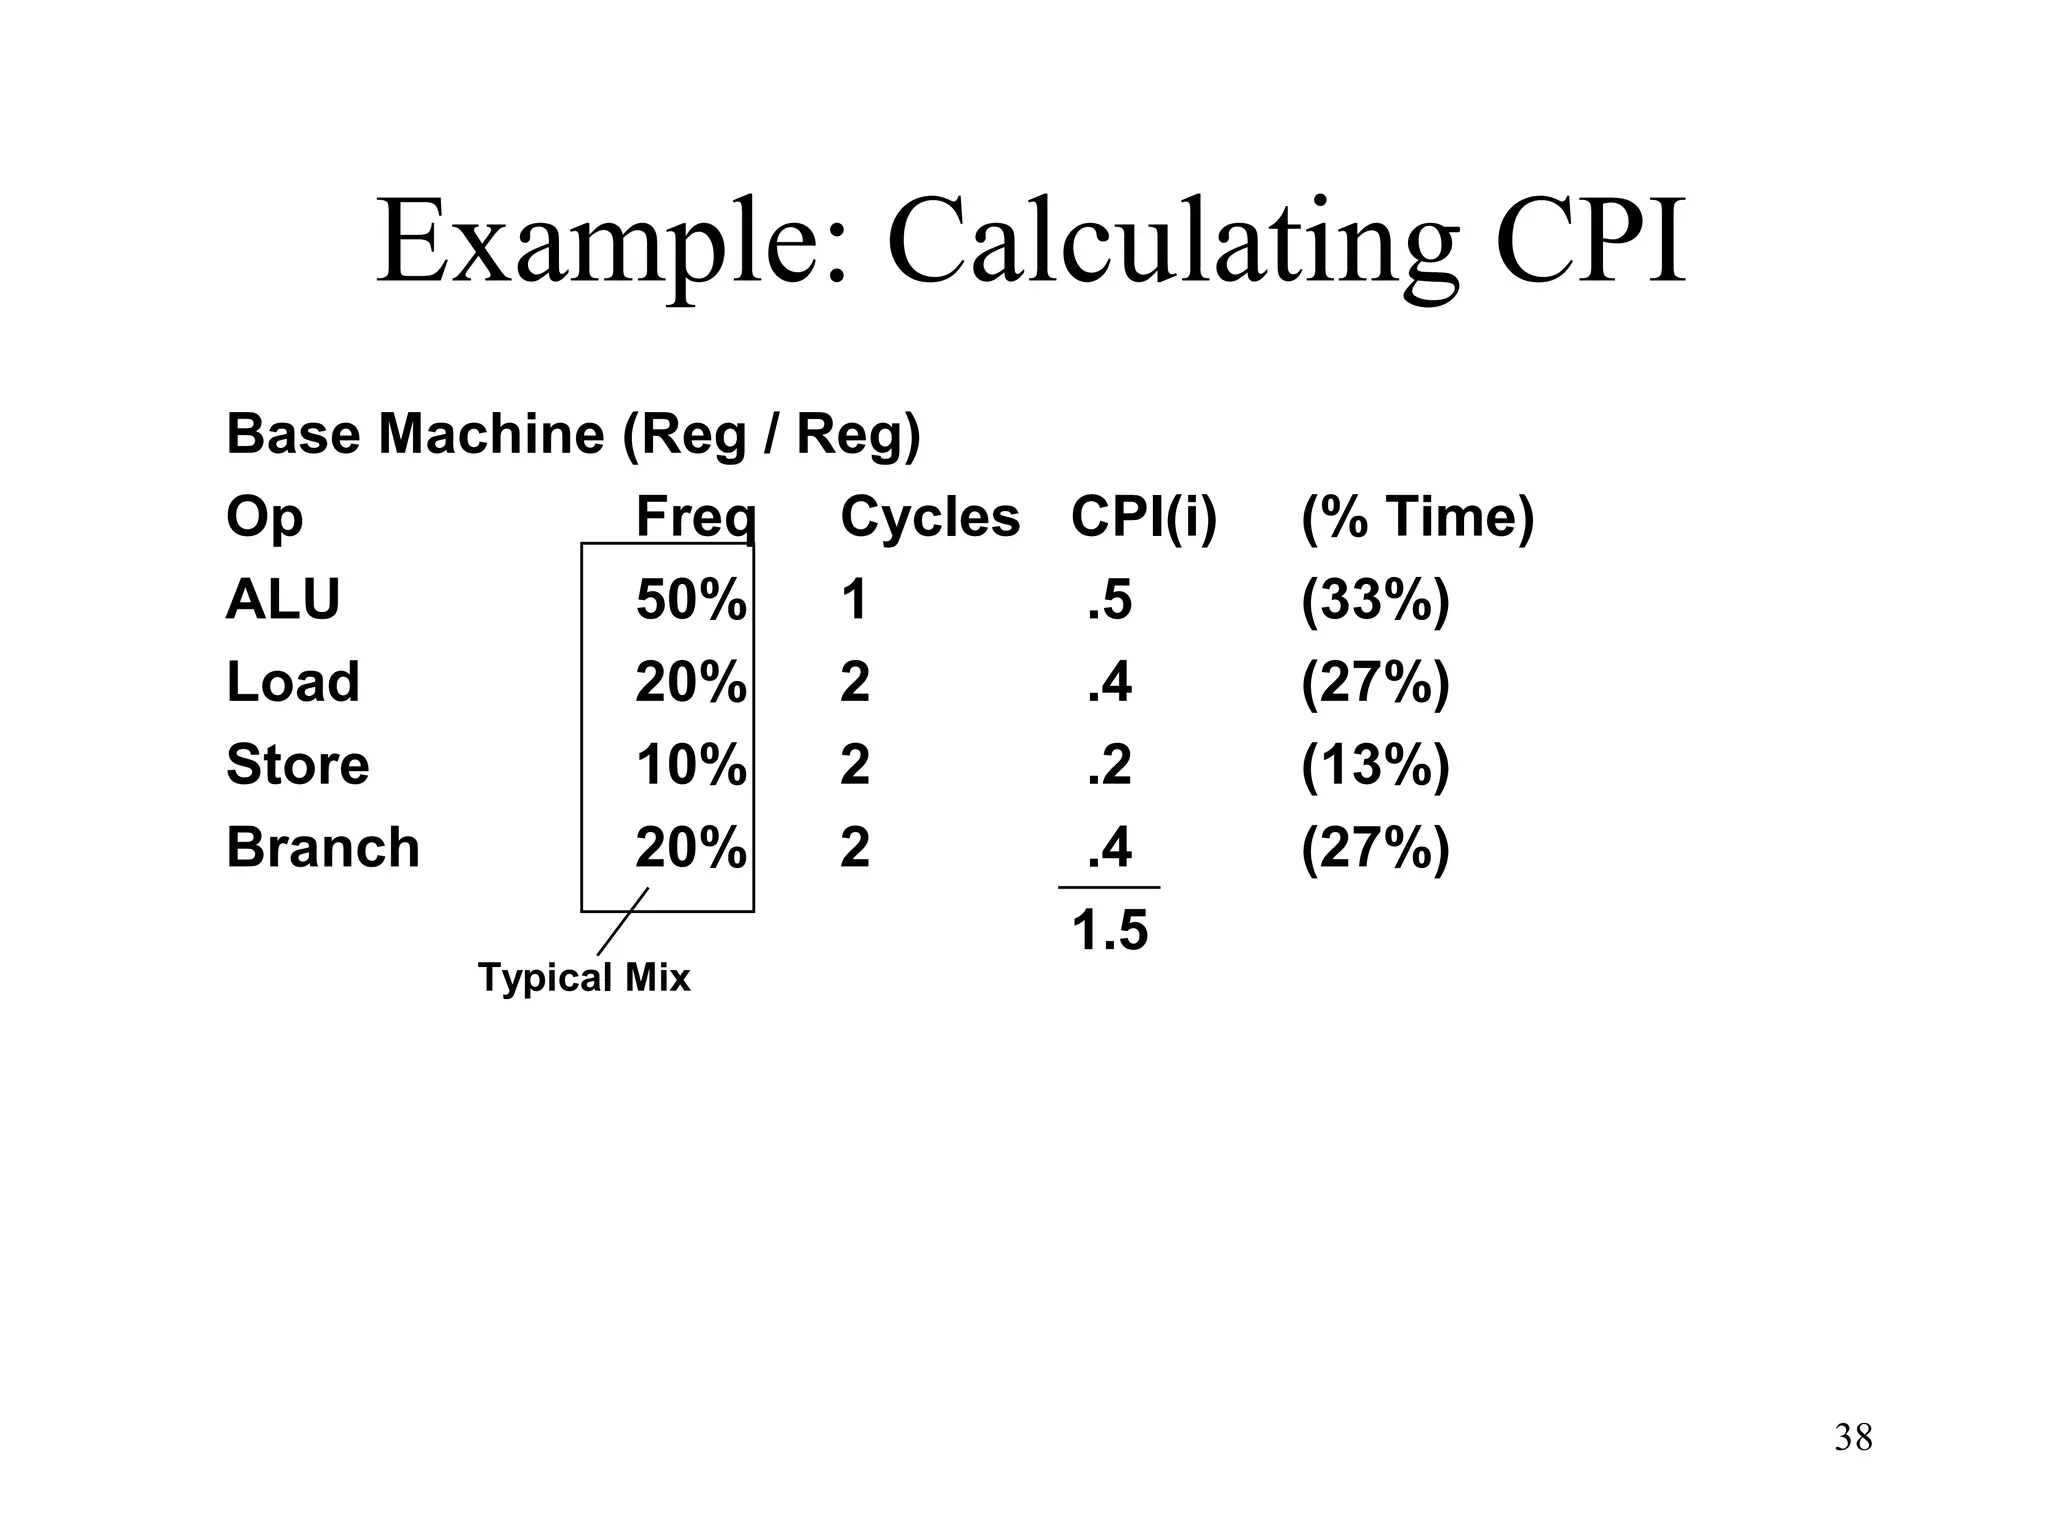
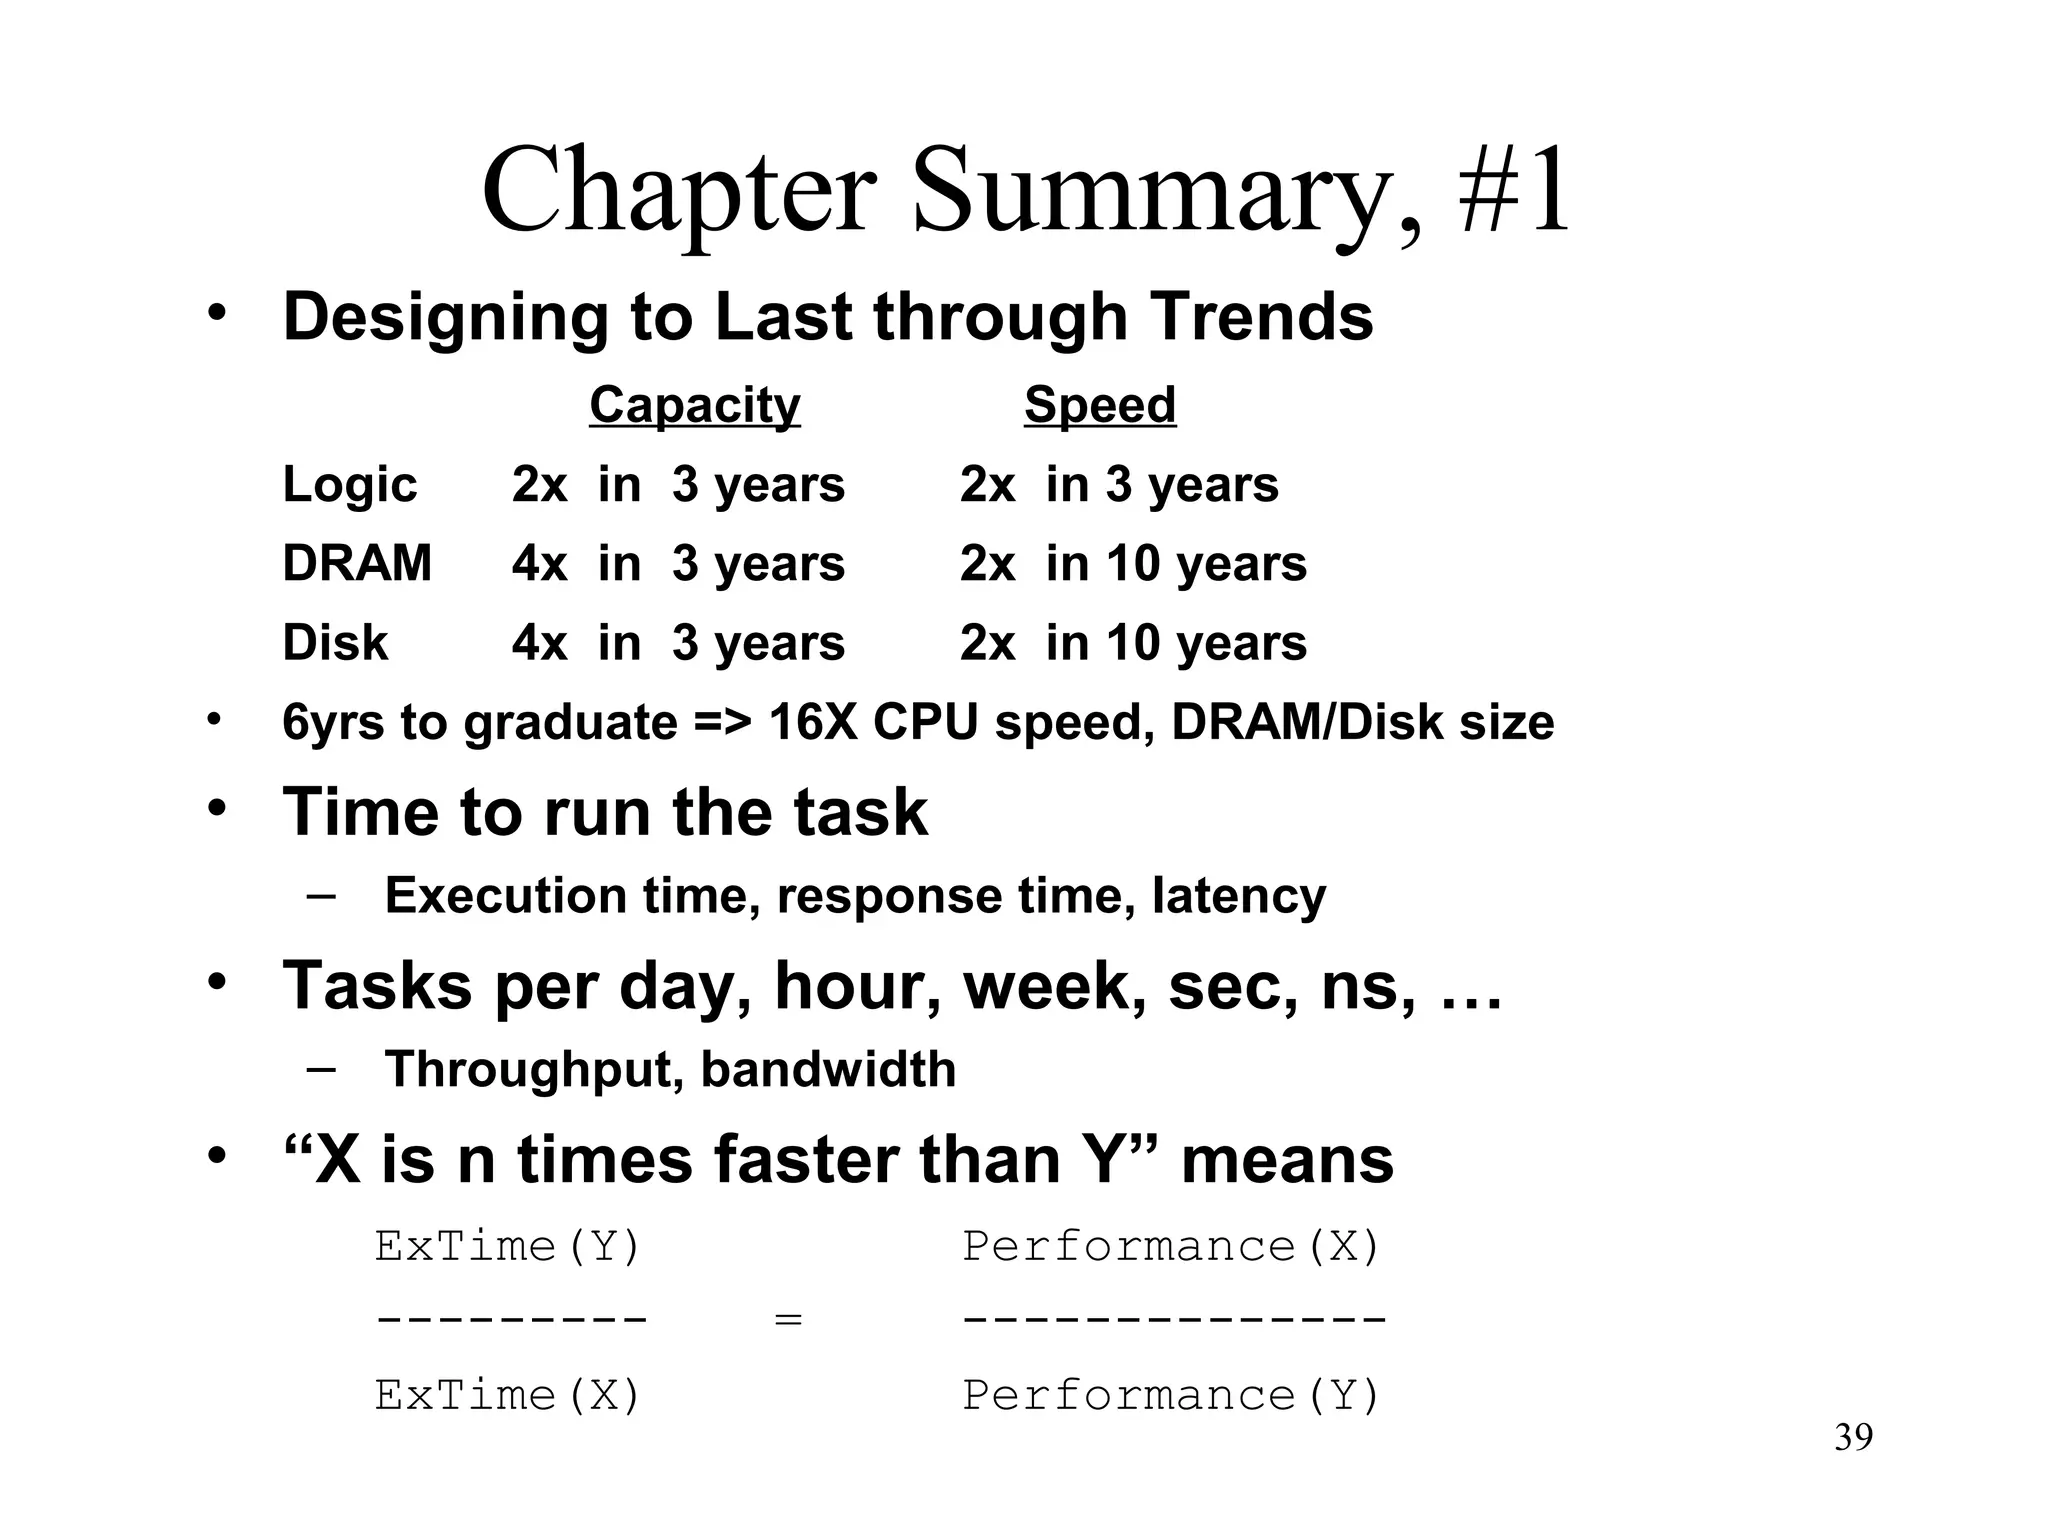
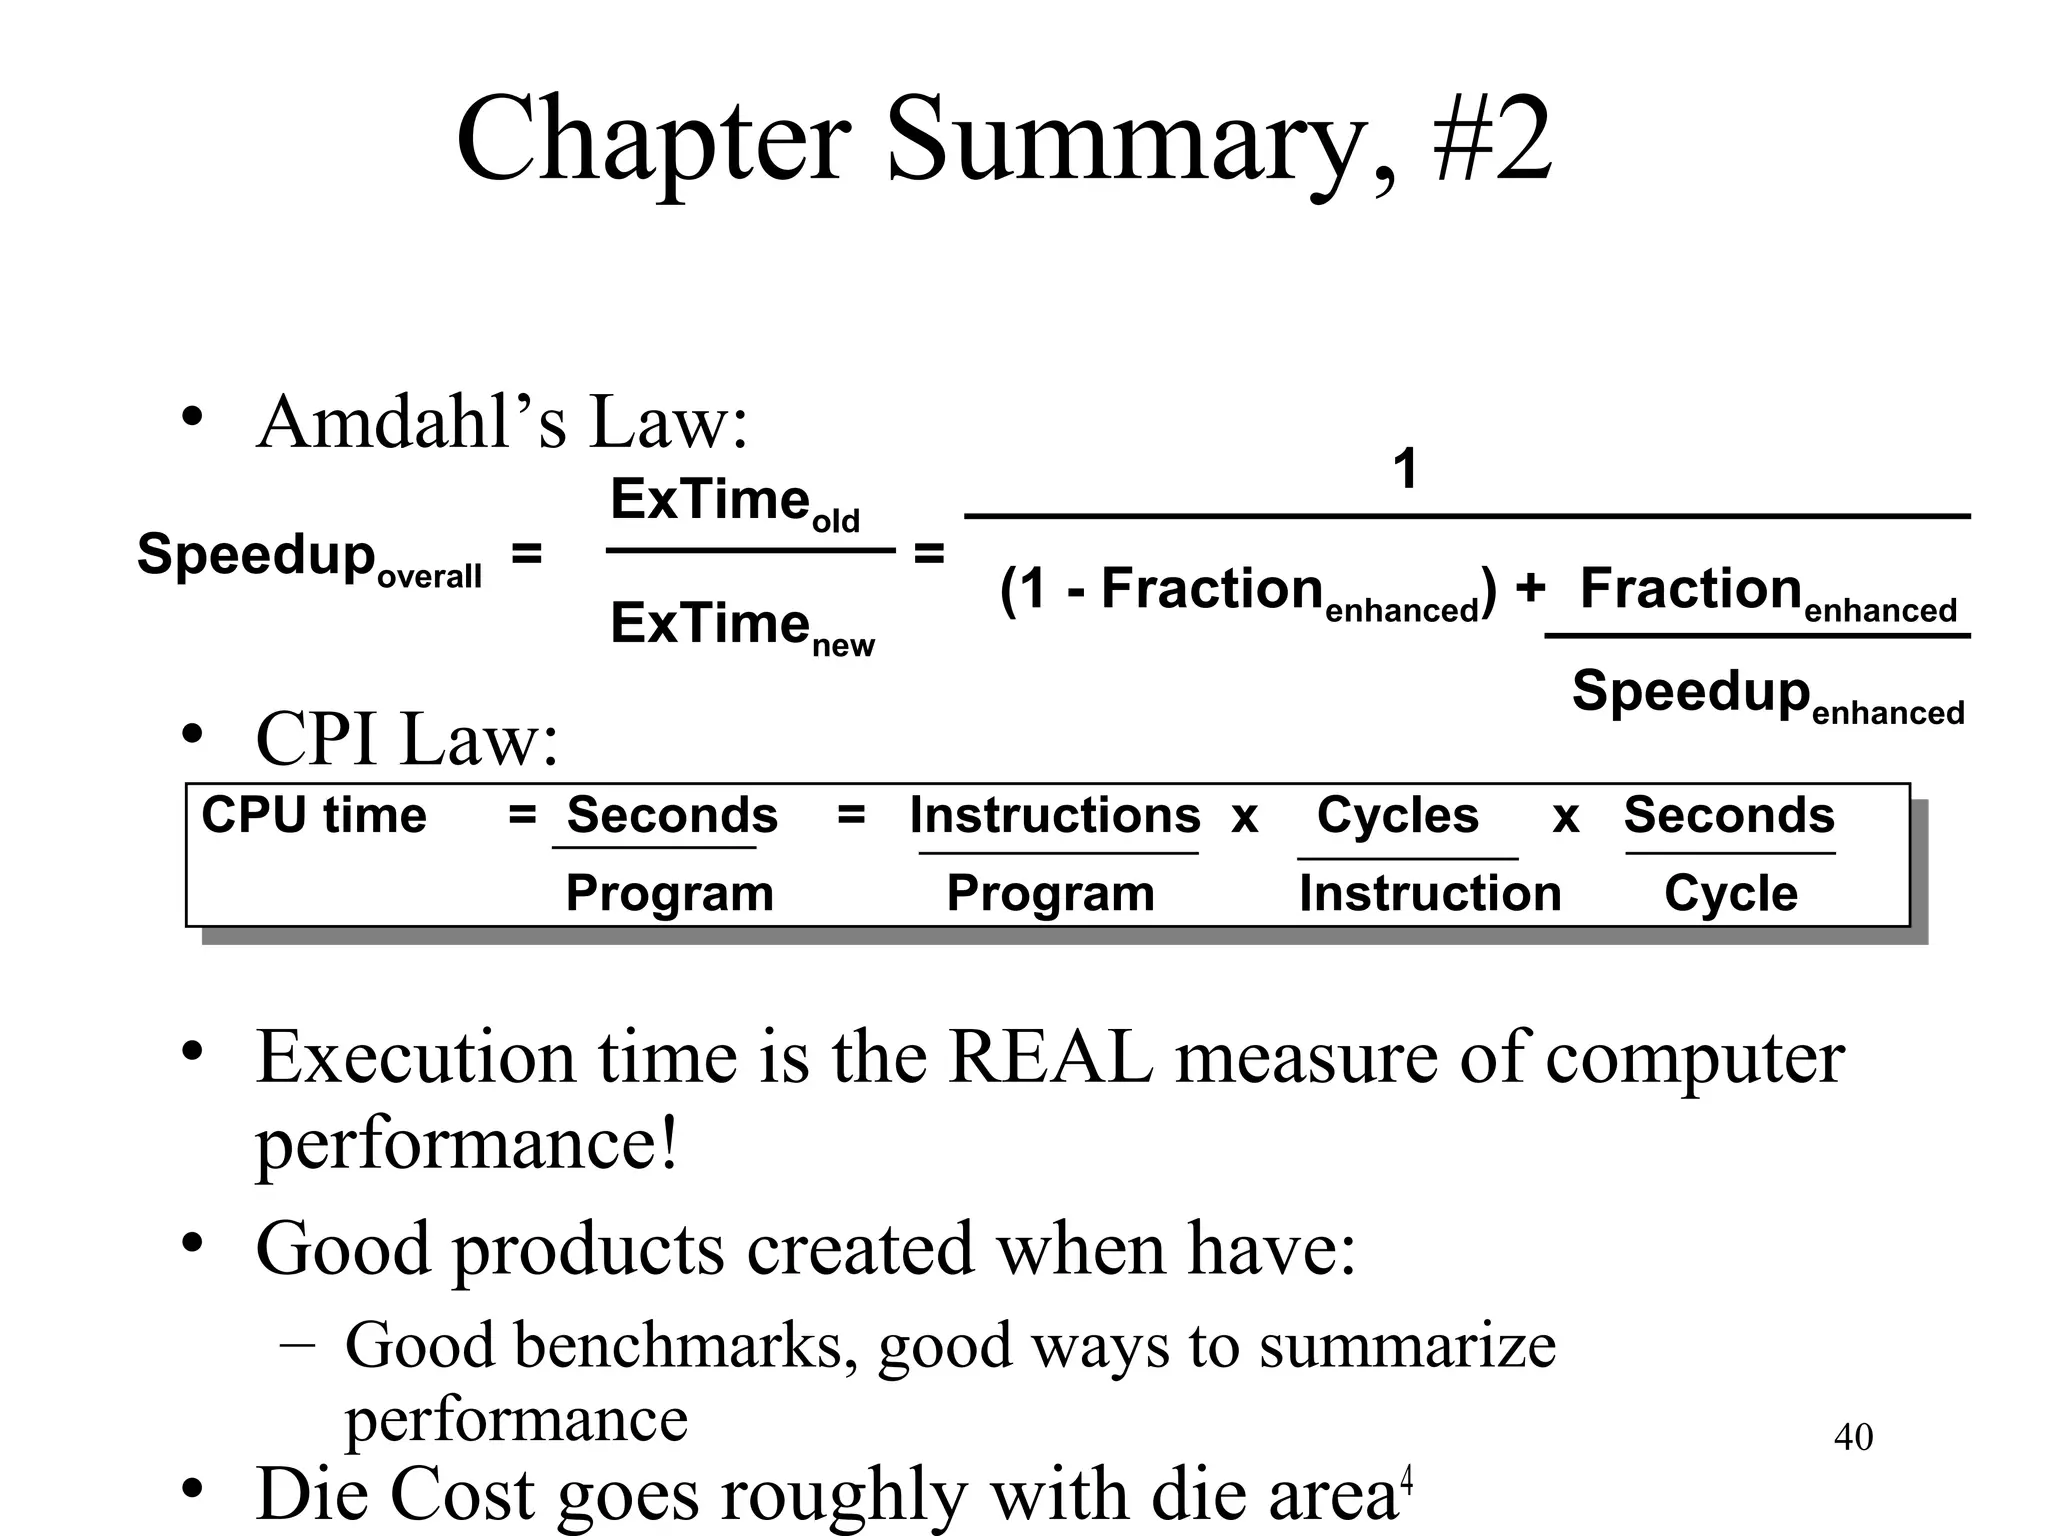
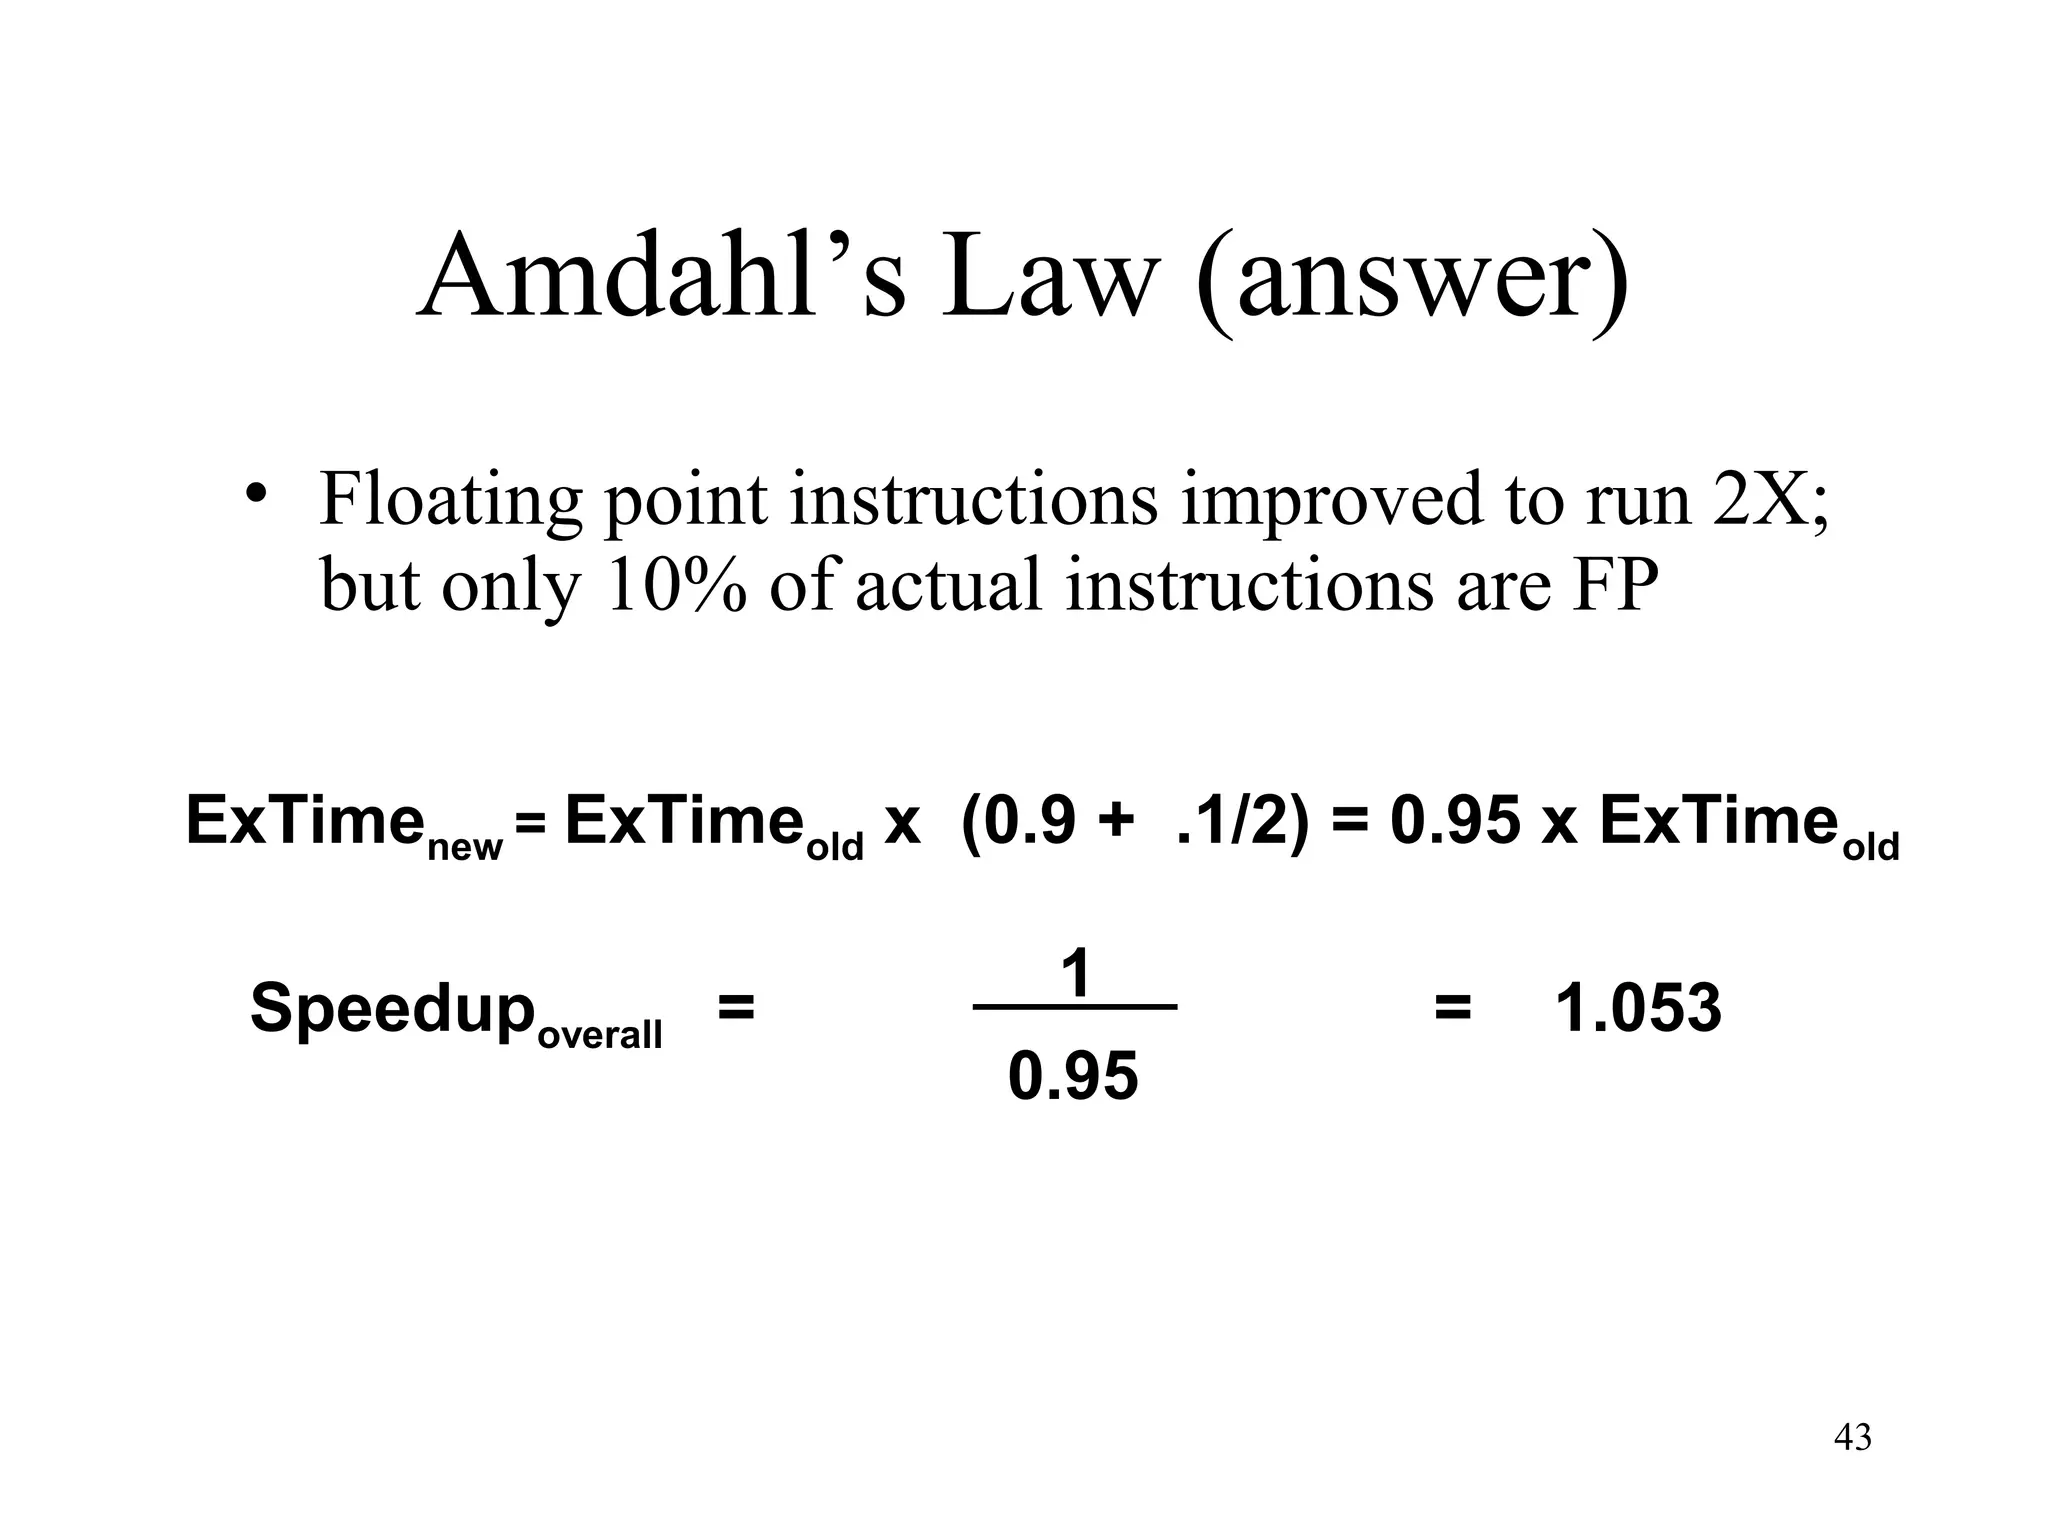

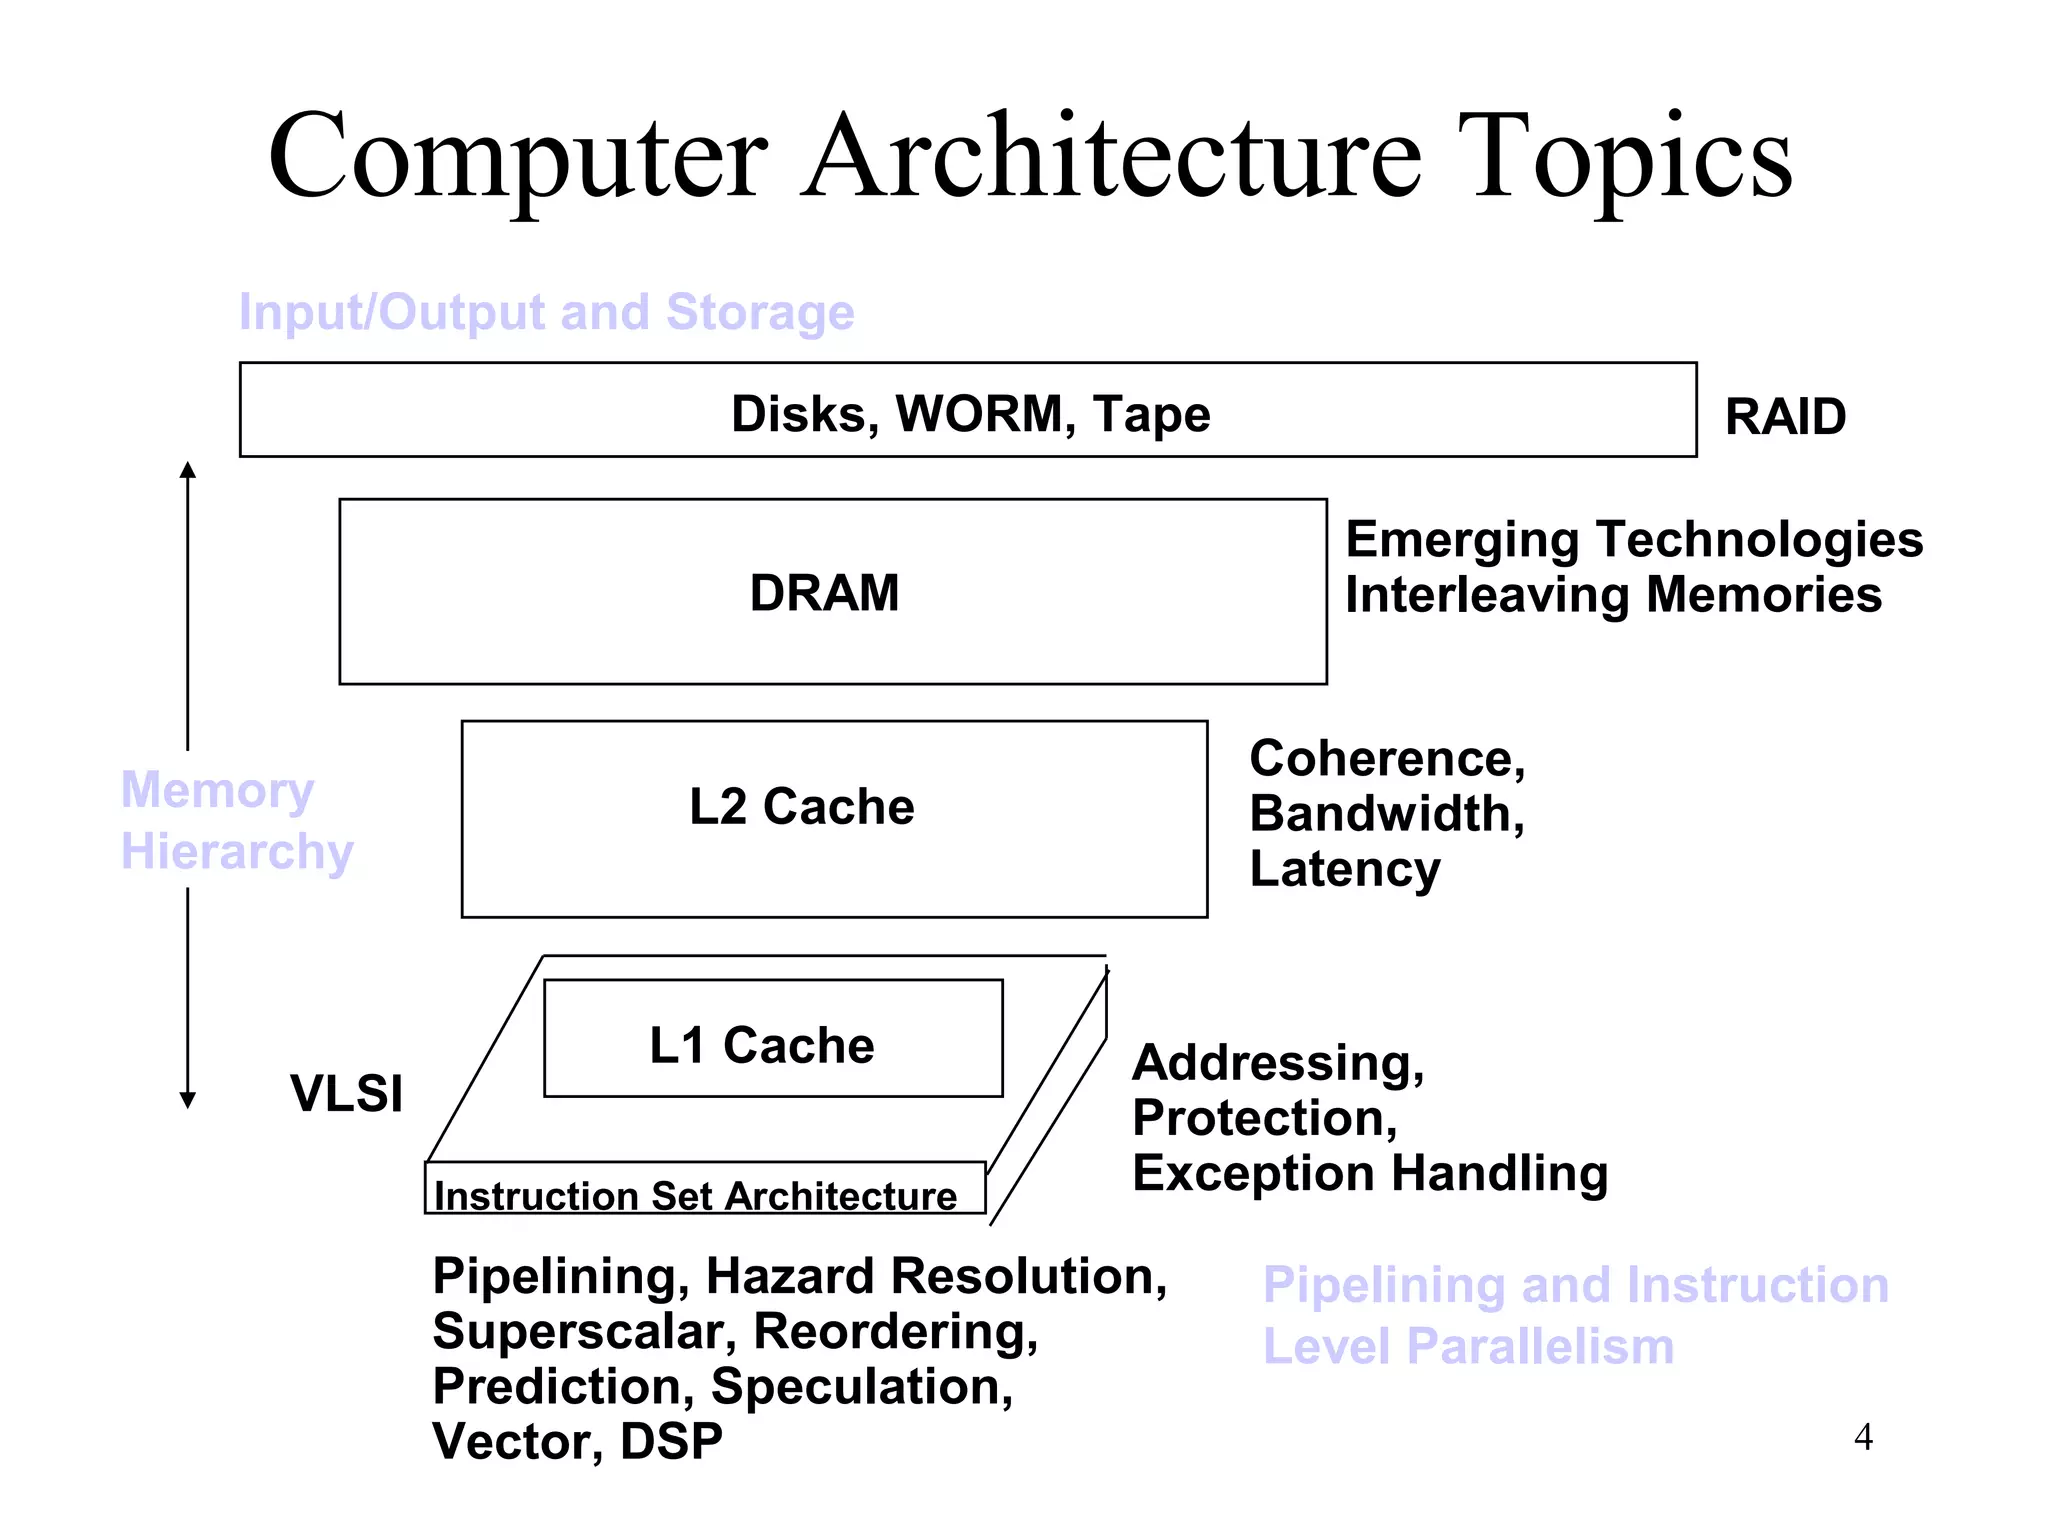
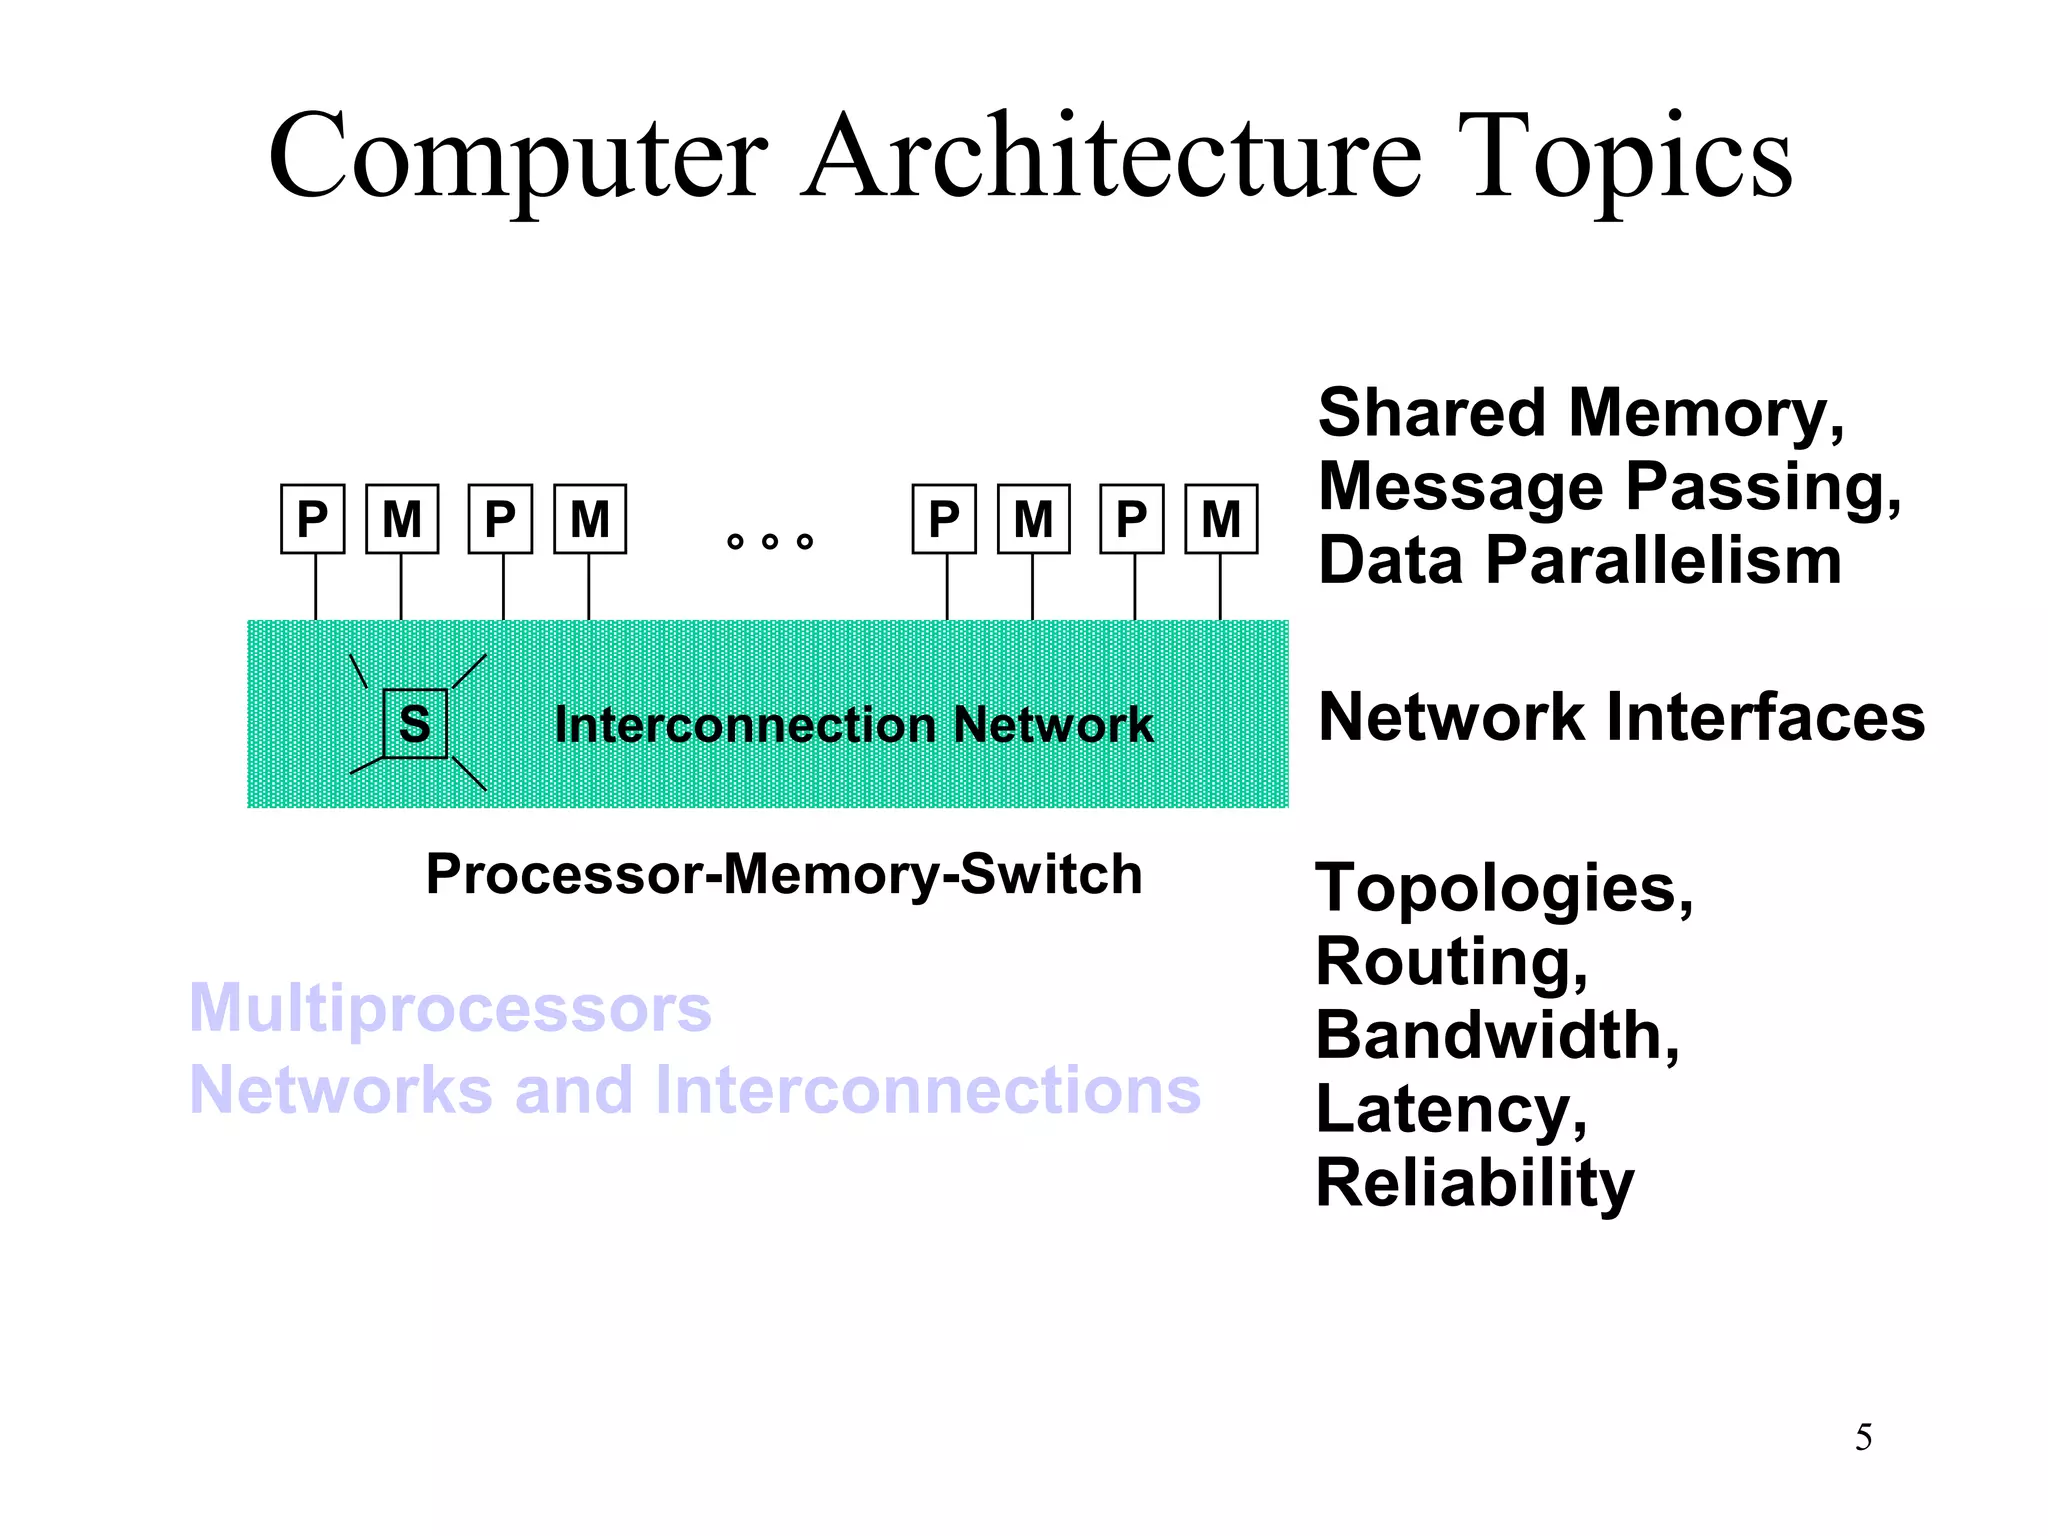
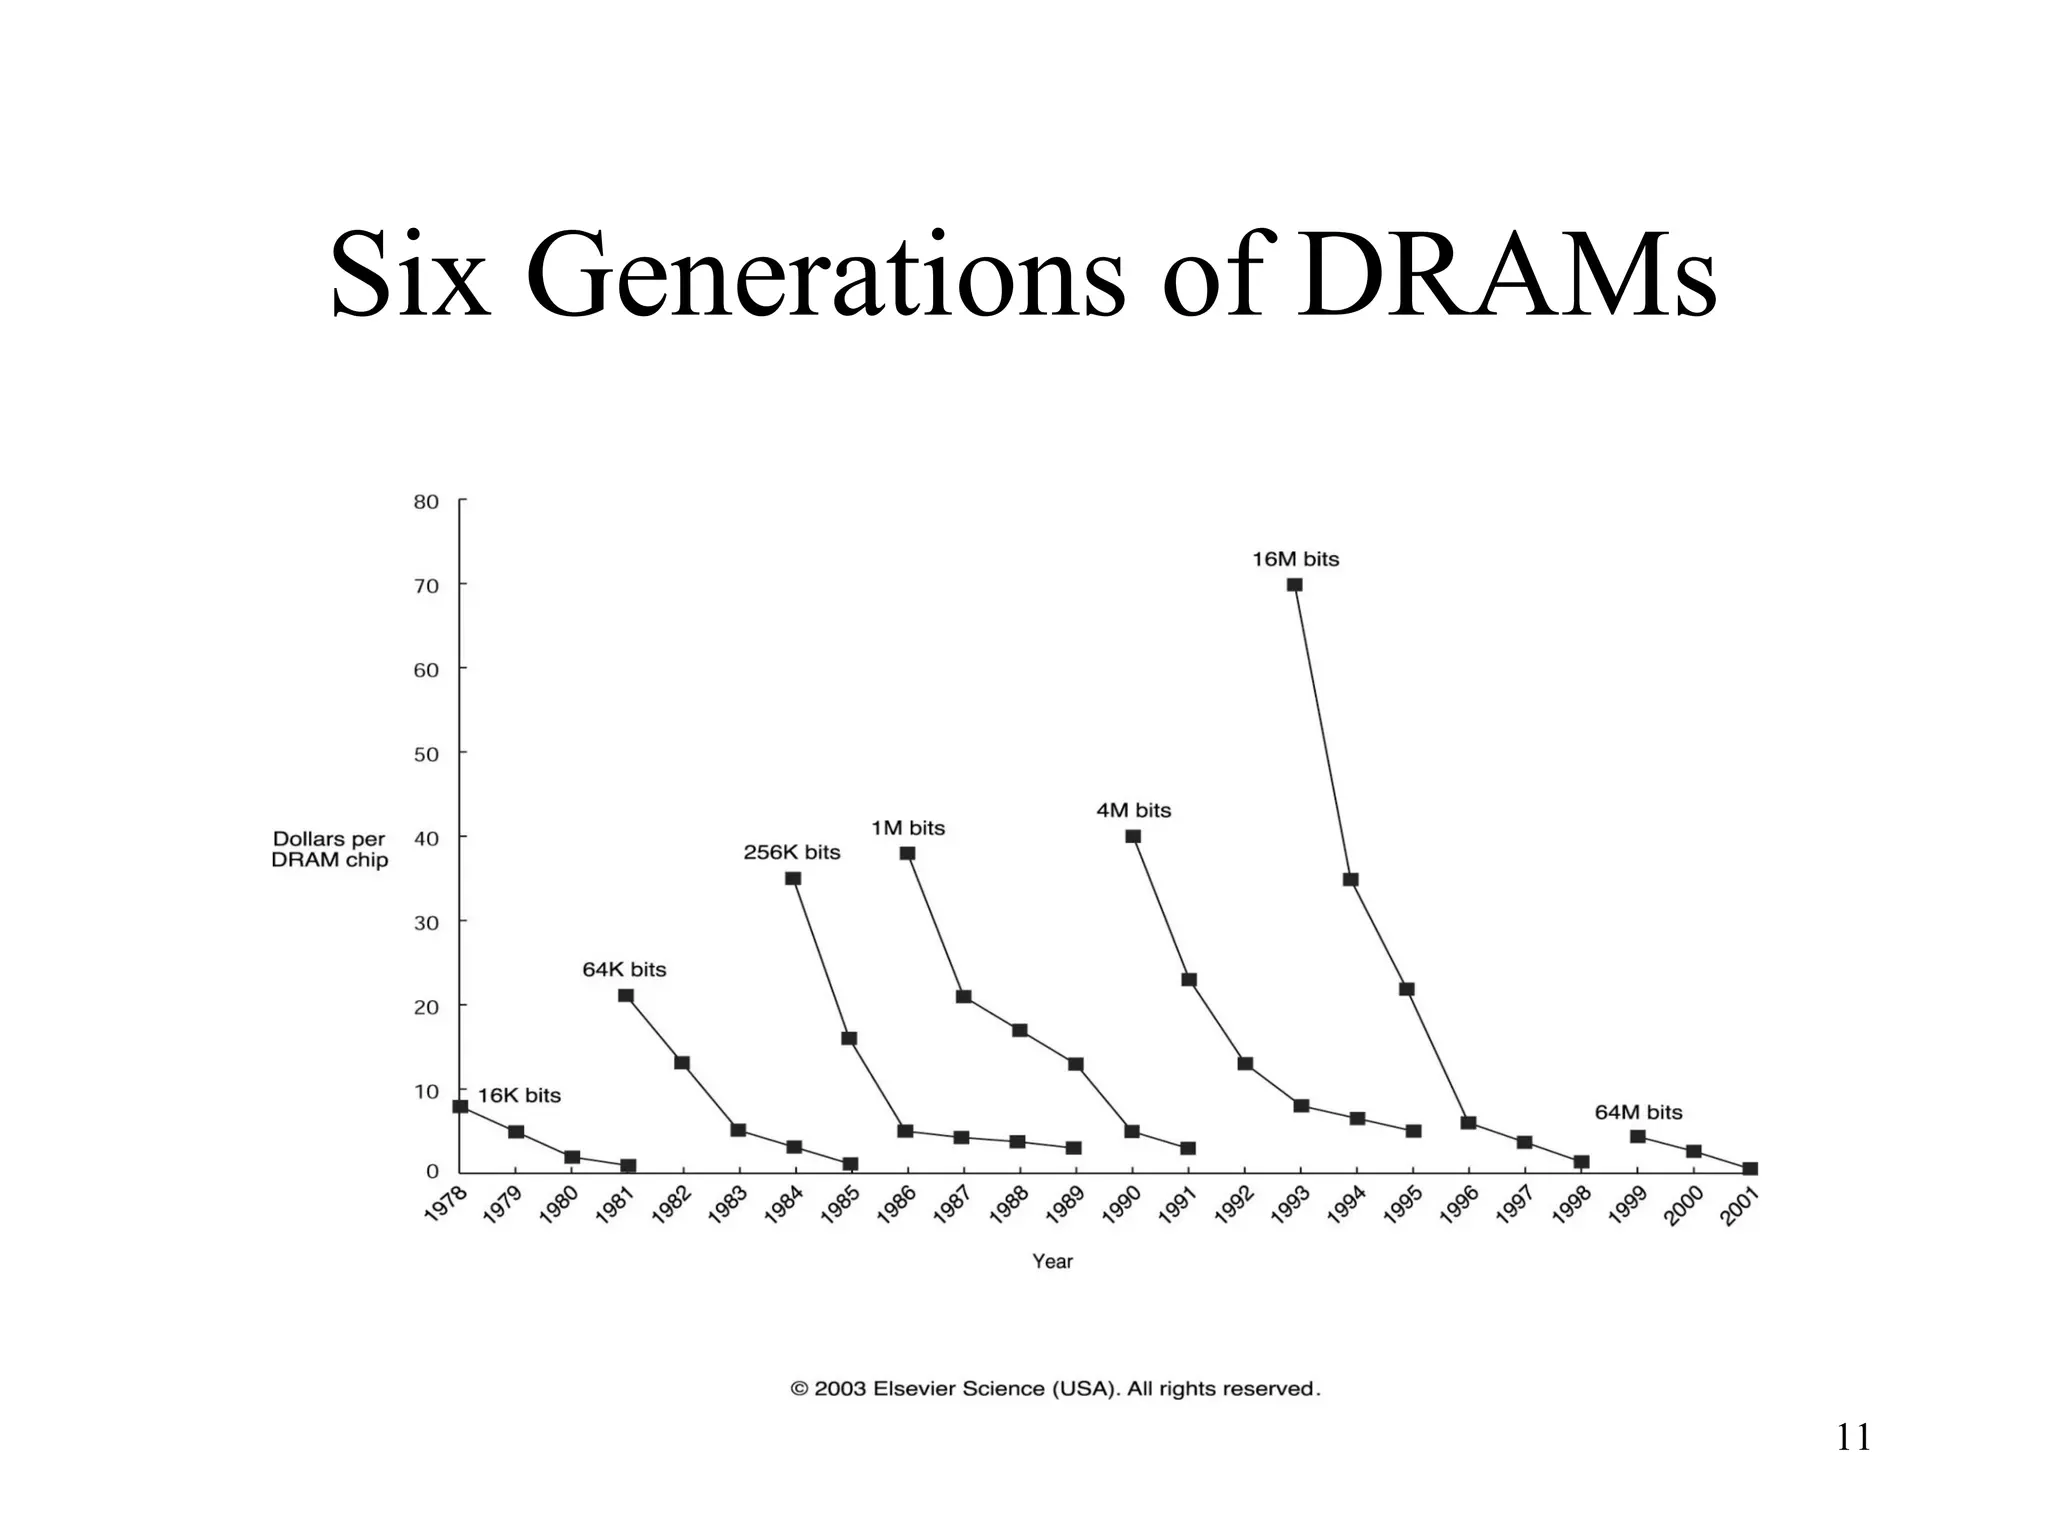
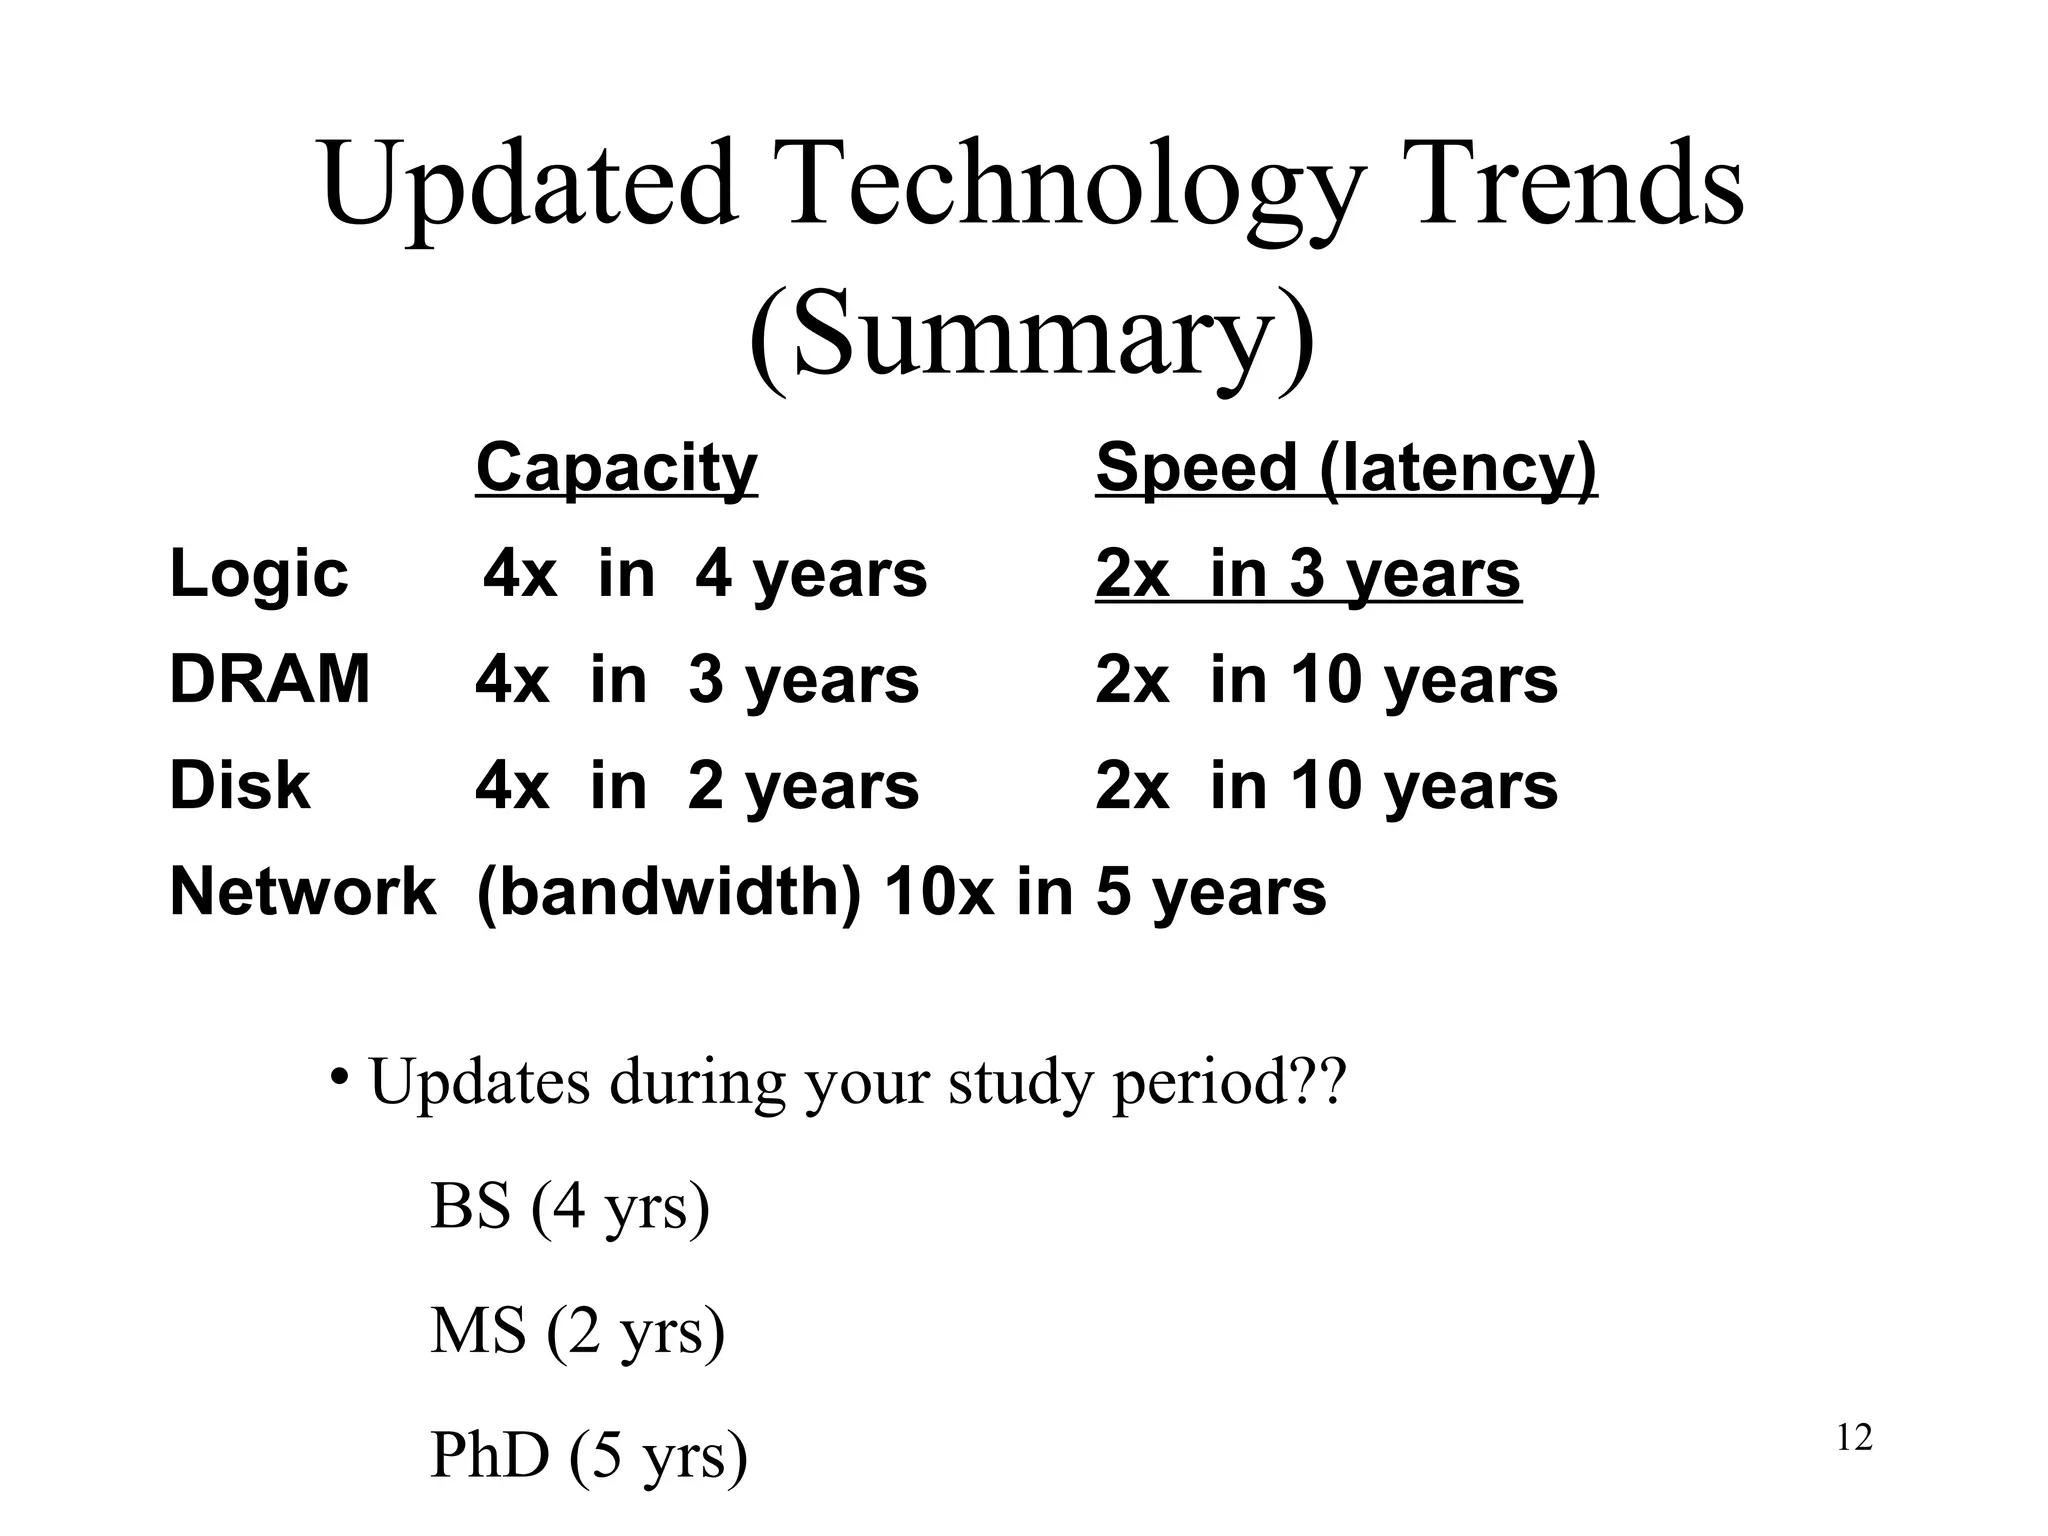
The document discusses key topics in computer architecture including instruction set architecture, pipelining, memory hierarchy, parallelism, and performance evaluation metrics. It notes that computer performance is measured by execution time, throughput, or latency. Trends show that logic, DRAM, and disk capacities double every 2-3 years while speeds improve more slowly. Amdahl's Law and the CPI equation are introduced as quantitative principles for evaluating performance improvements and tradeoffs.