Downloaded 16 times
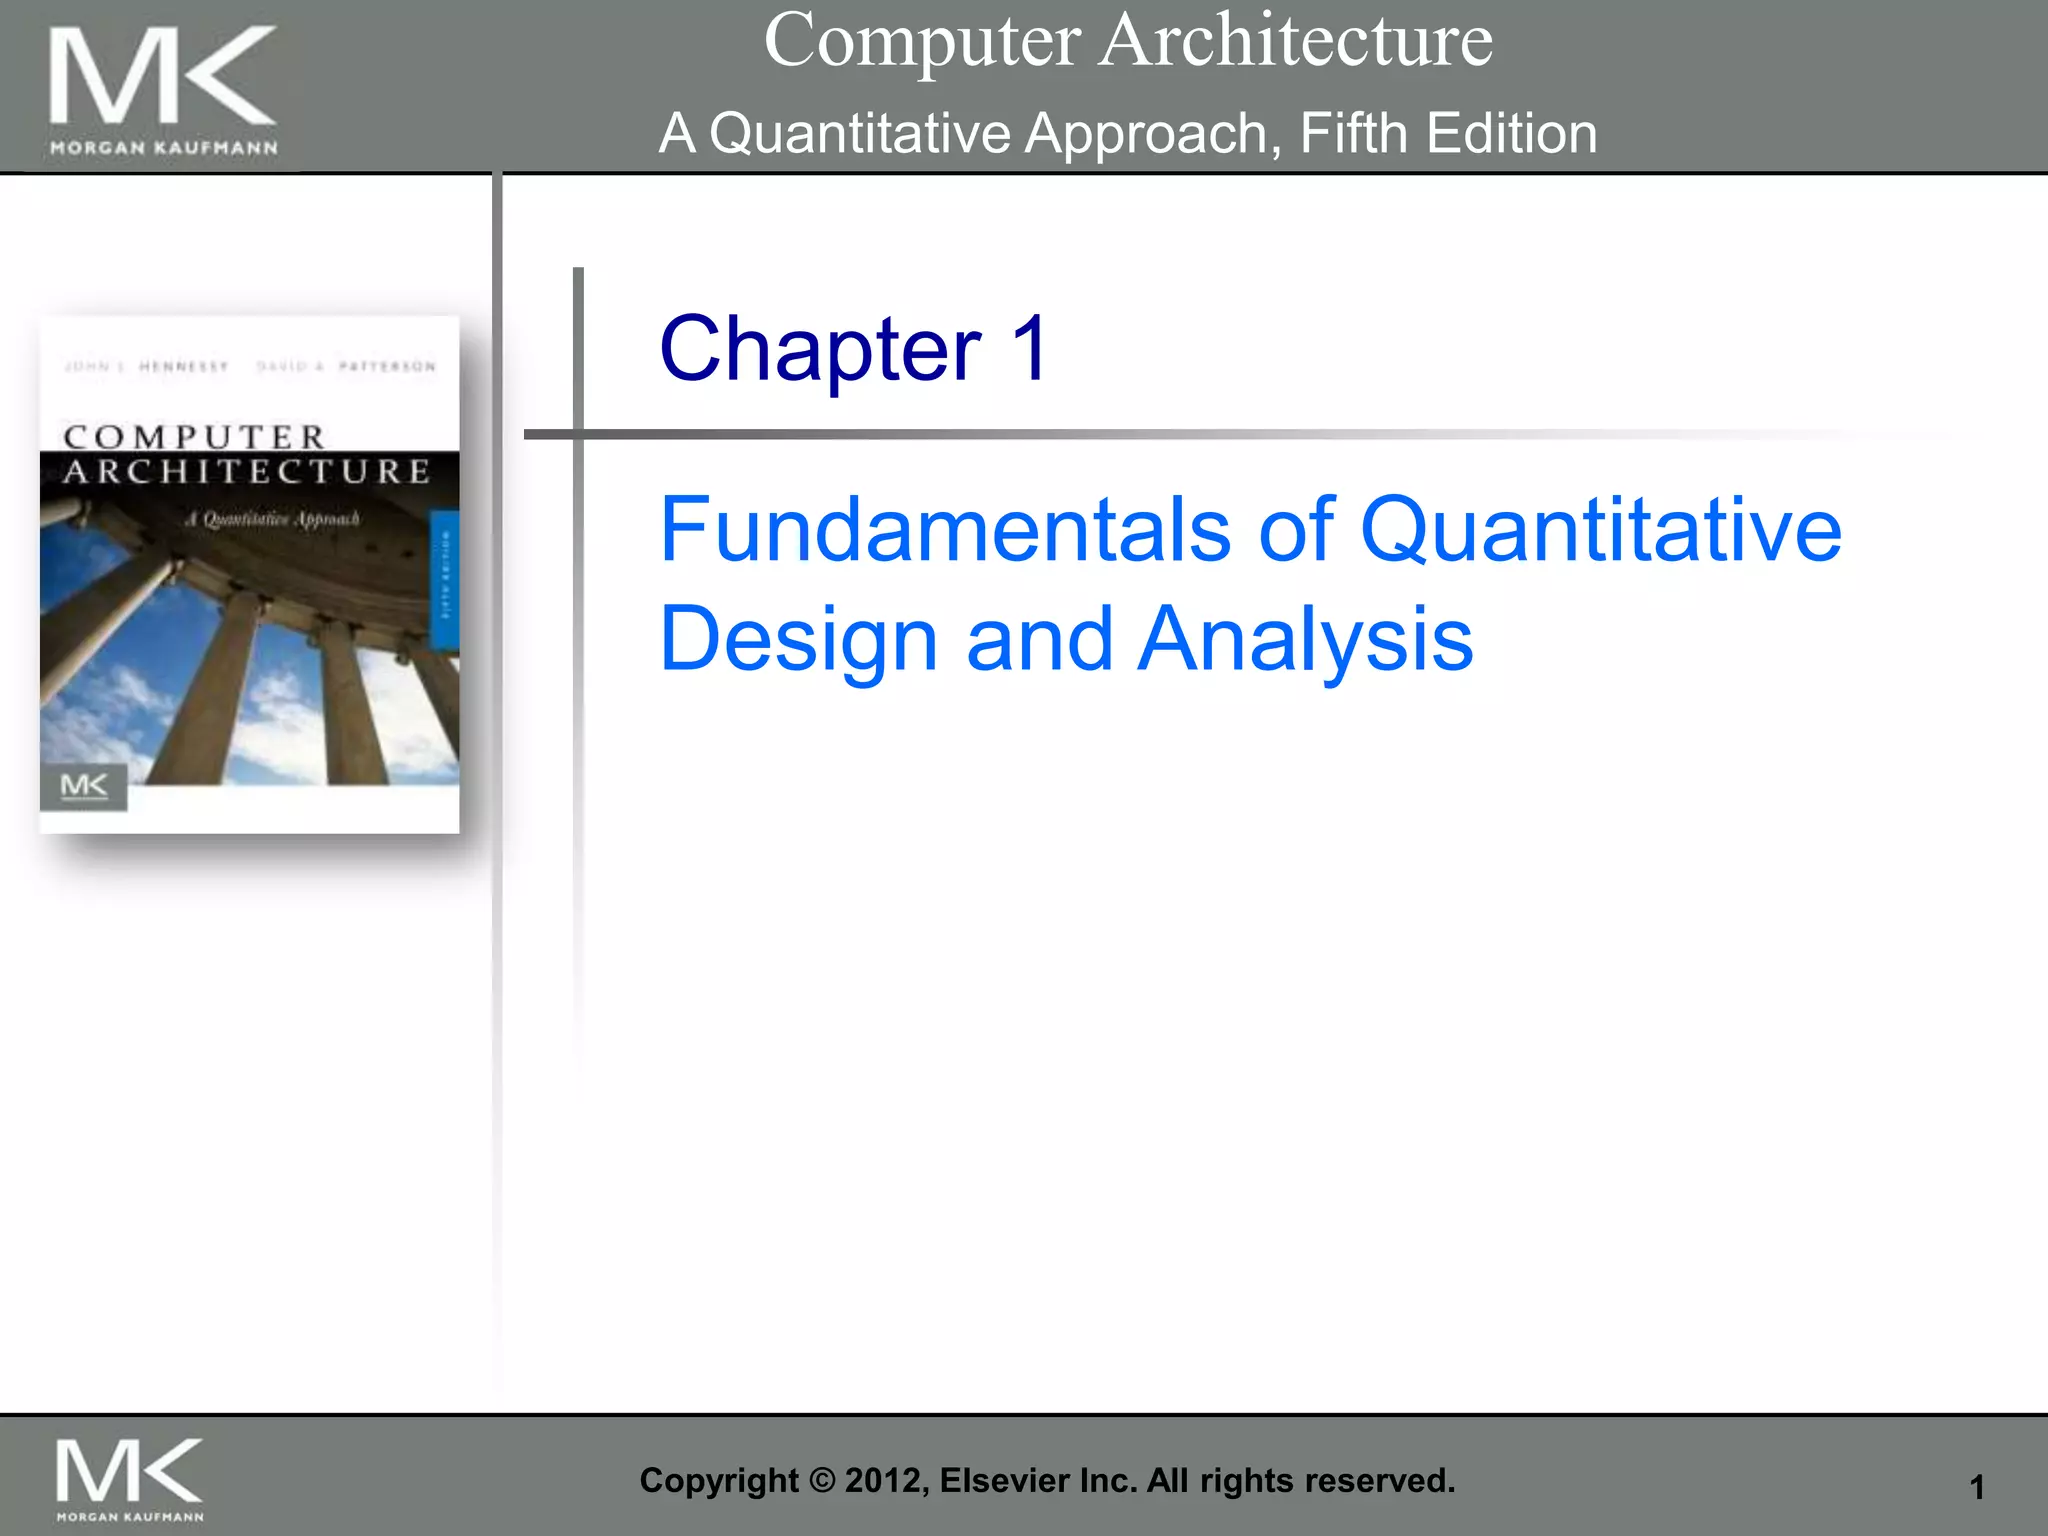
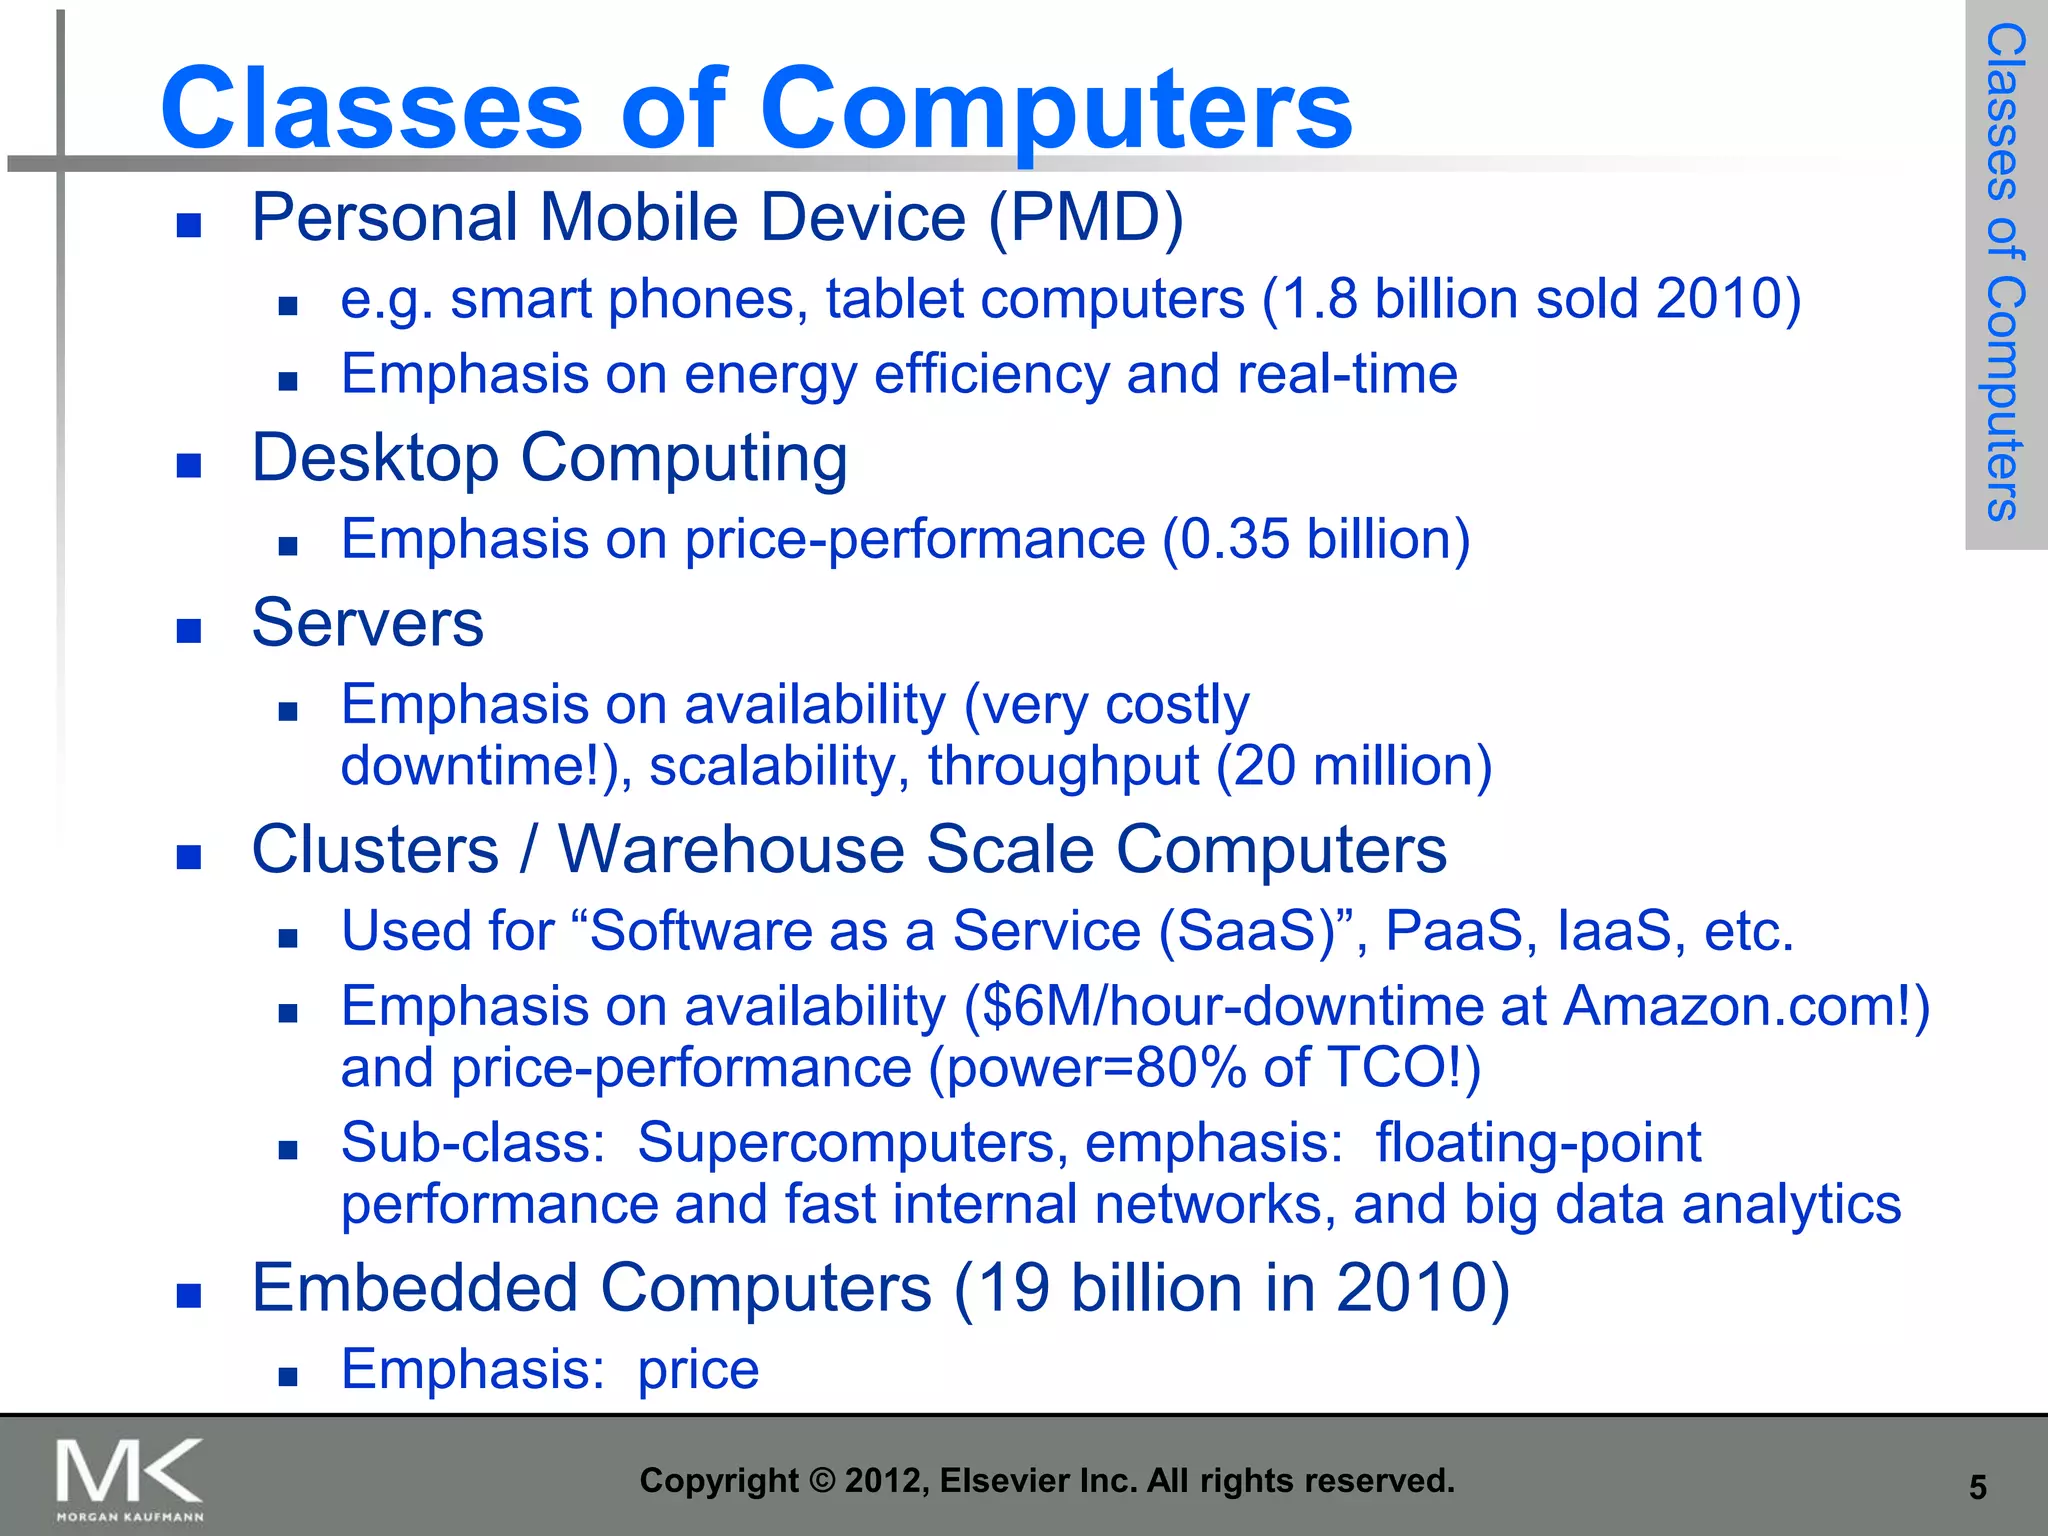
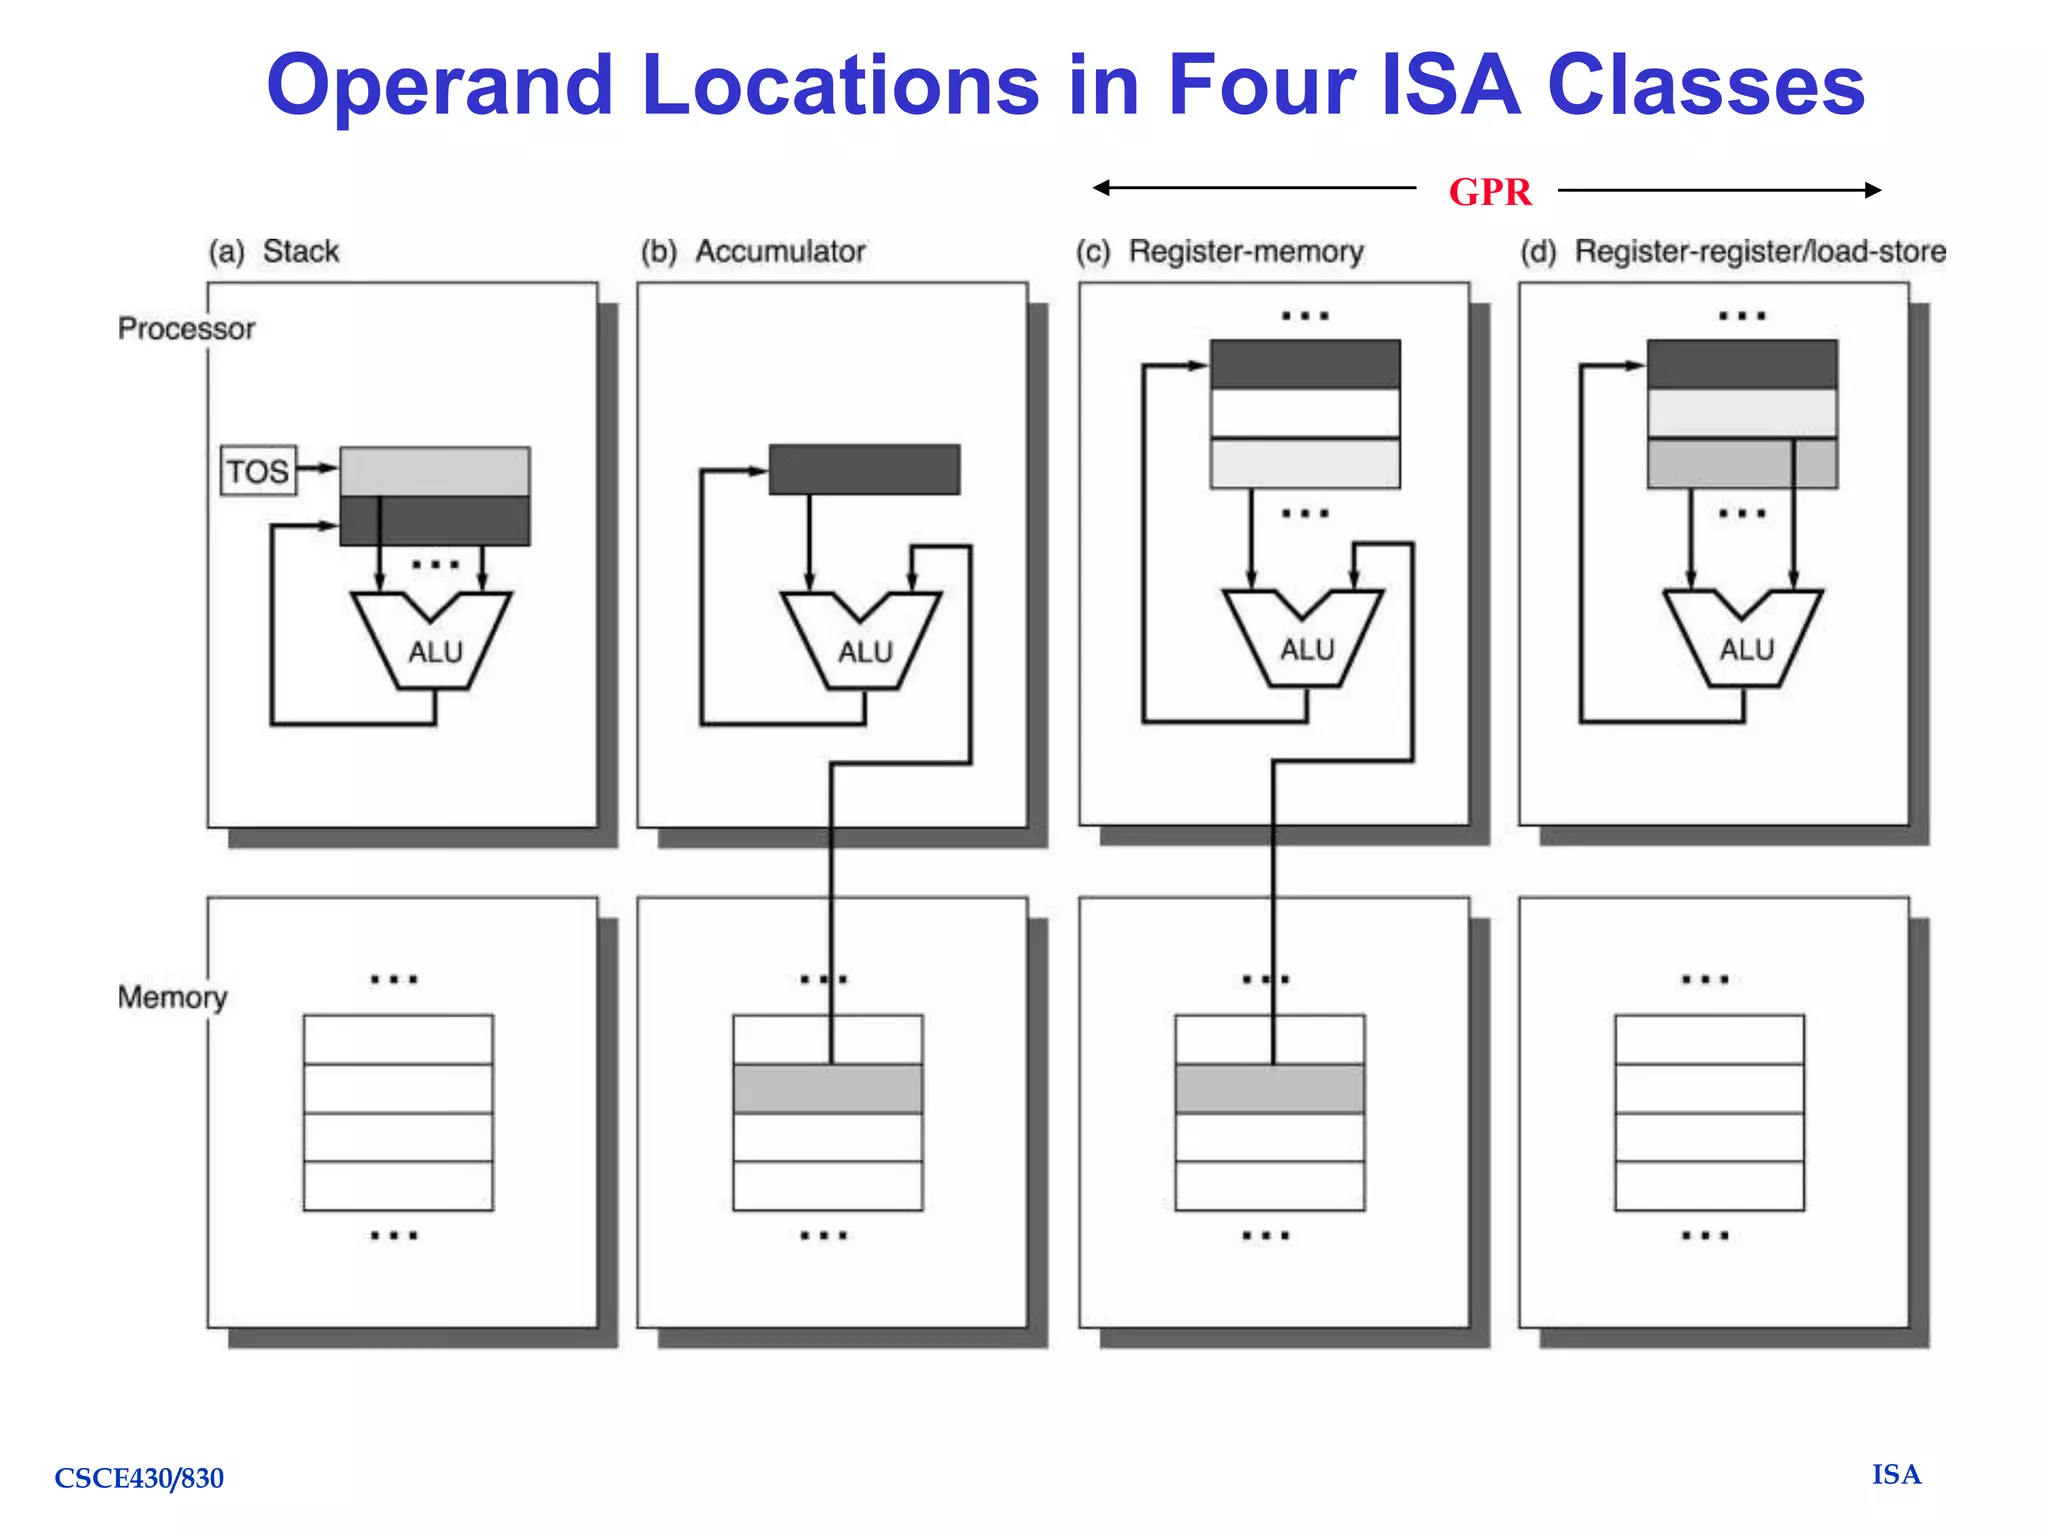
![Classifying ISAs
Accumulator (before 1960, e.g. 68HC11):
1-address
add A
acc acc + mem[A]
Stack (1960s to 1970s):
0-address
add
tos tos + next
Memory-Memory (1970s to 1980s):
2-address
3-address
add A, B
add A, B, C
mem[A] mem[A] + mem[B]
mem[A] mem[B] + mem[C]
Register-Memory (1970s to present, e.g. 80x86):
2-address
add R1, A
load R1, A
R1 R1 + mem[A]
R1 mem[A]
Register-Register (Load/Store, RISC) (1960s to present, e.g.
MIPS):
3-address
CSCE430/830
add R1, R2, R3
load R1, R2
store R1, R2
R1 R2 + R3
R1 mem[R2]
mem[R1] R2
ISA](https://image.slidesharecdn.com/caqa5ech1withreviewandexamples-131202085123-phpapp02/75/Caqa5e-ch1-with_review_and_examples-28-2048.jpg)
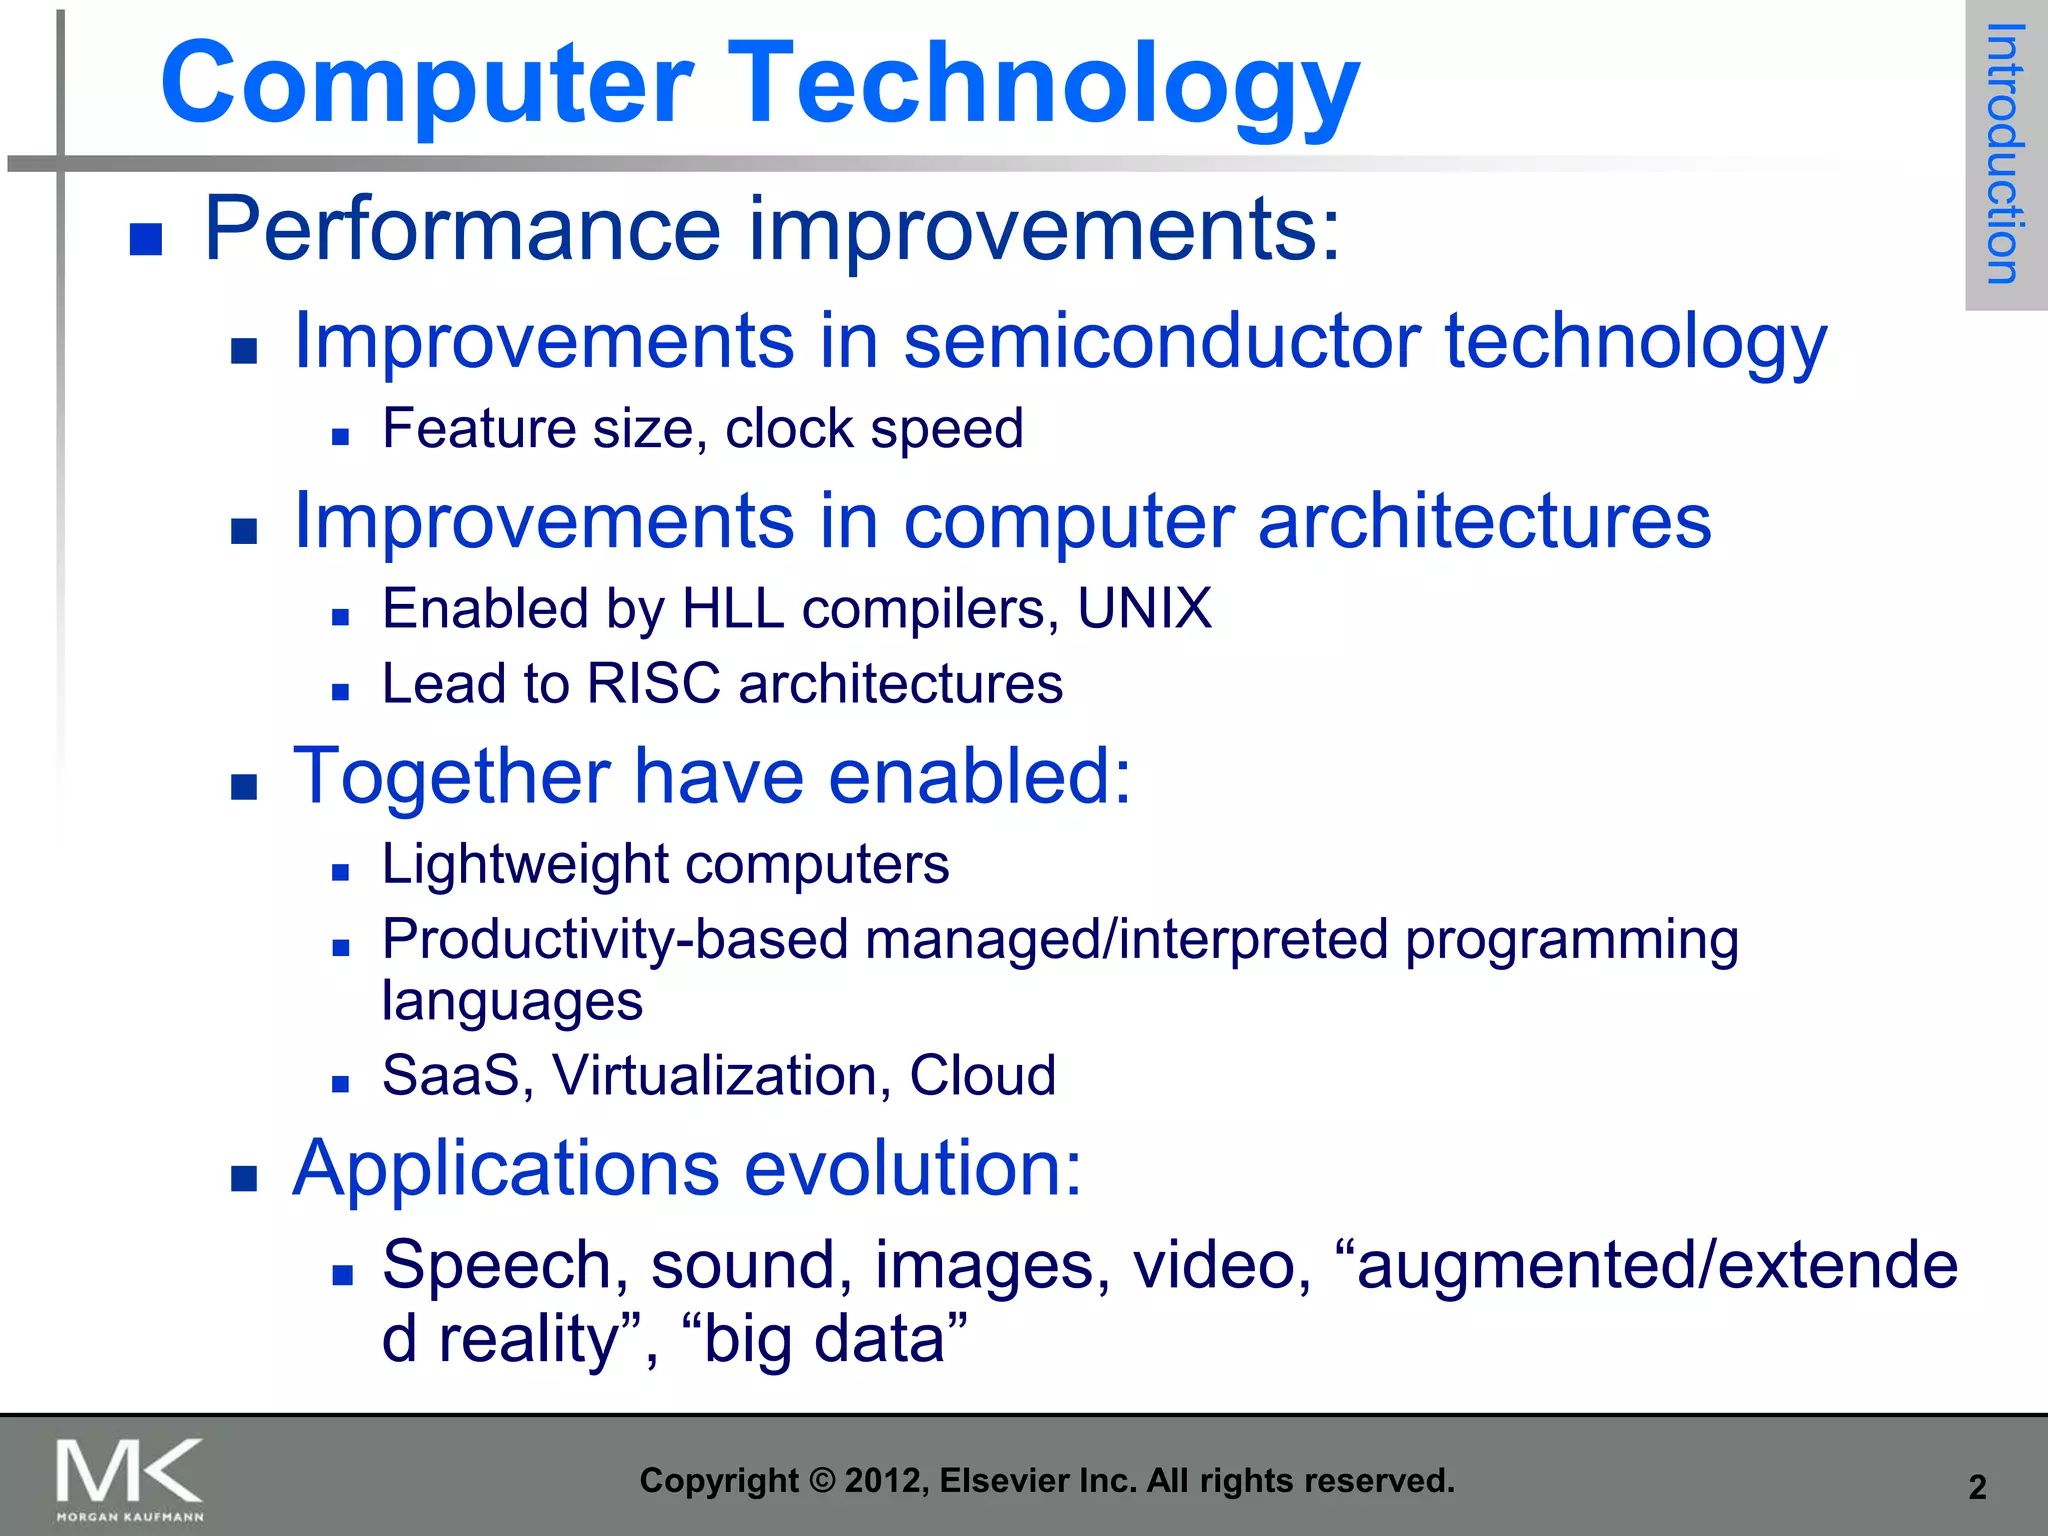
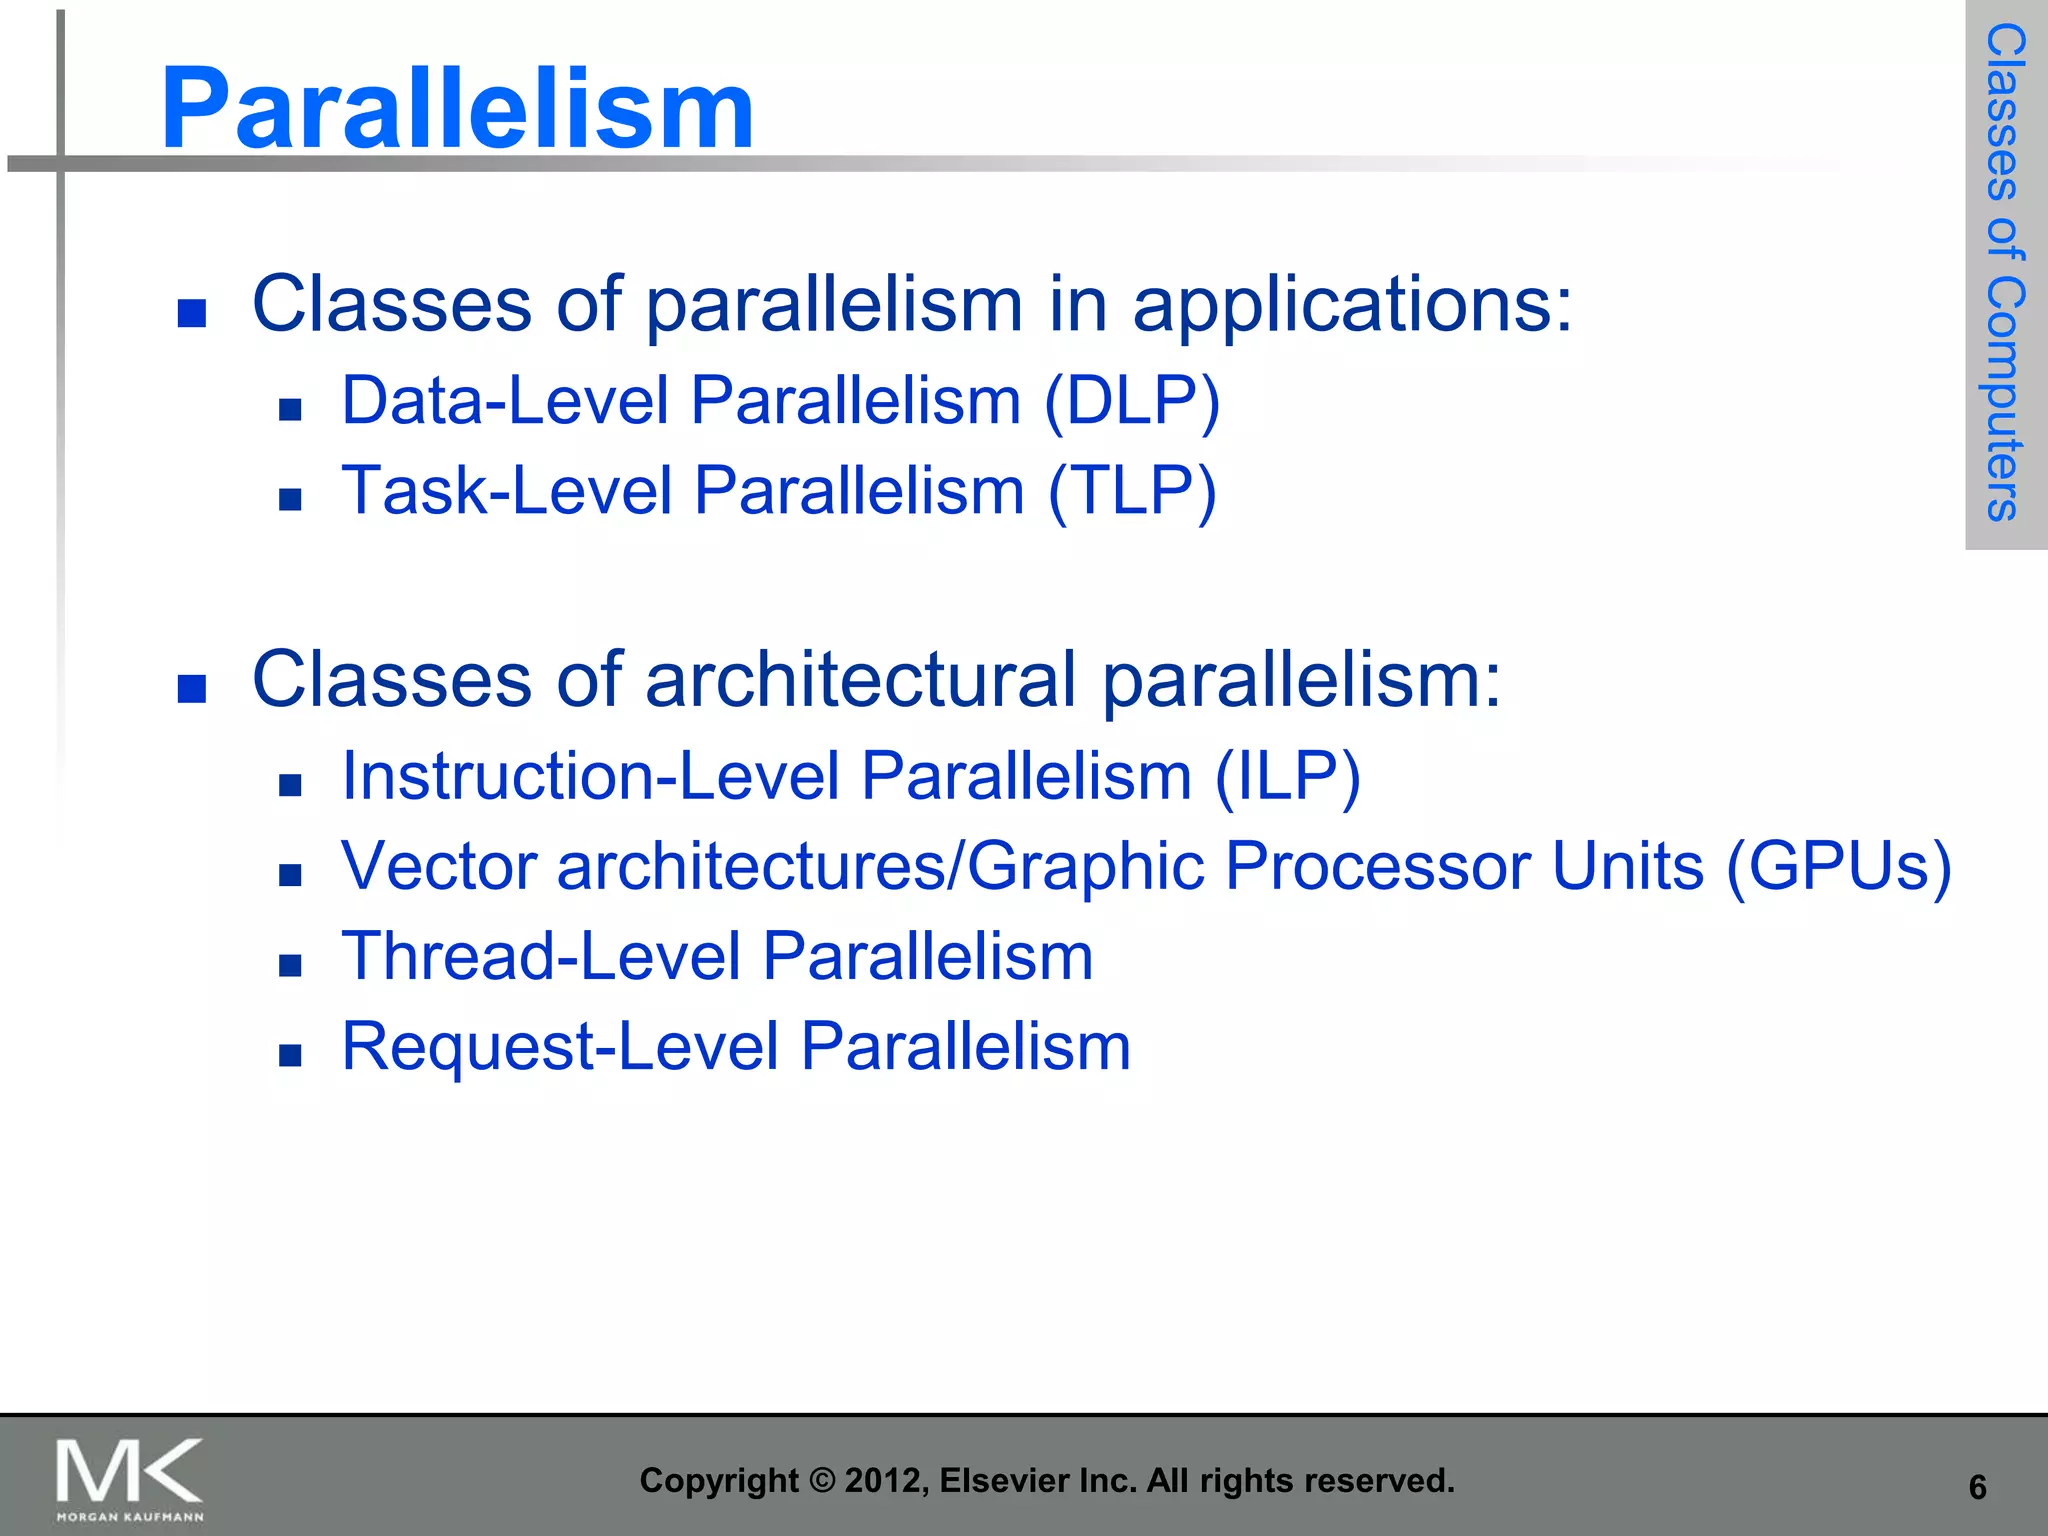
![Code Sequence C = A + B
for Four Instruction Sets
Stack
Accumulator
Push A
Push B
Add
Pop C
Load A
Add B
Store C
memory
CSCE430/830
acc = acc + mem[C]
Register
(register-memory)
Load R1, A
Add R1, B
Store C, R1
memory
R1 = R1 + mem[C]
Register (loadstore)
Load R1,A
Load R2, B
Add R3, R1, R2
Store C, R3
R3 = R1 + R2
ISA](https://image.slidesharecdn.com/caqa5ech1withreviewandexamples-131202085123-phpapp02/75/Caqa5e-ch1-with_review_and_examples-30-2048.jpg)
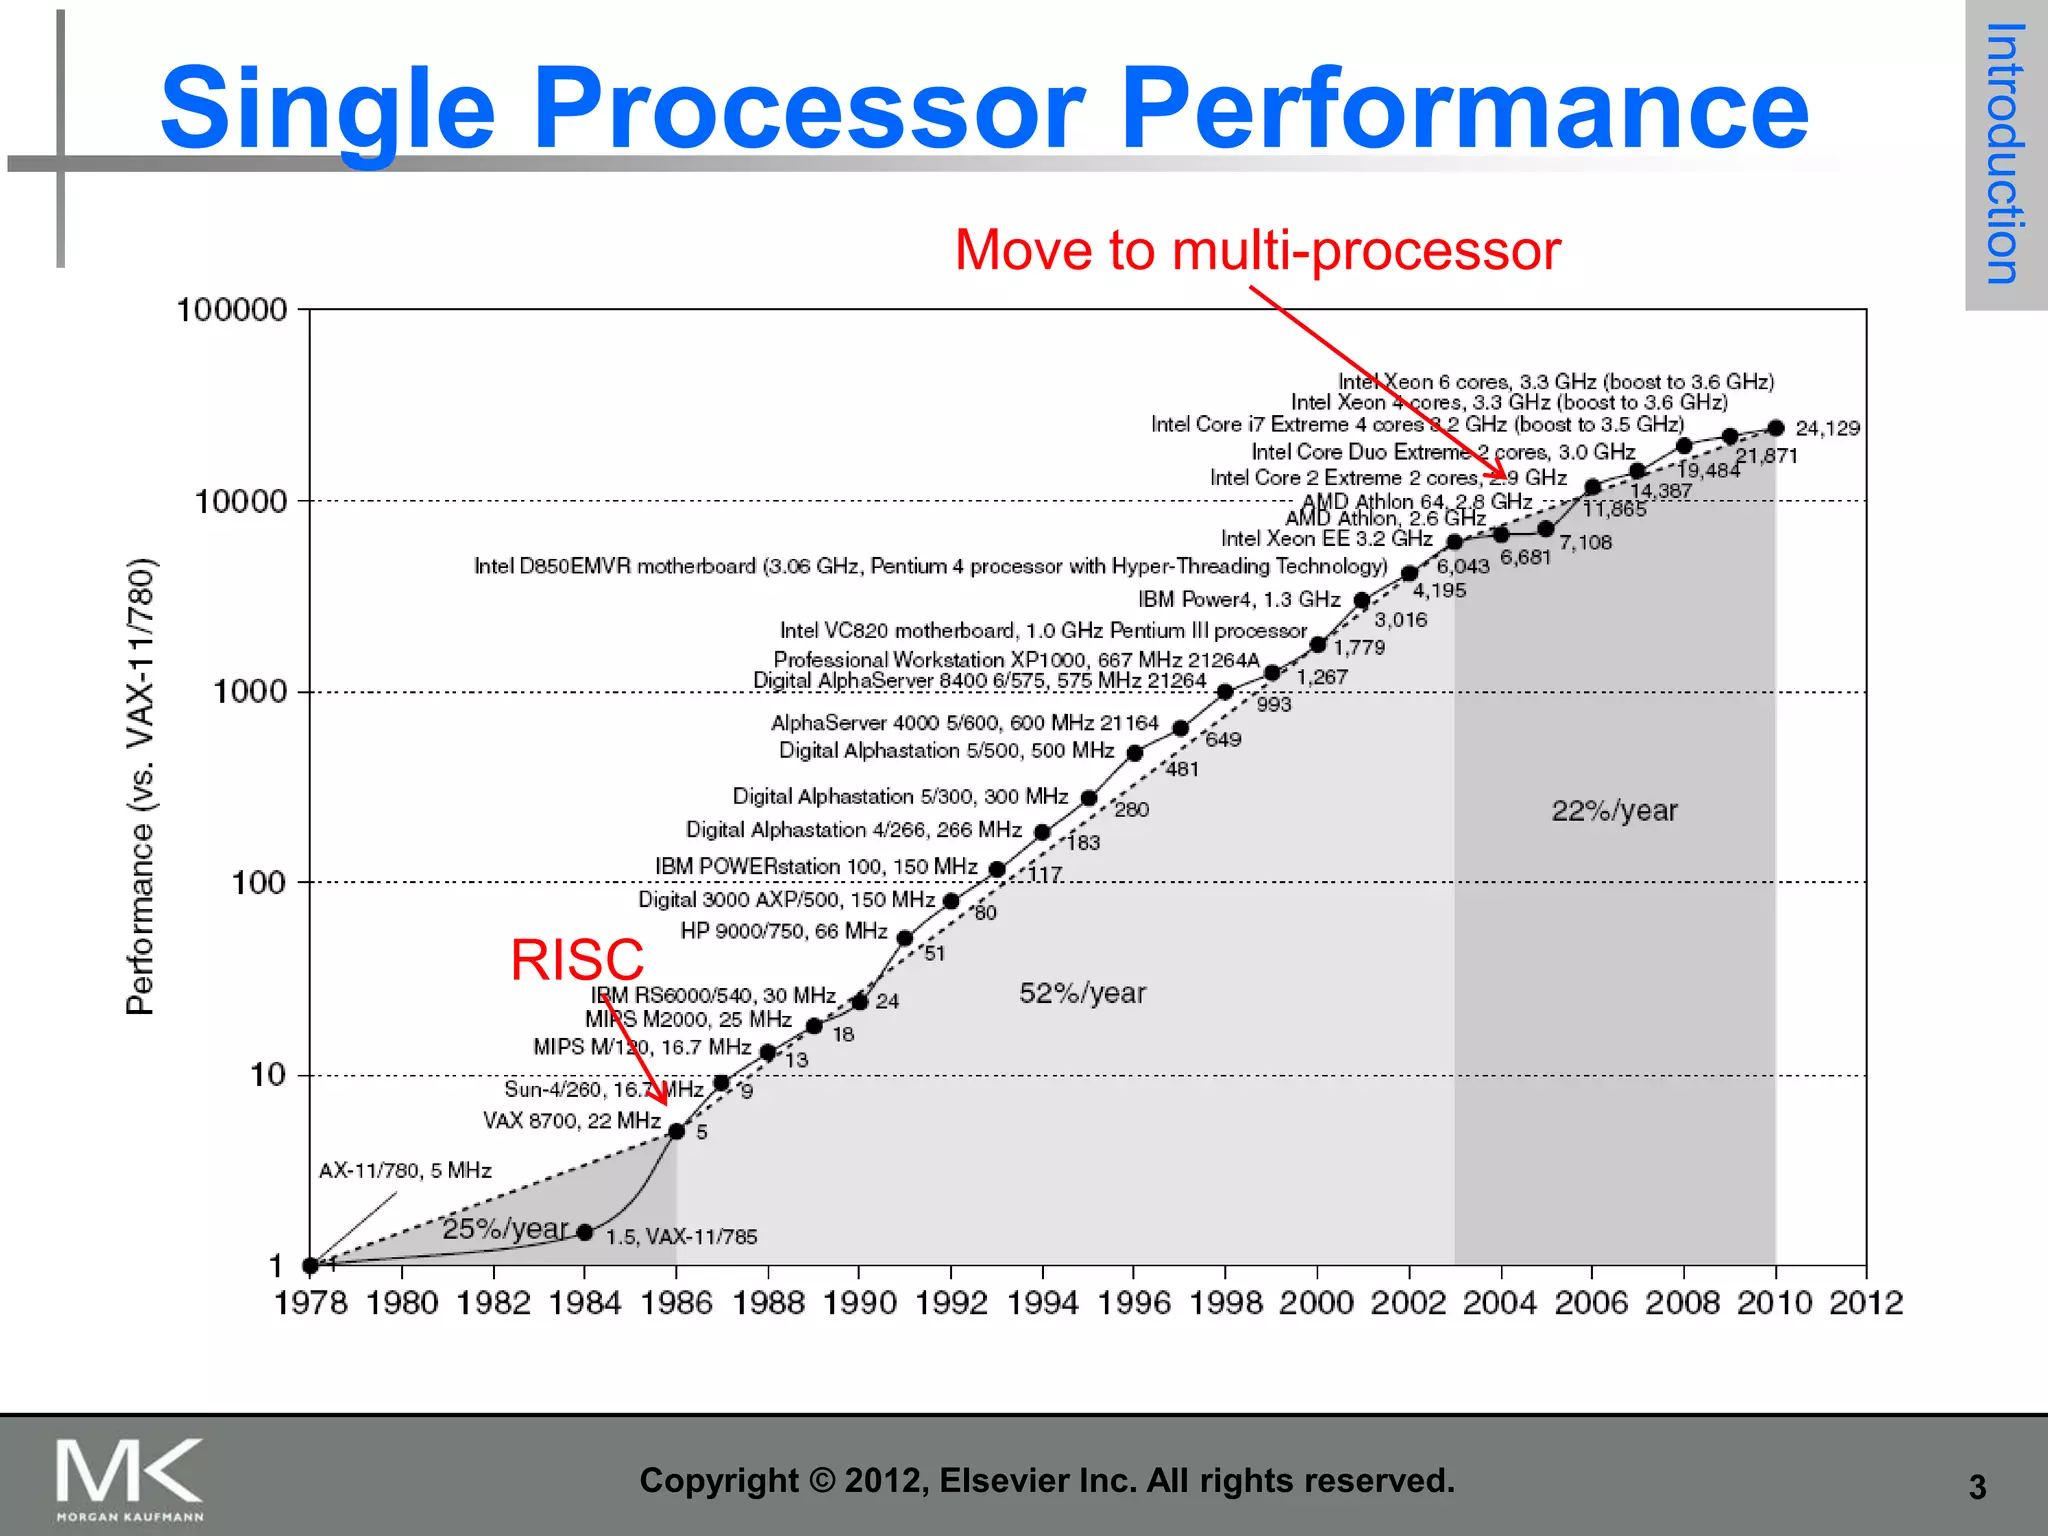
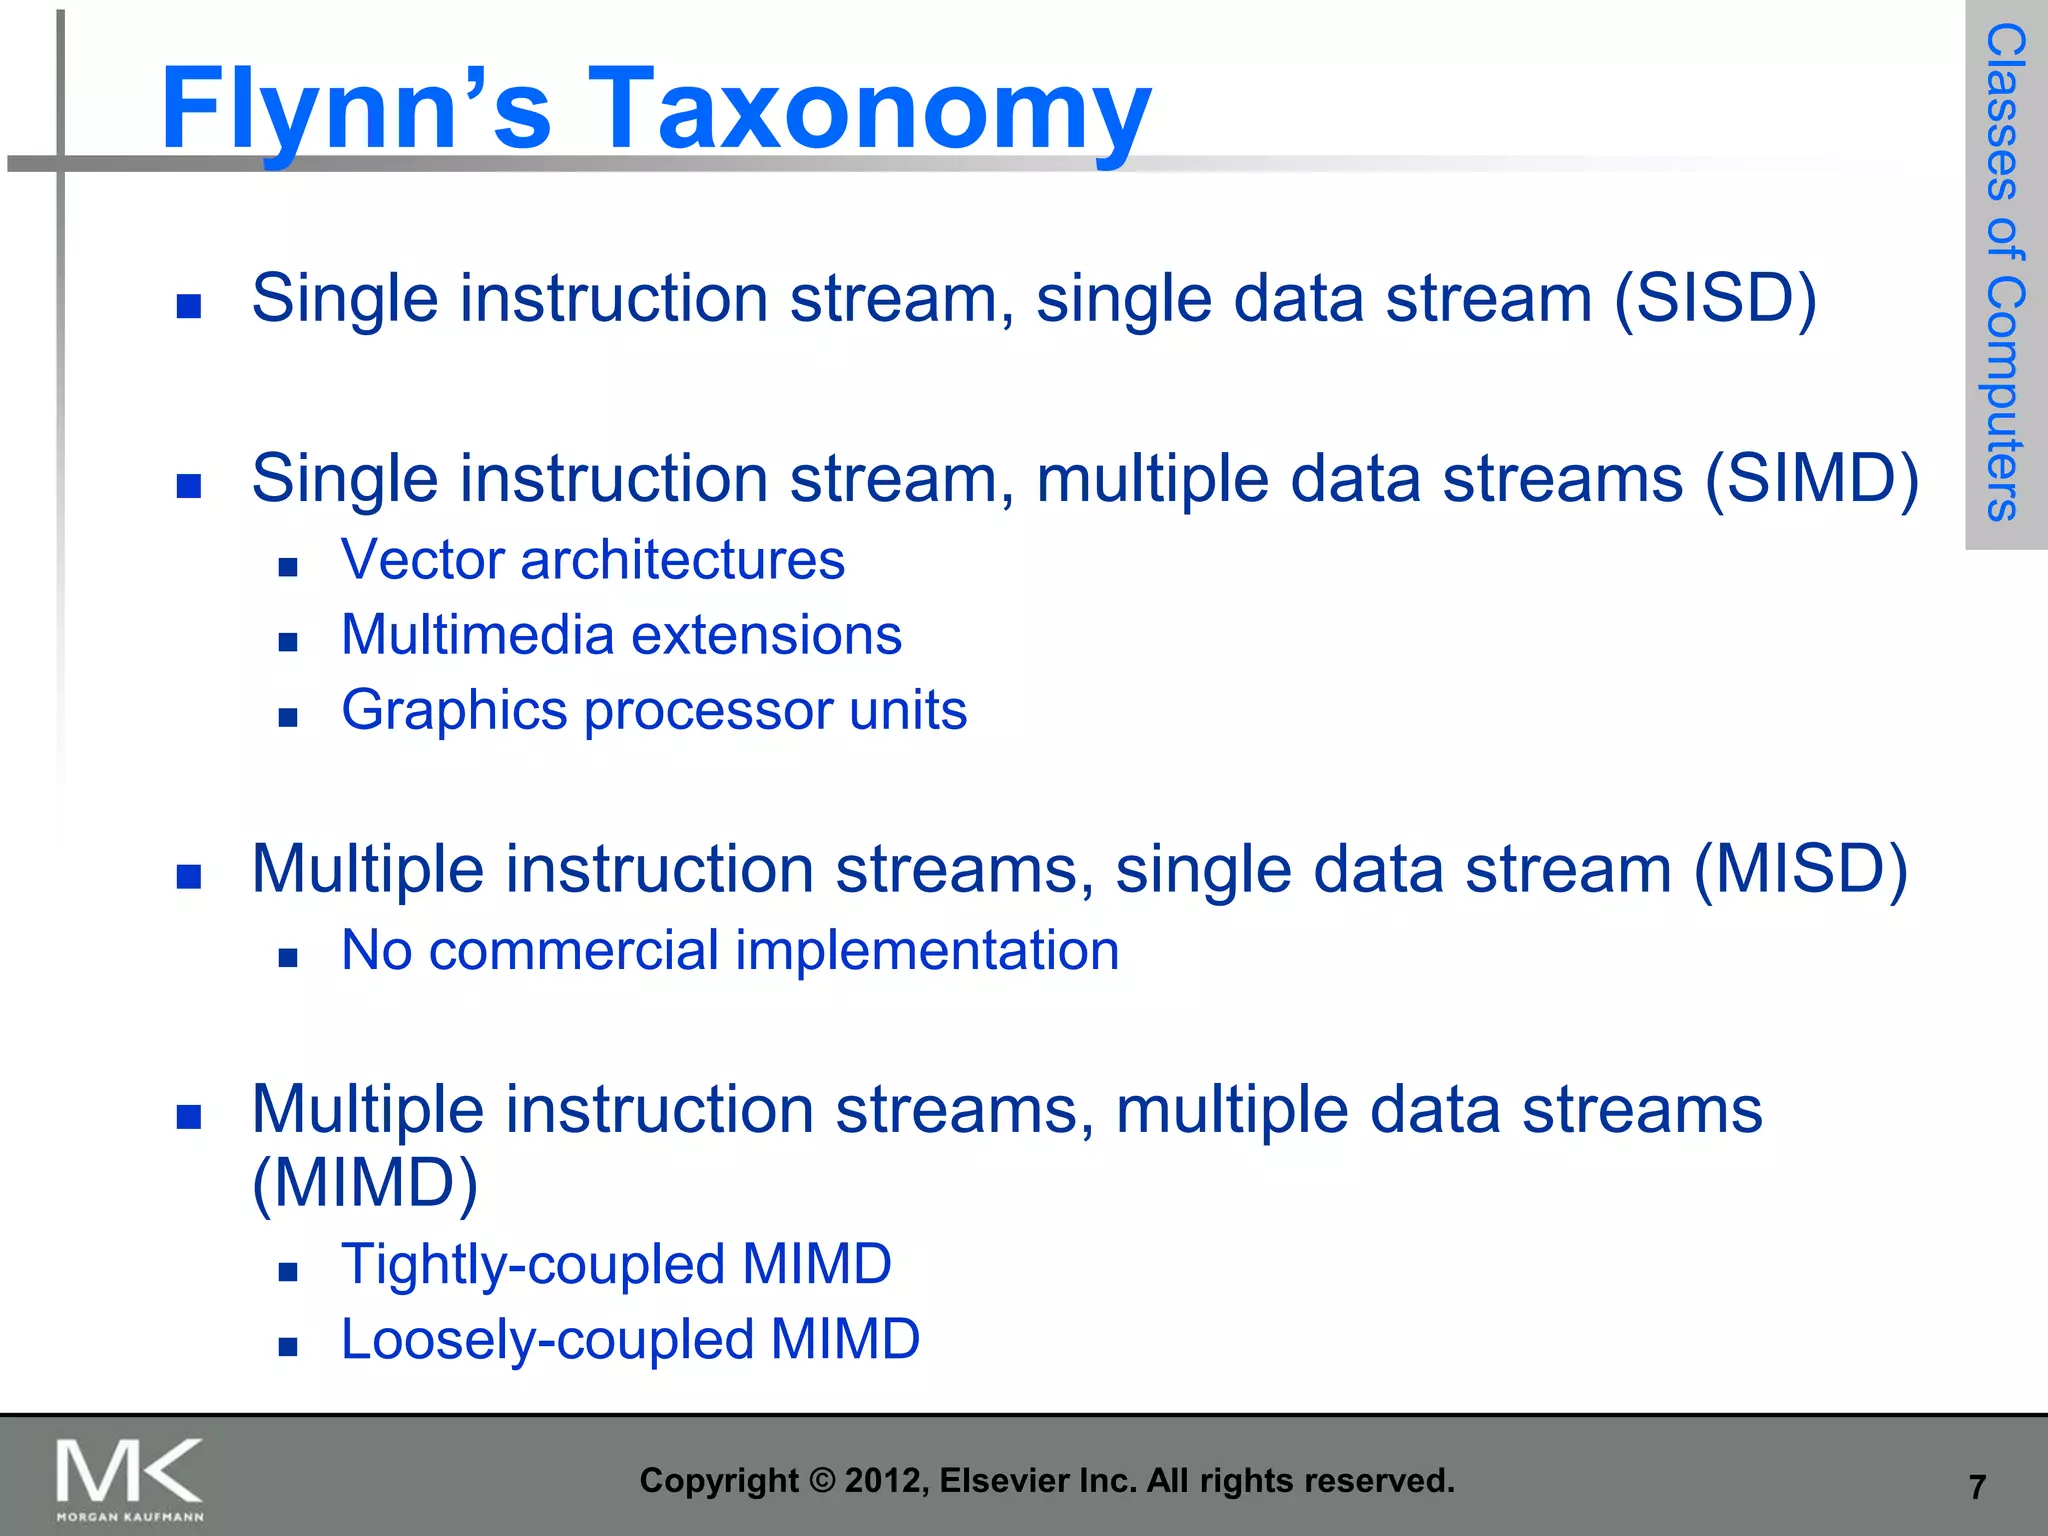
![Types of Addressing Modes (VAX)
Addressing Mode
1. Register direct
2. Immediate
3. Displacement
4. Register indirect
5. Indexed
6. Direct
7. Memory Indirect
8. Autoincrement
Action
R4 <- R4 + R3
R4 <- R4 + 3
R4 <- R4 + M[100 + R1]
R4 <- R4 + M[R1]
R4 <- R4 + M[R1 + R2]
R4 <- R4 + M[1000]
R4 <- R4 + M[M[R3]]
R4 <- R4 + M[R2]
R2 <- R2 + d
9. Autodecrement
Add R4, (R2)R4 <- R4 + M[R2]
R2 <- R2 - d
10. Scaled
Add R4, 100(R2)[R3] R4 <- R4 +
M[100 + R2 + R3*d]
• Studies by [Clark and Emer] indicate that modes 1-4 account for
93% of all operands on the VAX.
CSCE430/830
Example
Add R4, R3
Add R4, #3
Add R4, 100(R1)
Add R4, (R1)
Add R4, (R1 + R2)
Add R4, (1000)
Add R4, @(R3)
Add R4, (R2)+
ISA](https://image.slidesharecdn.com/caqa5ech1withreviewandexamples-131202085123-phpapp02/75/Caqa5e-ch1-with_review_and_examples-31-2048.jpg)
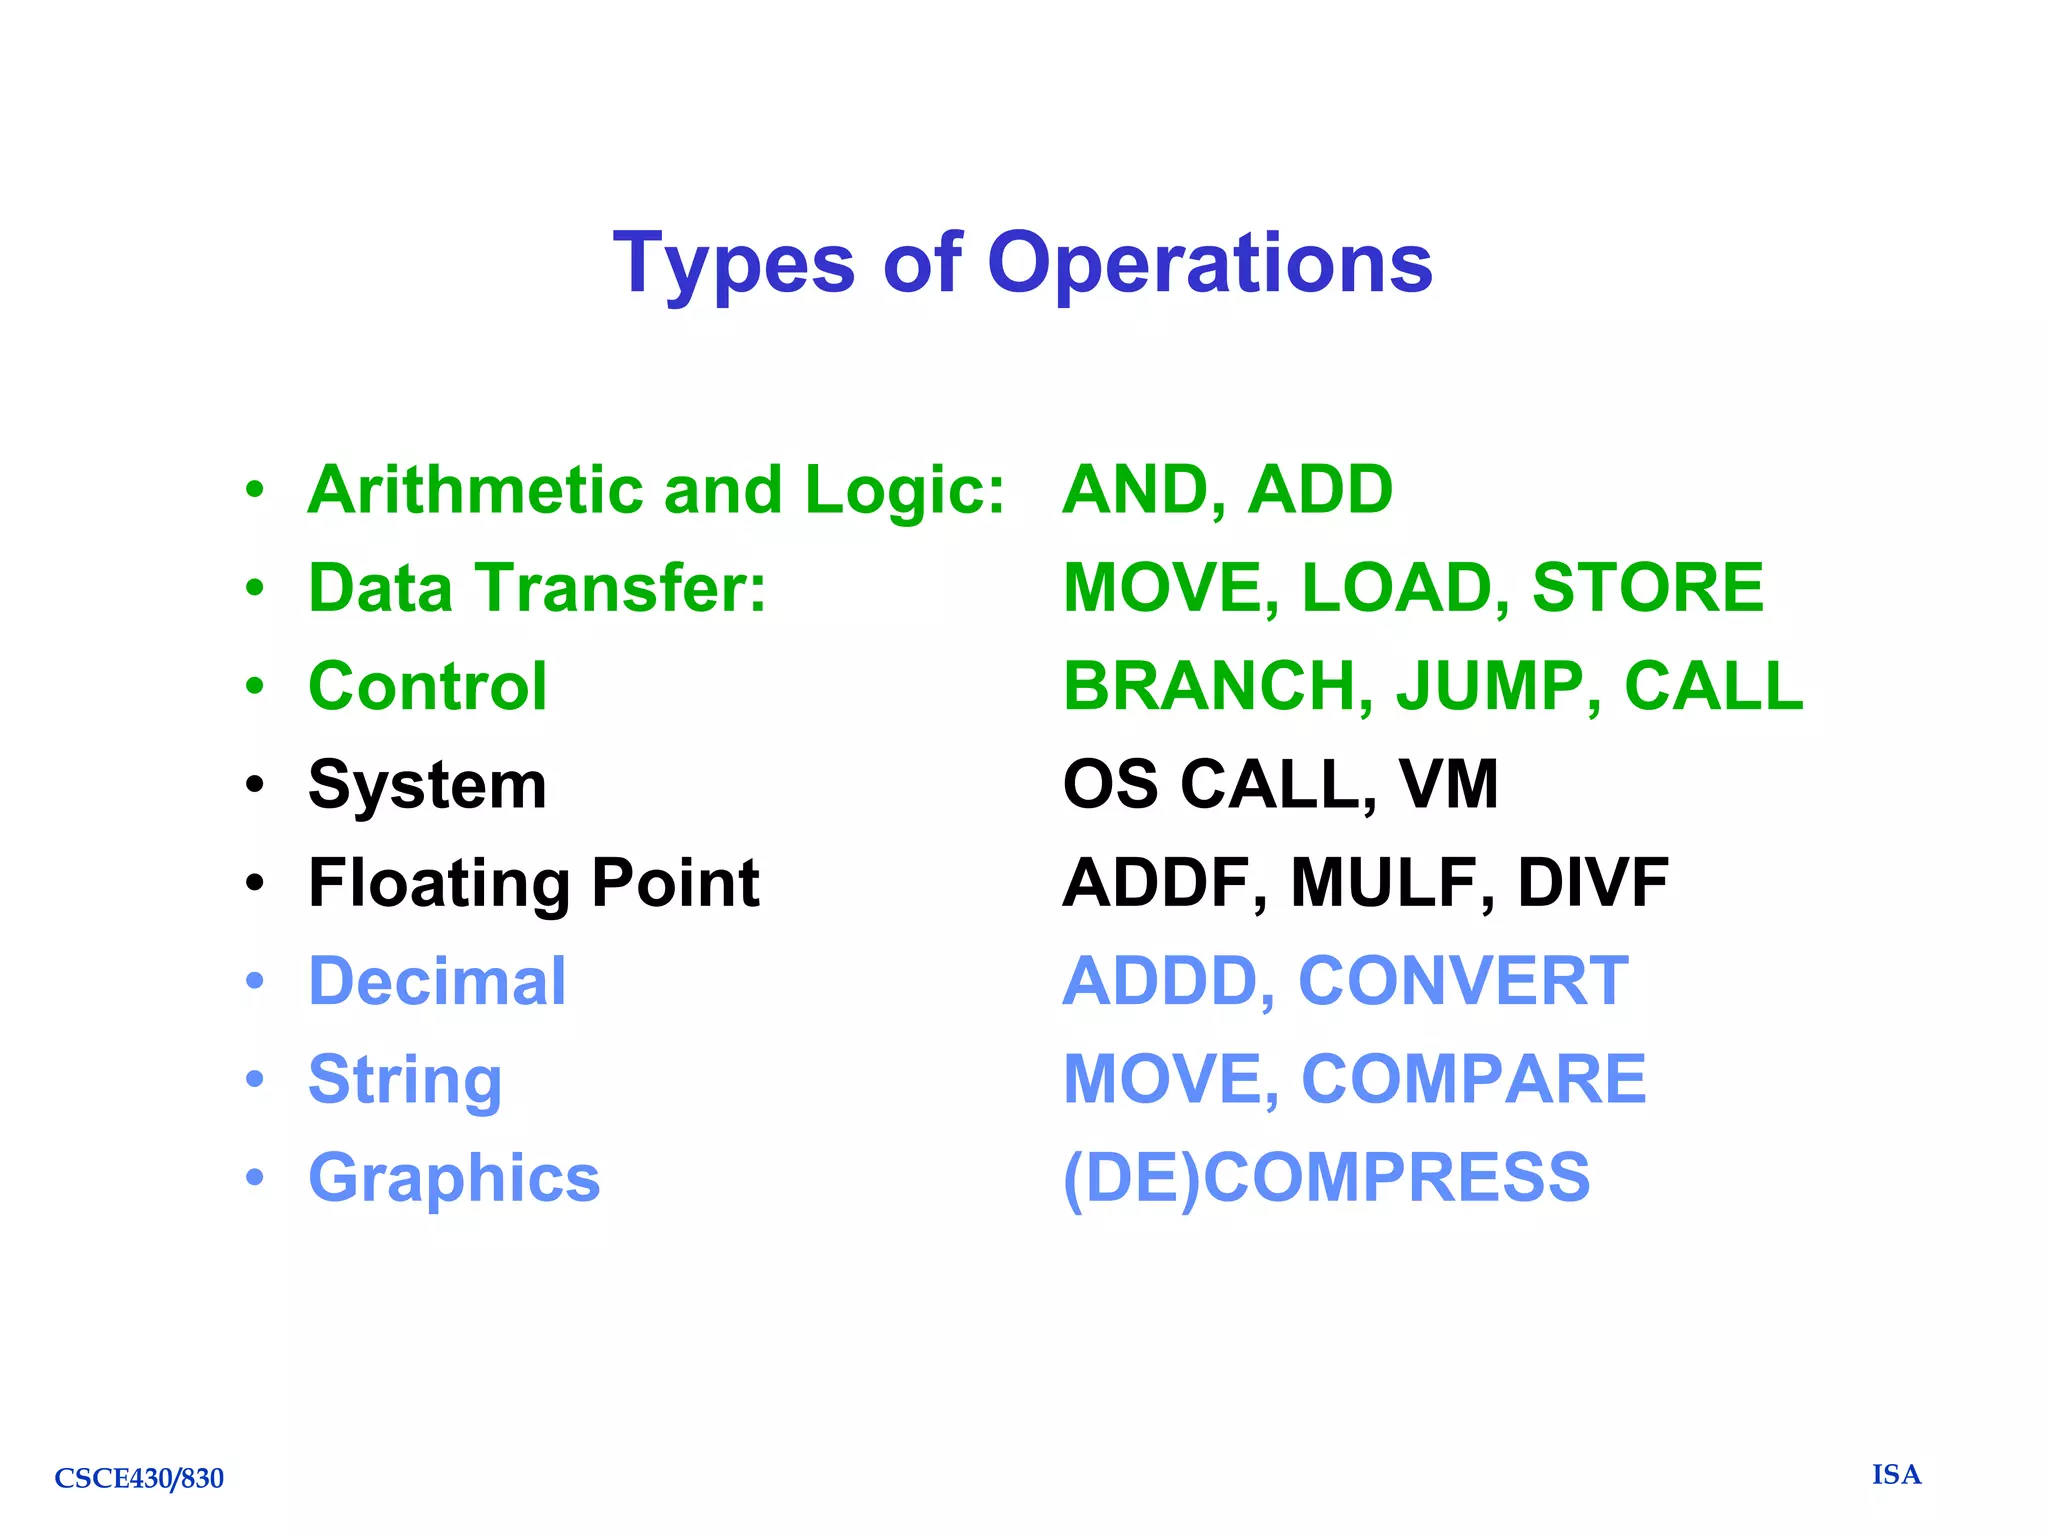
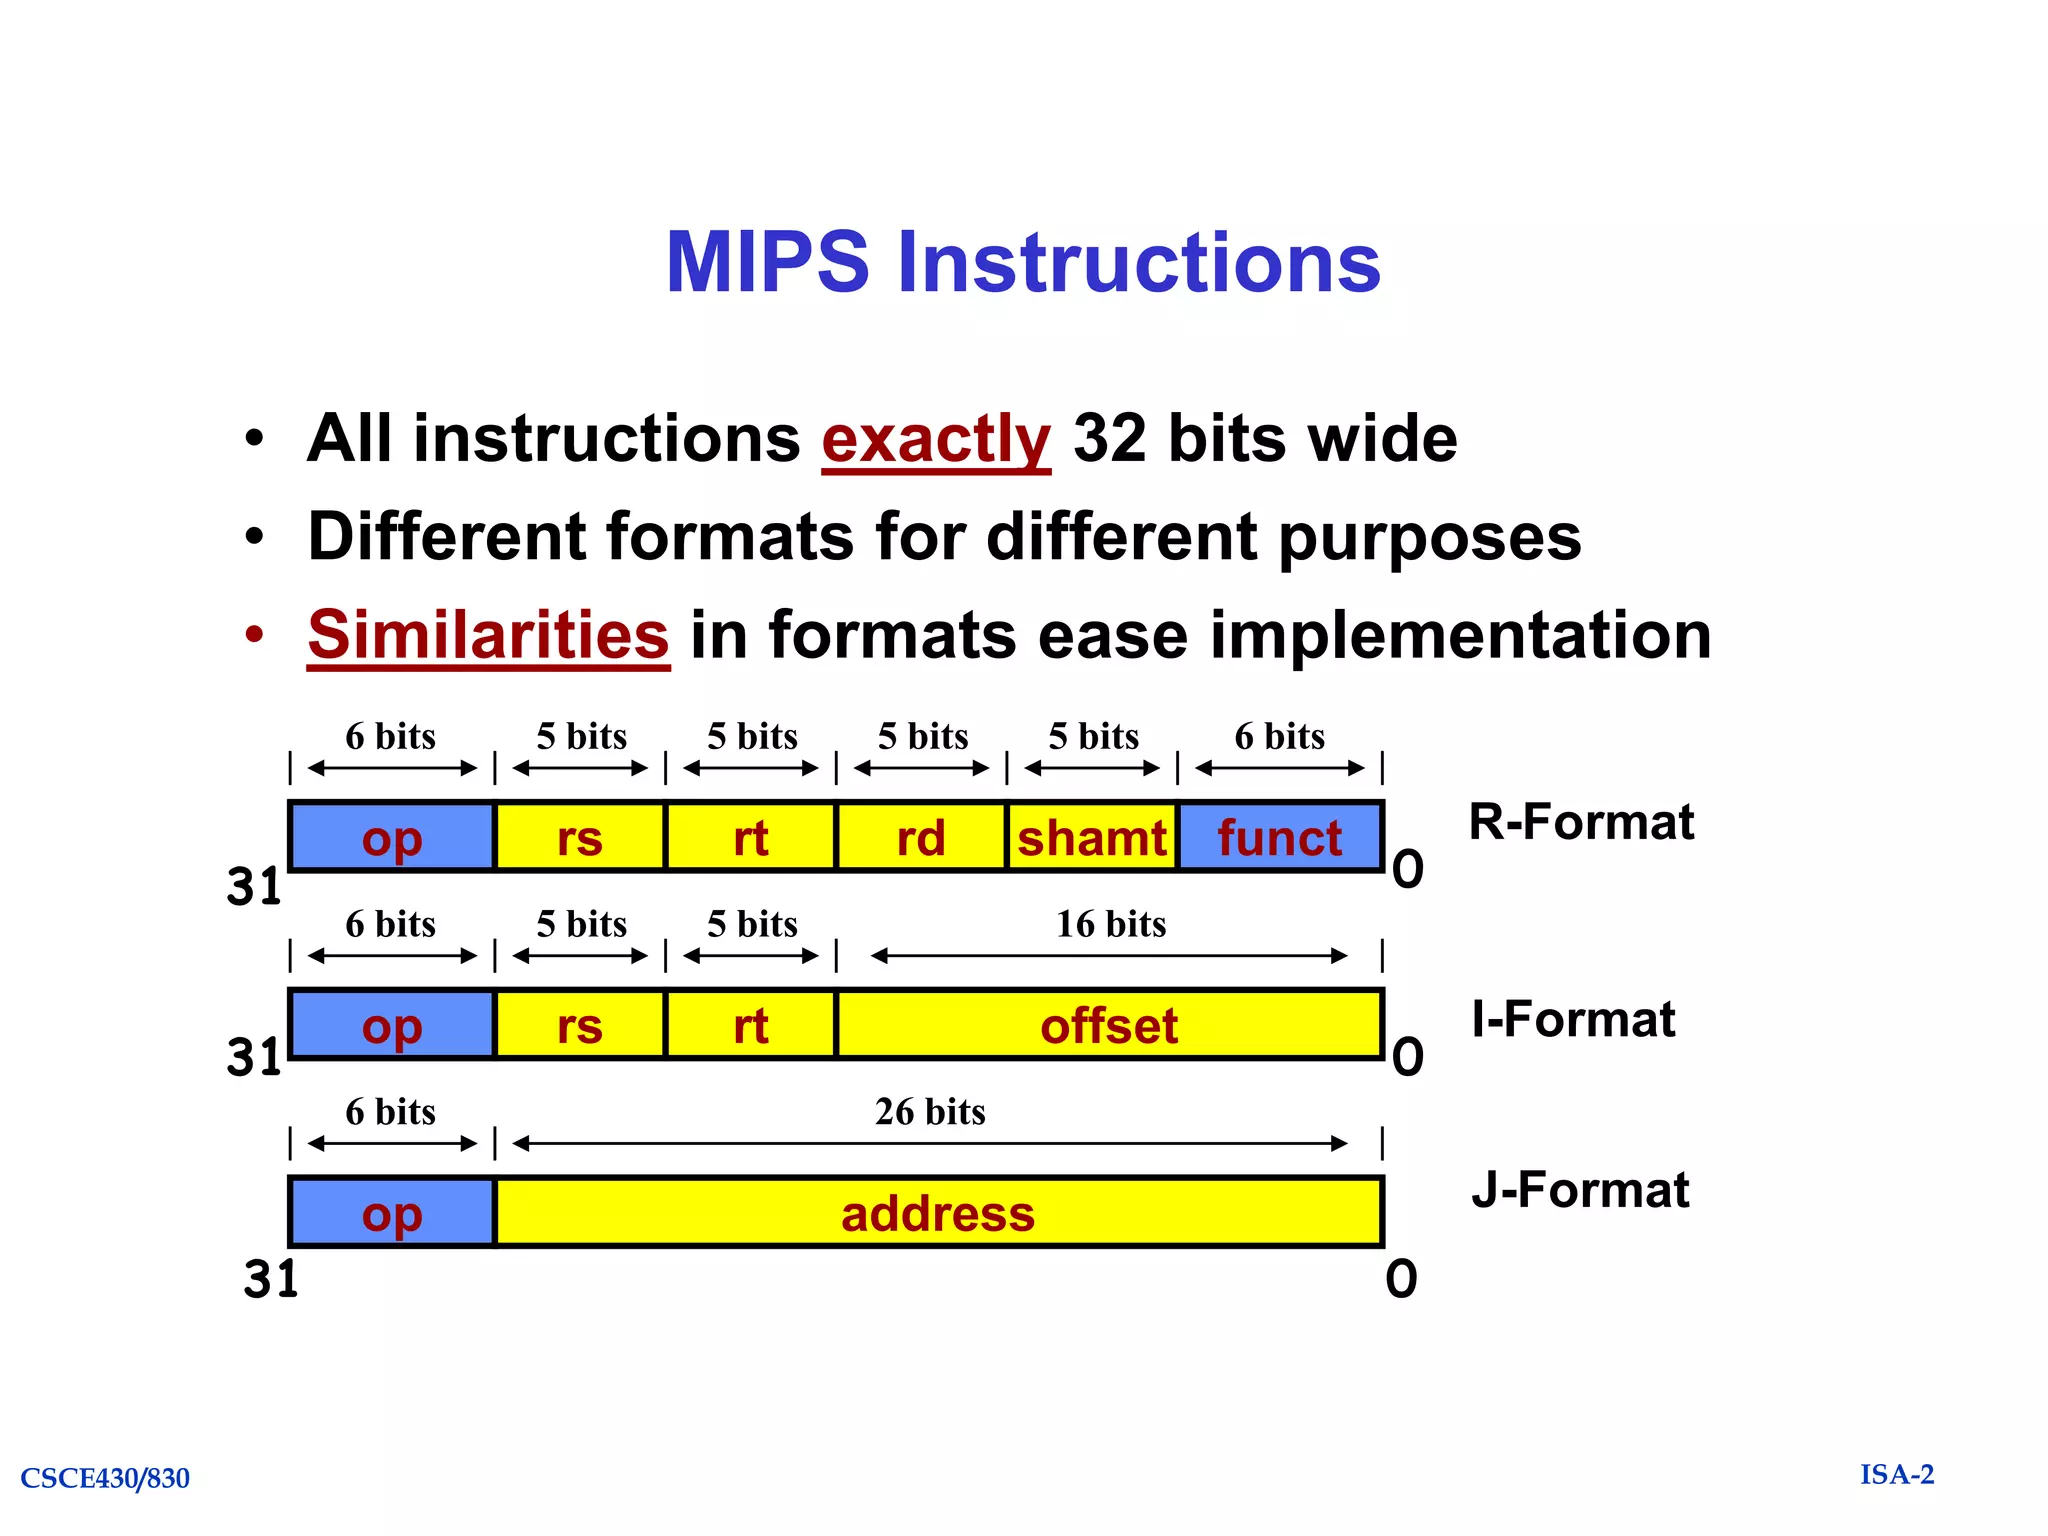
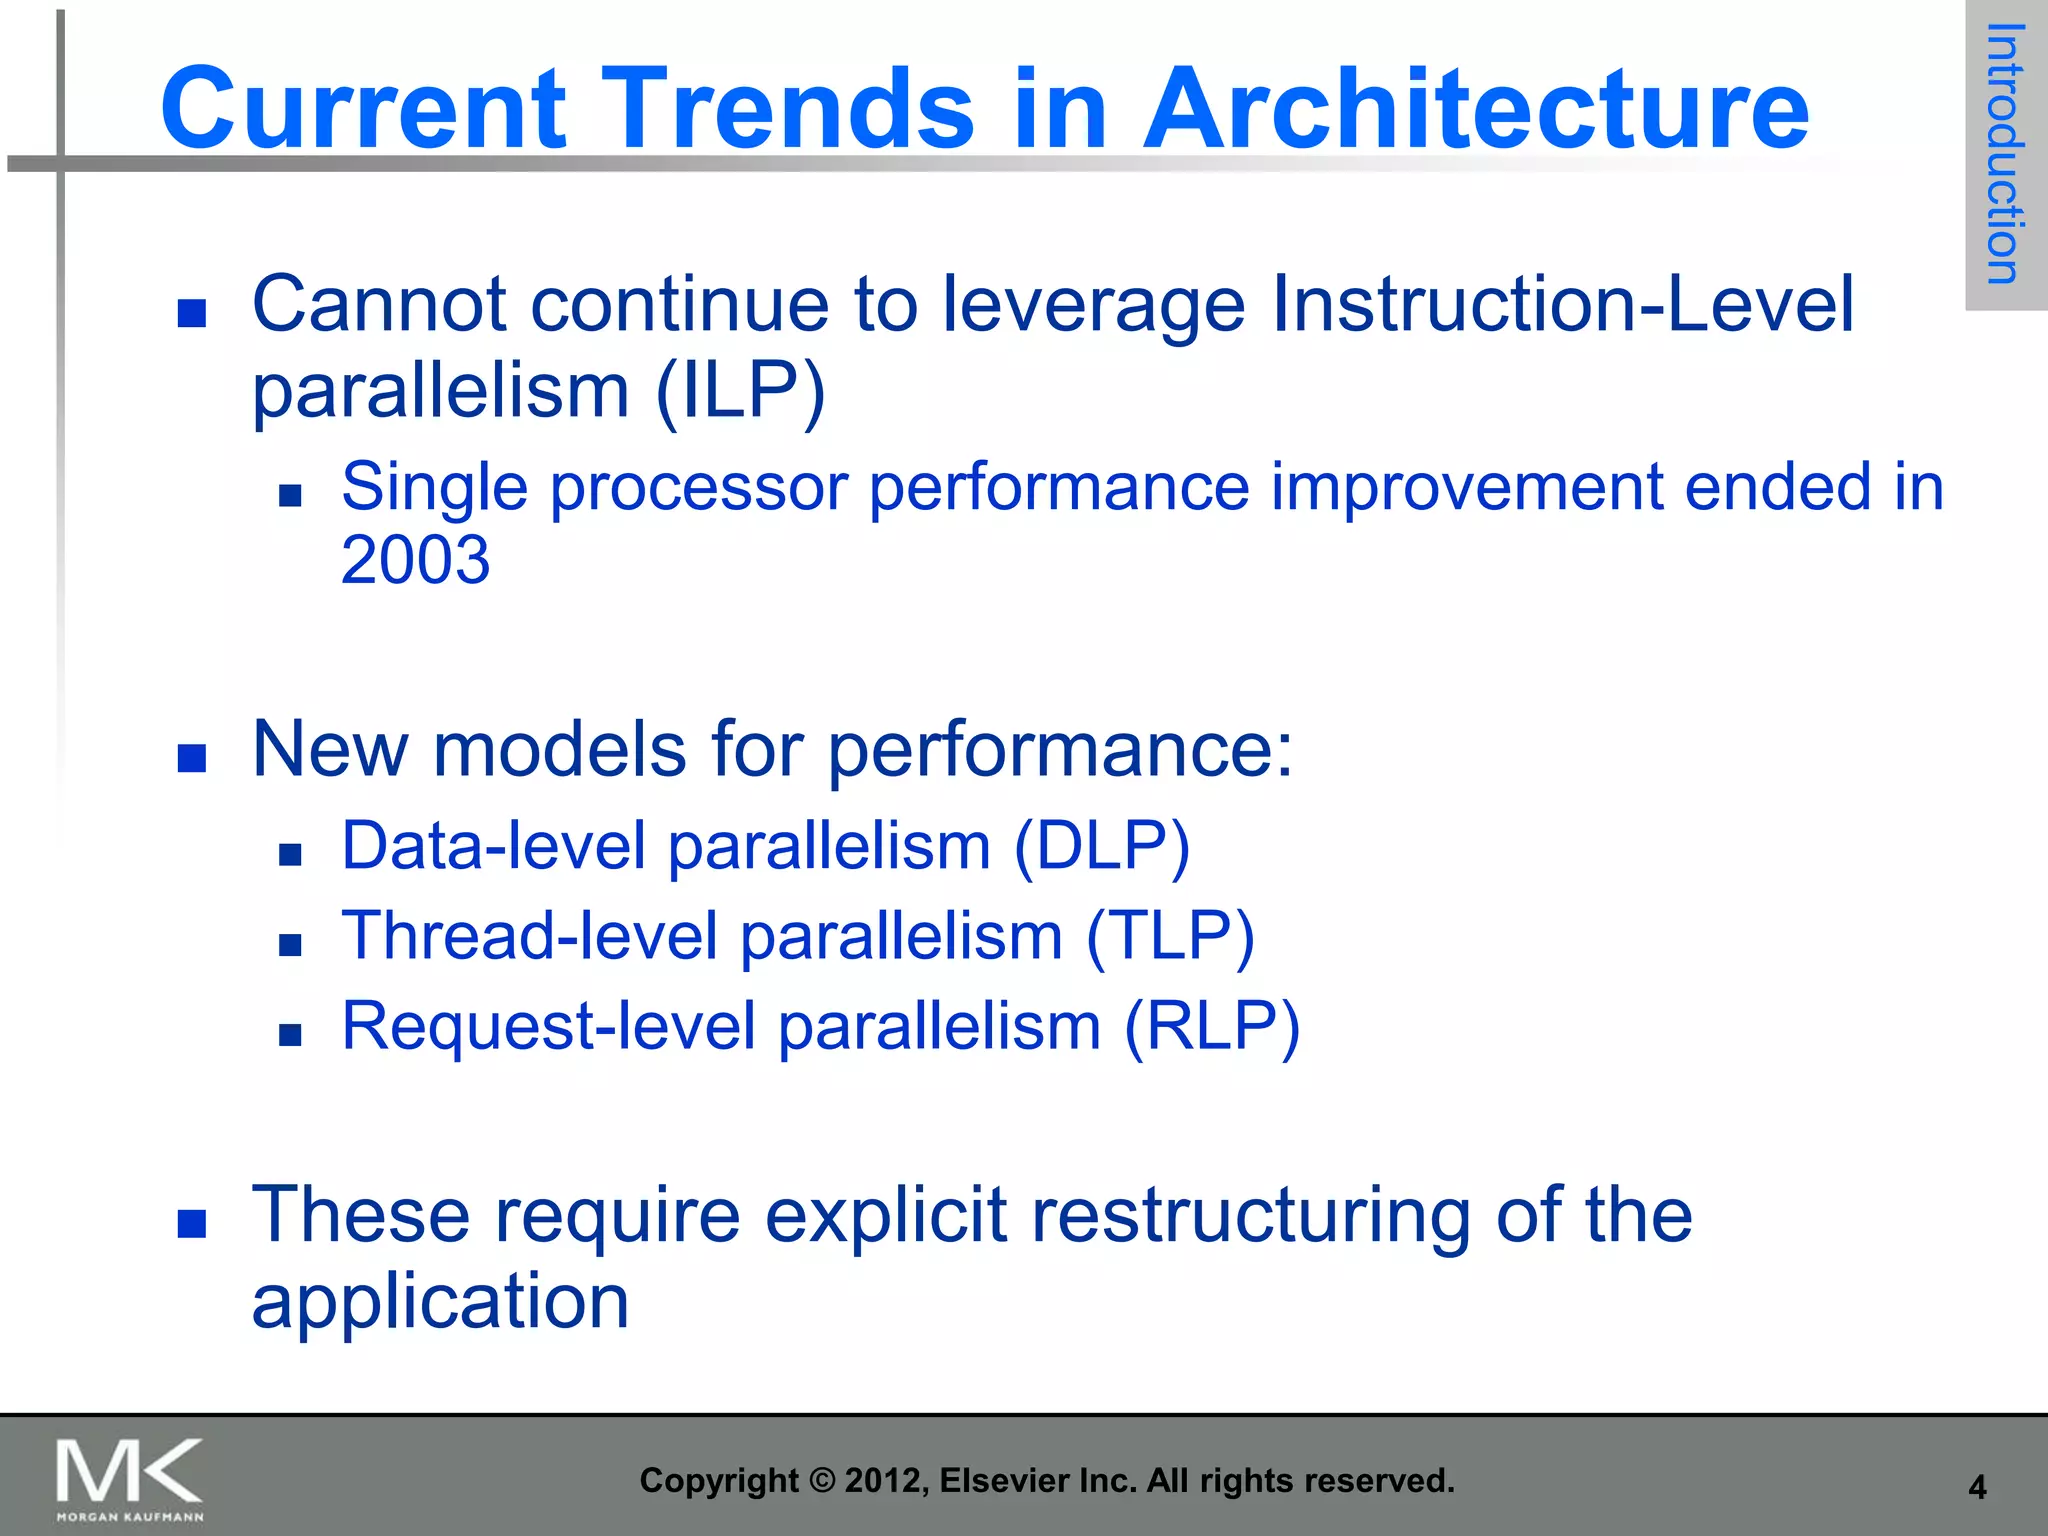
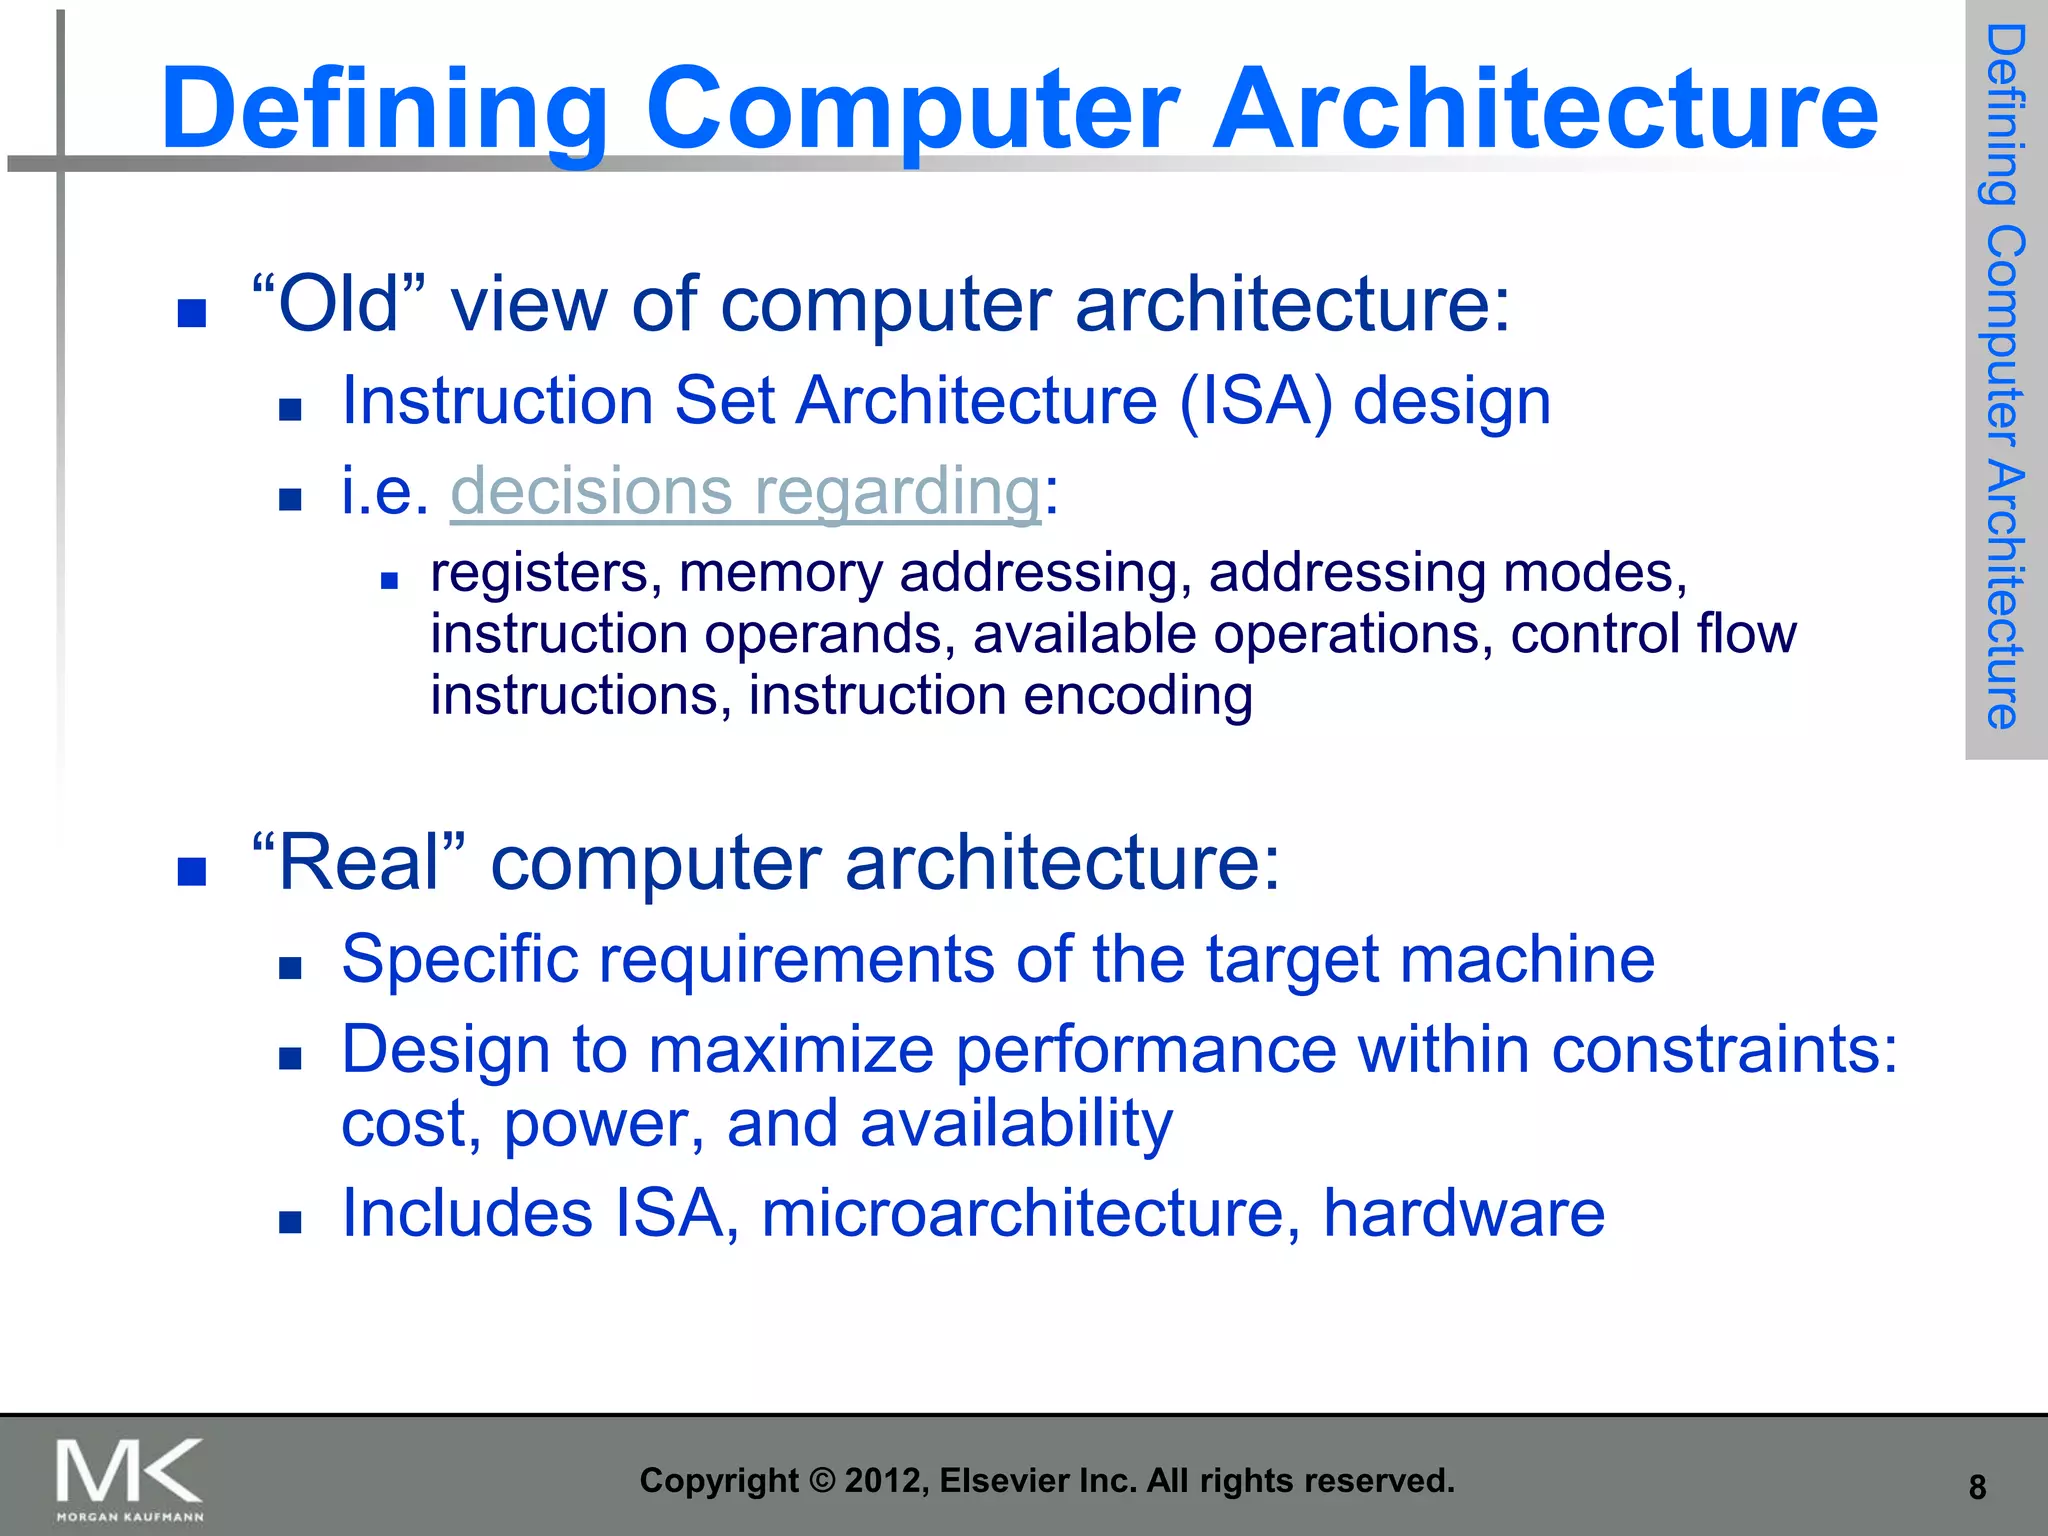
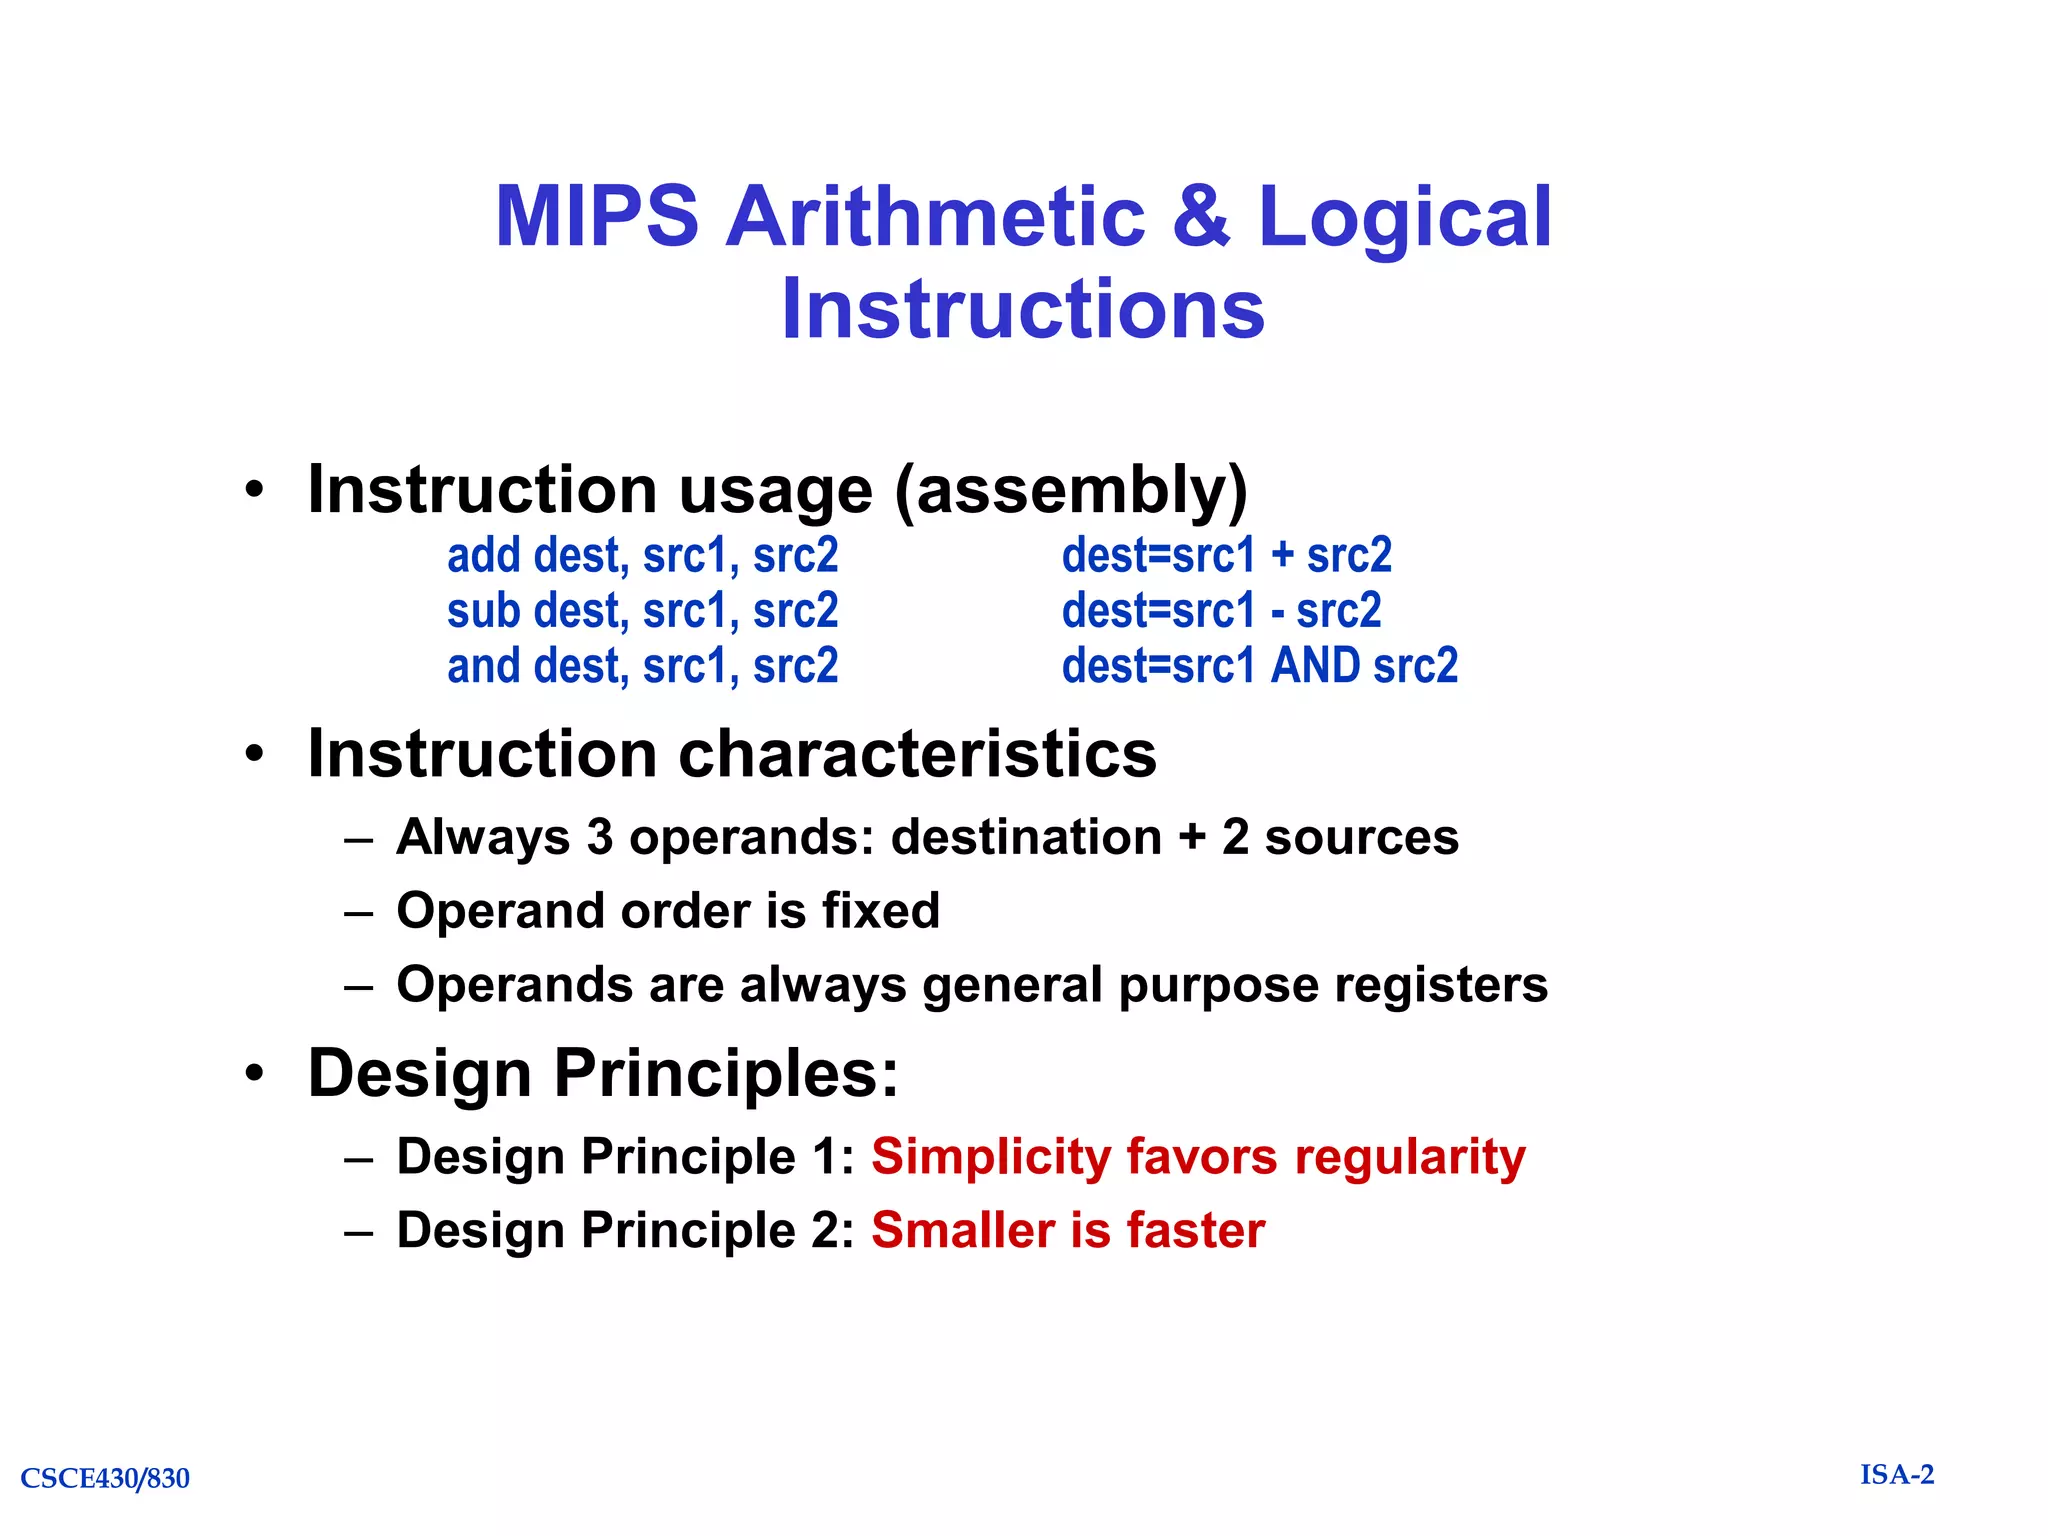
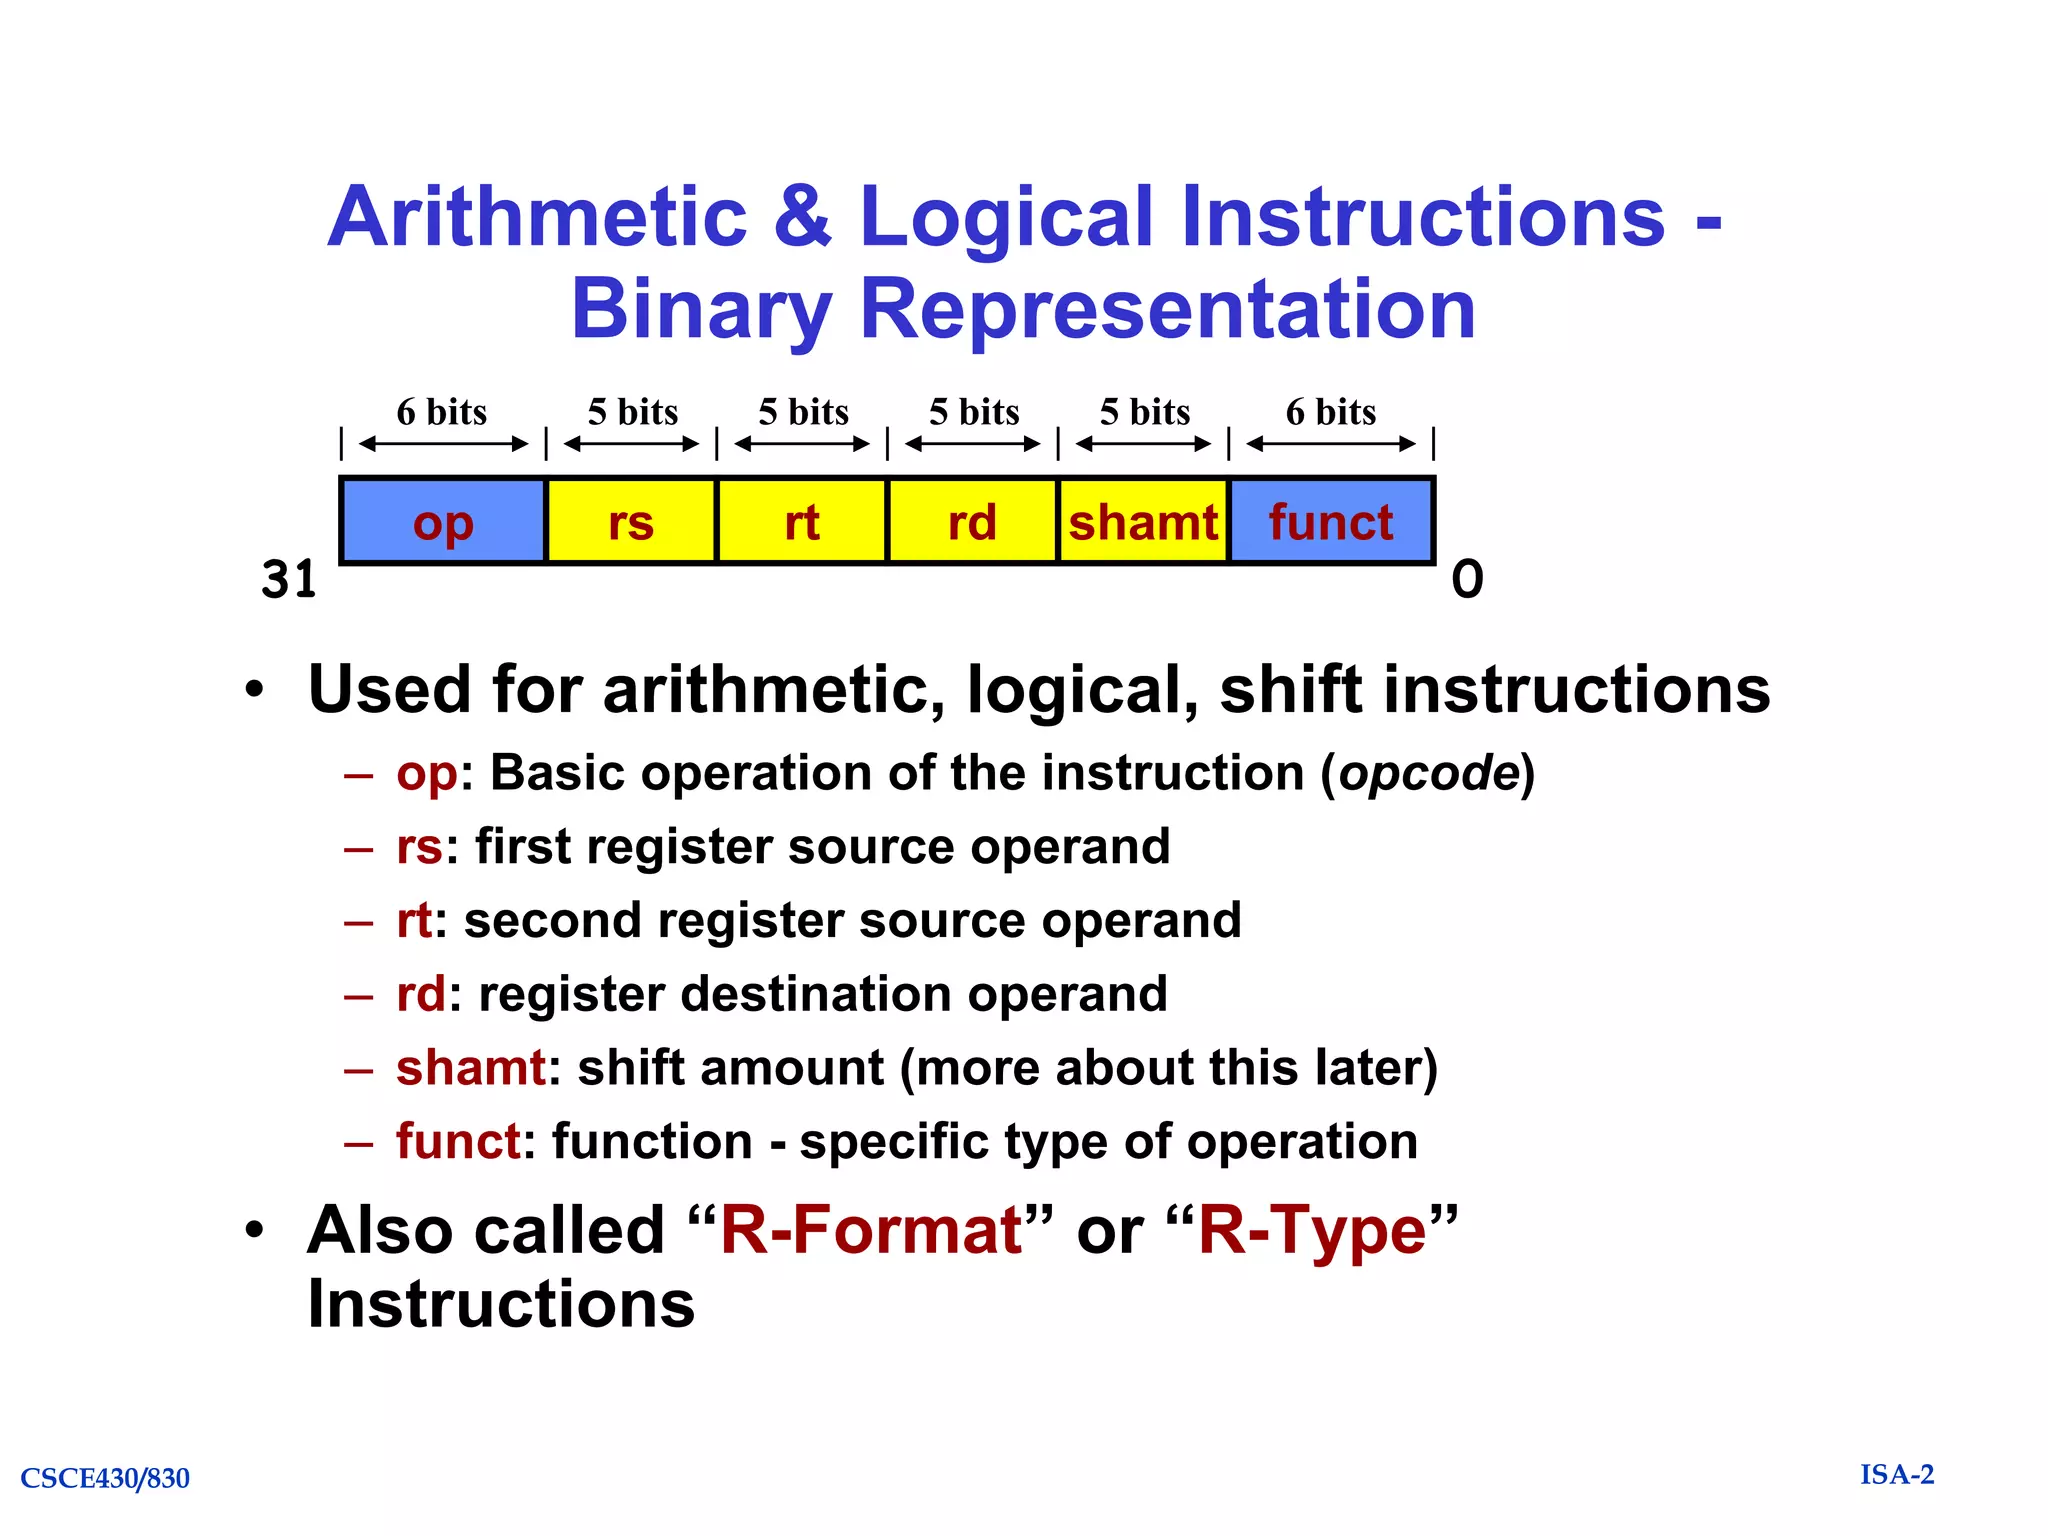
![MIPS Instruction Types
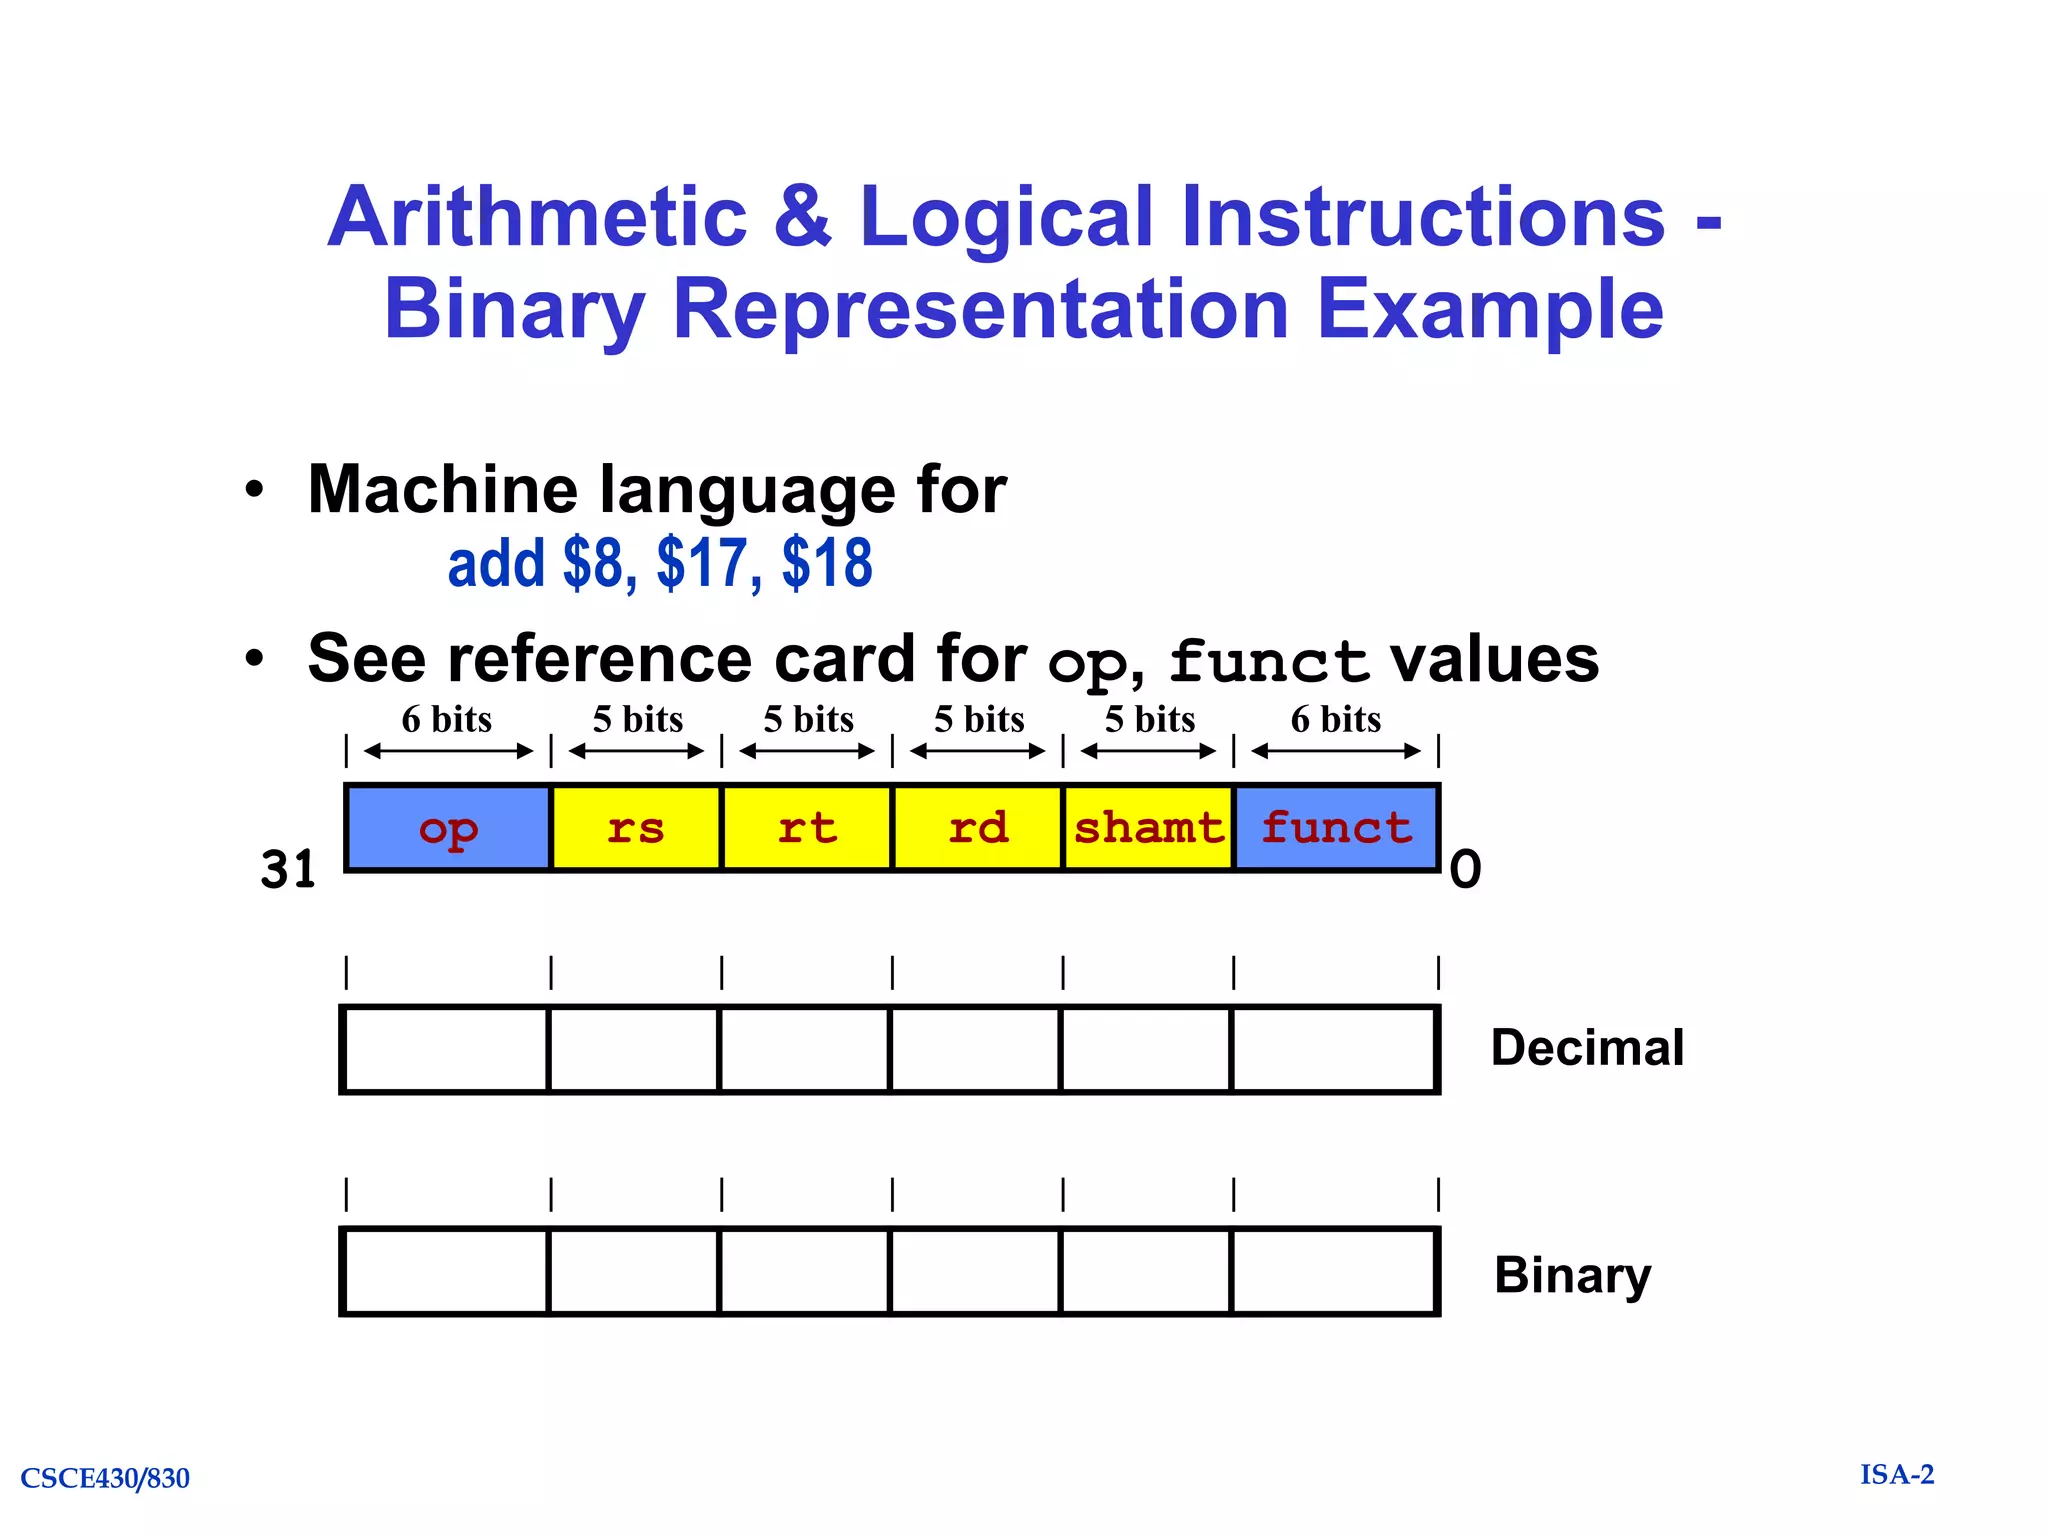
• Arithmetic & Logical - manipulate data in
registers
add $s1, $s2, $s3
or $s3, $s4, $s5
$s1 = $s2 + $s3
$s3 = $s4 OR $s5
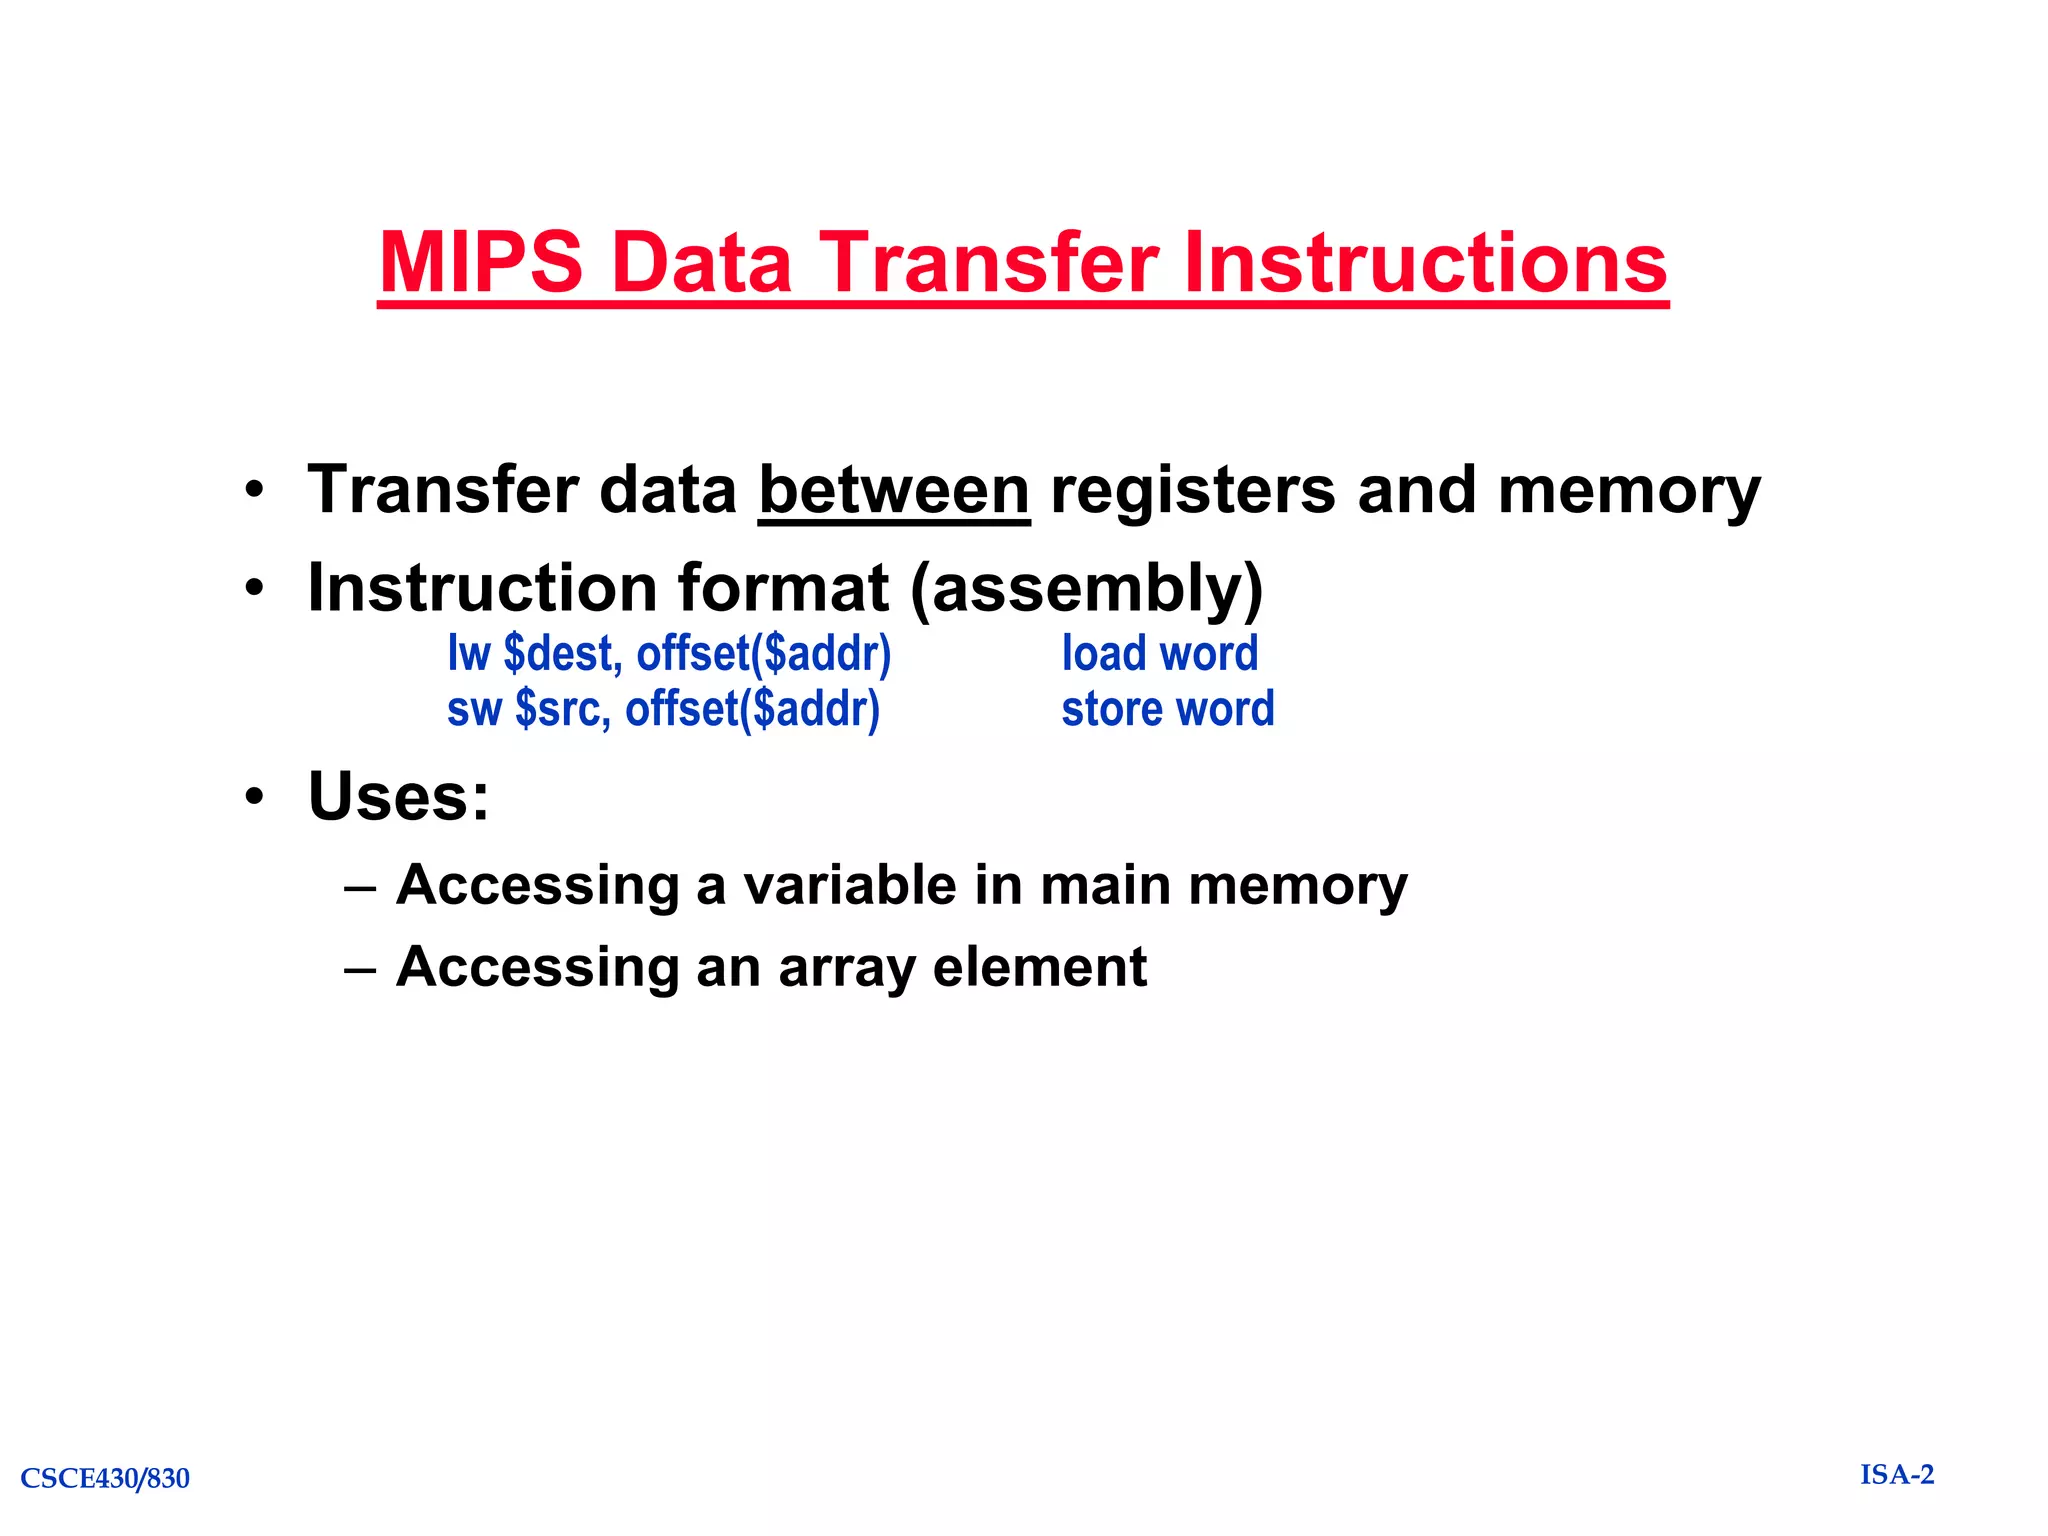
• Data Transfer - move register data to/from
memory load & store
lw $s1, 100($s2)
sw $s1, 100($s2)
$s1 = Memory[$s2 + 100]
Memory[$s2 + 100] = $s1
• Branch - alter program flow
beq $s1, $s2, 25
if ($s1==$s1) PC = PC + 4 + 4*25
else PC = PC + 4
CSCE430/830
ISA-2](https://image.slidesharecdn.com/caqa5ech1withreviewandexamples-131202085123-phpapp02/75/Caqa5e-ch1-with_review_and_examples-34-2048.jpg)
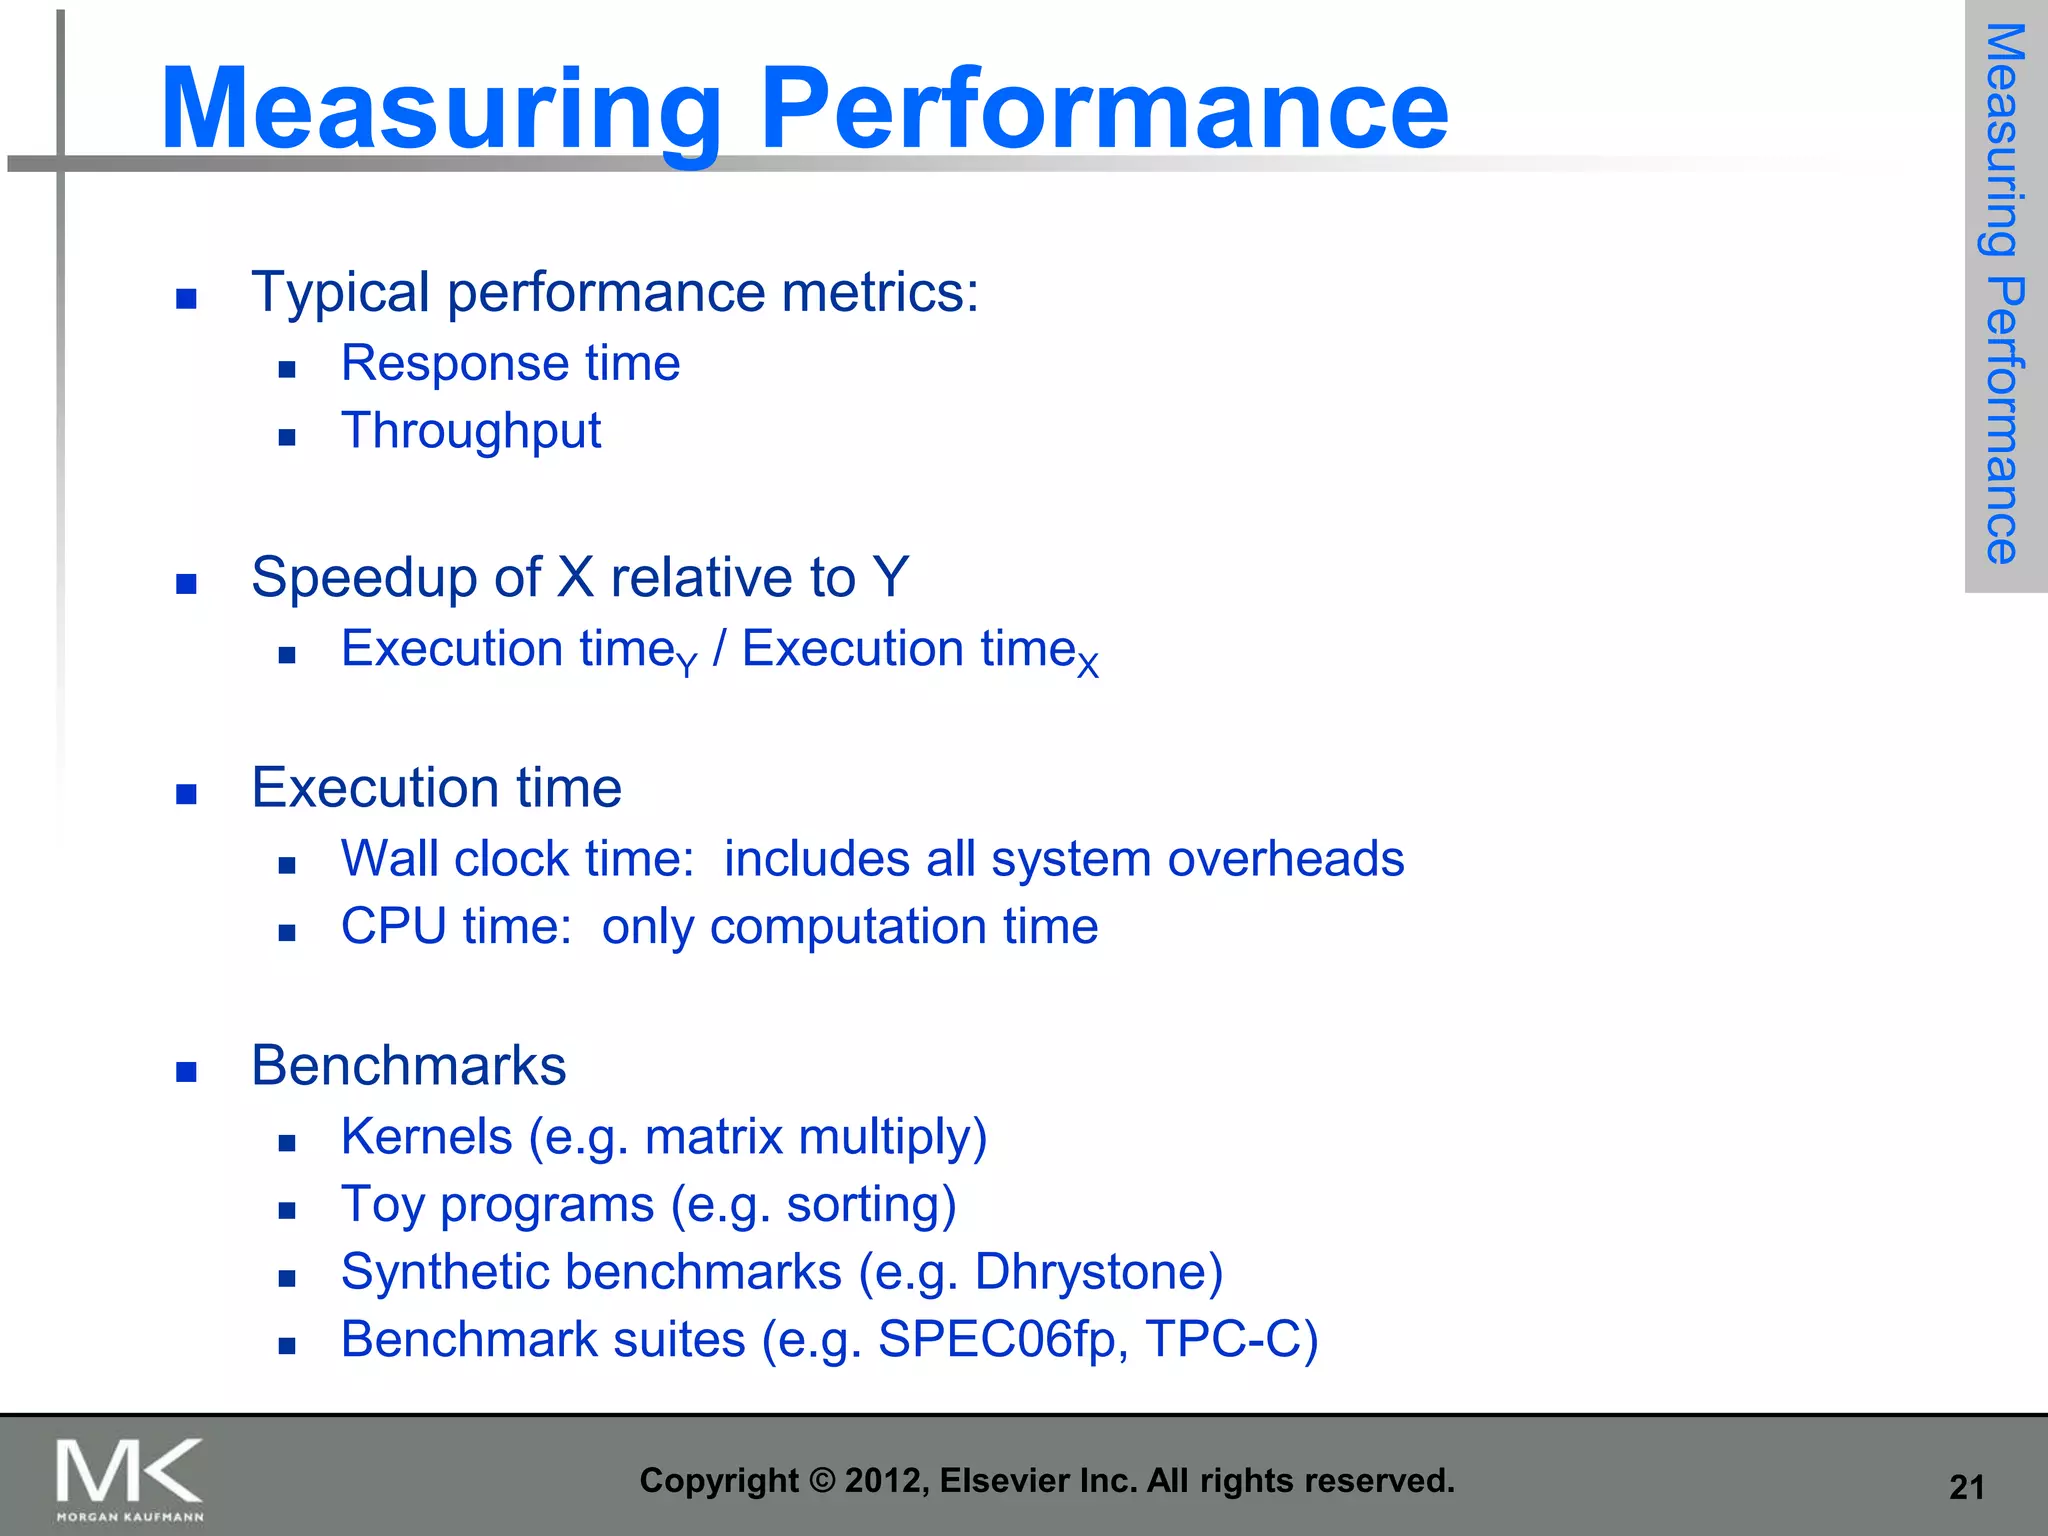
![Performance Measurements and
Benchmarks
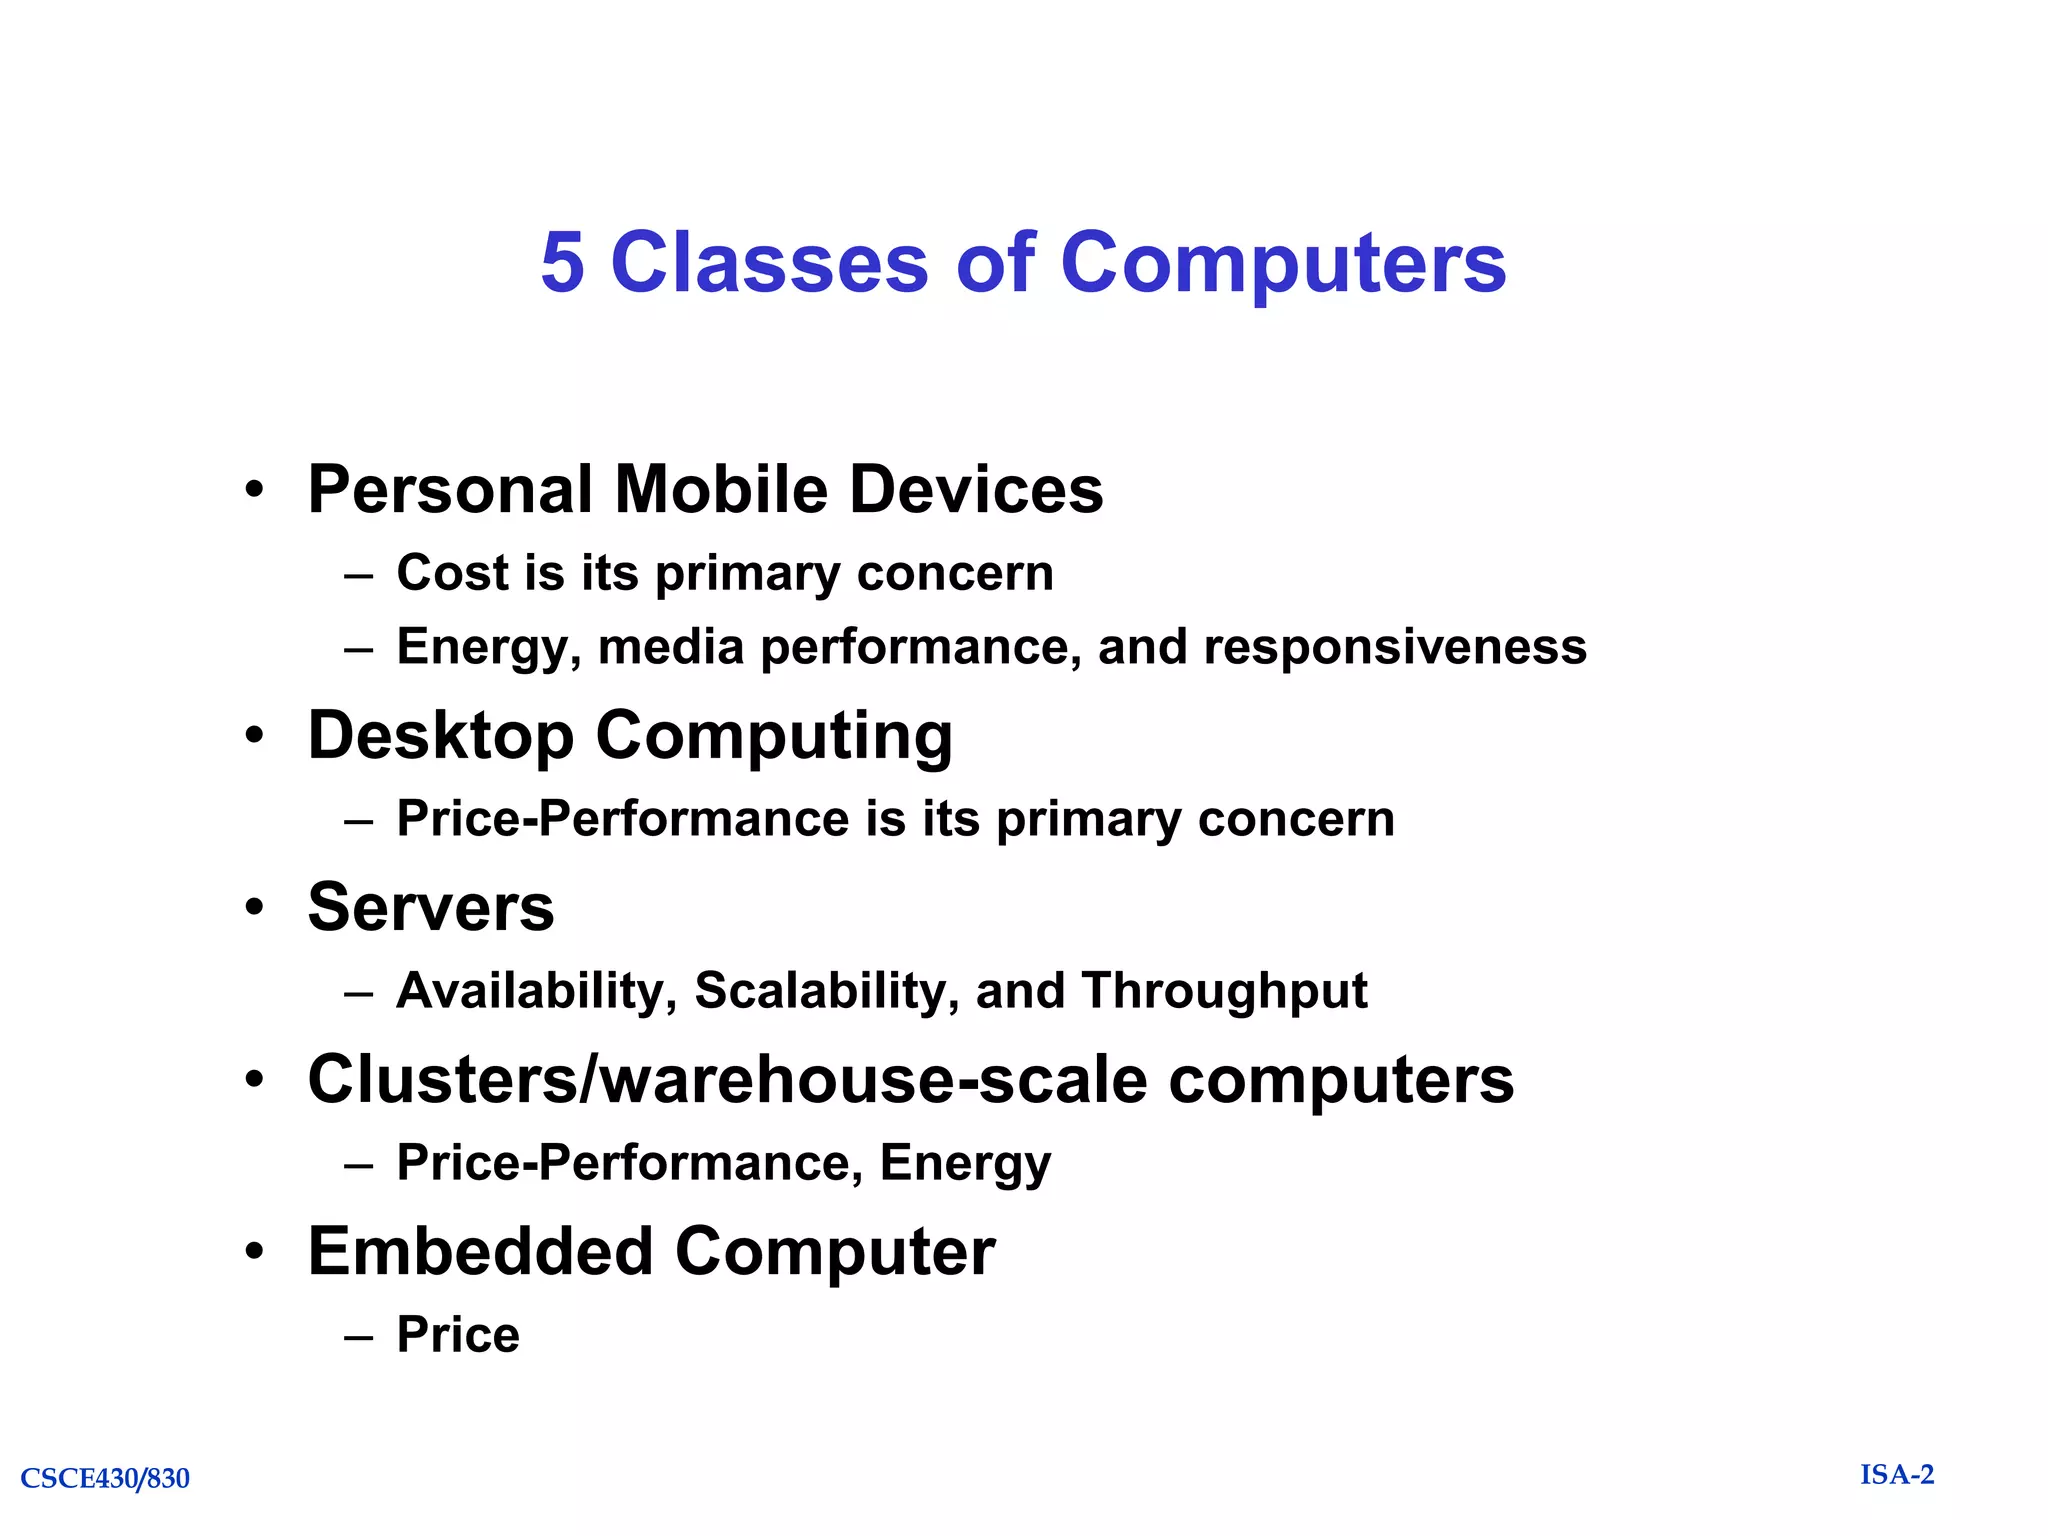
• Metrics
– Throughput: a total amount of work done in a given time
– Response time (Execution time): the time between the start and
the completion of an event
• Speedup of X relative to Y
– Execution timeY / Execution timeX
• Execution time
– Wall clock time: a latency to complete a task
– CPU time: only computation time
• Benchmarks
– Kernels, Toy programs, Synthetic benchmarks
– Benchmark suites: SPEC [CPU] & TPC [Transaction Processing]
– SpecRatio = Execution Timereference / Execution Timetarget
CSCE430/830
ISA-2](https://image.slidesharecdn.com/caqa5ech1withreviewandexamples-131202085123-phpapp02/75/Caqa5e-ch1-with_review_and_examples-53-2048.jpg)
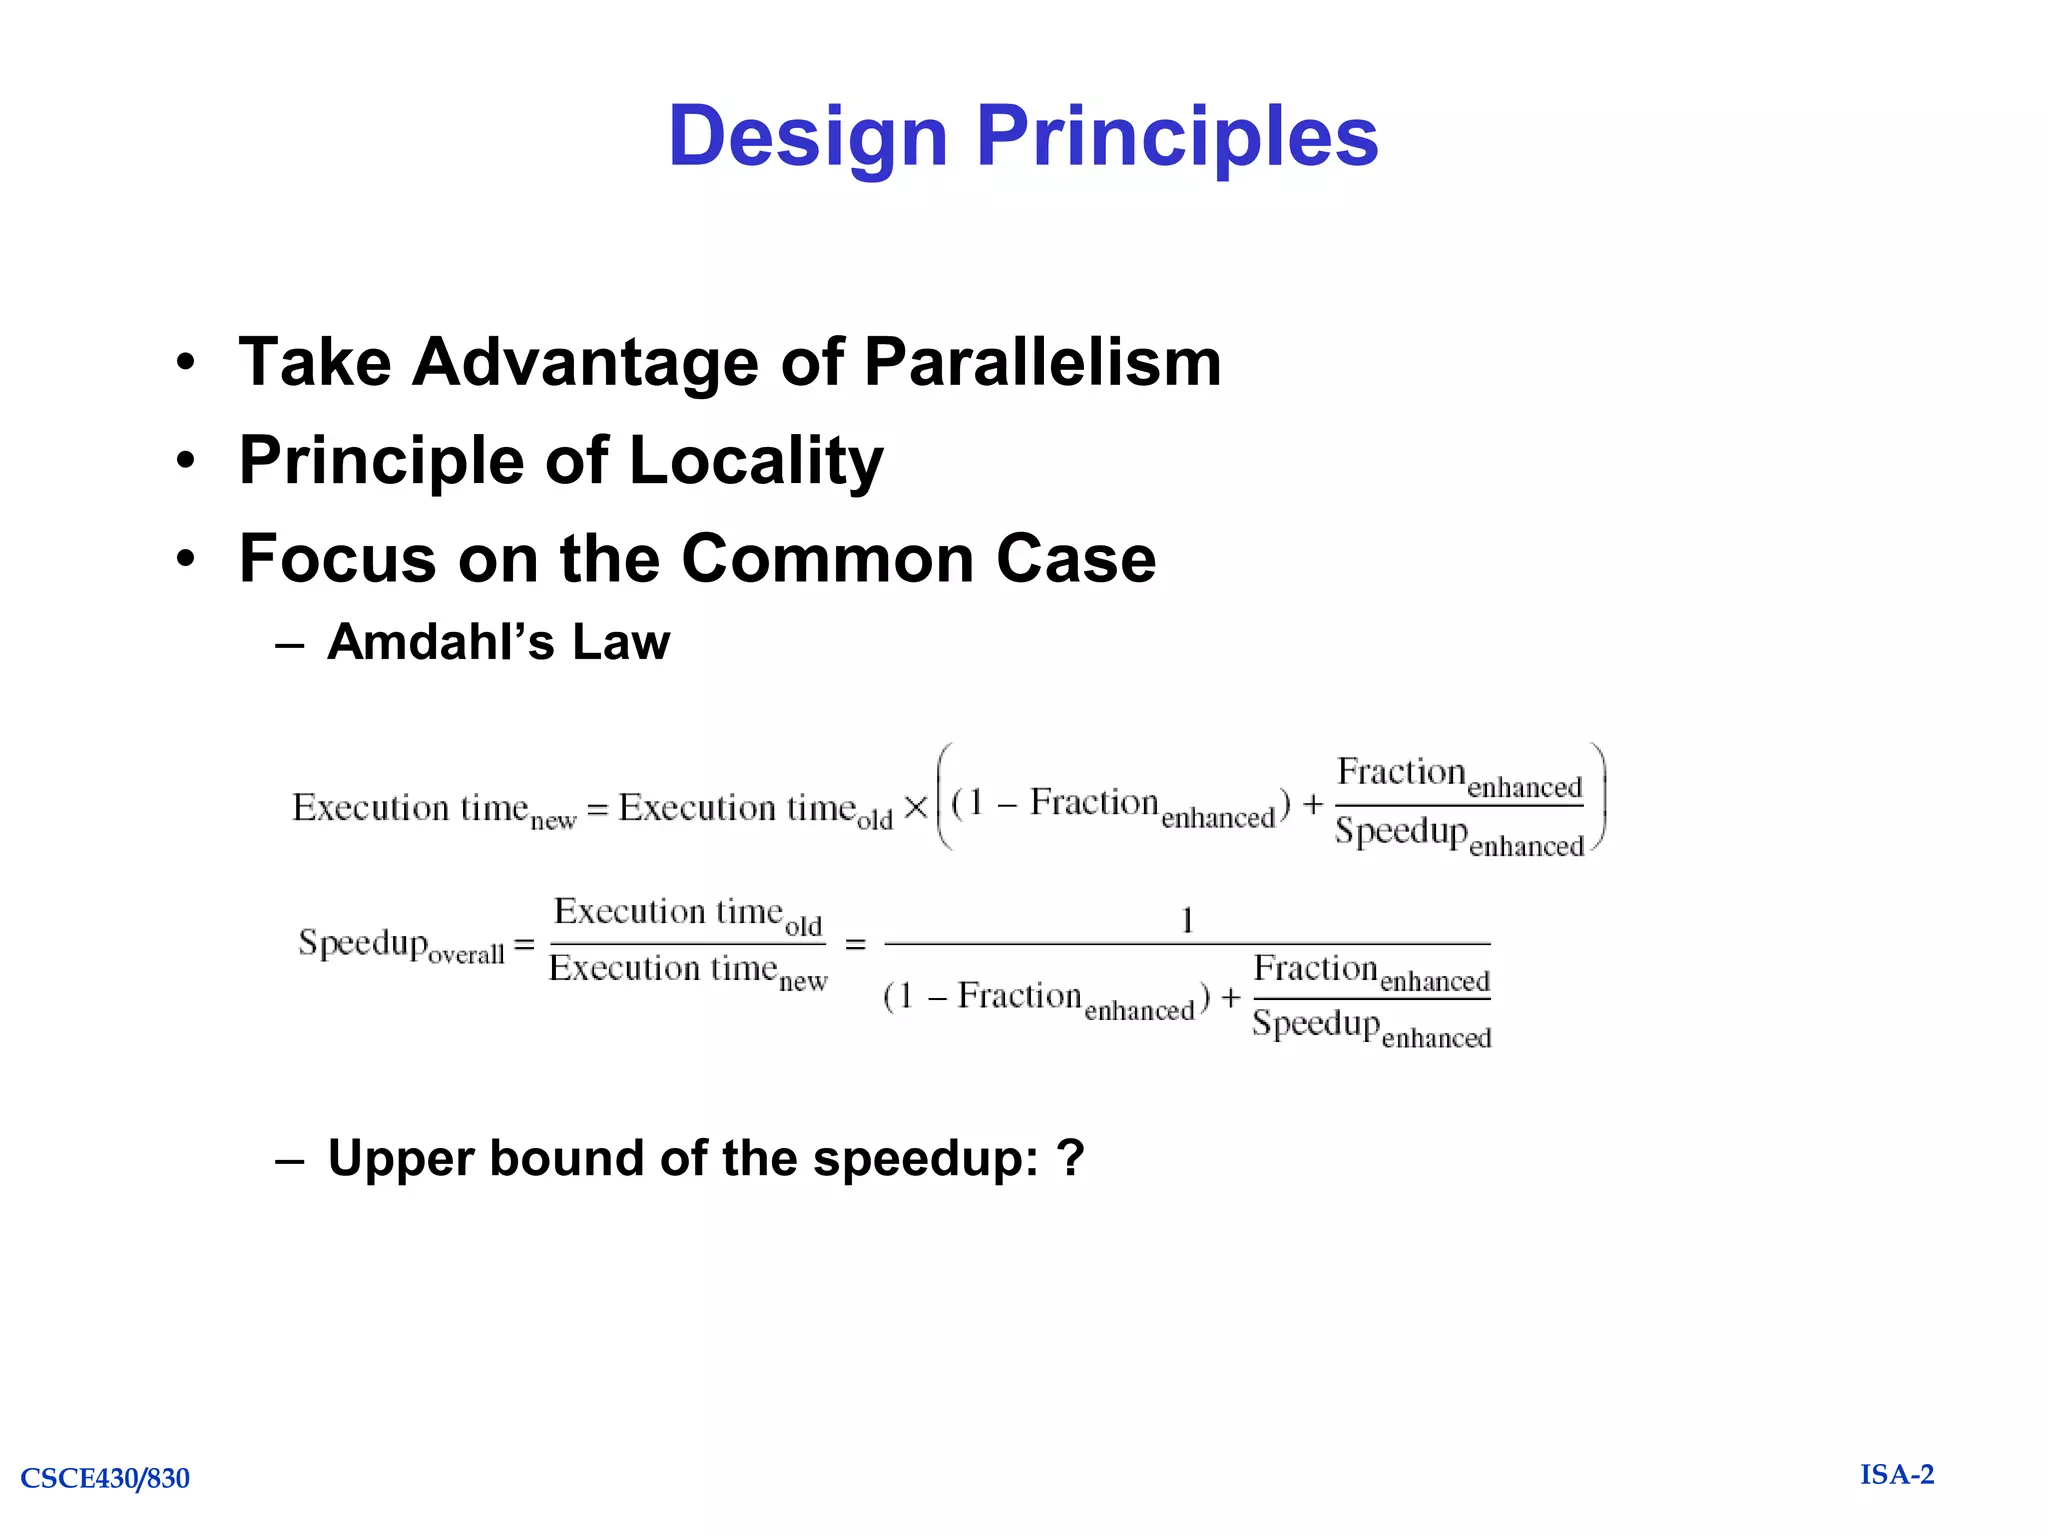
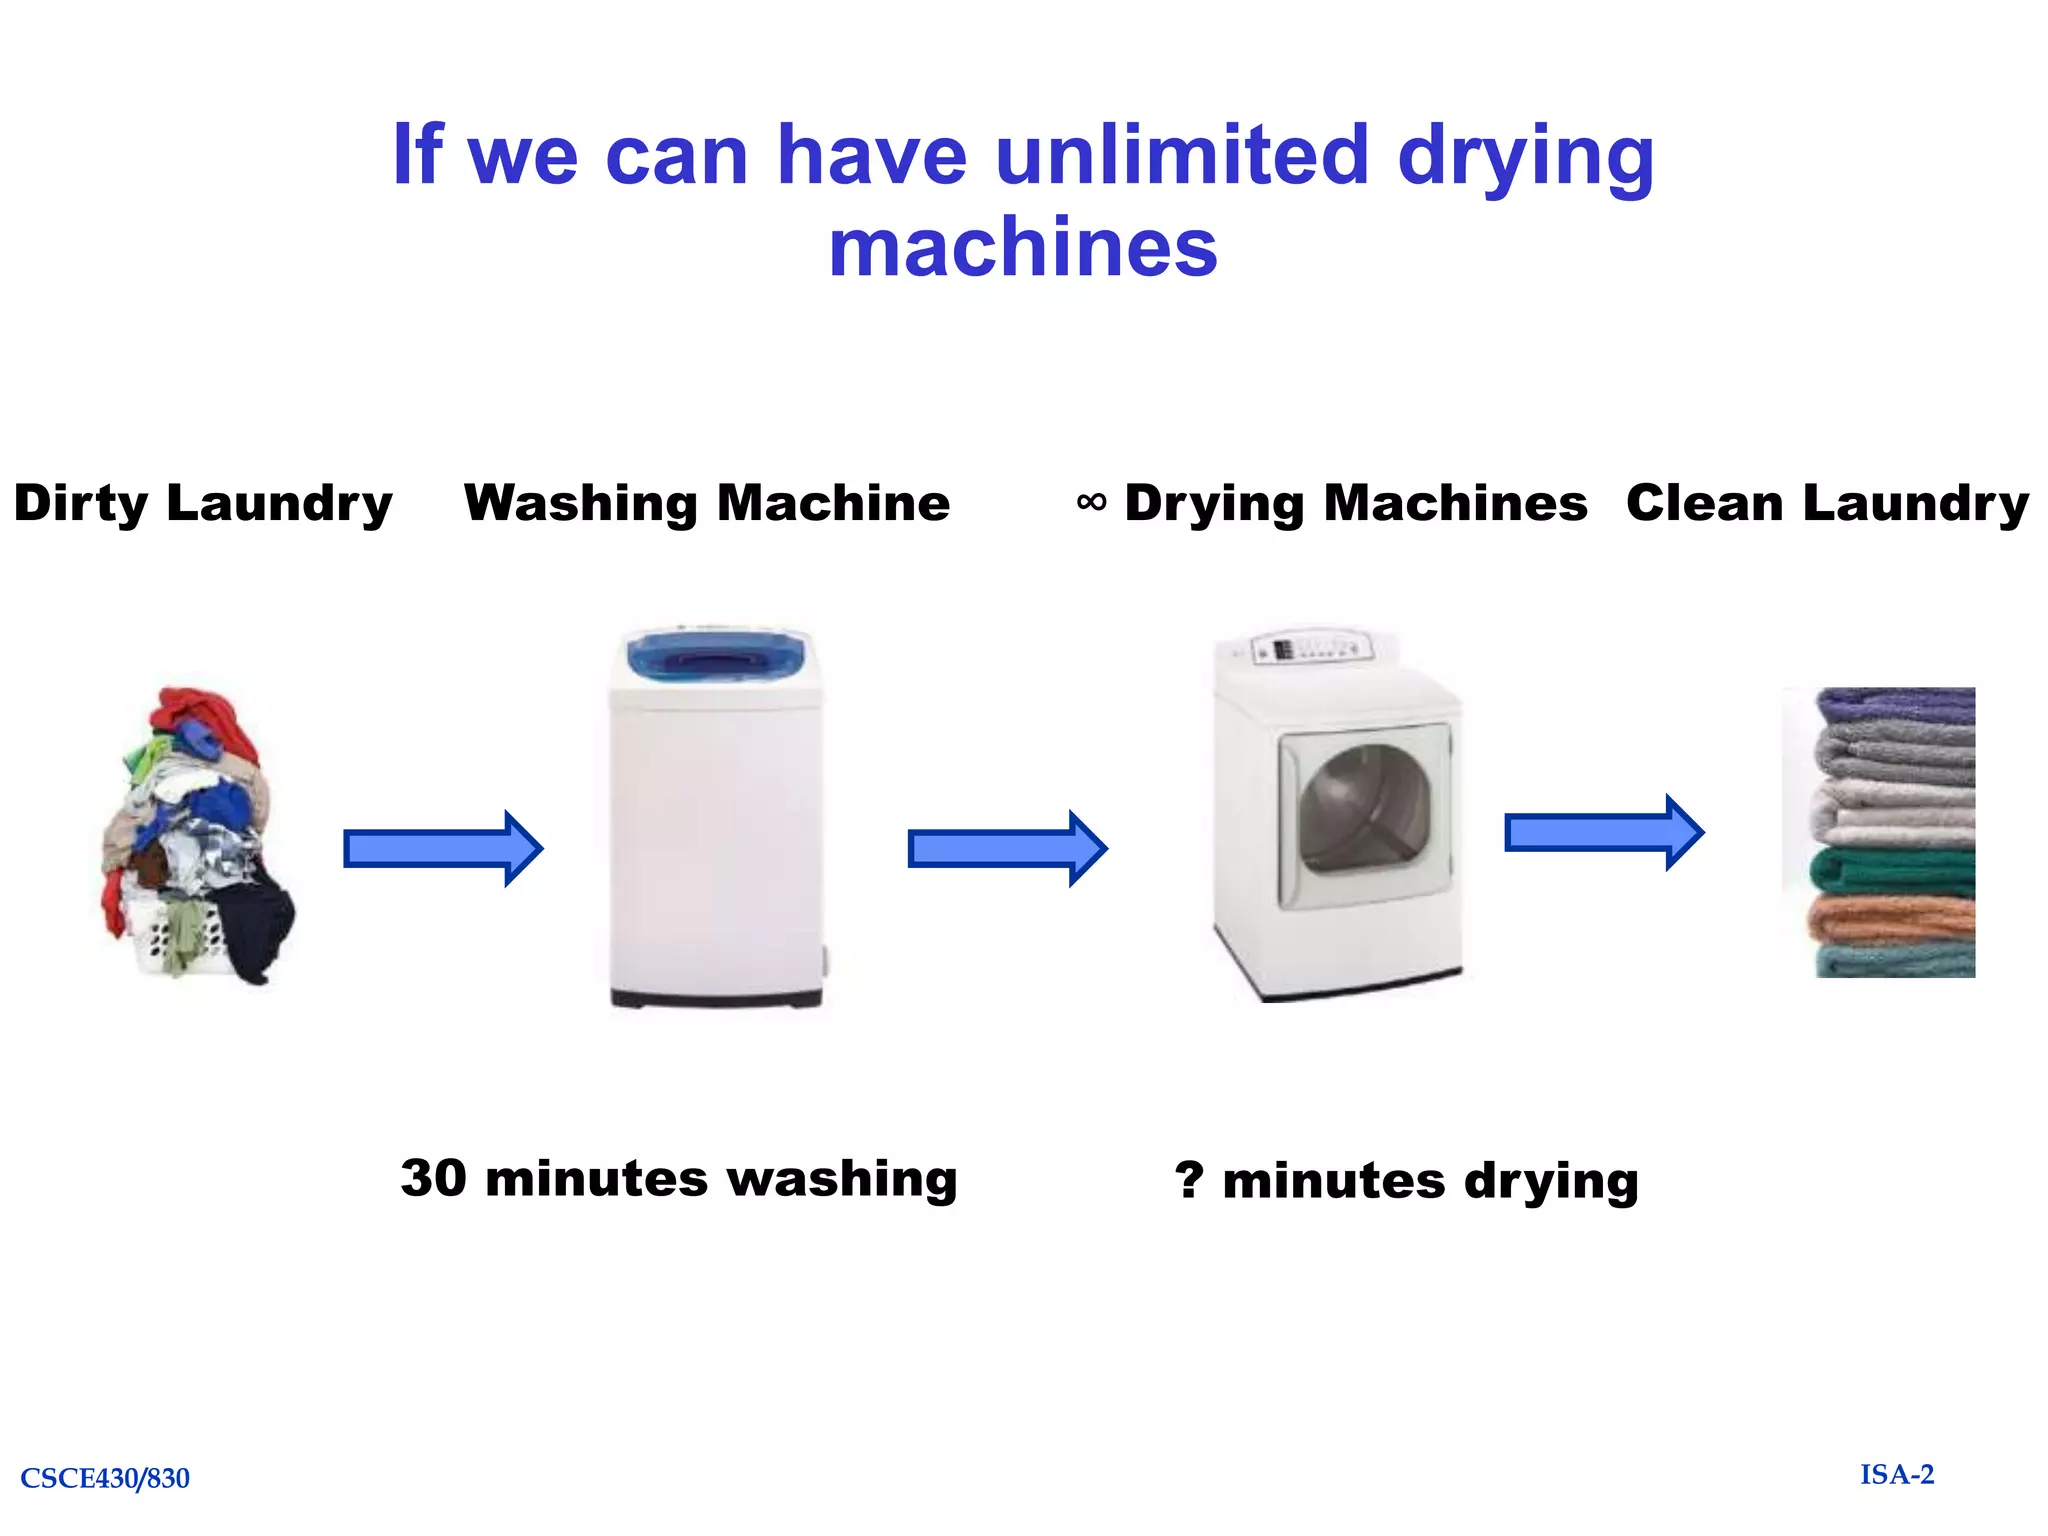
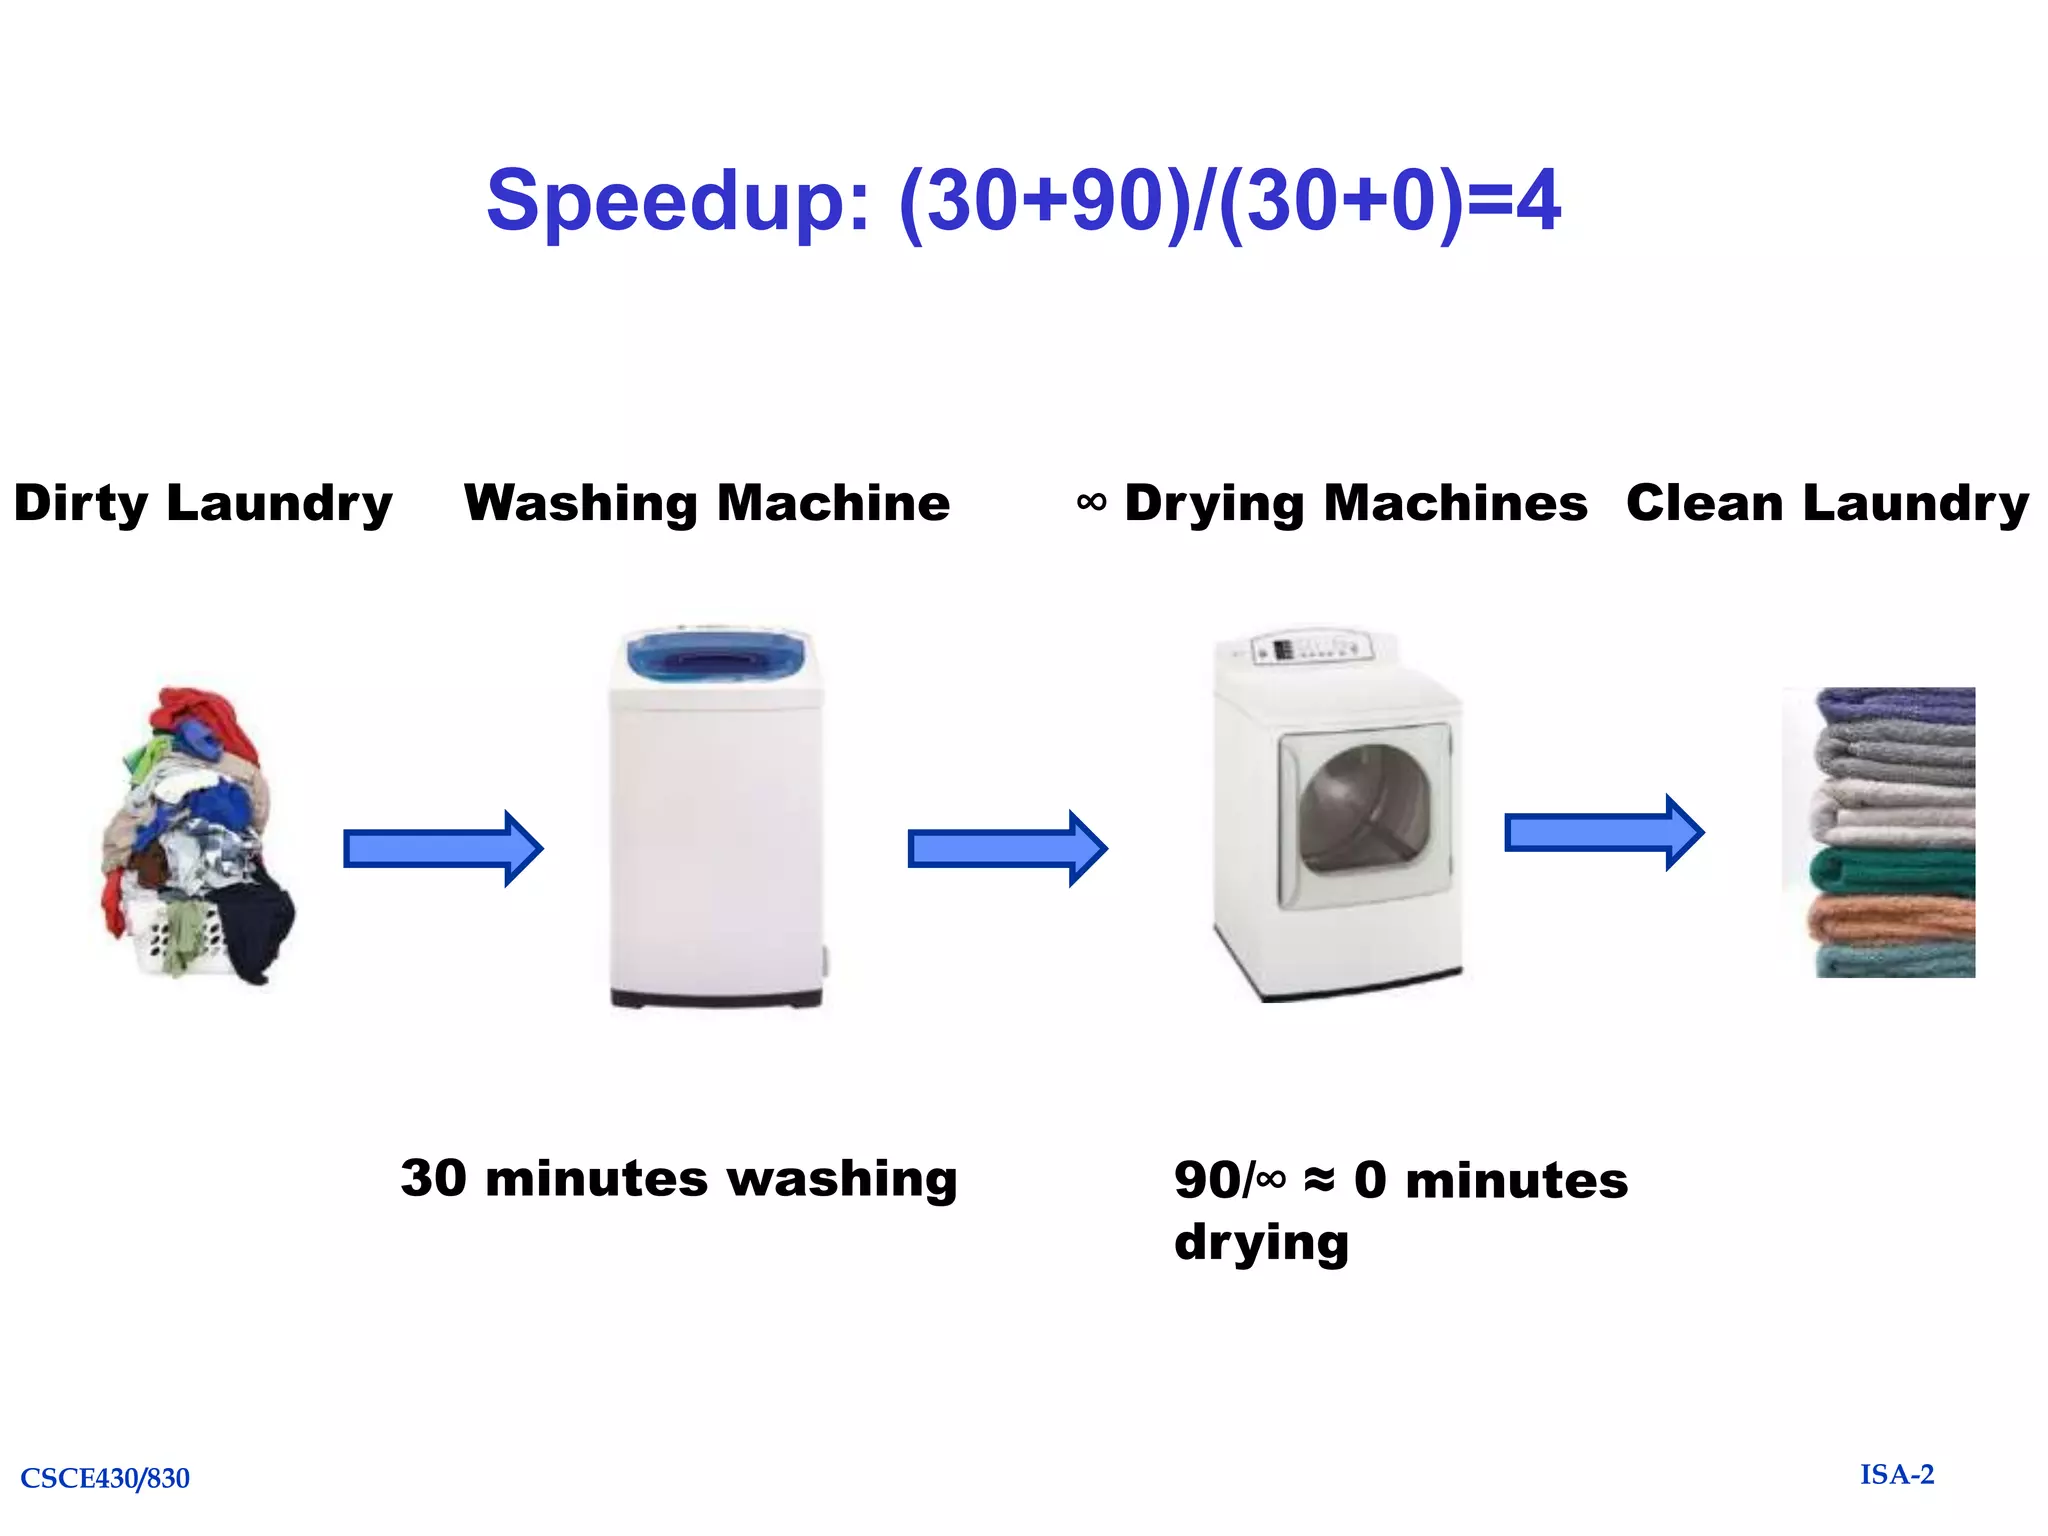
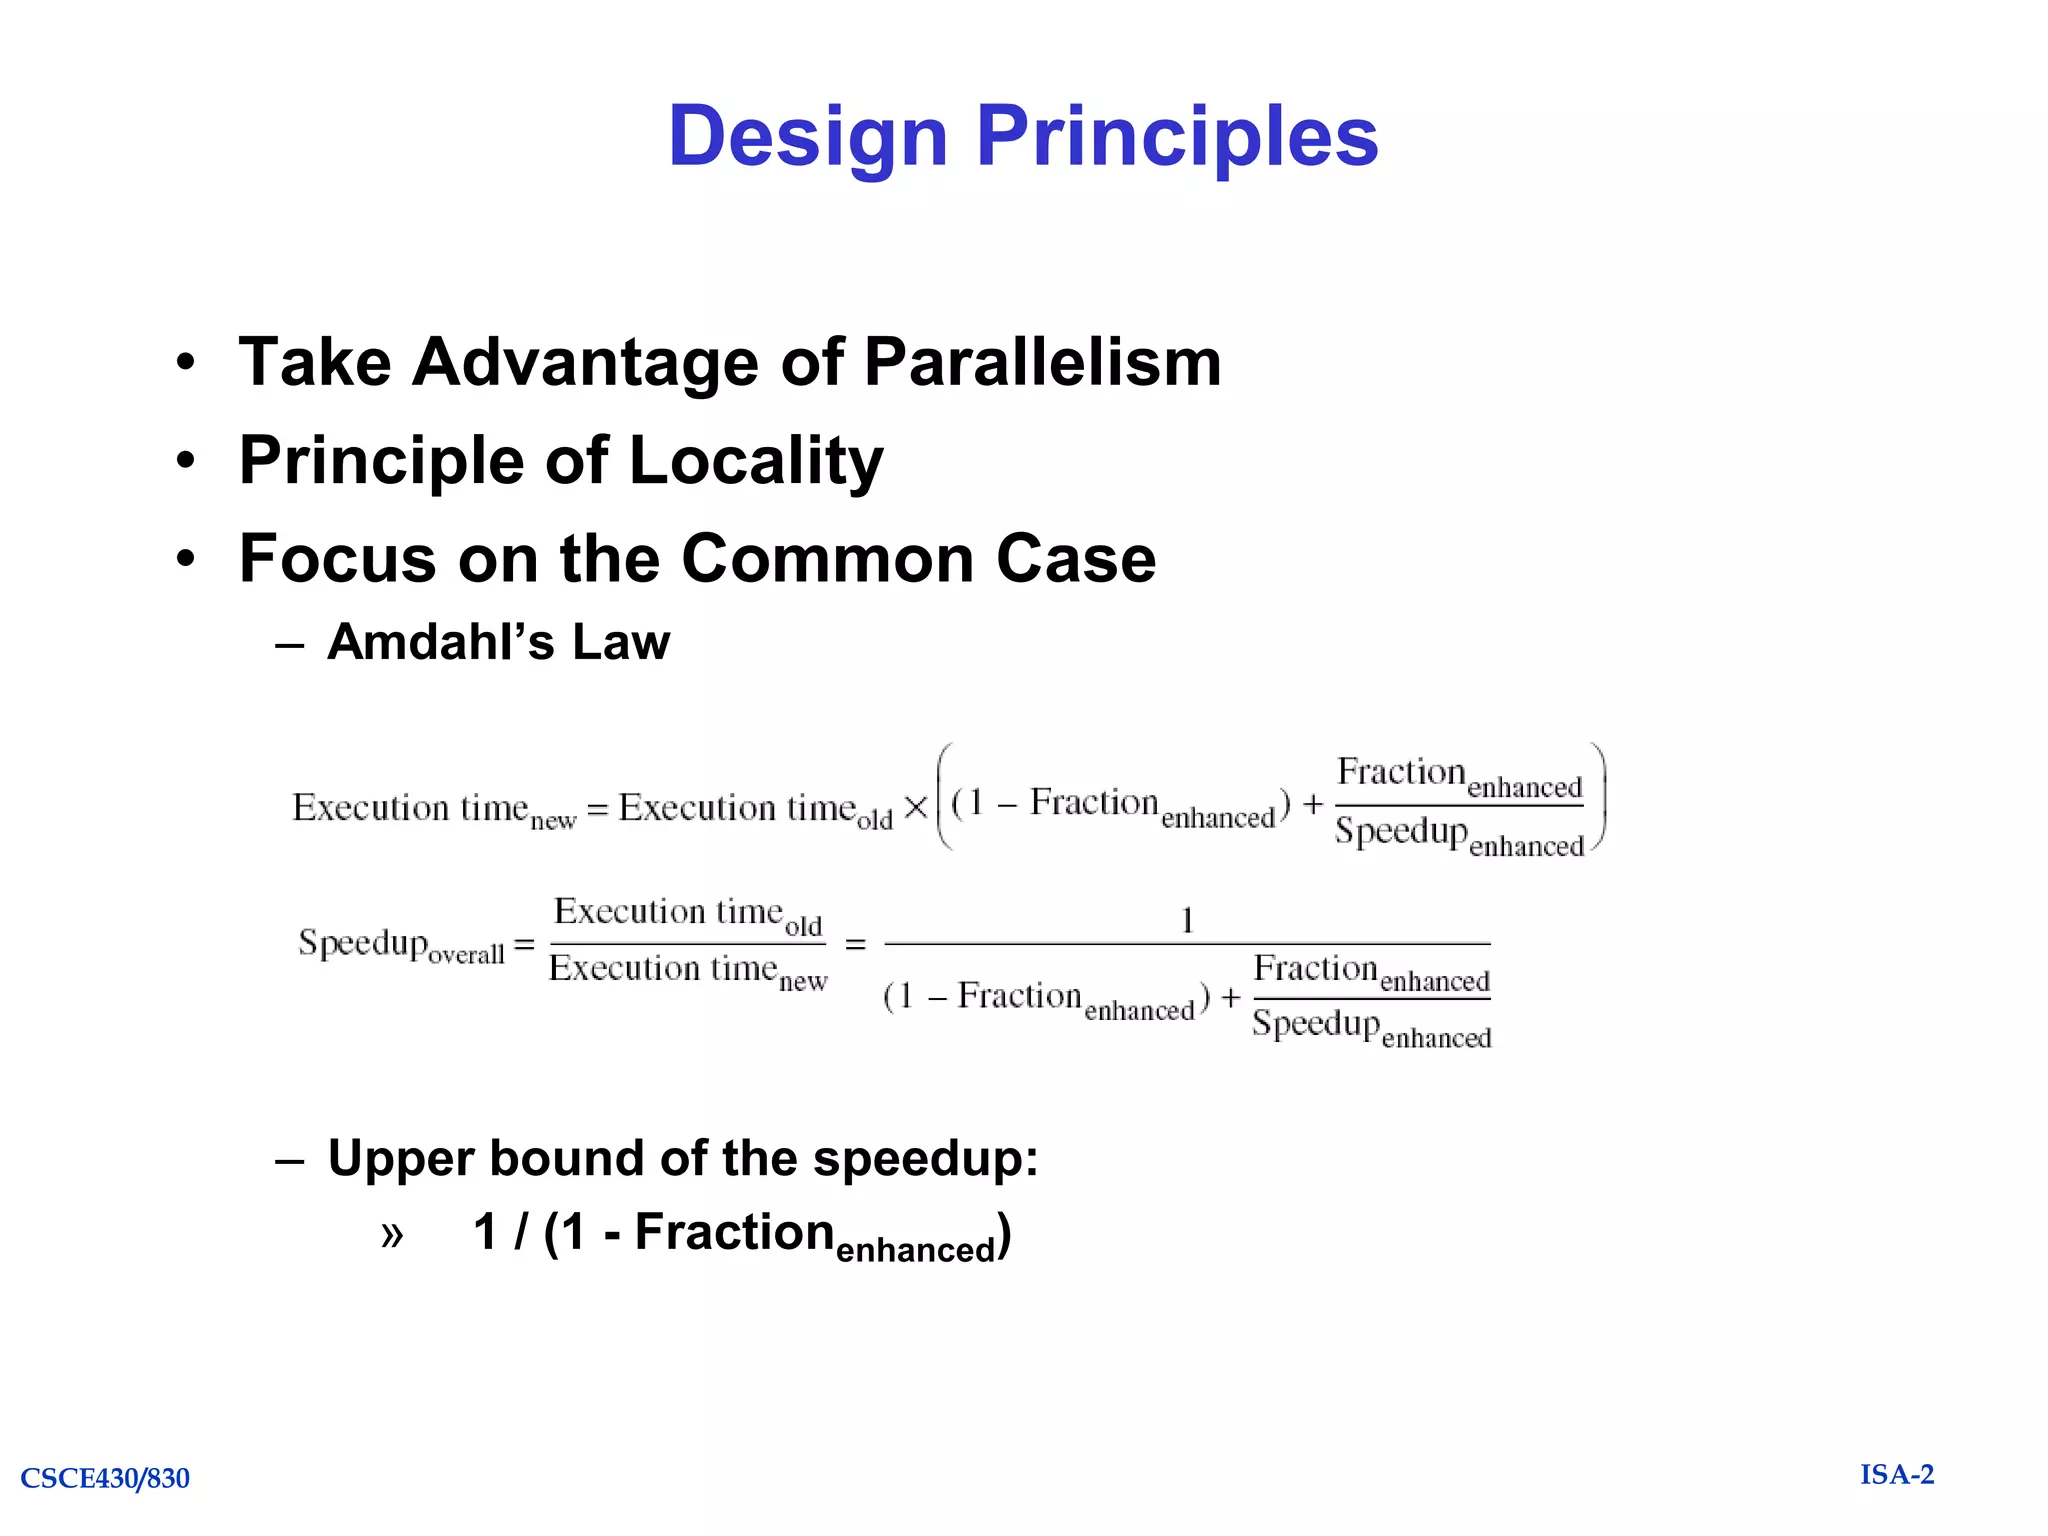
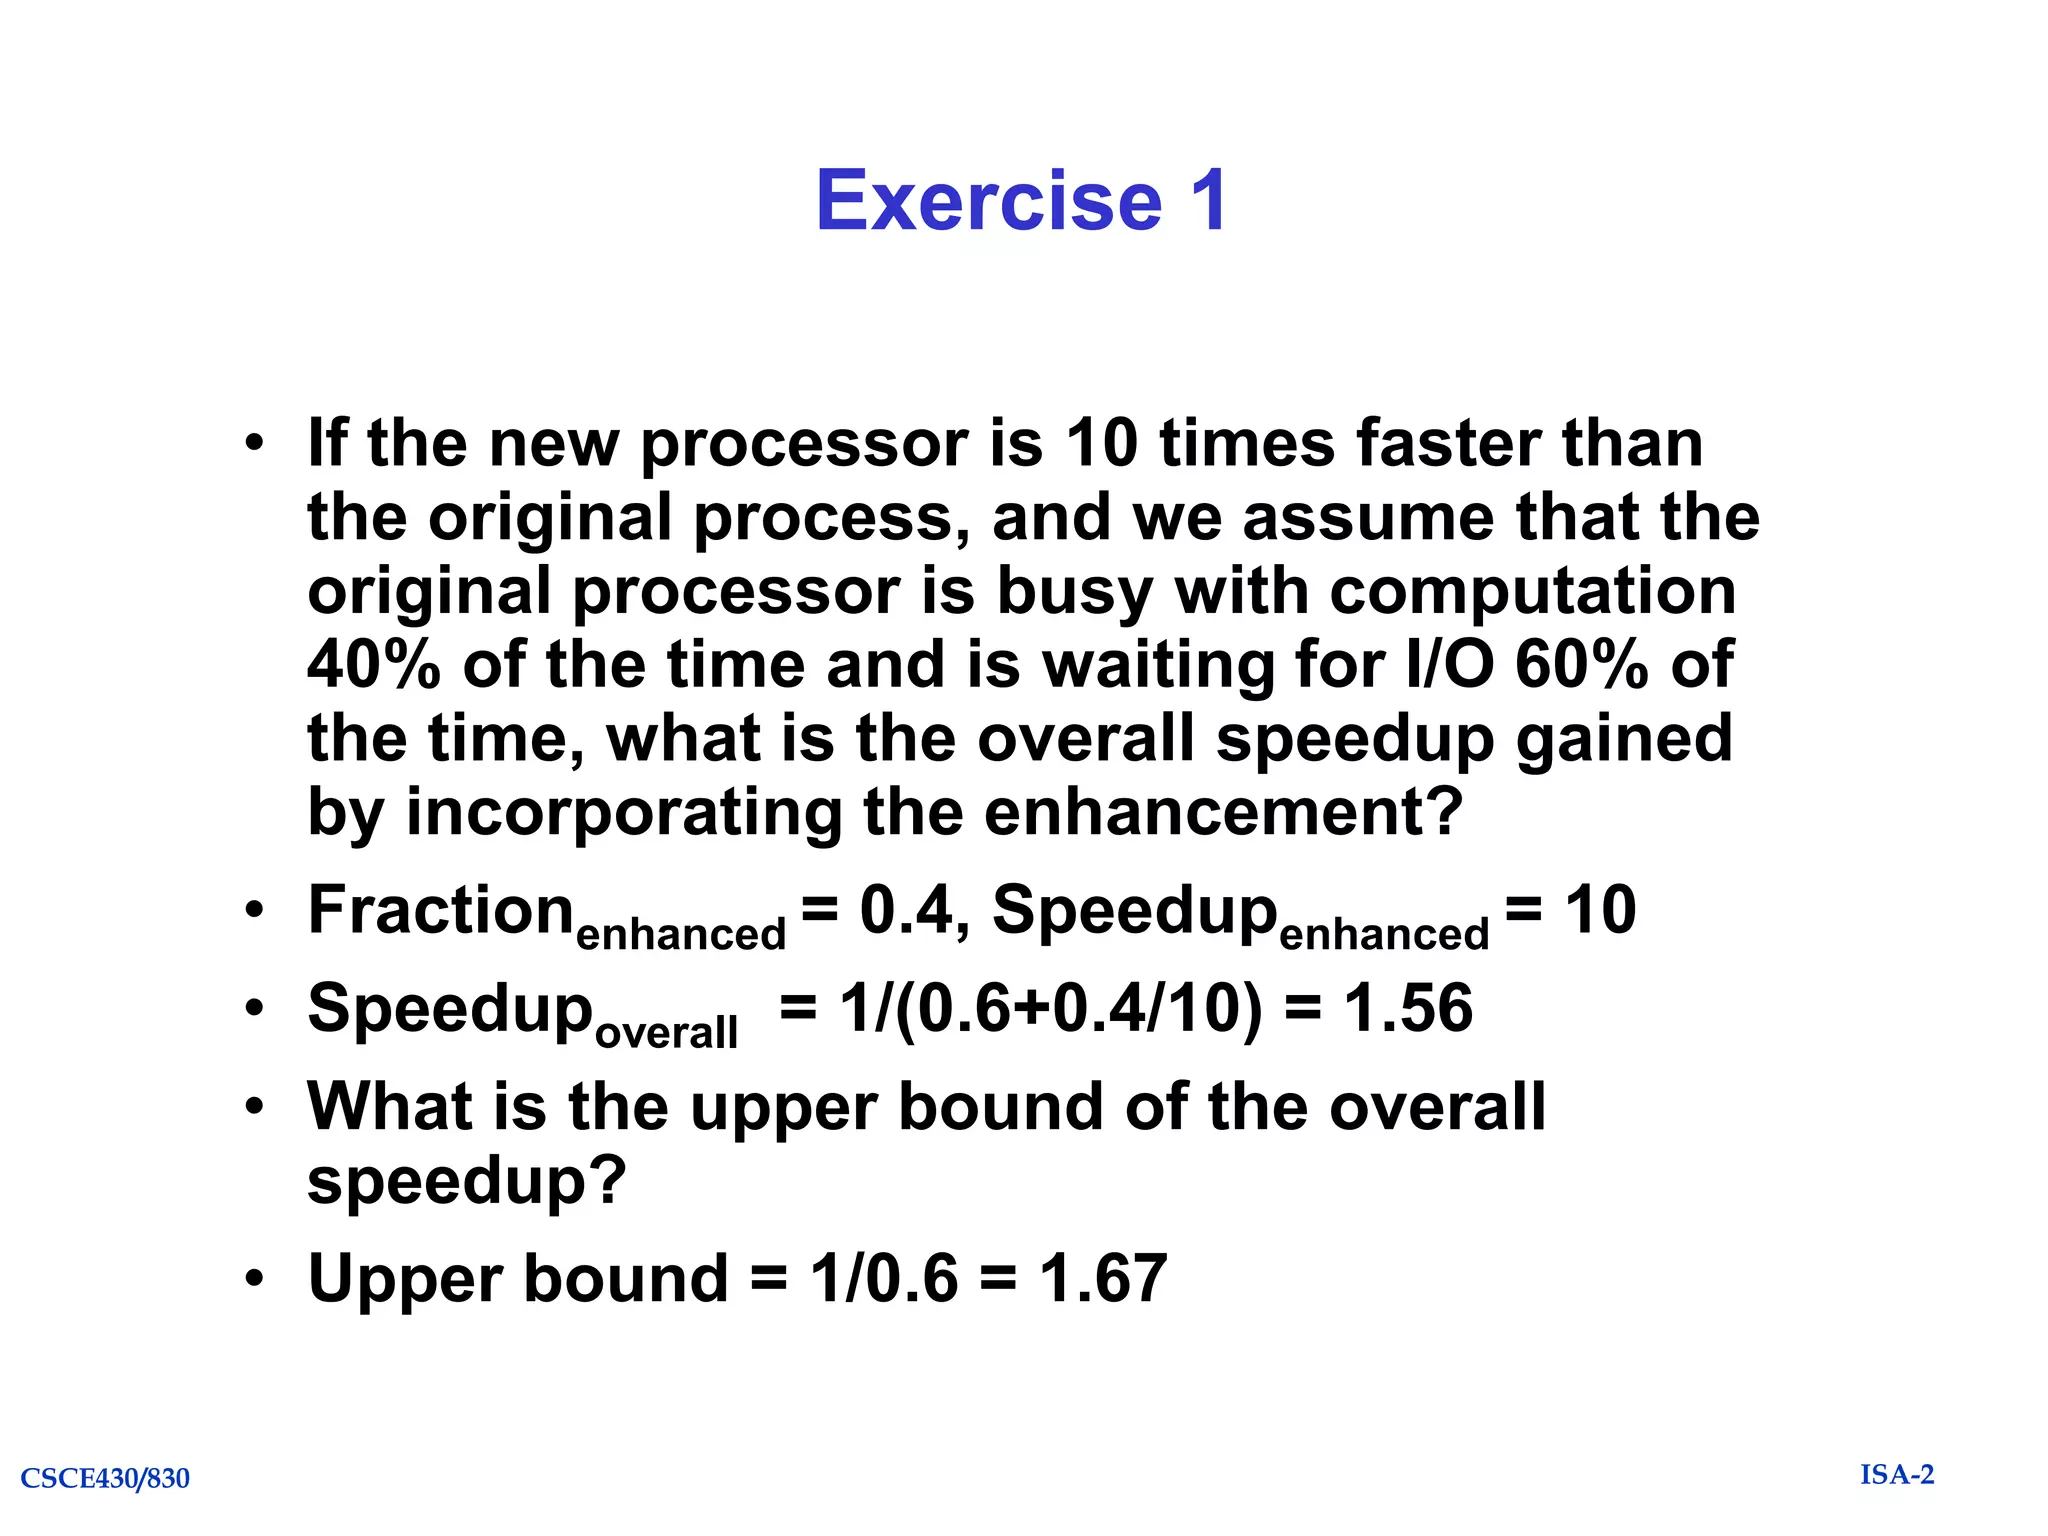
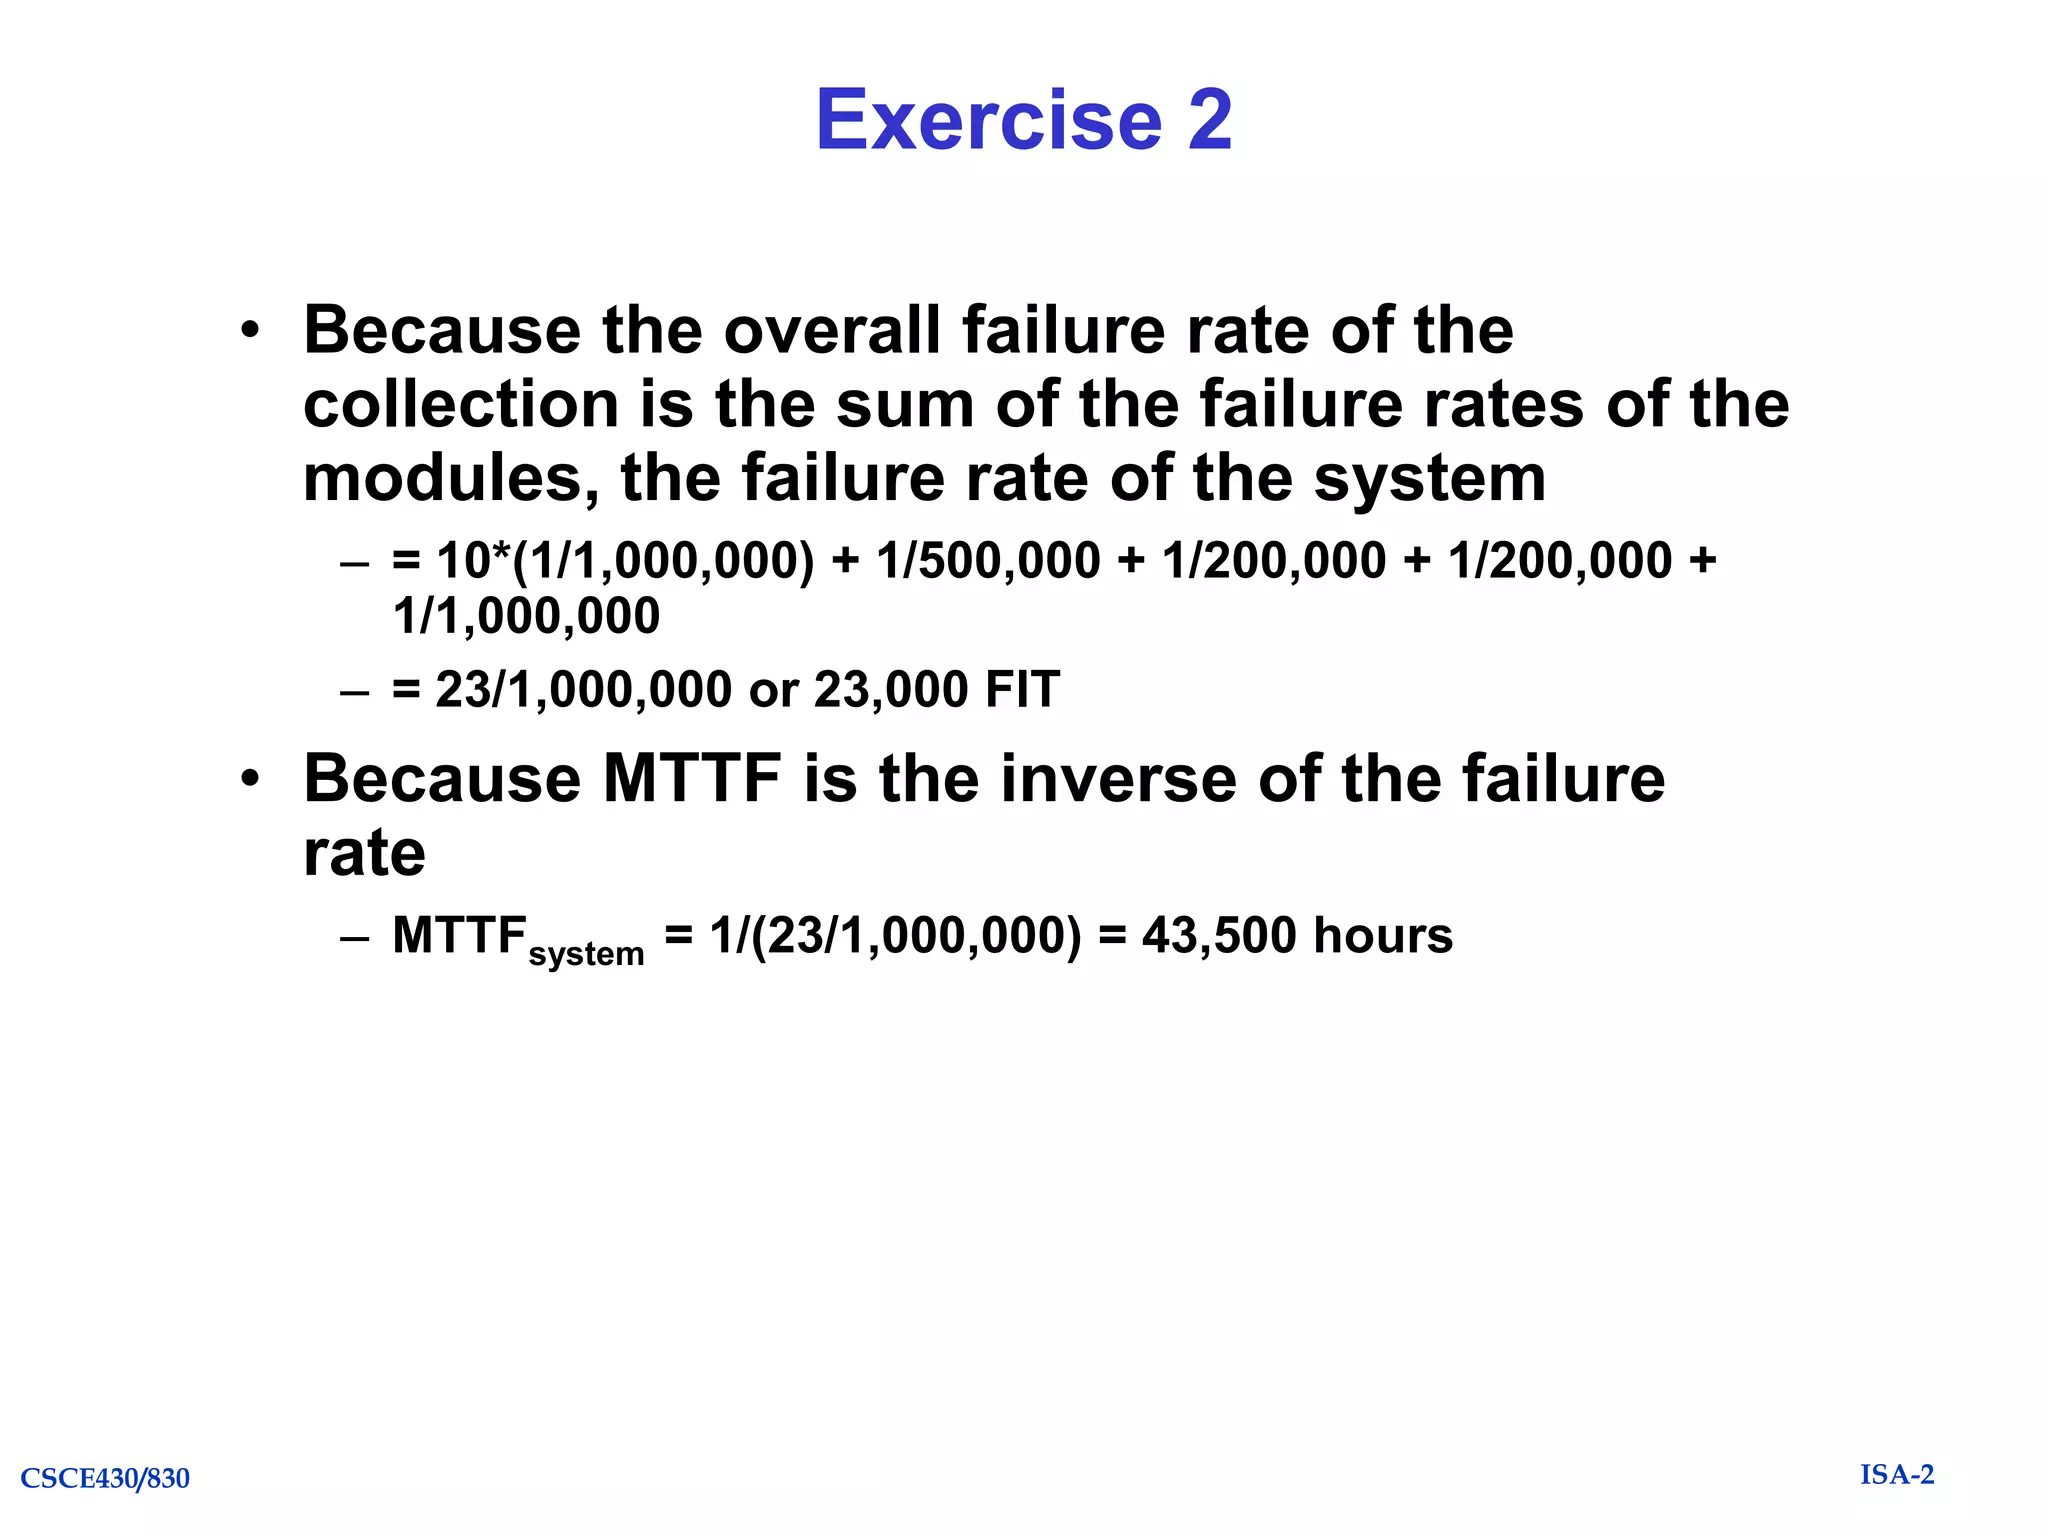

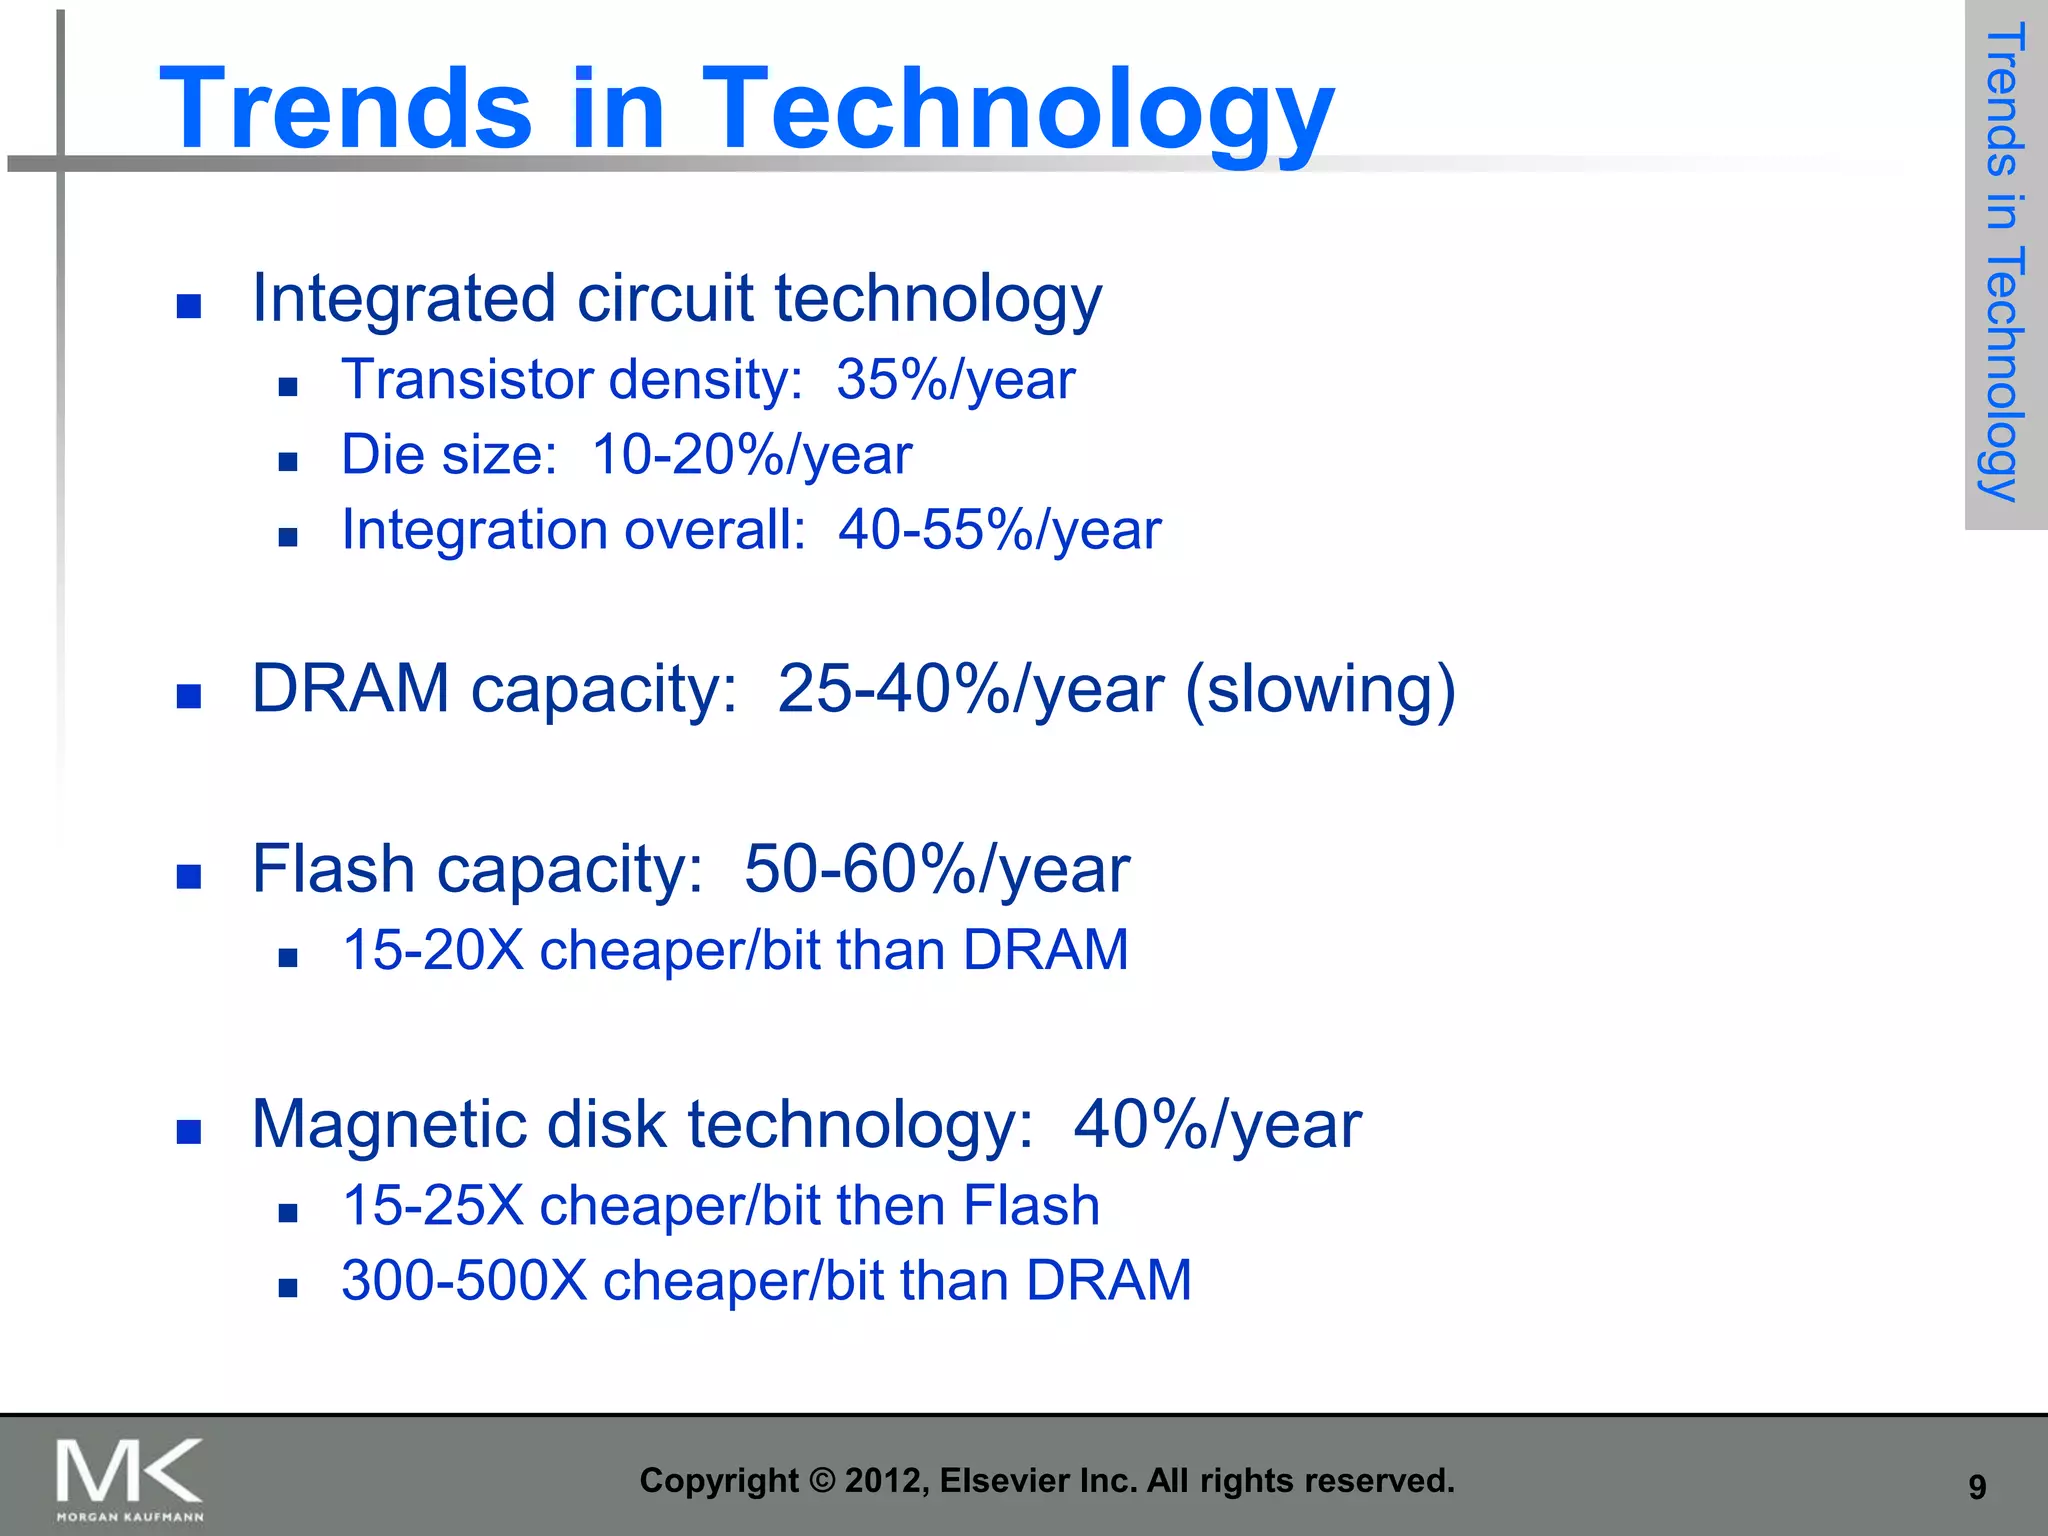
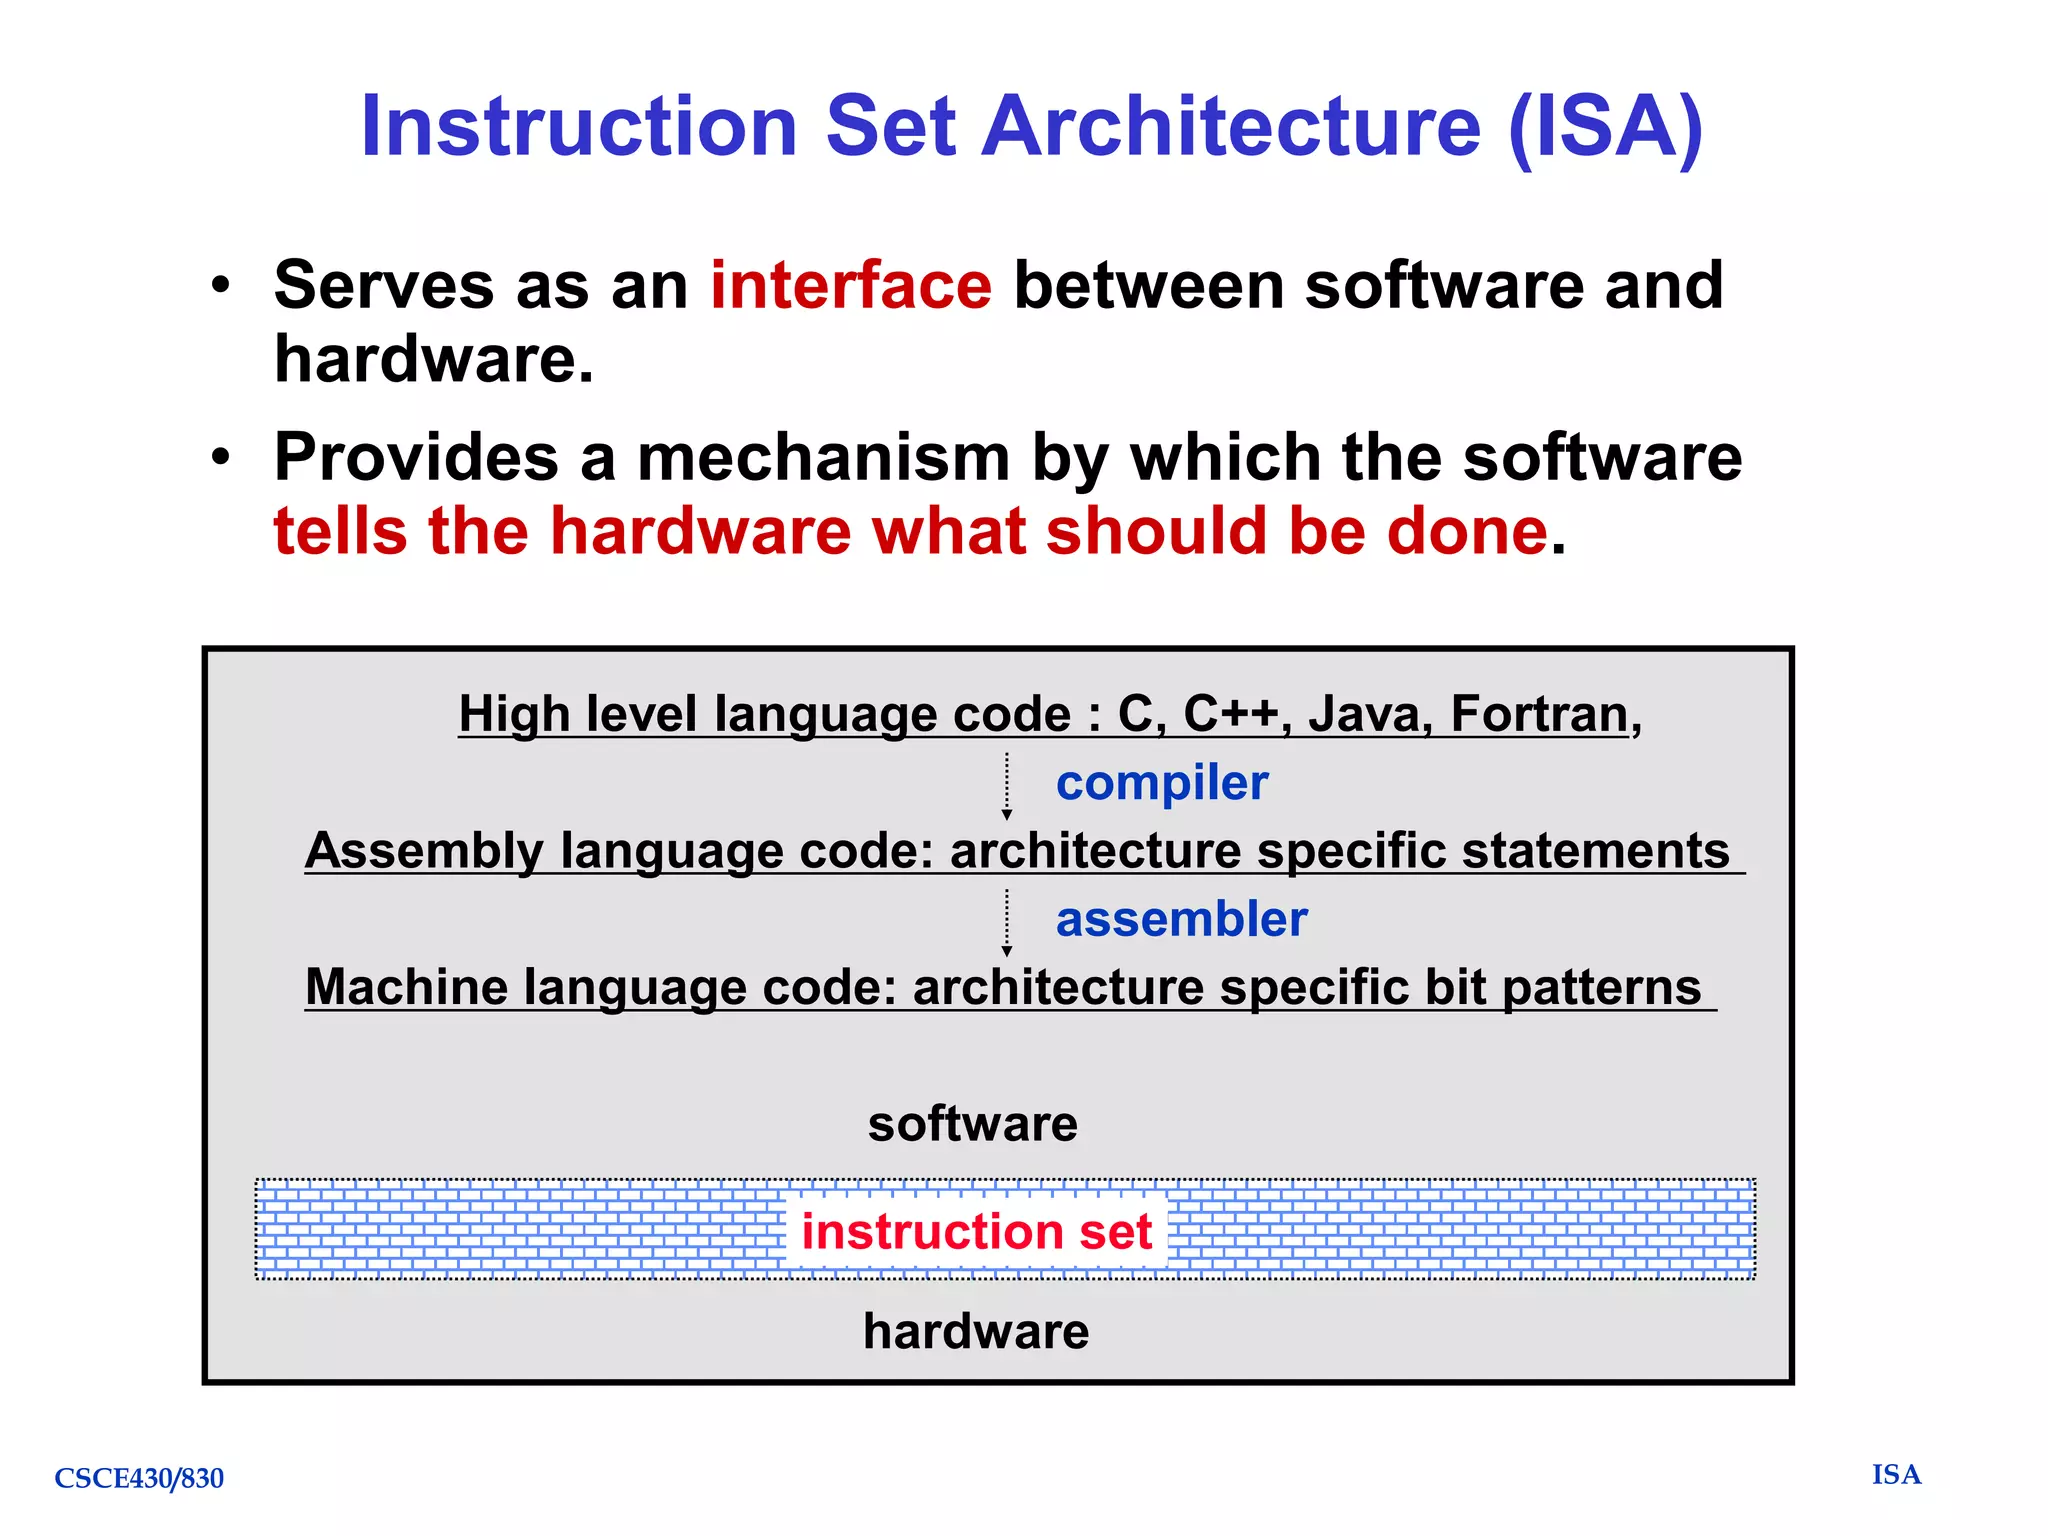
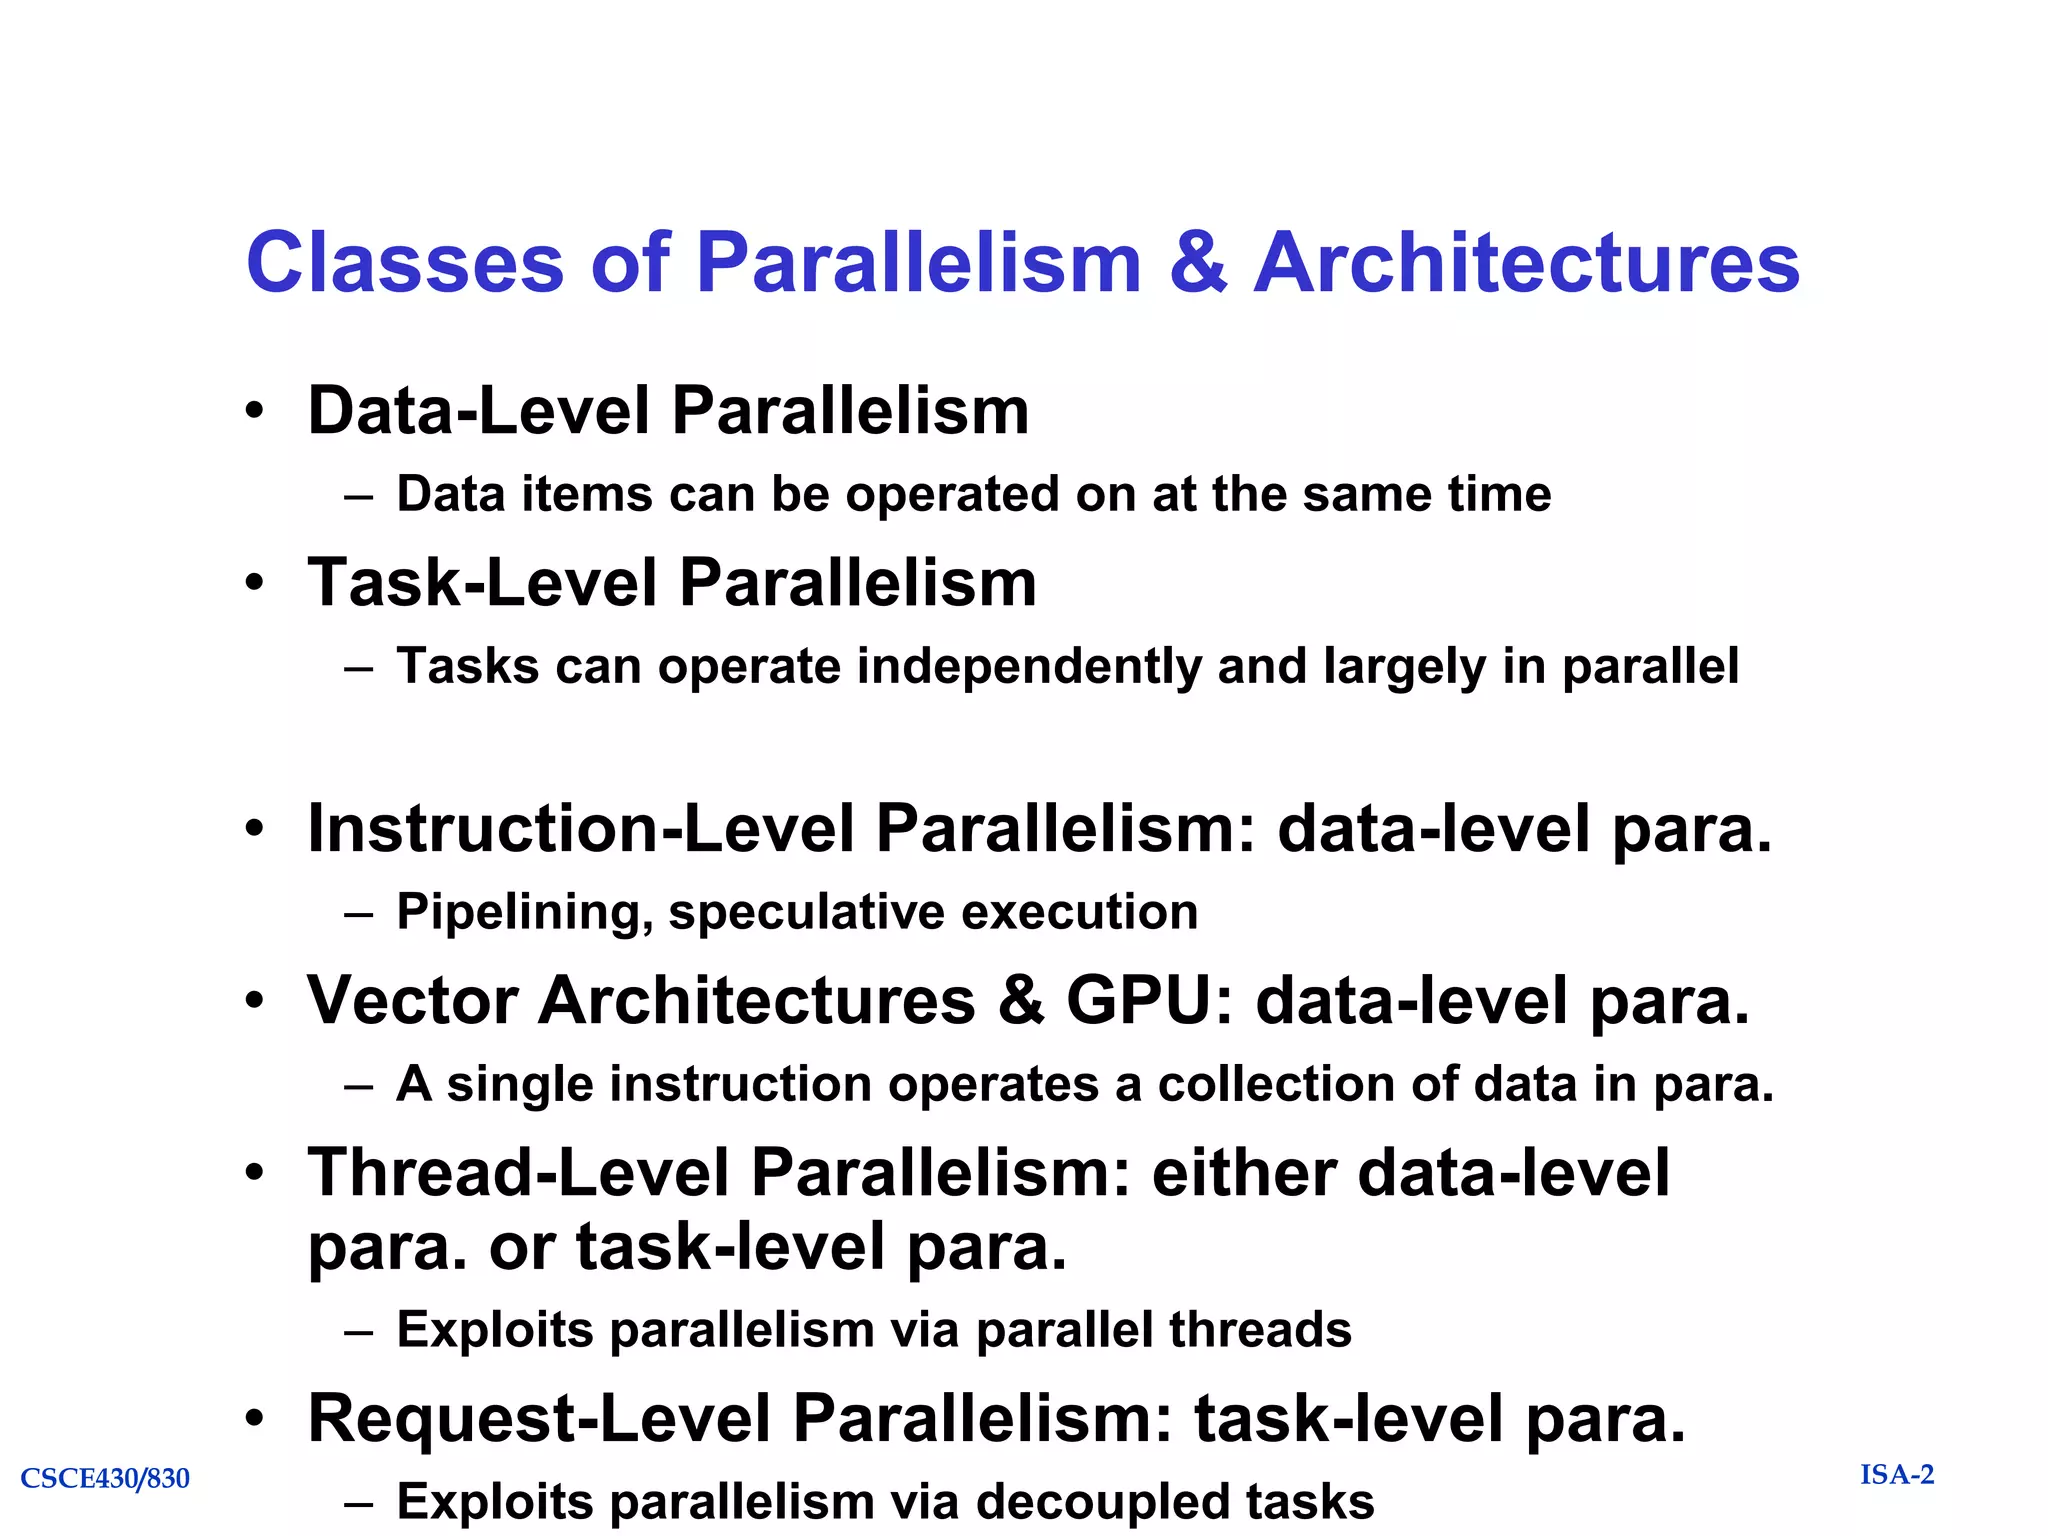
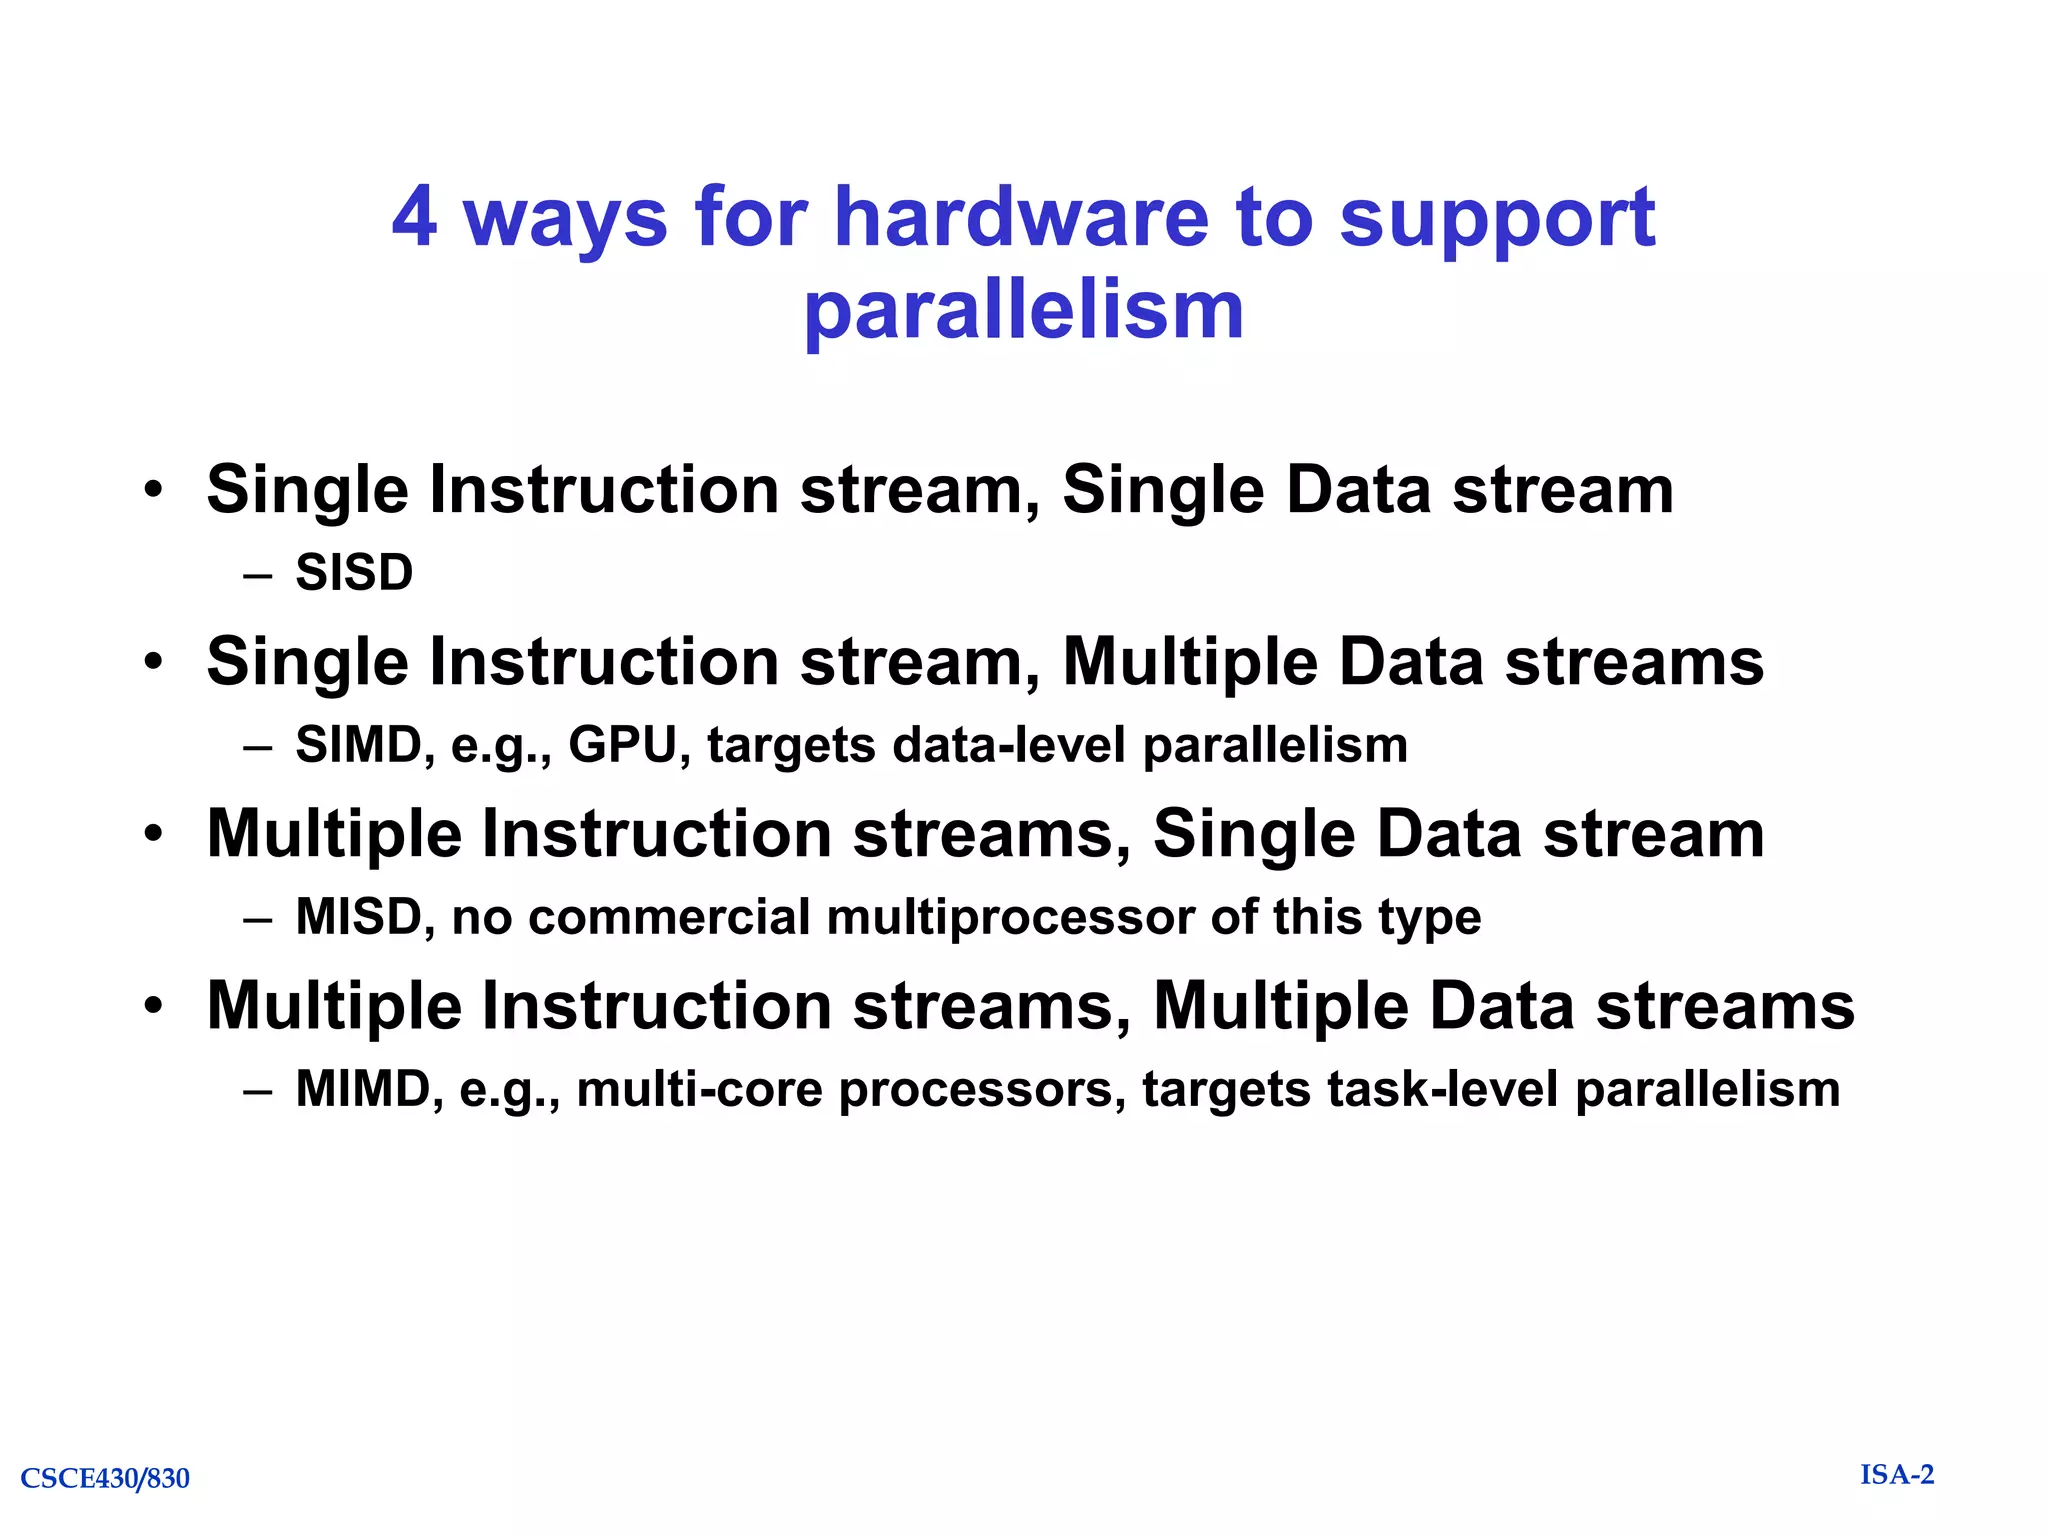
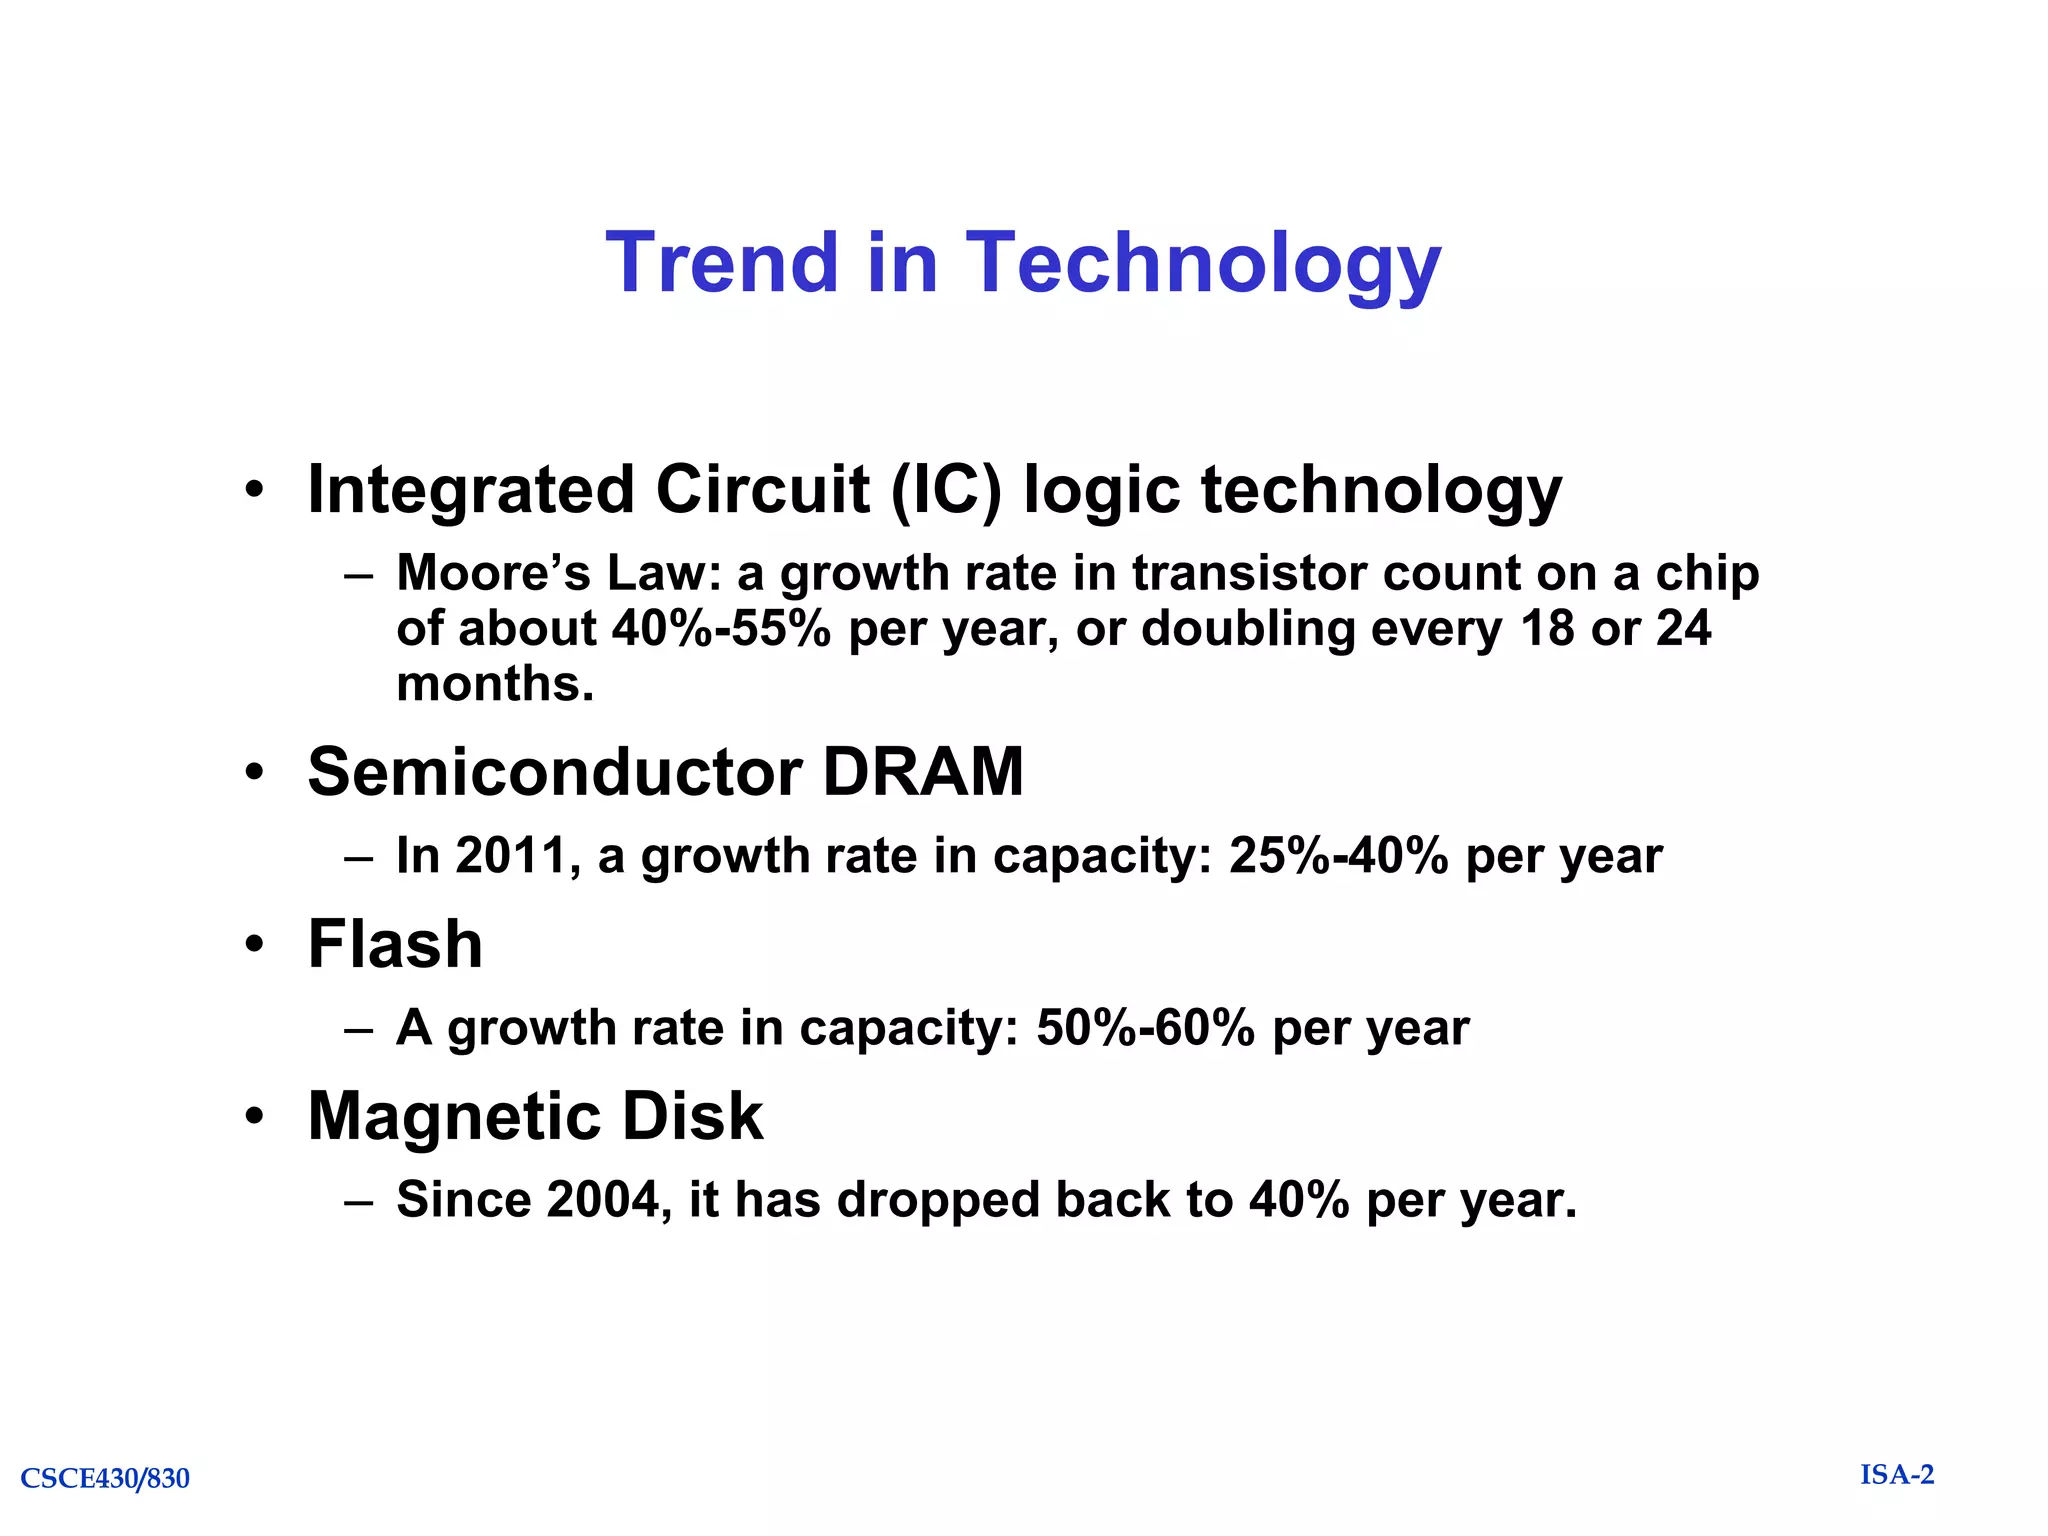
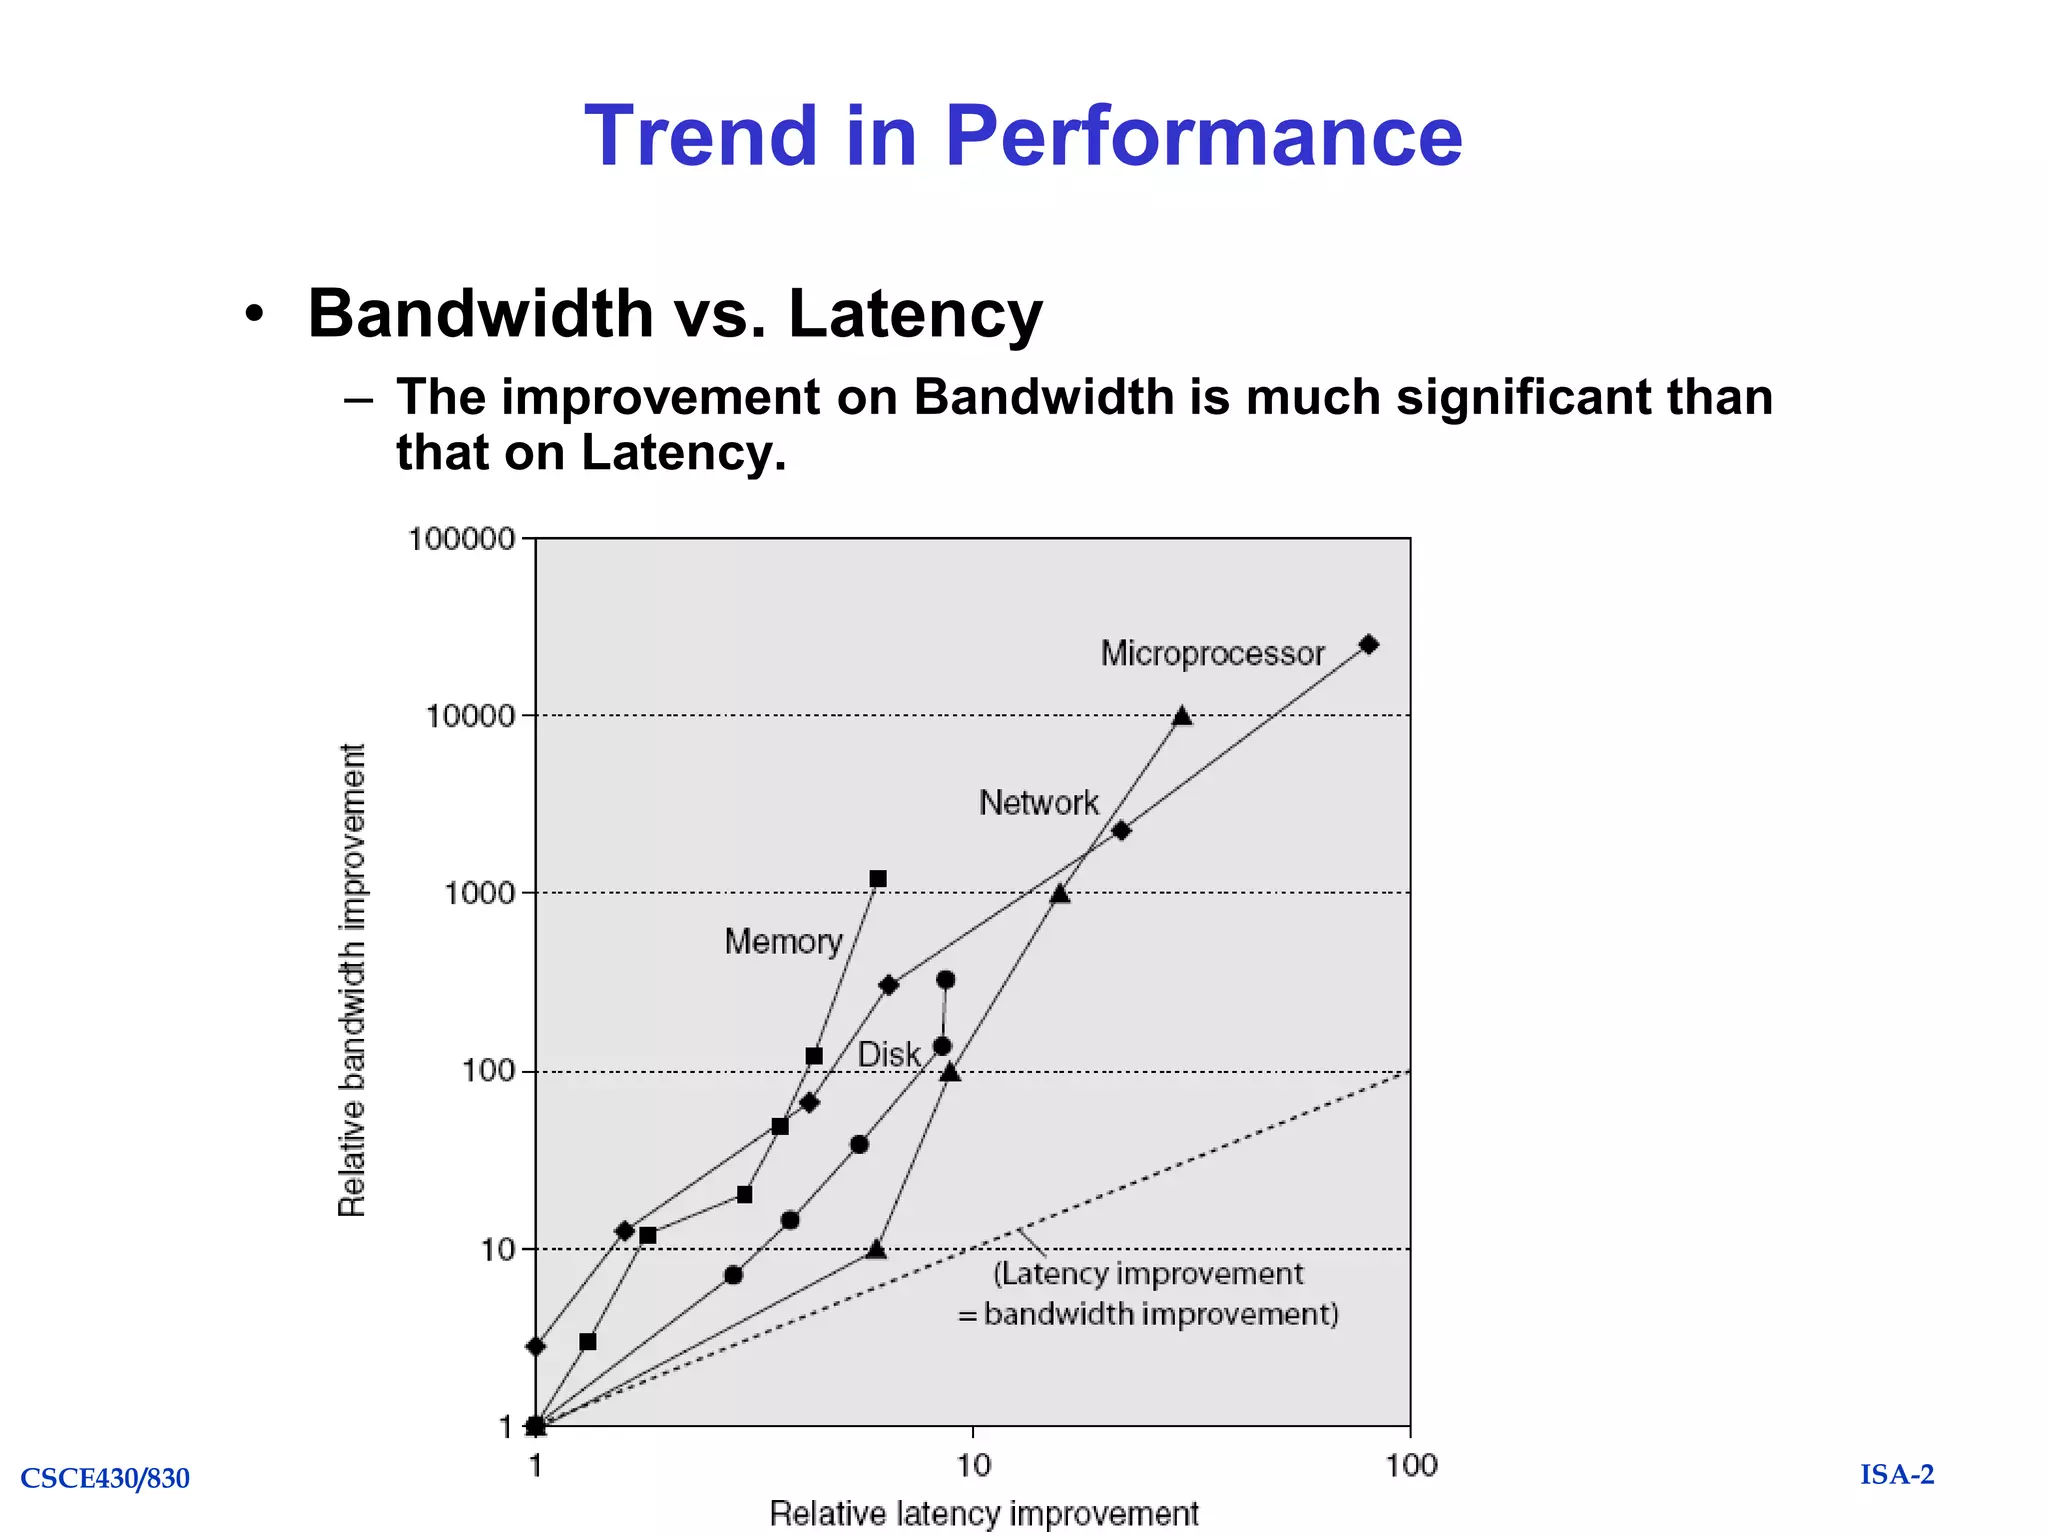
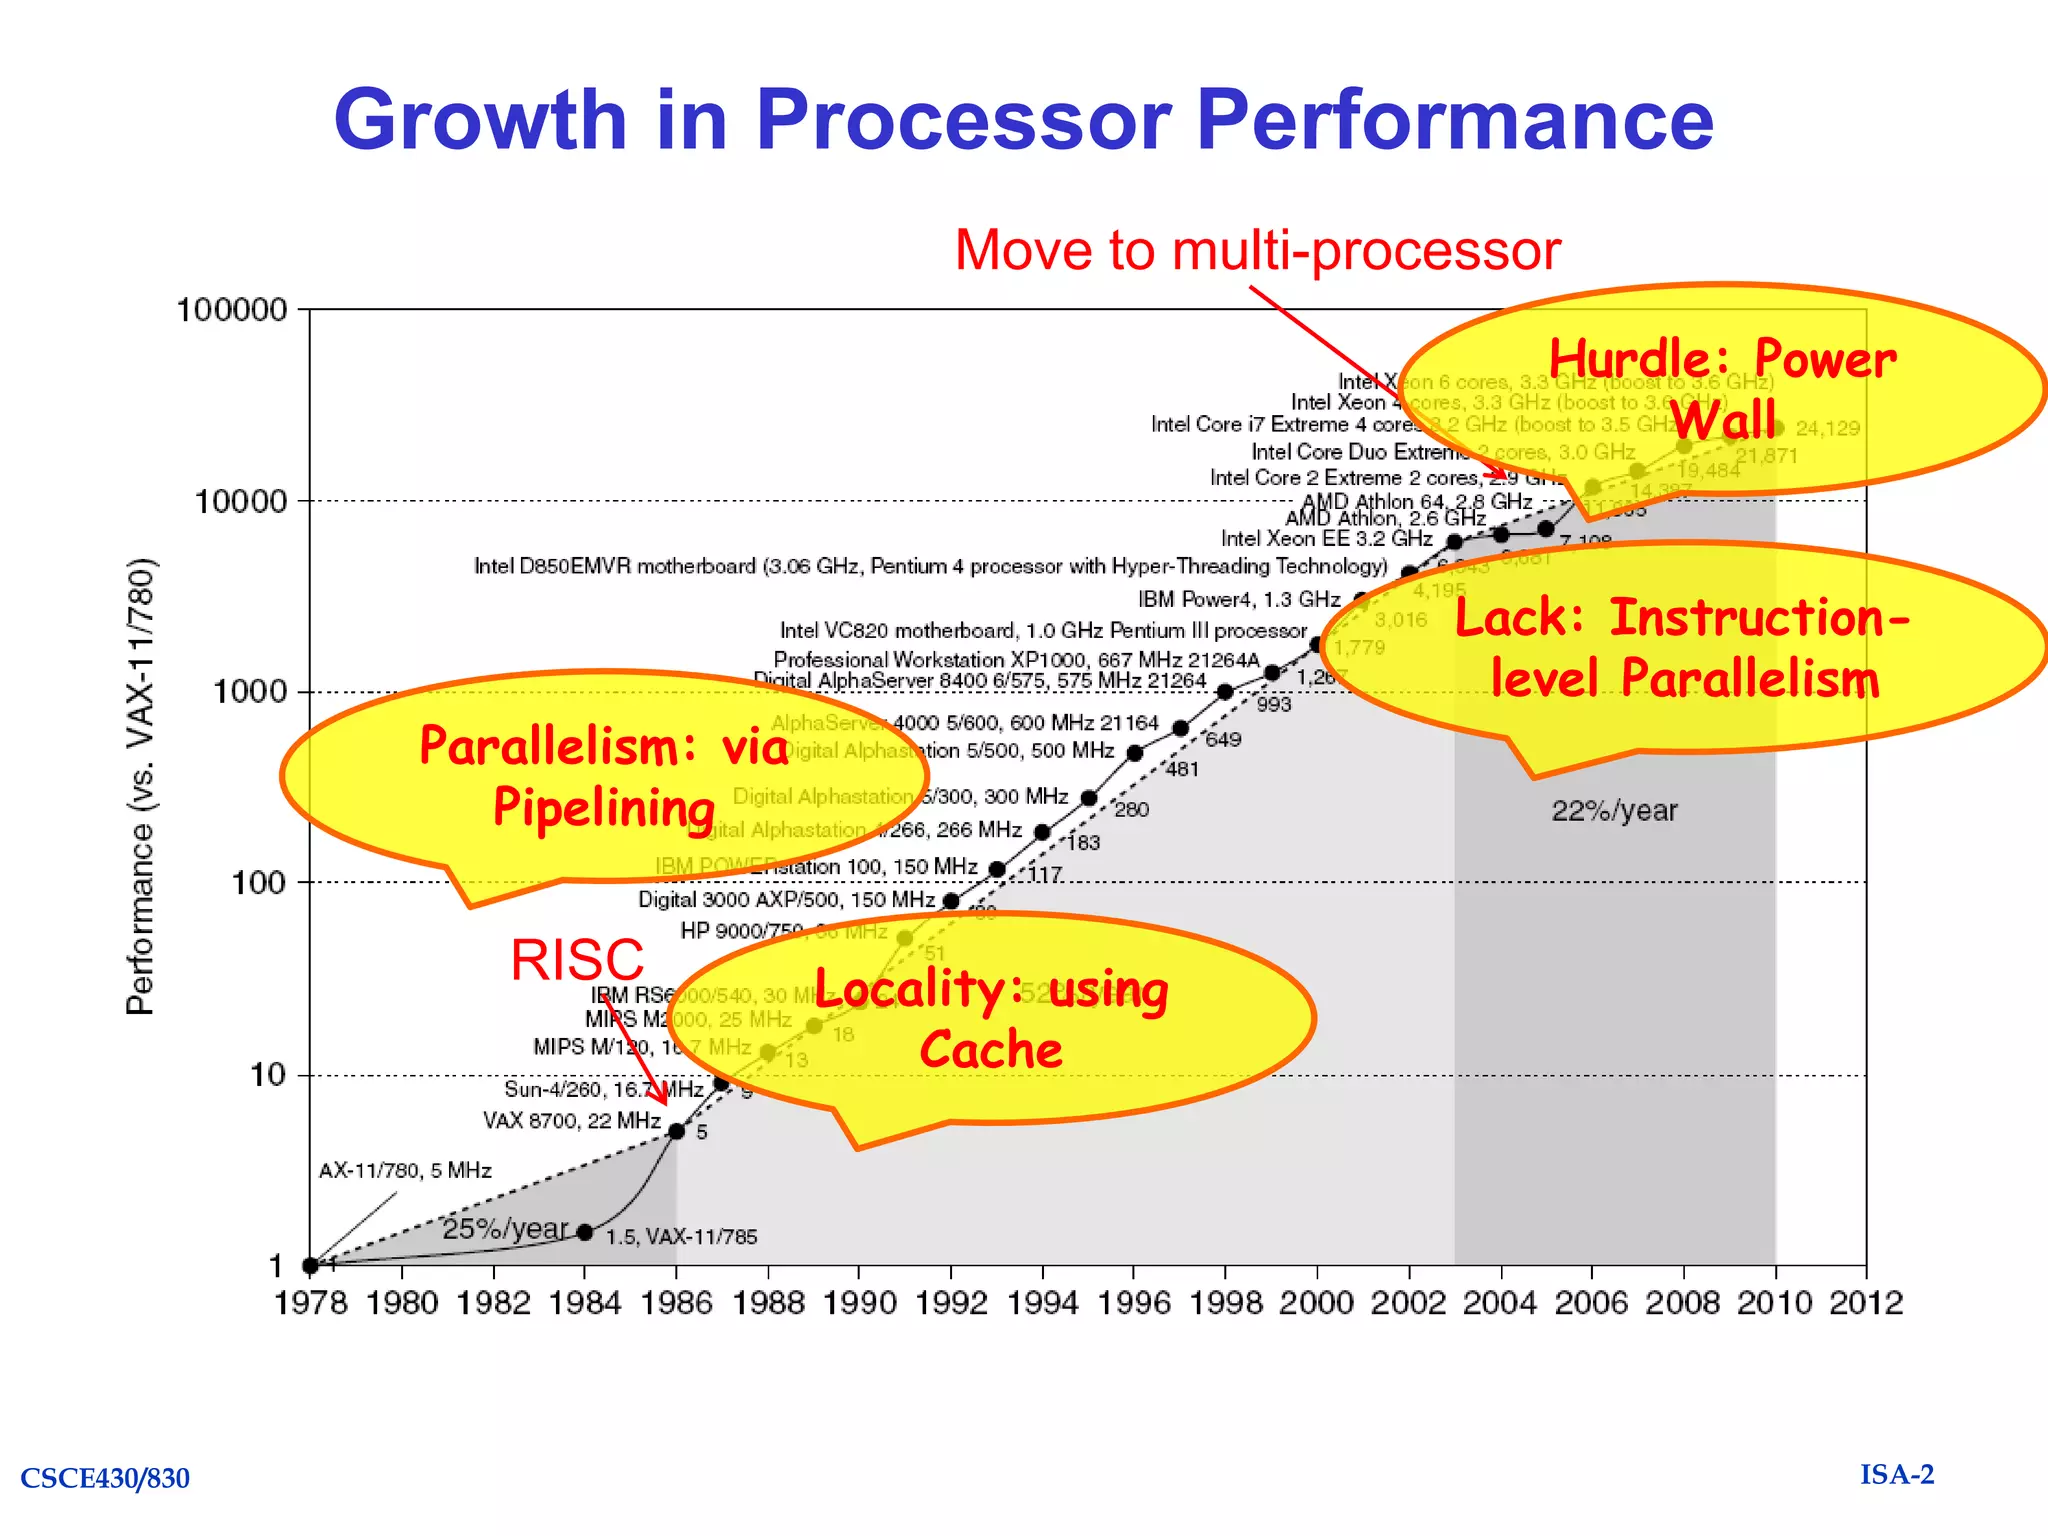
The document summarizes key topics from Chapter 1 of the textbook "Computer Architecture: A Quantitative Approach, Fifth Edition". It discusses improvements in computer performance and applications driven by advances in semiconductor technology and computer architecture. It also covers trends in different classes of computers, parallelism, Flynn's taxonomy of instruction-level parallelism, and quantitative metrics for measuring computer performance and dependability.


![Coded Agents – with UiPath SDK + LangGraph [Virtual Hands-on Workshop]](https://cdn.slidesharecdn.com/ss_thumbnails/codedagentsdeck-251215155422-5497c599-thumbnail.jpg?width=640&height=640&fit=bounds)


