More Related Content
Similar to Allen TX - November 2010 - Housing Market Report
Similar to Allen TX - November 2010 - Housing Market Report (14)
More from Valarie Littles
More from Valarie Littles (16)
Allen TX - November 2010 - Housing Market Report
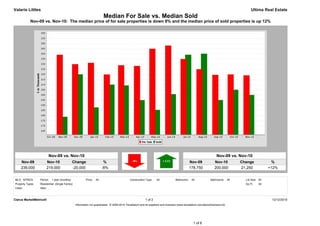
- 1. Valarie Littles Ultima Real Estate
Median For Sale vs. Median Sold
Nov-09 vs. Nov-10: The median price of for sale properties is down 8% and the median price of sold properties is up 12%
Nov-09 vs. Nov-10 Nov-09 vs. Nov-10
Nov-09 Nov-10 Change % Nov-09 Nov-10 Change %
239,000 219,000 -20,000 -8% 178,750 200,000 21,250 +12%
MLS: NTREIS Period: 1 year (monthly) Price: All Construction Type: All Bedrooms: All Bathrooms: All Lot Size: All
Property Types: Residential: (Single Family) Sq Ft: All
Cities: Allen
Clarus MarketMetrics® 1 of 2 12/12/2010
Information not guaranteed. © 2009-2010 Terradatum and its suppliers and licensors (www.terradatum.com/about/licensors.td).
1 of 6
- 2. Valarie Littles Ultima Real Estate
Median For Sale vs. Median Sold
Nov-09 vs. Nov-10: The median price of for sale properties is down 8% and the median price of sold properties is up 12%
For Sale # Properties Sold # Properties Price
Time Period Median For Sale Median Sold Difference
Nov-10 219,000 629 200,000 63 -19,000
Oct-10 219,900 668 205,000 73 -14,900
Sep-10 219,500 671 195,000 71 -24,500
Aug-10 224,950 692 240,000 104 15,050
Jul-10 234,900 677 239,000 96 4,100
Jun-10 248,000 649 200,750 132 -47,250
May-10 244,900 610 185,500 150 -59,400
Apr-10 228,200 680 194,900 163 -33,300
Mar-10 228,900 651 209,200 124 -19,700
Feb-10 219,900 557 210,000 76 -9,900
Jan-10 231,200 506 187,900 59 -43,300
Dec-09 229,900 492 220,000 64 -9,900
Nov-09 239,000 491 178,750 82 -60,250
Clarus MarketMetrics® 2 of 2 12/12/2010
Information not guaranteed. © 2009-2010 Terradatum and its suppliers and licensors (www.terradatum.com/about/licensors.td).
2 of 6
- 3. Valarie Littles Ultima Real Estate
Supply & Demand by Month
Nov-09 vs. Nov-10: The number of for sale properties is up 28% and the number of sold properties is down 23%
Nov-09 vs. Nov-10 Nov-09 vs. Nov-10
Nov-09 Nov-10 Change % Nov-09 Nov-10 Change %
491 629 138 +28% 82 63 -19 -23%
MLS: NTREIS Period: 1 year (monthly) Price: All Construction Type: All Bedrooms: All Bathrooms: All Lot Size: All
Property Types: Residential: (Single Family) Sq Ft: All
Cities: Allen
Clarus MarketMetrics® 1 of 2 12/12/2010
Information not guaranteed. © 2009-2010 Terradatum and its suppliers and licensors (www.terradatum.com/about/licensors.td).
3 of 6
- 4. Valarie Littles Ultima Real Estate
Supply & Demand by Month
Nov-09 vs. Nov-10: The number of for sale properties is up 28% and the number of sold properties is down 23%
# Properties Average DOM # Properties Average DOM
Time Period For Sale For Sale Sold Sold
Nov-10 629 111 63 78
Oct-10 668 121 73 57
Sep-10 671 132 71 60
Aug-10 692 137 104 65
Jul-10 677 140 96 62
Jun-10 649 143 132 58
May-10 610 149 150 61
Apr-10 680 136 163 63
Mar-10 651 138 124 68
Feb-10 557 147 76 75
Jan-10 506 159 59 65
Dec-09 492 165 64 68
Nov-09 491 168 82 55
Clarus MarketMetrics® 2 of 2 12/12/2010
Information not guaranteed. © 2009-2010 Terradatum and its suppliers and licensors (www.terradatum.com/about/licensors.td).
4 of 6
- 5. Valarie Littles Ultima Real Estate
Months Supply of Inventory
Nov-09 vs. Nov-10: The average months supply of inventory is down 15%
Nov-09 vs. Nov-10
Nov-09 Nov-10 Change %
6.6 5.6 -1.0 -15%
MLS: NTREIS Period: 1 year (monthly) Price: All Construction Type: All Bedrooms: All Bathrooms: All Lot Size: All
Property Types: Residential: (Single Family) Sq Ft: All
Cities: Allen
Clarus MarketMetrics® 1 of 2 12/12/2010
Information not guaranteed. © 2009-2010 Terradatum and its suppliers and licensors (www.terradatum.com/about/licensors.td).
5 of 6
- 6. Valarie Littles Ultima Real Estate
Months Supply of Inventory
Nov-09 vs. Nov-10: The average months supply of inventory is down 15%
# Units For Sale # UC Units UC Average
Time Period Last Day of Month During Month MSI DOM
Nov-10 466 83 5.6 85
Oct-10 508 81 6.3 65
Sep-10 526 66 8.0 66
Aug-10 538 86 6.3 66
Jul-10 521 98 5.3 62
Jun-10 495 109 4.5 57
May-10 467 78 6.0 62
Apr-10 445 184 2.4 58
Mar-10 436 177 2.5 64
Feb-10 420 106 4.0 63
Jan-10 383 87 4.4 77
Dec-09 368 61 6.0 54
Nov-09 389 59 6.6 77
Clarus MarketMetrics® 2 of 2 12/12/2010
Information not guaranteed. © 2009-2010 Terradatum and its suppliers and licensors (www.terradatum.com/about/licensors.td).
6 of 6