SlideShare a Scribd company logo
1 of 15
Download to read offline
1QFY2012 Result Update | IT
                                                                                                                              July 18, 2011


 Persistent Systems                                                                           ACCUMULATE
                                                                                              CMP                                      `373
 Performance highlights                                                                       Target Price                             `424
Y/E March (` cr)           1QFY12       4QFY11      % chg (qoq)     1QFY11     % chg (yoy)    Investment Period               12 Months
Net revenue                    224         213               5.2        181          23.6
EBITDA                            40        38               5.3          34         16.6
                                                                                             Stock Info
EBITDA margin (%)             17.9         17.9              3bp       19.0       (108)bp
                                                                                             Sector                                        IT
PAT                               28        33           (16.8)           35        (20.2)
                                                                                             Market Cap (` cr)                          1,490
Source: Company, Angel Research
                                                                                             Beta                                         0.7
For 1QFY2012, Persistent Systems (Persistent) reported numbers that were almost              52 Week High / Low                       504/337
in-line with the expectations on the revenue front, though its performance was
                                                                                             Avg. Daily Volume                        35,272
marginally disappointing on the operating front. Management has maintained its
                                                                                             Face Value (`)                               10
revenue guidance of US$220mn, i.e. 29% yoy growth for FY2012, and is
confident of maintaining PAT at least flat yoy, despite the surge in tax rates to 31%        BSE Sensex                                18,507
from 7% in FY2011. The company is into pure-play offshore product development                Nifty                                      5,567
(OPD) and has been recording a 6% CQGR since 1QFY2011 on the back of                         Reuters Code                             PERS.BO
comeback in R&D spending by product companies. We recommend Accumulate                       Bloomberg Code                           PSYS@IN
on the stock.
Quarterly highlights: For 1QFY2012, Persistent reported revenue of US$50.0mn,
                                                                                             Shareholding Pattern (%)
up 6.3% qoq, led by volume growth coupled with increased billing rates.
                                                                                             Promoters                                  38.9
In rupee terms, revenue came in at `223.8cr, up 5.2% qoq. Despite strong
volume growth, EBITDA margin remained stable qoq at 17.9% because of a                       MF / Banks / Indian Fls                    25.1
decline in IP-led revenue as well as promotions given during the quarter.                    FII / NRIs / OCBs                           6.5
PAT came in at `27.6cr, aided by higher forex gain of `6.4cr as against `2.9cr in            Indian Public / Others                     29.6
4QFY2011 on the back of ITM hedges of US$86.25mn with average contract rate
of 47.39INR/USD.
                                                                                             Abs. (%)                 3m       1yr        3yr
Outlook and valuation: Persistent, due to its niche focus on OPD, is expected to
                                                                                             Sensex                 (3.1)     3.1       35.7
witness a scorching revenue CAGR of 26.3% (in USD) over FY2011–13E,
outperforming tier-I IT companies’ growth. Also, on the back of adequate margin              Persistent             (4.9)    (23.2)           -
                                                                                             Note: Listed on April 6, 2010
levers, the tailwinds mentioned above are expected to overplay the headwinds
such as 1) rupee appreciation and 2) competitive wage hikes in the medium term,
thereby helping the margins to rebound to 18.4% and 19.5% in FY2012 and
FY2013, respectively. At the CMP of `373, the stock is trading at 9.7x FY2013E
EPS of `38.5. We value the stock at 11x FY2013 EPS, i.e. 45% discount to Infosys,
and recommend an Accumulate rating on the stock with a target price of `424.

Key financials (Indian GAAP, Consolidated)
 Y/E March (` cr)                      FY2010      FY2011          FY2012E     FY2013E
 Net sales                               601           776            984         1,195
 % chg                                    1.2         29.1            26.8          21.4
 Net profit                              115           140            137           154
 % chg                                   74.0         21.5            (2.1)         12.7
 EBITDA margin (%)                       24.3         20.4            18.4          19.5
 EPS (`)                                 32.1         34.9            34.2          38.5
                                                                                             Srishti Anand
 P/E (x)                                 11.6         10.7            10.9           9.7     +91 22 39357800 Ext: 6820
 P/BV (x)                                 2.1          2.0             1.7           1.5     srishti.anand@angelbroking.com
 RoE (%)                                 18.0         18.7            15.8          15.4
 RoCE (%)                                17.5         15.5            14.6          16.6     Ankita Somani
 EV/Sales (x)                             1.9          1.5             1.2           0.9     +91 22 39357800 Ext: 6819
 EV/EBITDA (x)                            7.8          7.2             6.4           4.8     ankita.somani@angelbroking.com
Source: Company, Angel Research

Please refer to important disclosures at the end of this report                                                                            1
Persistent | 1QFY2012 Result Update


Exhibit 1: 1QFY2012 performance (Indian GAAP, Consolidated)
 Y/E March (` cr)              1QFY12     4QFY11               % chg (qoq)         1QFY11         % chg (yoy)     FY2011         FY2010       % chg (yoy)
 Net revenue                       224       213                      5.2             181               23.6         776           601                  29.1
 Cost of revenue                   140       133                      5.3             112               25.0         472           337                  40.1
 Gross profit                       83        80                      4.8              69               21.3         304           264                  15.0
 S&M expenses                       18        16                      7.7              14               23.8          62            46                  33.5
 G&A expenses                       26        25                      2.3              20               27.5          83            71                  17.1
 EBITDA                             40        38                      5.3              34               16.6         158           146                   8.2
 Depreciation                       13        12                      6.0              10               29.6          42            34                  26.4
 EBIT                               27        26                      5.0              25               11.4         116           113                   2.7
 Other income                        6         6                                        3                             17             8
 Forex gain/(loss)                   6         3                                        9                             17             3
 PBT                                40        35                     14.9              37                7.9         150           124                  21.2
 Income tax                         12         2                    628.2               3              382.6          11             9                  17.3
 PAT                                28        33                    (16.8)             35              (20.2)        140           115                  21.5
 EPS                                6.9      8.3                    (16.8)            8.6              (19.8)       34.9           32.1                  8.8
 Gross margin (%)                  37.3     37.4                   (11)bp            38.0             (71)bp        39.1           43.9            (478)bp
 EBITDA margin (%)                 17.9     17.9                      3bp            19.0            (108)bp        20.4           24.3            (394)bp
 EBIT margin (%)                   12.3     12.3                     (2)bp           13.6            (134)bp        14.9           18.8            (383)bp
 PAT margin (%)                    11.7     15.0                  (329)bp            17.8            (618)bp        17.2           18.8            (154)bp
 Source: Company, Angel Research


                                              Revenue momentum continues

                                              For 1QFY2012, Persistent reported revenue of US$50.0mn, up 6.3% qoq,
                                              primarily led by volume growth. Also, the company’s billing rates, onsite as well as
                                              offshore, improved by 2.3% and 1.3% qoq to US$13,033 per person per month
                                              (ppm) and US$3,770 ppm, respectively. The improvement in billing rates during
                                              the quarter was due to selling of high-end services like technology consulting,
                                              mobility and analytics.

                                              In rupee terms, revenue came in `223.8cr, up 5.2% qoq – lower growth as against
                                              dollar revenue due to 1.0% qoq INR appreciation against USD in 1QFY2012.

                                              Exhibit 2: Trend in revenue growth (qoq)
                                                          55                                                                                        10

                                                                                                                           8.8                      9
                                                          50
                                                                                                                                      50.0          8

                                                          45                                                          47.0                          7
                                               (US$ mn)


                                                                                                            6.7
                                                                                                                                             6.3
                                                                                                                                                    6
                                                                                                                                                         (%)


                                                                             5.8                       43.2
                                                          40                                                                                        5
                                                                                      40.5
                                                                     39.5
                                                                                                                                                    4
                                                          35
                                                                                                                                                    3
                                                                                            2.6
                                                          30                                                                                        2
                                                                    1QFY11           2QFY11          3QFY11         4QFY11          1QFY12
                                                                                      Revenue (US$mn)             qoq growth (%)

                                               Source: Company, Angel Research


July 18, 2011                                                                                                                                             2
Persistent | 1QFY2012 Result Update


                Exhibit 3: Trend in billing rates (qoq)
                            14,000                             12,896       12,746         13,033
                                     12,414      12,470
                            12,000

                            10,000


                (US$/ppm)
                             8,000

                             6,000
                                         3,600       3,601          3,661       3,723          3,770
                             4,000

                             2,000

                                -
                                      1QFY11      2QFY11         3QFY11      4QFY11         1QFY12
                                                      Onsite     Offshore


                Source: Company, Angel Research

                Industry wise, the company’s growth was led by the telecom and wireless segment
                (contributing 22.2% to revenue), which grew by 15.1% qoq, majorly led by
                European clients. The anchor industry segment – infrastructure and systems
                (contributed 67.9% to revenue) – continued its revenue traction and grew by 5.7%
                qoq. In absolute terms, revenue contribution from the lifesciences and healthcare
                segment stood modest; however, on a qoq basis, revenue declined by 6.0% due to
                base effect, as higher growth was reported in this segment in 2HFY2011.

                Exhibit 4: Growth trend in industry segments
                                                             % to revenue   % chg (qoq)      % chg (yoy)
                Infrastructure and systems                          67.9             5.7            19.9
                Telecom and wireless                                22.2          15.1              51.9
                Lifesciences and healthcare                          9.9          (6.0)             27.9
                Source: Company, Angel Research

                Geography wise, growth was led by Europe, revenue from which grew by 35.7%
                qoq – whopping growth due to low base effect and ramp-up in revenue from few
                European clients. North America continued to grow during this quarter as well
                at 2.0% qoq.

                Exhibit 5: Growth trend in geographies
                                                             % to revenue   % chg (qoq)      % chg (yoy)
                North America                                       82.8             2.0            23.2
                Europe                                               7.4          35.7              44.1
                Asia-Pacific                                         9.8          31.9              47.7
                Source: Company, Angel Research


                Revenue contribution from IP-led services declined in 1QFY2012 to 6.1% from
                10.3% in 4QFY2012 because of lower revenue from the company’s top customer
                that contributes almost 60% to the company’s IP-led revenue. Management has
                indicated that it is a one-time issue and revenue from the top customer is expected
                to scale up again in the coming quarters. IP-led revenue seems low also because
                of higher base in 4QFY2011, which was due to higher product sale from the top
                customer’s end in 3QFY2011, the royalty revenue of which got reflected in


July 18, 2011                                                                                          3
Persistent | 1QFY2012 Result Update


                Persistent’s account in 4QFY2011. The company expects IP-led revenue to touch
                US$25mn by the end of FY2012, i.e. whopping 68% yoy growth.

                Hiring and utilisation

                Persistent continued its modest hiring trend and added 260 net employees during
                the quarter. Gross addition during the quarter was 545. In the technical employee
                base of the company, 228 net employees were added. Attrition rate (LTM basis)
                declined significantly in 1QFY2012 to 18.4% from 19.6% in 4QFY2011, as the
                company gave wage hikes in 4QFY2011 to control attrition and, as a result,
                quarterly attrition rate in 1QFY2012 stood merely at 3.2% (quarterly annualised at
                12.8%), leading to an overall decline in attrition rates on an LTM basis.

                Exhibit 6: Employee metrics
                Particulars                       1QFY11     2QFY11          3QFY11     4QFY11     1QFY12
                Technical                          4,554       4,907          5,070      5,950          6,178
                Sales                                 79           87            94        108           119
                Rest                                 278          287           296        302           323
                Total                              4,911       5,281          5,460      6,360          6,620
                Net addition                         249          370           179        900           260
                Attrition – LTM (%)                 16.3         18.6          21.5       19.6           18.4
                Source: Company, Angel Research


                For FY2012, management has a gross hiring target of 2,300 employees (1,000
                freshers and 1,200–1,300 laterals) and a net hiring target of ~1,500 employees.

                Net utilisation (excluding resources in IP-led work) increased by 170bp qoq to
                72.7%. However, in 2QFY2012, we expect utilisation to dip due to intake of
                freshers into the system. Management expects utilisation to inch up and reach
                75–77% over the next 3–4 quarters.

                Exhibit 7: Utilisation trend
                       80
                                78.5

                       78

                       76
                                                                74.2
                (%)


                       74                                                                        72.7
                                              71.7
                       72                                                        71.0

                       70

                       68
                               1QFY11        2QFY11          3QFY11             4QFY11       1QFY12

                                                           Utilisation (%)

                Source: Company, Angel Research


July 18, 2011                                                                                               4
Persistent | 1QFY2012 Result Update


                Margin profile

                In 1QFY2012, the company’s EBITDA and EBIT margins remained almost stable
                qoq at 17.9% and 12.3%, respectively, despite higher revenue growth due to
                higher costs incurred on account of promotions given in 1QFY2012 and drop in
                IP-led revenue.

                Going ahead, for 2QFY2012, the company has announced wage hikes — 7–8%
                for offshore employees and 4% for onsite employees, effective from July 1, 2011.
                This is expected to negatively affect the company’s operating margins by
                200–220bp qoq in the next quarter. However, for the full year, the company
                expects margins to remain stable at FY2011 levels.

                Exhibit 8: Margin profile
                      45
                      40
                                                42.2
                      35       38.0                          39.1
                                                                               37.4             37.3
                      30
                                                23.0         21.9
                      25
                (%)


                               19.0                                            17.9             17.9
                      20
                      15                        17.6         16.5
                      10       13.6
                                                                               12.3             12.3
                      5
                              1QFY11          2QFY11       3QFY11          4QFY11              1QFY12

                                      Gross margin       EBITDA margin           EBIT margin

                Source: Company, Angel Research


                Client pyramid

                The client metrics of the company saw a qualitative movement with six new clients
                in the US$1mn–3mn revenue bracket. Also, four clients were added in the
                <US$1mn revenue bracket.

                In 1QFY2012, Persistent added 32 new clients, out of which eight were from the
                company’s partners. The total active client base of the company increased to 239
                from 229 in 4QFY2011.

                Exhibit 9: Client metrics
                Particulars              1QFY11        2QFY11       3QFY11            4QFY11      1QFY12
                Customers billed              196         201            207             229            239
                <US$1mn                       165         171            169             194            198
                US$1mn-3mn                     22          21             29              26             32
                >US$3mn                           9         9             9                9             9
                Source: Company, Angel Research


July 18, 2011                                                                                             5
Persistent | 1QFY2012 Result Update


                Investment rationale
                Established footprint in the resurging OPD market

                Persistent has a dominant market share of ~16% (in CY2010) in the Indian OPD
                market. The company is witnessing a robust uptick in the deal pipeline as clients
                are flocking to generate new products in shorter time to market to capture market
                share. This is driving many ISVs and wireless equipment manufacturers to spend
                on R&D and engineering services. As per IDC, out of the global size of US$40bn in
                2010 for R&D and product engineering, the Indian OPD market is just
                worth ~US$1bn. The global OPD market is expected to grow at a 14% CAGR to
                US$65.7bn by 2014. The offshore segment of the global OPD market in
                2010 crossed the US$10bn mark and is expected to grow at a 19% CAGR to
                US$16bn by 2014.

                Exhibit 10: Worldwide R&D/PES spending (US$ mn)
                          70,000                                                                                25


                          60,000                                                                    18.2   19.1 20
                                             17.9                                         16.3
                          50,000                                                 13.2                           15
                    (US$ mn)


                                                                                                                     (%)
                                                    9.7       10.2
                          40,000                                                                                10


                          30,000                                                                                5
                                                                          3.9

                          20,000                                                                                0
                                        CY2006 CY2007 CY2008 CY2009 CY2010 CY2011 CY2012 CY2013

                                                    IT spending (US$ mn)           yoy growth (%)

                    Source: IDC, Angel Research
                 

                Exhibit 11: Worldwide R&D/PES offshore spending (US$ mn)
                               18,000                                                                      23.5 25
                                                                                                    21.7
                               16,000                                                     19.4
                                                                                                               20
                               14,000        17.9
                                                                                                               15
                    (US$ mn)


                               12,000                                            11.8
                                                                                                                     (%)


                                                    9.7
                               10,000                                                                          10
                                8,000
                                                                                                                5
                                6,000                                      3.9
                                                                 3.8
                                4,000                                                                           0
                                        CY2006 CY2007 CY2008 CY2009 CY2010 CY2011 CY2012 CY2013

                                                          IT spending (US$ mn)          yoy growth (%)

                    Source: IDC, Angel Research


July 18, 2011                                                                                                         6
Persistent | 1QFY2012 Result Update


                Non-linear services already a sizeable part of the portfolio

                Persistent has a sizeable portfolio coming in from IP-led revenue, which was ~9%
                in FY2011. The company expects it to scale up to ~11% in FY2012 and reach
                ~20% by FY2015. The company has been investing in the areas of 1) cloud,
                2) analytics, 3) collaboration and 4) mobility, which are towards consulting. With
                the expected increase in contribution from IP revenue, the company is likely to
                benefit at the margin front because of its non-linear nature.

                Exhibit 12: IP-led revenue as a % of total revenue
                      12                                                                             11.4
                      11
                                                                                      10.2
                      10
                                                                   8.8
                      9
                      8
                (%)


                                                 7.2
                      7
                      6        5.2
                      5
                      4
                            FY2009         FY2010              FY2011           FY2012E             FY2013E
                                                  IP driven revenue (as % of sales)

                Source: Company, Angel Research


                Marquee clientele

                Out of its active clients, 37 have revenue of more than US$1bn and dedicated
                annual R&D budgets of 6–20% of revenue to drive product innovation.
                The company has marquee clients (with R&D budgets) including MNCs like IBM
                (~6.0%), Google (~12.8%), Microsoft (~13.9%), Oracle (~12.8%), Intel
                (~15.1%), Cisco (~13.2%), Nokia (~14%), Samsung, Yahoo (~17%) and eBay.
                In addition, the company’s client mining is strong as the company manages to get
                ~11% of its revenue from new clients vis-à-vis peers who get mere 3–5%.

                Exhibit 13: Revenue (CY2010/FY2010) and R&D budget as a % of sales
                  120
                                                                                                      99.9
                  100

                      80
                           62.5
                      60
                                       43.6             40.0
                      40                                                                29.3

                      20       13.9        15.1             13.2            13.8             12.8
                                                                         12.5                               6.0
                      0
                           Microsoft     Intel            Cisco           SAP            Google         IBM
                                           Revenue (US$ mn)          R&D as % of sales

                Source: Company, Angel Research


July 18, 2011                                                                                                     7
Persistent | 1QFY2012 Result Update


                Robust revenue growth with gradual improvement in margins

                Persistent is expected to report a robust revenue CAGR of 26.3% over FY2011–13E
                on the back of return in demand for OPD services. In fact the company has
                indicated net hiring to be 1,500 plus for FY2012E on the back of a strong deal
                pipeline. On the operating front, we expect margins to rebound in 2HFY2012 from
                17.9% in 1QFY2012 to 18.4% in FY2012 and 19.5% in FY2013. We expect this
                margin improvement because of margin levers such as 1) employee pyramid
                rationalisation (indicated to hire 700 freshers out of 1,500 net people in FY2012);
                2) higher revenue productivity due to the expected increase in IP-led revenue
                contribution; 3) gradual increase in utilisations to 74.7% in FY2013 from 72% in
                1QFY2012 and 4) stable G&A in absolute terms even with higher growth.
                On the PAT front, we expect factors like 1) improvement in profitability and 2) forex
                gains due to In-the-Money (with average contract rate of 47.39INR/USD) hedges
                worth US$86.25mn to counter the headwinds due to higher tax rate of 31%
                compared to 7% in FY2011.

                Exhibit 14: Revenue expectations
                           300


                           250                                28.8%                       271.7
                                                              CAGR

                           200                                                 221.4
                (US$ mn)


                           150                                   170.2

                                   127.9          127.3
                           100


                            50
                                  FY2009      FY2010            FY2011        FY2012E   FY2013E

                                                      Revenue (US$ mn)

                Source: Company, Angel Research


                Exhibit 15: Margin expectations
                           31     30.1

                           29

                           27
                                              24.3
                           25
                (%)


                           23
                                                                20.4
                           21                                                             19.5
                                                                               18.4
                           19

                           17
                                 FY2009     FY2010             FY2011         FY2012E   FY2013E

                                                          EBITDA margin (%)

                Source: Company, Angel Research


July 18, 2011                                                                                      8
Persistent | 1QFY2012 Result Update


                Outlook and valuation

                Persistent, due to its niche focus on OPD, is expected to record a scorching
                revenue CAGR of 26.3% (in USD) over FY2011–13E, outperforming tier-I IT
                companies’ growth. Also, on the back of adequate margin levers, the tailwinds
                mentioned above are expected to overplay the headwinds such as 1) rupee
                appreciation and 2) competitive wage hikes in the medium term and help the
                margins to rebound to 18.4% and 19.5% in FY2012 and FY2013, respectively.
                At the CMP of `373, the stock is trading at 9.7x FY2013E EPS of `38.5. We value
                the stock at 11x FY2013 EPS, i.e. 45% discount to Infosys, and recommend an
                Accumulate rating on the stock with a target price of `424.

                Exhibit 16: Key assumptions
                                                                                                                              FY2012                           FY2013
                Revenue growth – USD terms (%)                                                                                      30.1                              22.7
                USD-INR rate                                                                                                        44.5                              44.0
                Revenue growth – INR terms (%)                                                                                      26.8                              21.4
                EBITDA margin (%)                                                                                                   18.4                              19.5
                Tax rate (%)                                                                                                        31.0                              31.0
                EPS growth (%)                                                                                                      (2.0)                             12.7
                Source: Company, Angel Research


                Exhibit 17: One-year forward PE(x) chart
                       700

                       600

                       500
                (` )


                       400

                       300

                       200
                                                                                                       Dec-10
                             Apr-10


                                                        Jul-10

                                                                 Aug-10


                                                                                                                                           Apr-11


                                                                                                                                                                      Jul-11
                                                                                                                                  Mar-11
                                                                                    Oct-10
                                                                           Sep-10


                                                                                              Nov-10


                                                                                                                         Feb-11
                                      May-10


                                                                                                                                                    May-11
                                               Jun-10


                                                                                                                                                             Jun-11
                                                                                                                Jan-11


                                                  Price                   16                 14                 12                   10                  8

                Source: Company, Angel Research


July 18, 2011                                                                                                                                                                  9
Persistent | 1QFY2012 Result Update


Exhibit 18: Recommendation summary
Company             Reco           CMP Tgt. price   Upside   FY2013E     FY2013E    FY2011-13E     FY2013E    FY2013E
                                     (`)      (`)      (%)    P/BV (x)     P/E (x) EPS CAGR (%)    RoCE (%)    RoE (%)
3iInfotech          Neutral         44          -        -        0.6        3.8          (4.3)       12.0       15.1
Educomp             Buy            387       522     34.8         1.3        7.5          17.7        16.4       17.0
Everonn             Accumulate     539       602     11.7         2.6       12.8          27.7        15.5       16.7
HCL Tech            Buy            504       591     17.3         3.2       11.9          30.8        18.9       26.9
Infosys             Buy           2,714    3,200     17.9         3.9       17.0          15.7        24.7       22.7
Infotech Enterprises Neutral       138          -        -        1.1        8.6          13.0        15.0       13.2
KPIT Cummins        Accumulate     182       208     14.3         1.7       10.8          21.9        21.8       17.7
Mphasis             Accumulate     436       499     14.4         1.6        9.8            9.2       16.8       16.8
NIIT                Buy             55        68     24.3         1.3        7.9          10.9        12.4       16.6
Persistent          Accumulate     373       424     13.8         1.5        9.7            5.1       16.6       15.4
TCS                 Buy           1,125    1,368     21.6         5.7       18.1          18.4        30.2       31.3
Tech Mahindra       Accumulate     741       790       6.6        2.1       13.1            6.8       14.9       15.6
Wipro               Buy            413       483     17.0         3.1       14.5          14.5        16.3       21.5
Source: Company, Angel Research


July 18, 2011                                                                                                      10
Persistent | 1QFY2012 Result Update


                Profit and loss statement (Indian GAAP, Consolidated)
                Y/E March (` cr)              FY2010     FY2011    FY2012E     FY2013E
                Net sales                        601       776          984      1,195
                Direct costs                     337       472          626       759
                % of net sales                  56.1       60.9         63.6      63.5
                Gross profit                     264       304          358       436
                % of net sales                  43.9       39.1         36.4      36.5
                S&M expenses                      46        62           78        95
                % of net sales                    7.7       8.0          8.0       8.0
                G&A expenses                      71        83           98       108
                % of net sales                  11.9       10.8         10.0       9.0
                EBITDA                           146       158          181       233
                % of net sales                  24.3       20.4         18.4      19.5
                Depreciation                      34        42           54        66
                EBIT                             113       116          127       168
                Other income                       8        17           45        42
                Forex gain/(loss)                  3        17           26        14
                Profit before tax                124       150          198       224
                Provision for tax                  9        11           62        69
                % of PBT                          7.3       7.1         31.0      31.0
                PAT                              115       140          137       154
                Extraordinary expenses              -         -            -         -
                Final PAT                        115       140          137       154
                EPS (`)                         32.1       34.9         34.2      38.5


July 18, 2011                                                                      11
Persistent | 1QFY2012 Result Update


                Balance sheet (Indian GAAP, Consolidated)
                Y/E March (` cr)                       FY2010   FY2011    FY2012E   FY2013E
                Liabilities
                Share capital                             40        40        40        40
                ESOP outstanding                           3         3         4         4
                Reserves and surplus                     580       696       816       954
                Hedge reserves                            16         8         7         7
                Total shareholders' funds                639       747       867      1,005
                Deferred payment liability                 5         3         3         3
                Total liabilities                        644       750       870      1,008
                Assets
                Gross block - fixed assets               371       454       654       804
                Accumulated depreciation                 188       228       282       348
                Net block                                183       226       372       456
                Capital work-in-progress                  48        60        67        59
                Total fixed assets                       232       287       439       515
                Investments                              156       250       250       250
                Deferred tax assets, net                   1         6         6          -
                Current assets
                Sundry debtors                           136       158       183       223
                Cash and bank balance                    192       100        75       128
                Other current assets                      34        23        25        30
                Loans and advances                        72        87       110       131
                Less: - Current liab. and provisions
                Current liabilities                      148       121       172       208
                Provisions                                32        40        47        62
                Net current assets                       255       207       174       242
                Total assets                             644       750       870      1,008


July 18, 2011                                                                           12
Persistent | 1QFY2012 Result Update


                Cash flow statement (Indian GAAP, Consolidated)
                Y/E March (` cr)                       FY2010    FY2011   FY2012E   FY2013E
                Pre tax profit from operations            113      116       127       168
                Depreciation                               34       42        54        66
                Pre tax cash from operations              146      158       181       233
                Other income/prior period ad               11       34        71        56
                Net cash from operations                  158      193       253       289
                Tax                                         9       11        62        69
                Cash profits                              149      182       191       220
                (Inc)/dec in
                Current assets                            (81)     (25)      (51)      (65)
                Current liabilities                        88      (19)       59        51
                Net trade working capital                   7      (44)        8       (14)
                Cashflow from operating activities        156      138       199       206
                (Inc)/dec in fixed assets                 (48)     (97)     (207)     (142)
                (Inc)/dec in investments                  (68)     (94)        0          -
                (Inc)/dec in deferred tax assets            1       (5)       (0)        6
                Inc/(dec) in deferred payment liab.         5       (2)       (0)         -
                Cashflow from investing activities       (110)    (198)     (207)     (136)
                Inc/(dec) in debt                            -        -         -         -
                Inc/(dec) in equity/premium               132       (6)       (1)         -
                Dividends                                  (2)     (26)      (16)      (16)
                Cashflow from financing activities        129      (32)      (17)      (16)
                Cash generated/(utilised)                 175      (92)      (25)       54
                Cash at start of the year                  17      192       100        75
                Cash at end of the year                   192      100        75       128


July 18, 2011                                                                           13
Persistent | 1QFY2012 Result Update


                Key ratios
                Y/E March                             FY2010   FY2011    FY2012E   FY2013E
                Valuation ratio (x)
                P/E (on FDEPS)                          11.6      10.7      10.9       9.7
                P/CEPS                                   9.0       8.2       7.8       6.8
                P/BVPS                                   2.1       2.0       1.7       1.5
                Dividend yield (%)                       0.1       1.5       0.9       0.9
                EV/Sales                                 1.9       1.5       1.2       0.9
                EV/EBITDA                                7.8       7.2       6.4       4.8
                EV/Total assets                          1.8       1.5       1.3       1.1
                Per share data (`)
                EPS                                     32.1      34.9      34.2      38.5
                Cash EPS                                41.4      45.5      47.8      55.0
                Dividend                                 0.6       5.5       3.5       3.5
                Book value                             178.1     186.8     216.7     251.1
                Dupont analysis
                Tax retention ratio (PAT/PBT)            0.9       0.9       0.7       0.7
                Cost of debt (PBT/EBIT)                  1.1       1.3       1.6       1.3
                EBIT margin (EBIT/Sales)                 0.2       0.1       0.1       0.1
                Asset turnover ratio (Sales/Assets)      0.9       1.0       1.1       1.2
                Leverage ratio (Assets/Equity)           1.0       1.0       1.0       1.0
                Operating ROE                           18.0      18.7      15.8      15.4
                Return ratios (%)
                RoCE (pre-tax)                          17.5      15.5      14.6      16.6
                Angel RoIC                              45.7      34.1      26.6      29.4
                RoE                                     18.0      18.7      15.8      15.4
                Turnover ratios (x)
                Asset turnover (fixed assets)            2.7       3.0       2.7       2.5
                Receivables days                         73        69        68        68
                Payable days                            120       104       100       100


July 18, 2011                                                                          14
Persistent | 1QFY2012 Result Update


  Research Team Tel: 022 - 3935 7800                E-mail: research@angelbroking.com                    Website: www.angelbroking.com

  DISCLAIMER

  This document is solely for the personal information of the recipient, and must not be singularly used as the basis of any investment
  decision. Nothing in this document should be construed as investment or financial advice. Each recipient of this document should make
  such investigations as they deem necessary to arrive at an independent evaluation of an investment in the securities of the companies
  referred to in this document (including the merits and risks involved), and should consult their own advisors to determine the merits and
  risks of such an investment.

  Angel Broking Limited, its affiliates, directors, its proprietary trading and investment businesses may, from time to time, make
  investment decisions that are inconsistent with or contradictory to the recommendations expressed herein. The views contained in this
  document are those of the analyst, and the company may or may not subscribe to all the views expressed within.

  Reports based on technical and derivative analysis center on studying charts of a stock's price movement, outstanding positions and
  trading volume, as opposed to focusing on a company's fundamentals and, as such, may not match with a report on a company's
  fundamentals.

  The information in this document has been printed on the basis of publicly available information, internal data and other reliable
  sources believed to be true, but we do not represent that it is accurate or complete and it should not be relied on as such, as this
  document is for general guidance only. Angel Broking Limited or any of its affiliates/ group companies shall not be in any way
  responsible for any loss or damage that may arise to any person from any inadvertent error in the information contained in this report.
  Angel Broking Limited has not independently verified all the information contained within this document. Accordingly, we cannot testify,
  nor make any representation or warranty, express or implied, to the accuracy, contents or data contained within this document. While
  Angel Broking Limited endeavours to update on a reasonable basis the information discussed in this material, there may be regulatory,
  compliance, or other reasons that prevent us from doing so.

  This document is being supplied to you solely for your information, and its contents, information or data may not be reproduced,
  redistributed or passed on, directly or indirectly.

  Angel Broking Limited and its affiliates may seek to provide or have engaged in providing corporate finance, investment banking or
  other advisory services in a merger or specific transaction to the companies referred to in this report, as on the date of this report or in
  the past.

  Neither Angel Broking Limited, nor its directors, employees or affiliates shall be liable for any loss or damage that may arise from or in
  connection with the use of this information.

  Note: Please refer to the important `Stock Holding Disclosure' report on the Angel website (Research Section). Also, please
  refer to the latest update on respective stocks for the disclosure status in respect of those stocks. Angel Broking Limited and
  its affiliates may have investment positions in the stocks recommended in this report.


  Disclosure of Interest Statement                                                Persistent
  1. Analyst ownership of the stock                                                  No
  2. Angel and its Group companies ownership of the stock                            No
  3. Angel and its Group companies' Directors ownership of the stock                 No
  4. Broking relationship with company covered                                       No


  Note: We have not considered any Exposure below `1 lakh for Angel, its Group companies and Directors


  Ratings (Returns):              Buy (> 15%)                      Accumulate (5% to 15%)                 Neutral (-5 to 5%)
                                  Reduce (-5% to 15%)              Sell (< -15%)


July 18, 2011                                                                                                                              15

More Related Content

What's hot (17)

Gammon india ru4 qfy2010-190510
Gammon india ru4 qfy2010-190510Gammon india ru4 qfy2010-190510
Gammon india ru4 qfy2010-190510
 
JK Tyre
JK TyreJK Tyre
JK Tyre
 
Exide
Exide Exide
Exide
 
Rallis
RallisRallis
Rallis
 
Greenply
Greenply Greenply
Greenply
 
Graphite India
Graphite IndiaGraphite India
Graphite India
 
Hcl tech 1 qfy2011-211010
Hcl tech  1 qfy2011-211010Hcl tech  1 qfy2011-211010
Hcl tech 1 qfy2011-211010
 
Bharat Forge
Bharat ForgeBharat Forge
Bharat Forge
 
Tcs Result Update
Tcs  Result UpdateTcs  Result Update
Tcs Result Update
 
Ashoke Leyland
Ashoke LeylandAshoke Leyland
Ashoke Leyland
 
Punj Lloyd
Punj LloydPunj Lloyd
Punj Lloyd
 
Bhel 020212
Bhel 020212Bhel 020212
Bhel 020212
 
Sintex ru2 qfy2011-121010
Sintex ru2 qfy2011-121010Sintex ru2 qfy2011-121010
Sintex ru2 qfy2011-121010
 
CCCl
CCClCCCl
CCCl
 
Gipcl ru4 qfy2010-260510
Gipcl ru4 qfy2010-260510Gipcl ru4 qfy2010-260510
Gipcl ru4 qfy2010-260510
 
All ru2 qfy2011-201010
All ru2 qfy2011-201010All ru2 qfy2011-201010
All ru2 qfy2011-201010
 
L&T - Result Update RU2QFY2011
L&T - Result Update RU2QFY2011L&T - Result Update RU2QFY2011
L&T - Result Update RU2QFY2011
 

Viewers also liked

Angel top picks 21.05.10
Angel top picks   21.05.10Angel top picks   21.05.10
Angel top picks 21.05.10Angel Broking
 
Axis%20 bank ru1qfy2012-220711
Axis%20 bank ru1qfy2012-220711Axis%20 bank ru1qfy2012-220711
Axis%20 bank ru1qfy2012-220711Angel Broking
 
Electrosteel castings
Electrosteel castingsElectrosteel castings
Electrosteel castingsAngel Broking
 
Market outlook 110612
Market outlook 110612Market outlook 110612
Market outlook 110612Angel Broking
 
Derivative report 19th July 2011
Derivative report 19th July 2011Derivative report 19th July 2011
Derivative report 19th July 2011Angel Broking
 
Designing Teams for Emerging Challenges
Designing Teams for Emerging ChallengesDesigning Teams for Emerging Challenges
Designing Teams for Emerging ChallengesAaron Irizarry
 
UX, ethnography and possibilities: for Libraries, Museums and Archives
UX, ethnography and possibilities: for Libraries, Museums and ArchivesUX, ethnography and possibilities: for Libraries, Museums and Archives
UX, ethnography and possibilities: for Libraries, Museums and ArchivesNed Potter
 
Visual Design with Data
Visual Design with DataVisual Design with Data
Visual Design with DataSeth Familian
 
3 Things Every Sales Team Needs to Be Thinking About in 2017
3 Things Every Sales Team Needs to Be Thinking About in 20173 Things Every Sales Team Needs to Be Thinking About in 2017
3 Things Every Sales Team Needs to Be Thinking About in 2017Drift
 
How to Become a Thought Leader in Your Niche
How to Become a Thought Leader in Your NicheHow to Become a Thought Leader in Your Niche
How to Become a Thought Leader in Your NicheLeslie Samuel
 

Viewers also liked (11)

Ht media
Ht mediaHt media
Ht media
 
Angel top picks 21.05.10
Angel top picks   21.05.10Angel top picks   21.05.10
Angel top picks 21.05.10
 
Axis%20 bank ru1qfy2012-220711
Axis%20 bank ru1qfy2012-220711Axis%20 bank ru1qfy2012-220711
Axis%20 bank ru1qfy2012-220711
 
Electrosteel castings
Electrosteel castingsElectrosteel castings
Electrosteel castings
 
Market outlook 110612
Market outlook 110612Market outlook 110612
Market outlook 110612
 
Derivative report 19th July 2011
Derivative report 19th July 2011Derivative report 19th July 2011
Derivative report 19th July 2011
 
Designing Teams for Emerging Challenges
Designing Teams for Emerging ChallengesDesigning Teams for Emerging Challenges
Designing Teams for Emerging Challenges
 
UX, ethnography and possibilities: for Libraries, Museums and Archives
UX, ethnography and possibilities: for Libraries, Museums and ArchivesUX, ethnography and possibilities: for Libraries, Museums and Archives
UX, ethnography and possibilities: for Libraries, Museums and Archives
 
Visual Design with Data
Visual Design with DataVisual Design with Data
Visual Design with Data
 
3 Things Every Sales Team Needs to Be Thinking About in 2017
3 Things Every Sales Team Needs to Be Thinking About in 20173 Things Every Sales Team Needs to Be Thinking About in 2017
3 Things Every Sales Team Needs to Be Thinking About in 2017
 
How to Become a Thought Leader in Your Niche
How to Become a Thought Leader in Your NicheHow to Become a Thought Leader in Your Niche
How to Become a Thought Leader in Your Niche
 

Similar to Persistent systems

Similar to Persistent systems (20)

Infosys ru2 qfy2011-151010
Infosys  ru2 qfy2011-151010Infosys  ru2 qfy2011-151010
Infosys ru2 qfy2011-151010
 
E72 f1fc5d01
E72 f1fc5d01E72 f1fc5d01
E72 f1fc5d01
 
Infosys 1 qfy2012ru-12072011
Infosys 1 qfy2012ru-12072011Infosys 1 qfy2012ru-12072011
Infosys 1 qfy2012ru-12072011
 
Infosys Result Updated
Infosys Result UpdatedInfosys Result Updated
Infosys Result Updated
 
Tech Mahindra
Tech Mahindra Tech Mahindra
Tech Mahindra
 
3i Infotech
3i Infotech3i Infotech
3i Infotech
 
Cipla
Cipla Cipla
Cipla
 
RIL - result Update
RIL - result UpdateRIL - result Update
RIL - result Update
 
Infotech Result Update
Infotech Result UpdateInfotech Result Update
Infotech Result Update
 
Wipro
Wipro  Wipro
Wipro
 
BHEL -Result Update
BHEL -Result UpdateBHEL -Result Update
BHEL -Result Update
 
Elecon
EleconElecon
Elecon
 
Elecon
EleconElecon
Elecon
 
TCS 4QFY2010 Results Update
TCS 4QFY2010 Results UpdateTCS 4QFY2010 Results Update
TCS 4QFY2010 Results Update
 
Ashoke LeyLand
Ashoke LeyLandAshoke LeyLand
Ashoke LeyLand
 
Larsen & Tourbo
Larsen & TourboLarsen & Tourbo
Larsen & Tourbo
 
Infosys - Result Update
Infosys  - Result UpdateInfosys  - Result Update
Infosys - Result Update
 
Mphasis
MphasisMphasis
Mphasis
 
Exide 2 qfy2011ru-121010
Exide 2 qfy2011ru-121010Exide 2 qfy2011ru-121010
Exide 2 qfy2011ru-121010
 
TVS Motor
TVS MotorTVS Motor
TVS Motor
 

More from Angel Broking

Market outlook 19th July 2011
Market outlook 19th July 2011Market outlook 19th July 2011
Market outlook 19th July 2011Angel Broking
 
Weekly Report 18th July 2011
Weekly Report 18th July 2011Weekly Report 18th July 2011
Weekly Report 18th July 2011Angel Broking
 
Derivative Report 18th July 2011
Derivative Report 18th July 2011Derivative Report 18th July 2011
Derivative Report 18th July 2011Angel Broking
 
Technical Report 18th July 2011
Technical Report 18th July 2011Technical Report 18th July 2011
Technical Report 18th July 2011Angel Broking
 
Market Outlook 18th July 2011
Market Outlook 18th July 2011Market Outlook 18th July 2011
Market Outlook 18th July 2011Angel Broking
 
Bajaj auto Result Updated
Bajaj auto Result UpdatedBajaj auto Result Updated
Bajaj auto Result UpdatedAngel Broking
 
Derivatives Report 15th July 2011
Derivatives Report 15th July 2011Derivatives Report 15th July 2011
Derivatives Report 15th July 2011Angel Broking
 
Technical Report 15th July 2011
Technical Report 15th July 2011Technical Report 15th July 2011
Technical Report 15th July 2011Angel Broking
 
Derivative Report 13th July 2011
Derivative Report 13th July 2011Derivative Report 13th July 2011
Derivative Report 13th July 2011Angel Broking
 
Technical Report 13th July 2011
Technical Report 13th July 2011Technical Report 13th July 2011
Technical Report 13th July 2011Angel Broking
 
Market Outlook 13th July 2011
Market Outlook 13th July 2011Market Outlook 13th July 2011
Market Outlook 13th July 2011Angel Broking
 
Derivative Report 12th July 2011
Derivative Report 12th July 2011Derivative Report 12th July 2011
Derivative Report 12th July 2011Angel Broking
 
Market Outlook 12th July 2011
Market Outlook 12th July 2011Market Outlook 12th July 2011
Market Outlook 12th July 2011Angel Broking
 
Mining%20bill %20 impact%20analysis-eu-080711
Mining%20bill %20 impact%20analysis-eu-080711Mining%20bill %20 impact%20analysis-eu-080711
Mining%20bill %20 impact%20analysis-eu-080711Angel Broking
 
Derivatives%20 report%2008 july-2011
Derivatives%20 report%2008 july-2011Derivatives%20 report%2008 july-2011
Derivatives%20 report%2008 july-2011Angel Broking
 

More from Angel Broking (20)

Market outlook 19th July 2011
Market outlook 19th July 2011Market outlook 19th July 2011
Market outlook 19th July 2011
 
Telecom sector
Telecom sectorTelecom sector
Telecom sector
 
Weekly Report 18th July 2011
Weekly Report 18th July 2011Weekly Report 18th July 2011
Weekly Report 18th July 2011
 
Derivative Report 18th July 2011
Derivative Report 18th July 2011Derivative Report 18th July 2011
Derivative Report 18th July 2011
 
Technical Report 18th July 2011
Technical Report 18th July 2011Technical Report 18th July 2011
Technical Report 18th July 2011
 
Market Outlook 18th July 2011
Market Outlook 18th July 2011Market Outlook 18th July 2011
Market Outlook 18th July 2011
 
South Indian Bank
 South Indian Bank South Indian Bank
South Indian Bank
 
Bajaj auto Result Updated
Bajaj auto Result UpdatedBajaj auto Result Updated
Bajaj auto Result Updated
 
Fc4 e63c4d01
Fc4 e63c4d01Fc4 e63c4d01
Fc4 e63c4d01
 
Derivatives Report 15th July 2011
Derivatives Report 15th July 2011Derivatives Report 15th July 2011
Derivatives Report 15th July 2011
 
Technical Report 15th July 2011
Technical Report 15th July 2011Technical Report 15th July 2011
Technical Report 15th July 2011
 
Derivative Report 13th July 2011
Derivative Report 13th July 2011Derivative Report 13th July 2011
Derivative Report 13th July 2011
 
Technical Report 13th July 2011
Technical Report 13th July 2011Technical Report 13th July 2011
Technical Report 13th July 2011
 
Market Outlook 13th July 2011
Market Outlook 13th July 2011Market Outlook 13th July 2011
Market Outlook 13th July 2011
 
Weekly Report
Weekly ReportWeekly Report
Weekly Report
 
HDFC Result Updated
HDFC Result UpdatedHDFC Result Updated
HDFC Result Updated
 
Derivative Report 12th July 2011
Derivative Report 12th July 2011Derivative Report 12th July 2011
Derivative Report 12th July 2011
 
Market Outlook 12th July 2011
Market Outlook 12th July 2011Market Outlook 12th July 2011
Market Outlook 12th July 2011
 
Mining%20bill %20 impact%20analysis-eu-080711
Mining%20bill %20 impact%20analysis-eu-080711Mining%20bill %20 impact%20analysis-eu-080711
Mining%20bill %20 impact%20analysis-eu-080711
 
Derivatives%20 report%2008 july-2011
Derivatives%20 report%2008 july-2011Derivatives%20 report%2008 july-2011
Derivatives%20 report%2008 july-2011
 

Recently uploaded

Value Proposition canvas- Customer needs and pains
Value Proposition canvas- Customer needs and painsValue Proposition canvas- Customer needs and pains
Value Proposition canvas- Customer needs and painsP&CO
 
Call Girls in Delhi, Escort Service Available 24x7 in Delhi 959961-/-3876
Call Girls in Delhi, Escort Service Available 24x7 in Delhi 959961-/-3876Call Girls in Delhi, Escort Service Available 24x7 in Delhi 959961-/-3876
Call Girls in Delhi, Escort Service Available 24x7 in Delhi 959961-/-3876dlhescort
 
Business Model Canvas (BMC)- A new venture concept
Business Model Canvas (BMC)-  A new venture conceptBusiness Model Canvas (BMC)-  A new venture concept
Business Model Canvas (BMC)- A new venture conceptP&CO
 
Nelamangala Call Girls: 🍓 7737669865 🍓 High Profile Model Escorts | Bangalore...
Nelamangala Call Girls: 🍓 7737669865 🍓 High Profile Model Escorts | Bangalore...Nelamangala Call Girls: 🍓 7737669865 🍓 High Profile Model Escorts | Bangalore...
Nelamangala Call Girls: 🍓 7737669865 🍓 High Profile Model Escorts | Bangalore...amitlee9823
 
Russian Call Girls In Rajiv Chowk Gurgaon ❤️8448577510 ⊹Best Escorts Service ...
Russian Call Girls In Rajiv Chowk Gurgaon ❤️8448577510 ⊹Best Escorts Service ...Russian Call Girls In Rajiv Chowk Gurgaon ❤️8448577510 ⊹Best Escorts Service ...
Russian Call Girls In Rajiv Chowk Gurgaon ❤️8448577510 ⊹Best Escorts Service ...lizamodels9
 
Organizational Transformation Lead with Culture
Organizational Transformation Lead with CultureOrganizational Transformation Lead with Culture
Organizational Transformation Lead with CultureSeta Wicaksana
 
Call Girls In Nangloi Rly Metro ꧂…….95996 … 13876 Enjoy ꧂Escort
Call Girls In Nangloi Rly Metro ꧂…….95996 … 13876 Enjoy ꧂EscortCall Girls In Nangloi Rly Metro ꧂…….95996 … 13876 Enjoy ꧂Escort
Call Girls In Nangloi Rly Metro ꧂…….95996 … 13876 Enjoy ꧂Escortdlhescort
 
SEO Case Study: How I Increased SEO Traffic & Ranking by 50-60% in 6 Months
SEO Case Study: How I Increased SEO Traffic & Ranking by 50-60%  in 6 MonthsSEO Case Study: How I Increased SEO Traffic & Ranking by 50-60%  in 6 Months
SEO Case Study: How I Increased SEO Traffic & Ranking by 50-60% in 6 MonthsIndeedSEO
 
Falcon Invoice Discounting: The best investment platform in india for investors
Falcon Invoice Discounting: The best investment platform in india for investorsFalcon Invoice Discounting: The best investment platform in india for investors
Falcon Invoice Discounting: The best investment platform in india for investorsFalcon Invoice Discounting
 
Eluru Call Girls Service ☎ ️93326-06886 ❤️‍🔥 Enjoy 24/7 Escort Service
Eluru Call Girls Service ☎ ️93326-06886 ❤️‍🔥 Enjoy 24/7 Escort ServiceEluru Call Girls Service ☎ ️93326-06886 ❤️‍🔥 Enjoy 24/7 Escort Service
Eluru Call Girls Service ☎ ️93326-06886 ❤️‍🔥 Enjoy 24/7 Escort ServiceDamini Dixit
 
Falcon's Invoice Discounting: Your Path to Prosperity
Falcon's Invoice Discounting: Your Path to ProsperityFalcon's Invoice Discounting: Your Path to Prosperity
Falcon's Invoice Discounting: Your Path to Prosperityhemanthkumar470700
 
BAGALUR CALL GIRL IN 98274*61493 ❤CALL GIRLS IN ESCORT SERVICE❤CALL GIRL
BAGALUR CALL GIRL IN 98274*61493 ❤CALL GIRLS IN ESCORT SERVICE❤CALL GIRLBAGALUR CALL GIRL IN 98274*61493 ❤CALL GIRLS IN ESCORT SERVICE❤CALL GIRL
BAGALUR CALL GIRL IN 98274*61493 ❤CALL GIRLS IN ESCORT SERVICE❤CALL GIRLkapoorjyoti4444
 
Phases of Negotiation .pptx
 Phases of Negotiation .pptx Phases of Negotiation .pptx
Phases of Negotiation .pptxnandhinijagan9867
 
Call Girls Zirakpur👧 Book Now📱7837612180 📞👉Call Girl Service In Zirakpur No A...
Call Girls Zirakpur👧 Book Now📱7837612180 📞👉Call Girl Service In Zirakpur No A...Call Girls Zirakpur👧 Book Now📱7837612180 📞👉Call Girl Service In Zirakpur No A...
Call Girls Zirakpur👧 Book Now📱7837612180 📞👉Call Girl Service In Zirakpur No A...Sheetaleventcompany
 
Call Girls Ludhiana Just Call 98765-12871 Top Class Call Girl Service Available
Call Girls Ludhiana Just Call 98765-12871 Top Class Call Girl Service AvailableCall Girls Ludhiana Just Call 98765-12871 Top Class Call Girl Service Available
Call Girls Ludhiana Just Call 98765-12871 Top Class Call Girl Service AvailableSeo
 
Call Girls Jp Nagar Just Call 👗 7737669865 👗 Top Class Call Girl Service Bang...
Call Girls Jp Nagar Just Call 👗 7737669865 👗 Top Class Call Girl Service Bang...Call Girls Jp Nagar Just Call 👗 7737669865 👗 Top Class Call Girl Service Bang...
Call Girls Jp Nagar Just Call 👗 7737669865 👗 Top Class Call Girl Service Bang...amitlee9823
 
👉Chandigarh Call Girls 👉9878799926👉Just Call👉Chandigarh Call Girl In Chandiga...
👉Chandigarh Call Girls 👉9878799926👉Just Call👉Chandigarh Call Girl In Chandiga...👉Chandigarh Call Girls 👉9878799926👉Just Call👉Chandigarh Call Girl In Chandiga...
👉Chandigarh Call Girls 👉9878799926👉Just Call👉Chandigarh Call Girl In Chandiga...rajveerescorts2022
 
Cheap Rate Call Girls In Noida Sector 62 Metro 959961乂3876
Cheap Rate Call Girls In Noida Sector 62 Metro 959961乂3876Cheap Rate Call Girls In Noida Sector 62 Metro 959961乂3876
Cheap Rate Call Girls In Noida Sector 62 Metro 959961乂3876dlhescort
 
Malegaon Call Girls Service ☎ ️82500–77686 ☎️ Enjoy 24/7 Escort Service
Malegaon Call Girls Service ☎ ️82500–77686 ☎️ Enjoy 24/7 Escort ServiceMalegaon Call Girls Service ☎ ️82500–77686 ☎️ Enjoy 24/7 Escort Service
Malegaon Call Girls Service ☎ ️82500–77686 ☎️ Enjoy 24/7 Escort ServiceDamini Dixit
 

Recently uploaded (20)

Value Proposition canvas- Customer needs and pains
Value Proposition canvas- Customer needs and painsValue Proposition canvas- Customer needs and pains
Value Proposition canvas- Customer needs and pains
 
Call Girls in Delhi, Escort Service Available 24x7 in Delhi 959961-/-3876
Call Girls in Delhi, Escort Service Available 24x7 in Delhi 959961-/-3876Call Girls in Delhi, Escort Service Available 24x7 in Delhi 959961-/-3876
Call Girls in Delhi, Escort Service Available 24x7 in Delhi 959961-/-3876
 
Business Model Canvas (BMC)- A new venture concept
Business Model Canvas (BMC)-  A new venture conceptBusiness Model Canvas (BMC)-  A new venture concept
Business Model Canvas (BMC)- A new venture concept
 
Nelamangala Call Girls: 🍓 7737669865 🍓 High Profile Model Escorts | Bangalore...
Nelamangala Call Girls: 🍓 7737669865 🍓 High Profile Model Escorts | Bangalore...Nelamangala Call Girls: 🍓 7737669865 🍓 High Profile Model Escorts | Bangalore...
Nelamangala Call Girls: 🍓 7737669865 🍓 High Profile Model Escorts | Bangalore...
 
Russian Call Girls In Rajiv Chowk Gurgaon ❤️8448577510 ⊹Best Escorts Service ...
Russian Call Girls In Rajiv Chowk Gurgaon ❤️8448577510 ⊹Best Escorts Service ...Russian Call Girls In Rajiv Chowk Gurgaon ❤️8448577510 ⊹Best Escorts Service ...
Russian Call Girls In Rajiv Chowk Gurgaon ❤️8448577510 ⊹Best Escorts Service ...
 
Organizational Transformation Lead with Culture
Organizational Transformation Lead with CultureOrganizational Transformation Lead with Culture
Organizational Transformation Lead with Culture
 
Call Girls In Nangloi Rly Metro ꧂…….95996 … 13876 Enjoy ꧂Escort
Call Girls In Nangloi Rly Metro ꧂…….95996 … 13876 Enjoy ꧂EscortCall Girls In Nangloi Rly Metro ꧂…….95996 … 13876 Enjoy ꧂Escort
Call Girls In Nangloi Rly Metro ꧂…….95996 … 13876 Enjoy ꧂Escort
 
SEO Case Study: How I Increased SEO Traffic & Ranking by 50-60% in 6 Months
SEO Case Study: How I Increased SEO Traffic & Ranking by 50-60%  in 6 MonthsSEO Case Study: How I Increased SEO Traffic & Ranking by 50-60%  in 6 Months
SEO Case Study: How I Increased SEO Traffic & Ranking by 50-60% in 6 Months
 
Falcon Invoice Discounting: The best investment platform in india for investors
Falcon Invoice Discounting: The best investment platform in india for investorsFalcon Invoice Discounting: The best investment platform in india for investors
Falcon Invoice Discounting: The best investment platform in india for investors
 
unwanted pregnancy Kit [+918133066128] Abortion Pills IN Dubai UAE Abudhabi
unwanted pregnancy Kit [+918133066128] Abortion Pills IN Dubai UAE Abudhabiunwanted pregnancy Kit [+918133066128] Abortion Pills IN Dubai UAE Abudhabi
unwanted pregnancy Kit [+918133066128] Abortion Pills IN Dubai UAE Abudhabi
 
Eluru Call Girls Service ☎ ️93326-06886 ❤️‍🔥 Enjoy 24/7 Escort Service
Eluru Call Girls Service ☎ ️93326-06886 ❤️‍🔥 Enjoy 24/7 Escort ServiceEluru Call Girls Service ☎ ️93326-06886 ❤️‍🔥 Enjoy 24/7 Escort Service
Eluru Call Girls Service ☎ ️93326-06886 ❤️‍🔥 Enjoy 24/7 Escort Service
 
Falcon's Invoice Discounting: Your Path to Prosperity
Falcon's Invoice Discounting: Your Path to ProsperityFalcon's Invoice Discounting: Your Path to Prosperity
Falcon's Invoice Discounting: Your Path to Prosperity
 
BAGALUR CALL GIRL IN 98274*61493 ❤CALL GIRLS IN ESCORT SERVICE❤CALL GIRL
BAGALUR CALL GIRL IN 98274*61493 ❤CALL GIRLS IN ESCORT SERVICE❤CALL GIRLBAGALUR CALL GIRL IN 98274*61493 ❤CALL GIRLS IN ESCORT SERVICE❤CALL GIRL
BAGALUR CALL GIRL IN 98274*61493 ❤CALL GIRLS IN ESCORT SERVICE❤CALL GIRL
 
Phases of Negotiation .pptx
 Phases of Negotiation .pptx Phases of Negotiation .pptx
Phases of Negotiation .pptx
 
Call Girls Zirakpur👧 Book Now📱7837612180 📞👉Call Girl Service In Zirakpur No A...
Call Girls Zirakpur👧 Book Now📱7837612180 📞👉Call Girl Service In Zirakpur No A...Call Girls Zirakpur👧 Book Now📱7837612180 📞👉Call Girl Service In Zirakpur No A...
Call Girls Zirakpur👧 Book Now📱7837612180 📞👉Call Girl Service In Zirakpur No A...
 
Call Girls Ludhiana Just Call 98765-12871 Top Class Call Girl Service Available
Call Girls Ludhiana Just Call 98765-12871 Top Class Call Girl Service AvailableCall Girls Ludhiana Just Call 98765-12871 Top Class Call Girl Service Available
Call Girls Ludhiana Just Call 98765-12871 Top Class Call Girl Service Available
 
Call Girls Jp Nagar Just Call 👗 7737669865 👗 Top Class Call Girl Service Bang...
Call Girls Jp Nagar Just Call 👗 7737669865 👗 Top Class Call Girl Service Bang...Call Girls Jp Nagar Just Call 👗 7737669865 👗 Top Class Call Girl Service Bang...
Call Girls Jp Nagar Just Call 👗 7737669865 👗 Top Class Call Girl Service Bang...
 
👉Chandigarh Call Girls 👉9878799926👉Just Call👉Chandigarh Call Girl In Chandiga...
👉Chandigarh Call Girls 👉9878799926👉Just Call👉Chandigarh Call Girl In Chandiga...👉Chandigarh Call Girls 👉9878799926👉Just Call👉Chandigarh Call Girl In Chandiga...
👉Chandigarh Call Girls 👉9878799926👉Just Call👉Chandigarh Call Girl In Chandiga...
 
Cheap Rate Call Girls In Noida Sector 62 Metro 959961乂3876
Cheap Rate Call Girls In Noida Sector 62 Metro 959961乂3876Cheap Rate Call Girls In Noida Sector 62 Metro 959961乂3876
Cheap Rate Call Girls In Noida Sector 62 Metro 959961乂3876
 
Malegaon Call Girls Service ☎ ️82500–77686 ☎️ Enjoy 24/7 Escort Service
Malegaon Call Girls Service ☎ ️82500–77686 ☎️ Enjoy 24/7 Escort ServiceMalegaon Call Girls Service ☎ ️82500–77686 ☎️ Enjoy 24/7 Escort Service
Malegaon Call Girls Service ☎ ️82500–77686 ☎️ Enjoy 24/7 Escort Service
 

Persistent systems

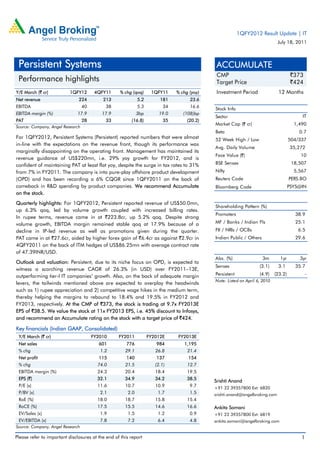
  • 1. 1QFY2012 Result Update | IT July 18, 2011 Persistent Systems ACCUMULATE CMP `373 Performance highlights Target Price `424 Y/E March (` cr) 1QFY12 4QFY11 % chg (qoq) 1QFY11 % chg (yoy) Investment Period 12 Months Net revenue 224 213 5.2 181 23.6 EBITDA 40 38 5.3 34 16.6 Stock Info EBITDA margin (%) 17.9 17.9 3bp 19.0 (108)bp Sector IT PAT 28 33 (16.8) 35 (20.2) Market Cap (` cr) 1,490 Source: Company, Angel Research Beta 0.7 For 1QFY2012, Persistent Systems (Persistent) reported numbers that were almost 52 Week High / Low 504/337 in-line with the expectations on the revenue front, though its performance was Avg. Daily Volume 35,272 marginally disappointing on the operating front. Management has maintained its Face Value (`) 10 revenue guidance of US$220mn, i.e. 29% yoy growth for FY2012, and is confident of maintaining PAT at least flat yoy, despite the surge in tax rates to 31% BSE Sensex 18,507 from 7% in FY2011. The company is into pure-play offshore product development Nifty 5,567 (OPD) and has been recording a 6% CQGR since 1QFY2011 on the back of Reuters Code PERS.BO comeback in R&D spending by product companies. We recommend Accumulate Bloomberg Code PSYS@IN on the stock. Quarterly highlights: For 1QFY2012, Persistent reported revenue of US$50.0mn, Shareholding Pattern (%) up 6.3% qoq, led by volume growth coupled with increased billing rates. Promoters 38.9 In rupee terms, revenue came in at `223.8cr, up 5.2% qoq. Despite strong volume growth, EBITDA margin remained stable qoq at 17.9% because of a MF / Banks / Indian Fls 25.1 decline in IP-led revenue as well as promotions given during the quarter. FII / NRIs / OCBs 6.5 PAT came in at `27.6cr, aided by higher forex gain of `6.4cr as against `2.9cr in Indian Public / Others 29.6 4QFY2011 on the back of ITM hedges of US$86.25mn with average contract rate of 47.39INR/USD. Abs. (%) 3m 1yr 3yr Outlook and valuation: Persistent, due to its niche focus on OPD, is expected to Sensex (3.1) 3.1 35.7 witness a scorching revenue CAGR of 26.3% (in USD) over FY2011–13E, outperforming tier-I IT companies’ growth. Also, on the back of adequate margin Persistent (4.9) (23.2) - Note: Listed on April 6, 2010 levers, the tailwinds mentioned above are expected to overplay the headwinds such as 1) rupee appreciation and 2) competitive wage hikes in the medium term, thereby helping the margins to rebound to 18.4% and 19.5% in FY2012 and FY2013, respectively. At the CMP of `373, the stock is trading at 9.7x FY2013E EPS of `38.5. We value the stock at 11x FY2013 EPS, i.e. 45% discount to Infosys, and recommend an Accumulate rating on the stock with a target price of `424. Key financials (Indian GAAP, Consolidated) Y/E March (` cr) FY2010 FY2011 FY2012E FY2013E Net sales 601 776 984 1,195 % chg 1.2 29.1 26.8 21.4 Net profit 115 140 137 154 % chg 74.0 21.5 (2.1) 12.7 EBITDA margin (%) 24.3 20.4 18.4 19.5 EPS (`) 32.1 34.9 34.2 38.5 Srishti Anand P/E (x) 11.6 10.7 10.9 9.7 +91 22 39357800 Ext: 6820 P/BV (x) 2.1 2.0 1.7 1.5 srishti.anand@angelbroking.com RoE (%) 18.0 18.7 15.8 15.4 RoCE (%) 17.5 15.5 14.6 16.6 Ankita Somani EV/Sales (x) 1.9 1.5 1.2 0.9 +91 22 39357800 Ext: 6819 EV/EBITDA (x) 7.8 7.2 6.4 4.8 ankita.somani@angelbroking.com Source: Company, Angel Research Please refer to important disclosures at the end of this report 1
  • 2. Persistent | 1QFY2012 Result Update Exhibit 1: 1QFY2012 performance (Indian GAAP, Consolidated) Y/E March (` cr) 1QFY12 4QFY11 % chg (qoq) 1QFY11 % chg (yoy) FY2011 FY2010 % chg (yoy) Net revenue 224 213 5.2 181 23.6 776 601 29.1 Cost of revenue 140 133 5.3 112 25.0 472 337 40.1 Gross profit 83 80 4.8 69 21.3 304 264 15.0 S&M expenses 18 16 7.7 14 23.8 62 46 33.5 G&A expenses 26 25 2.3 20 27.5 83 71 17.1 EBITDA 40 38 5.3 34 16.6 158 146 8.2 Depreciation 13 12 6.0 10 29.6 42 34 26.4 EBIT 27 26 5.0 25 11.4 116 113 2.7 Other income 6 6 3 17 8 Forex gain/(loss) 6 3 9 17 3 PBT 40 35 14.9 37 7.9 150 124 21.2 Income tax 12 2 628.2 3 382.6 11 9 17.3 PAT 28 33 (16.8) 35 (20.2) 140 115 21.5 EPS 6.9 8.3 (16.8) 8.6 (19.8) 34.9 32.1 8.8 Gross margin (%) 37.3 37.4 (11)bp 38.0 (71)bp 39.1 43.9 (478)bp EBITDA margin (%) 17.9 17.9 3bp 19.0 (108)bp 20.4 24.3 (394)bp EBIT margin (%) 12.3 12.3 (2)bp 13.6 (134)bp 14.9 18.8 (383)bp PAT margin (%) 11.7 15.0 (329)bp 17.8 (618)bp 17.2 18.8 (154)bp Source: Company, Angel Research Revenue momentum continues For 1QFY2012, Persistent reported revenue of US$50.0mn, up 6.3% qoq, primarily led by volume growth. Also, the company’s billing rates, onsite as well as offshore, improved by 2.3% and 1.3% qoq to US$13,033 per person per month (ppm) and US$3,770 ppm, respectively. The improvement in billing rates during the quarter was due to selling of high-end services like technology consulting, mobility and analytics. In rupee terms, revenue came in `223.8cr, up 5.2% qoq – lower growth as against dollar revenue due to 1.0% qoq INR appreciation against USD in 1QFY2012. Exhibit 2: Trend in revenue growth (qoq) 55 10 8.8 9 50 50.0 8 45 47.0 7 (US$ mn) 6.7 6.3 6 (%) 5.8 43.2 40 5 40.5 39.5 4 35 3 2.6 30 2 1QFY11 2QFY11 3QFY11 4QFY11 1QFY12 Revenue (US$mn) qoq growth (%) Source: Company, Angel Research July 18, 2011 2
  • 3. Persistent | 1QFY2012 Result Update Exhibit 3: Trend in billing rates (qoq) 14,000 12,896 12,746 13,033 12,414 12,470 12,000 10,000 (US$/ppm) 8,000 6,000 3,600 3,601 3,661 3,723 3,770 4,000 2,000 - 1QFY11 2QFY11 3QFY11 4QFY11 1QFY12 Onsite Offshore Source: Company, Angel Research Industry wise, the company’s growth was led by the telecom and wireless segment (contributing 22.2% to revenue), which grew by 15.1% qoq, majorly led by European clients. The anchor industry segment – infrastructure and systems (contributed 67.9% to revenue) – continued its revenue traction and grew by 5.7% qoq. In absolute terms, revenue contribution from the lifesciences and healthcare segment stood modest; however, on a qoq basis, revenue declined by 6.0% due to base effect, as higher growth was reported in this segment in 2HFY2011. Exhibit 4: Growth trend in industry segments % to revenue % chg (qoq) % chg (yoy) Infrastructure and systems 67.9 5.7 19.9 Telecom and wireless 22.2 15.1 51.9 Lifesciences and healthcare 9.9 (6.0) 27.9 Source: Company, Angel Research Geography wise, growth was led by Europe, revenue from which grew by 35.7% qoq – whopping growth due to low base effect and ramp-up in revenue from few European clients. North America continued to grow during this quarter as well at 2.0% qoq. Exhibit 5: Growth trend in geographies % to revenue % chg (qoq) % chg (yoy) North America 82.8 2.0 23.2 Europe 7.4 35.7 44.1 Asia-Pacific 9.8 31.9 47.7 Source: Company, Angel Research Revenue contribution from IP-led services declined in 1QFY2012 to 6.1% from 10.3% in 4QFY2012 because of lower revenue from the company’s top customer that contributes almost 60% to the company’s IP-led revenue. Management has indicated that it is a one-time issue and revenue from the top customer is expected to scale up again in the coming quarters. IP-led revenue seems low also because of higher base in 4QFY2011, which was due to higher product sale from the top customer’s end in 3QFY2011, the royalty revenue of which got reflected in July 18, 2011 3
  • 4. Persistent | 1QFY2012 Result Update Persistent’s account in 4QFY2011. The company expects IP-led revenue to touch US$25mn by the end of FY2012, i.e. whopping 68% yoy growth. Hiring and utilisation Persistent continued its modest hiring trend and added 260 net employees during the quarter. Gross addition during the quarter was 545. In the technical employee base of the company, 228 net employees were added. Attrition rate (LTM basis) declined significantly in 1QFY2012 to 18.4% from 19.6% in 4QFY2011, as the company gave wage hikes in 4QFY2011 to control attrition and, as a result, quarterly attrition rate in 1QFY2012 stood merely at 3.2% (quarterly annualised at 12.8%), leading to an overall decline in attrition rates on an LTM basis. Exhibit 6: Employee metrics Particulars 1QFY11 2QFY11 3QFY11 4QFY11 1QFY12 Technical 4,554 4,907 5,070 5,950 6,178 Sales 79 87 94 108 119 Rest 278 287 296 302 323 Total 4,911 5,281 5,460 6,360 6,620 Net addition 249 370 179 900 260 Attrition – LTM (%) 16.3 18.6 21.5 19.6 18.4 Source: Company, Angel Research For FY2012, management has a gross hiring target of 2,300 employees (1,000 freshers and 1,200–1,300 laterals) and a net hiring target of ~1,500 employees. Net utilisation (excluding resources in IP-led work) increased by 170bp qoq to 72.7%. However, in 2QFY2012, we expect utilisation to dip due to intake of freshers into the system. Management expects utilisation to inch up and reach 75–77% over the next 3–4 quarters. Exhibit 7: Utilisation trend 80 78.5 78 76 74.2 (%) 74 72.7 71.7 72 71.0 70 68 1QFY11 2QFY11 3QFY11 4QFY11 1QFY12 Utilisation (%) Source: Company, Angel Research July 18, 2011 4
  • 5. Persistent | 1QFY2012 Result Update Margin profile In 1QFY2012, the company’s EBITDA and EBIT margins remained almost stable qoq at 17.9% and 12.3%, respectively, despite higher revenue growth due to higher costs incurred on account of promotions given in 1QFY2012 and drop in IP-led revenue. Going ahead, for 2QFY2012, the company has announced wage hikes — 7–8% for offshore employees and 4% for onsite employees, effective from July 1, 2011. This is expected to negatively affect the company’s operating margins by 200–220bp qoq in the next quarter. However, for the full year, the company expects margins to remain stable at FY2011 levels. Exhibit 8: Margin profile 45 40 42.2 35 38.0 39.1 37.4 37.3 30 23.0 21.9 25 (%) 19.0 17.9 17.9 20 15 17.6 16.5 10 13.6 12.3 12.3 5 1QFY11 2QFY11 3QFY11 4QFY11 1QFY12 Gross margin EBITDA margin EBIT margin Source: Company, Angel Research Client pyramid The client metrics of the company saw a qualitative movement with six new clients in the US$1mn–3mn revenue bracket. Also, four clients were added in the <US$1mn revenue bracket. In 1QFY2012, Persistent added 32 new clients, out of which eight were from the company’s partners. The total active client base of the company increased to 239 from 229 in 4QFY2011. Exhibit 9: Client metrics Particulars 1QFY11 2QFY11 3QFY11 4QFY11 1QFY12 Customers billed 196 201 207 229 239 <US$1mn 165 171 169 194 198 US$1mn-3mn 22 21 29 26 32 >US$3mn 9 9 9 9 9 Source: Company, Angel Research July 18, 2011 5
  • 6. Persistent | 1QFY2012 Result Update Investment rationale Established footprint in the resurging OPD market Persistent has a dominant market share of ~16% (in CY2010) in the Indian OPD market. The company is witnessing a robust uptick in the deal pipeline as clients are flocking to generate new products in shorter time to market to capture market share. This is driving many ISVs and wireless equipment manufacturers to spend on R&D and engineering services. As per IDC, out of the global size of US$40bn in 2010 for R&D and product engineering, the Indian OPD market is just worth ~US$1bn. The global OPD market is expected to grow at a 14% CAGR to US$65.7bn by 2014. The offshore segment of the global OPD market in 2010 crossed the US$10bn mark and is expected to grow at a 19% CAGR to US$16bn by 2014. Exhibit 10: Worldwide R&D/PES spending (US$ mn) 70,000 25 60,000 18.2 19.1 20 17.9 16.3 50,000 13.2 15 (US$ mn) (%) 9.7 10.2 40,000 10 30,000 5 3.9 20,000 0 CY2006 CY2007 CY2008 CY2009 CY2010 CY2011 CY2012 CY2013 IT spending (US$ mn) yoy growth (%) Source: IDC, Angel Research   Exhibit 11: Worldwide R&D/PES offshore spending (US$ mn) 18,000 23.5 25 21.7 16,000 19.4 20 14,000 17.9 15 (US$ mn) 12,000 11.8 (%) 9.7 10,000 10 8,000 5 6,000 3.9 3.8 4,000 0 CY2006 CY2007 CY2008 CY2009 CY2010 CY2011 CY2012 CY2013 IT spending (US$ mn) yoy growth (%) Source: IDC, Angel Research July 18, 2011 6
  • 7. Persistent | 1QFY2012 Result Update Non-linear services already a sizeable part of the portfolio Persistent has a sizeable portfolio coming in from IP-led revenue, which was ~9% in FY2011. The company expects it to scale up to ~11% in FY2012 and reach ~20% by FY2015. The company has been investing in the areas of 1) cloud, 2) analytics, 3) collaboration and 4) mobility, which are towards consulting. With the expected increase in contribution from IP revenue, the company is likely to benefit at the margin front because of its non-linear nature. Exhibit 12: IP-led revenue as a % of total revenue 12 11.4 11 10.2 10 8.8 9 8 (%) 7.2 7 6 5.2 5 4 FY2009 FY2010 FY2011 FY2012E FY2013E IP driven revenue (as % of sales) Source: Company, Angel Research Marquee clientele Out of its active clients, 37 have revenue of more than US$1bn and dedicated annual R&D budgets of 6–20% of revenue to drive product innovation. The company has marquee clients (with R&D budgets) including MNCs like IBM (~6.0%), Google (~12.8%), Microsoft (~13.9%), Oracle (~12.8%), Intel (~15.1%), Cisco (~13.2%), Nokia (~14%), Samsung, Yahoo (~17%) and eBay. In addition, the company’s client mining is strong as the company manages to get ~11% of its revenue from new clients vis-à-vis peers who get mere 3–5%. Exhibit 13: Revenue (CY2010/FY2010) and R&D budget as a % of sales 120 99.9 100 80 62.5 60 43.6 40.0 40 29.3 20 13.9 15.1 13.2 13.8 12.8 12.5 6.0 0 Microsoft Intel Cisco SAP Google IBM Revenue (US$ mn) R&D as % of sales Source: Company, Angel Research July 18, 2011 7
  • 8. Persistent | 1QFY2012 Result Update Robust revenue growth with gradual improvement in margins Persistent is expected to report a robust revenue CAGR of 26.3% over FY2011–13E on the back of return in demand for OPD services. In fact the company has indicated net hiring to be 1,500 plus for FY2012E on the back of a strong deal pipeline. On the operating front, we expect margins to rebound in 2HFY2012 from 17.9% in 1QFY2012 to 18.4% in FY2012 and 19.5% in FY2013. We expect this margin improvement because of margin levers such as 1) employee pyramid rationalisation (indicated to hire 700 freshers out of 1,500 net people in FY2012); 2) higher revenue productivity due to the expected increase in IP-led revenue contribution; 3) gradual increase in utilisations to 74.7% in FY2013 from 72% in 1QFY2012 and 4) stable G&A in absolute terms even with higher growth. On the PAT front, we expect factors like 1) improvement in profitability and 2) forex gains due to In-the-Money (with average contract rate of 47.39INR/USD) hedges worth US$86.25mn to counter the headwinds due to higher tax rate of 31% compared to 7% in FY2011. Exhibit 14: Revenue expectations 300 250 28.8% 271.7 CAGR 200 221.4 (US$ mn) 150 170.2 127.9 127.3 100 50 FY2009 FY2010 FY2011 FY2012E FY2013E Revenue (US$ mn) Source: Company, Angel Research Exhibit 15: Margin expectations 31 30.1 29 27 24.3 25 (%) 23 20.4 21 19.5 18.4 19 17 FY2009 FY2010 FY2011 FY2012E FY2013E EBITDA margin (%) Source: Company, Angel Research July 18, 2011 8
  • 9. Persistent | 1QFY2012 Result Update Outlook and valuation Persistent, due to its niche focus on OPD, is expected to record a scorching revenue CAGR of 26.3% (in USD) over FY2011–13E, outperforming tier-I IT companies’ growth. Also, on the back of adequate margin levers, the tailwinds mentioned above are expected to overplay the headwinds such as 1) rupee appreciation and 2) competitive wage hikes in the medium term and help the margins to rebound to 18.4% and 19.5% in FY2012 and FY2013, respectively. At the CMP of `373, the stock is trading at 9.7x FY2013E EPS of `38.5. We value the stock at 11x FY2013 EPS, i.e. 45% discount to Infosys, and recommend an Accumulate rating on the stock with a target price of `424. Exhibit 16: Key assumptions FY2012 FY2013 Revenue growth – USD terms (%) 30.1 22.7 USD-INR rate 44.5 44.0 Revenue growth – INR terms (%) 26.8 21.4 EBITDA margin (%) 18.4 19.5 Tax rate (%) 31.0 31.0 EPS growth (%) (2.0) 12.7 Source: Company, Angel Research Exhibit 17: One-year forward PE(x) chart 700 600 500 (` ) 400 300 200 Dec-10 Apr-10 Jul-10 Aug-10 Apr-11 Jul-11 Mar-11 Oct-10 Sep-10 Nov-10 Feb-11 May-10 May-11 Jun-10 Jun-11 Jan-11 Price 16 14 12 10 8 Source: Company, Angel Research July 18, 2011 9
  • 10. Persistent | 1QFY2012 Result Update Exhibit 18: Recommendation summary Company Reco CMP Tgt. price Upside FY2013E FY2013E FY2011-13E FY2013E FY2013E (`) (`) (%) P/BV (x) P/E (x) EPS CAGR (%) RoCE (%) RoE (%) 3iInfotech Neutral 44 - - 0.6 3.8 (4.3) 12.0 15.1 Educomp Buy 387 522 34.8 1.3 7.5 17.7 16.4 17.0 Everonn Accumulate 539 602 11.7 2.6 12.8 27.7 15.5 16.7 HCL Tech Buy 504 591 17.3 3.2 11.9 30.8 18.9 26.9 Infosys Buy 2,714 3,200 17.9 3.9 17.0 15.7 24.7 22.7 Infotech Enterprises Neutral 138 - - 1.1 8.6 13.0 15.0 13.2 KPIT Cummins Accumulate 182 208 14.3 1.7 10.8 21.9 21.8 17.7 Mphasis Accumulate 436 499 14.4 1.6 9.8 9.2 16.8 16.8 NIIT Buy 55 68 24.3 1.3 7.9 10.9 12.4 16.6 Persistent Accumulate 373 424 13.8 1.5 9.7 5.1 16.6 15.4 TCS Buy 1,125 1,368 21.6 5.7 18.1 18.4 30.2 31.3 Tech Mahindra Accumulate 741 790 6.6 2.1 13.1 6.8 14.9 15.6 Wipro Buy 413 483 17.0 3.1 14.5 14.5 16.3 21.5 Source: Company, Angel Research July 18, 2011 10
  • 11. Persistent | 1QFY2012 Result Update Profit and loss statement (Indian GAAP, Consolidated) Y/E March (` cr) FY2010 FY2011 FY2012E FY2013E Net sales 601 776 984 1,195 Direct costs 337 472 626 759 % of net sales 56.1 60.9 63.6 63.5 Gross profit 264 304 358 436 % of net sales 43.9 39.1 36.4 36.5 S&M expenses 46 62 78 95 % of net sales 7.7 8.0 8.0 8.0 G&A expenses 71 83 98 108 % of net sales 11.9 10.8 10.0 9.0 EBITDA 146 158 181 233 % of net sales 24.3 20.4 18.4 19.5 Depreciation 34 42 54 66 EBIT 113 116 127 168 Other income 8 17 45 42 Forex gain/(loss) 3 17 26 14 Profit before tax 124 150 198 224 Provision for tax 9 11 62 69 % of PBT 7.3 7.1 31.0 31.0 PAT 115 140 137 154 Extraordinary expenses - - - - Final PAT 115 140 137 154 EPS (`) 32.1 34.9 34.2 38.5 July 18, 2011 11
  • 12. Persistent | 1QFY2012 Result Update Balance sheet (Indian GAAP, Consolidated) Y/E March (` cr) FY2010 FY2011 FY2012E FY2013E Liabilities Share capital 40 40 40 40 ESOP outstanding 3 3 4 4 Reserves and surplus 580 696 816 954 Hedge reserves 16 8 7 7 Total shareholders' funds 639 747 867 1,005 Deferred payment liability 5 3 3 3 Total liabilities 644 750 870 1,008 Assets Gross block - fixed assets 371 454 654 804 Accumulated depreciation 188 228 282 348 Net block 183 226 372 456 Capital work-in-progress 48 60 67 59 Total fixed assets 232 287 439 515 Investments 156 250 250 250 Deferred tax assets, net 1 6 6 - Current assets Sundry debtors 136 158 183 223 Cash and bank balance 192 100 75 128 Other current assets 34 23 25 30 Loans and advances 72 87 110 131 Less: - Current liab. and provisions Current liabilities 148 121 172 208 Provisions 32 40 47 62 Net current assets 255 207 174 242 Total assets 644 750 870 1,008 July 18, 2011 12
  • 13. Persistent | 1QFY2012 Result Update Cash flow statement (Indian GAAP, Consolidated) Y/E March (` cr) FY2010 FY2011 FY2012E FY2013E Pre tax profit from operations 113 116 127 168 Depreciation 34 42 54 66 Pre tax cash from operations 146 158 181 233 Other income/prior period ad 11 34 71 56 Net cash from operations 158 193 253 289 Tax 9 11 62 69 Cash profits 149 182 191 220 (Inc)/dec in Current assets (81) (25) (51) (65) Current liabilities 88 (19) 59 51 Net trade working capital 7 (44) 8 (14) Cashflow from operating activities 156 138 199 206 (Inc)/dec in fixed assets (48) (97) (207) (142) (Inc)/dec in investments (68) (94) 0 - (Inc)/dec in deferred tax assets 1 (5) (0) 6 Inc/(dec) in deferred payment liab. 5 (2) (0) - Cashflow from investing activities (110) (198) (207) (136) Inc/(dec) in debt - - - - Inc/(dec) in equity/premium 132 (6) (1) - Dividends (2) (26) (16) (16) Cashflow from financing activities 129 (32) (17) (16) Cash generated/(utilised) 175 (92) (25) 54 Cash at start of the year 17 192 100 75 Cash at end of the year 192 100 75 128 July 18, 2011 13
  • 14. Persistent | 1QFY2012 Result Update Key ratios Y/E March FY2010 FY2011 FY2012E FY2013E Valuation ratio (x) P/E (on FDEPS) 11.6 10.7 10.9 9.7 P/CEPS 9.0 8.2 7.8 6.8 P/BVPS 2.1 2.0 1.7 1.5 Dividend yield (%) 0.1 1.5 0.9 0.9 EV/Sales 1.9 1.5 1.2 0.9 EV/EBITDA 7.8 7.2 6.4 4.8 EV/Total assets 1.8 1.5 1.3 1.1 Per share data (`) EPS 32.1 34.9 34.2 38.5 Cash EPS 41.4 45.5 47.8 55.0 Dividend 0.6 5.5 3.5 3.5 Book value 178.1 186.8 216.7 251.1 Dupont analysis Tax retention ratio (PAT/PBT) 0.9 0.9 0.7 0.7 Cost of debt (PBT/EBIT) 1.1 1.3 1.6 1.3 EBIT margin (EBIT/Sales) 0.2 0.1 0.1 0.1 Asset turnover ratio (Sales/Assets) 0.9 1.0 1.1 1.2 Leverage ratio (Assets/Equity) 1.0 1.0 1.0 1.0 Operating ROE 18.0 18.7 15.8 15.4 Return ratios (%) RoCE (pre-tax) 17.5 15.5 14.6 16.6 Angel RoIC 45.7 34.1 26.6 29.4 RoE 18.0 18.7 15.8 15.4 Turnover ratios (x) Asset turnover (fixed assets) 2.7 3.0 2.7 2.5 Receivables days 73 69 68 68 Payable days 120 104 100 100 July 18, 2011 14
  • 15. Persistent | 1QFY2012 Result Update Research Team Tel: 022 - 3935 7800 E-mail: research@angelbroking.com Website: www.angelbroking.com DISCLAIMER This document is solely for the personal information of the recipient, and must not be singularly used as the basis of any investment decision. Nothing in this document should be construed as investment or financial advice. Each recipient of this document should make such investigations as they deem necessary to arrive at an independent evaluation of an investment in the securities of the companies referred to in this document (including the merits and risks involved), and should consult their own advisors to determine the merits and risks of such an investment. Angel Broking Limited, its affiliates, directors, its proprietary trading and investment businesses may, from time to time, make investment decisions that are inconsistent with or contradictory to the recommendations expressed herein. The views contained in this document are those of the analyst, and the company may or may not subscribe to all the views expressed within. Reports based on technical and derivative analysis center on studying charts of a stock's price movement, outstanding positions and trading volume, as opposed to focusing on a company's fundamentals and, as such, may not match with a report on a company's fundamentals. The information in this document has been printed on the basis of publicly available information, internal data and other reliable sources believed to be true, but we do not represent that it is accurate or complete and it should not be relied on as such, as this document is for general guidance only. Angel Broking Limited or any of its affiliates/ group companies shall not be in any way responsible for any loss or damage that may arise to any person from any inadvertent error in the information contained in this report. Angel Broking Limited has not independently verified all the information contained within this document. Accordingly, we cannot testify, nor make any representation or warranty, express or implied, to the accuracy, contents or data contained within this document. While Angel Broking Limited endeavours to update on a reasonable basis the information discussed in this material, there may be regulatory, compliance, or other reasons that prevent us from doing so. This document is being supplied to you solely for your information, and its contents, information or data may not be reproduced, redistributed or passed on, directly or indirectly. Angel Broking Limited and its affiliates may seek to provide or have engaged in providing corporate finance, investment banking or other advisory services in a merger or specific transaction to the companies referred to in this report, as on the date of this report or in the past. Neither Angel Broking Limited, nor its directors, employees or affiliates shall be liable for any loss or damage that may arise from or in connection with the use of this information. Note: Please refer to the important `Stock Holding Disclosure' report on the Angel website (Research Section). Also, please refer to the latest update on respective stocks for the disclosure status in respect of those stocks. Angel Broking Limited and its affiliates may have investment positions in the stocks recommended in this report. Disclosure of Interest Statement Persistent 1. Analyst ownership of the stock No 2. Angel and its Group companies ownership of the stock No 3. Angel and its Group companies' Directors ownership of the stock No 4. Broking relationship with company covered No Note: We have not considered any Exposure below `1 lakh for Angel, its Group companies and Directors Ratings (Returns): Buy (> 15%) Accumulate (5% to 15%) Neutral (-5 to 5%) Reduce (-5% to 15%) Sell (< -15%) July 18, 2011 15