Call Girls in New Ashok Nagar, (delhi) call me [9953056974] escort service 24X7
Derivatives Report-July 9, 2010
1. Derivative Report
India Research
July 09, 2010
Comments
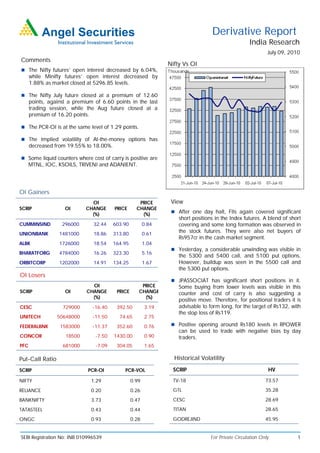
Nifty Vs OI
The Nifty futures’ open interest decreased by 6.04%,
while Minifty futures’ open interest decreased by
1.88% as market closed at 5296.85 levels.
The Nifty July future closed at a premium of 12.60
points, against a premium of 6.60 points in the last
trading session, while the Aug future closed at a
premium of 16.20 points.
The PCR-OI is at the same level of 1.29 points.
The Implied volatility of At-the-money options has
decreased from 19.55% to 18.00%.
Some liquid counters where cost of carry is positive are
MTNL, IOC, KSOILS, TRIVENI and ADANIENT.
OI Gainers
OI PRICE View
SCRIP OI CHANGE PRICE CHANGE
After one day halt, FIIs again covered significant
(%) (%)
short positions in the Index futures. A blend of short
CUMMINSIND 296000 32.44 603.90 0.84 covering and some long formation was observed in
UNIONBANK 1481000 18.86 313.80 0.61
the stock futures. They were also net buyers of
Rs957cr in the cash market segment.
ALBK 1726000 18.54 164.95 1.04
Yesterday, a considerable unwinding was visible in
BHARATFORG 4784000 16.26 323.30 5.16
the 5300 and 5400 call, and 5100 put options.
ORBITCORP 1202000 14.91 134.25 1.67 However, buildup was seen in the 5500 call and
the 5300 put options.
OI Losers
JPASSOCIAT has significant short positions in it.
OI PRICE Some buying from lower levels was visible in this
SCRIP OI CHANGE PRICE CHANGE counter and cost of carry is also suggesting a
(%) (%)
positive move. Therefore, for positional traders it is
CESC 729000 -16.40 392.50 3.19 advisable to form long, for the target of Rs132, with
the stop loss of Rs119.
UNITECH 50648000 -11.50 74.65 2.75
FEDERALBNK 1583000 -11.37 352.60 0.76 Positive opening around Rs180 levels in RPOWER
can be used to trade with negative bias by day
CONCOR 18500 -7.50 1430.00 0.90 traders.
PFC 681000 -7.09 304.05 1.65
Put-Call Ratio Historical Volatility
SCRIP PCR-OI PCR-VOL SCRIP HV
NIFTY 1.29 0.99 TV-18 73.57
RELIANCE 0.20 0.26 GTL 35.28
BANKNIFTY 3.73 0.47 CESC 28.69
TATASTEEL 0.43 0.44 TITAN 28.65
ONGC 0.93 0.28 GODREJIND 45.95
SEBI Registration No: INB 010996539 For Private Circulation Only 1
2. Derivative Report | India Research
FII Statistics for 08-July-2010 Turnover on 08-July-2010
Open Interest
No. of Turnover Change
Detail Buy Sell Net Instrument
Contracts (Rs. in cr.) (%)
Contracts Value Change
(Rs. in cr.) (%)
INDEX Index Futures 501257 12192.37 -4.53
2547.05 1092.17 1,454.88 633320 16719.48 -8.76
FUTURES
INDEX Stock Futures 454731 13128.44 -1.86
4630.99 4544.27 86.72 1871934 49538.29 0.90
OPTIONS
STOCK Index Options 1649381 43726.14 7.92
922.30 476.23 446.07 1125448 29612.57 0.19
FUTURES
STOCK Stock Options 84816 2559.95 7.18
90.99 102.52 (11.53) 47191 1308.96 3.91
OPTIONS
TOTAL 8191.33 6215.18 1,976.15 3677893 97179.30 -1.08 Total 2690185 71606.89 3.70
Nifty Spot = 5296.85 Lot Size = 50
Bull-Call Spreads Bear-Put Spreads
Action Strike Price Risk Reward BEP Action Strike Price Risk Reward BEP
Buy 5300 95.00 Buy 5200 55.70
49.45 50.55 5349.45 20.60 79.40 5179.40
Sell 5400 45.55 Sell 5100 35.10
Buy 5300 95.00 Buy 5200 55.70
77.70 122.30 5377.70 34.20 165.80 5165.80
Sell 5500 17.30 Sell 5000 21.50
Buy 5400 45.55 Buy 5100 35.10
28.25 71.75 5428.25 13.60 86.40 5086.40
Sell 5500 17.30 Sell 5000 21.50
Note: Above mentioned Bullish or Bearish Spreads in Nifty (July Series) are given as an information and not as a recommendation
Nifty Put-Call Analysis
For Private Circulation Only SEBI Registration No: INB 010996539 2
3. Derivative Report | India Research
Strategy Date Scrip Strategy Status
28-June-2010 Reliance Long Put Continue
05-July 2010 Nifty Put Hedge Continue
DISCLAIMER:
This document is not for public distribution and has been furnished to you solely for your information and must not be reproduced or redistributed to any other person.
Persons into whose possession this document may come are required to observe these restrictions.
Opinion expressed is our current opinion as of the date appearing on this material only. While we endeavor to update on a reasonable basis the information discussed in
this material, there may be regulatory, compliance, or other reasons that prevent us from doing so. Prospective investors and others are cautioned that any forward-
looking statements are not predictions and may be subject to change without notice. Our proprietary trading and investment businesses may make investment decisions
that are inconsistent with the recommendations expressed herein.
The information in this document has been printed on the basis of publicly available information, internal data and other reliable sources believed to be true and are for
general guidance only. While every effort is made to ensure the accuracy and completeness of information contained, the company takes no guarantee and assumes no
liability for any errors or omissions of the information. No one can use the information as the basis for any claim, demand or cause of action.
Recipients of this material should rely on their own investigations and take their own professional advice. Each recipient of this document should make such investigations
as it deems necessary to arrive at an independent evaluation of an investment in the securities of companies referred to in this document (including the merits and risks
involved), and should consult their own advisors to determine the merits and risks of such an investment. Price and value of the investments referred to in this material may
go up or down. Past performance is not a guide for future performance.
Certain transactions - futures, options and other derivatives as well as non-investment grade securities - involve substantial risks and are not suitable for all investors.
Reports based on technical analysis centers on studying charts of a stock's price movement and trading volume, as opposed to focusing on a company's fundamentals and
as such, may not match with a report on a company's fundamentals.
We do not undertake to advise you as to any change of our views expressed in this document. While we would endeavor to update the information herein on a reasonable
basis, Angel Broking, its subsidiaries and associated companies, their directors and employees are under no obligation to update or keep the information current. Also
there may be regulatory, compliance, or other reasons that may prevent Angel Broking and affiliates from doing so. Prospective investors and others are cautioned that
any forward-looking statements are not predictions and may be subject to change without notice.
Angel Broking Limited and affiliates, including the analyst who has issued this report, may, on the date of this report, and from time to time, have long or short positions
in, and buy or sell the securities of the companies mentioned herein or engage in any other transaction involving such securities and earn brokerage or compensation or
act as advisor or have other potential conflict of interest with respect to company/ies mentioned herein or inconsistent with any recommendation and related information
and opinions.
Angel Broking Limited and affiliates may seek to provide or have engaged in providing corporate finance, investment banking or other advisory services in a merger or
specific transaction to the companies referred to in this report, as on the date of this report or in the past.
Sebi Registration No.: INB 010996539
Derivative Research Team derivatives.desk@angeltrade.com
For Private Circulation Only SEBI Registration No: INB 010996539 3