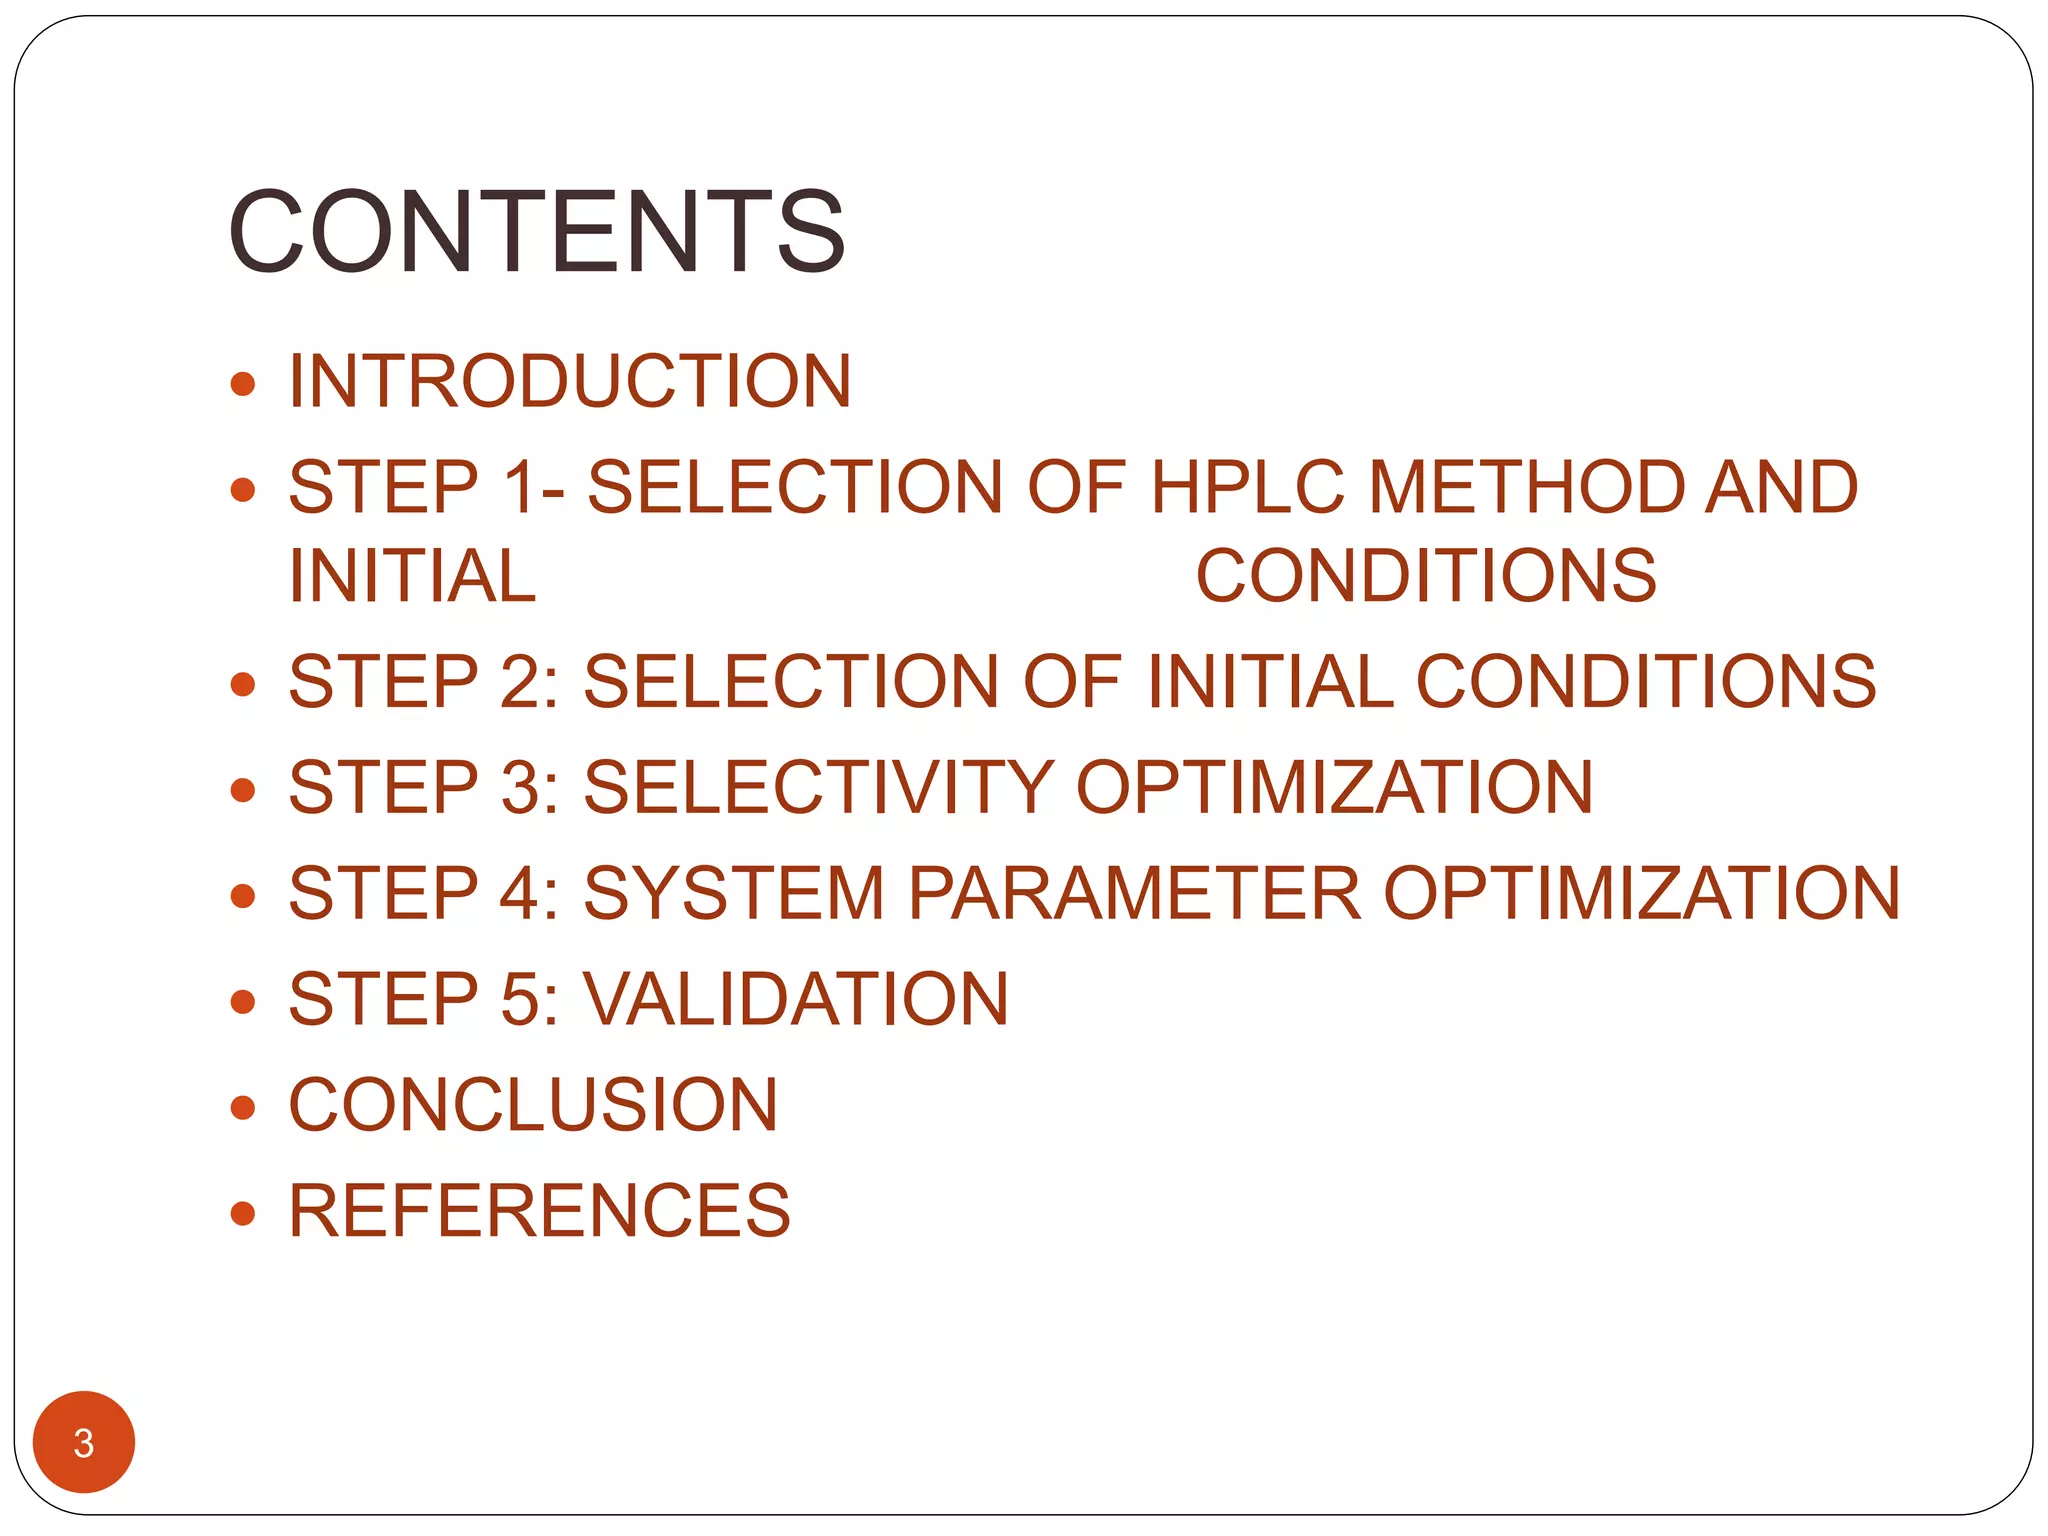
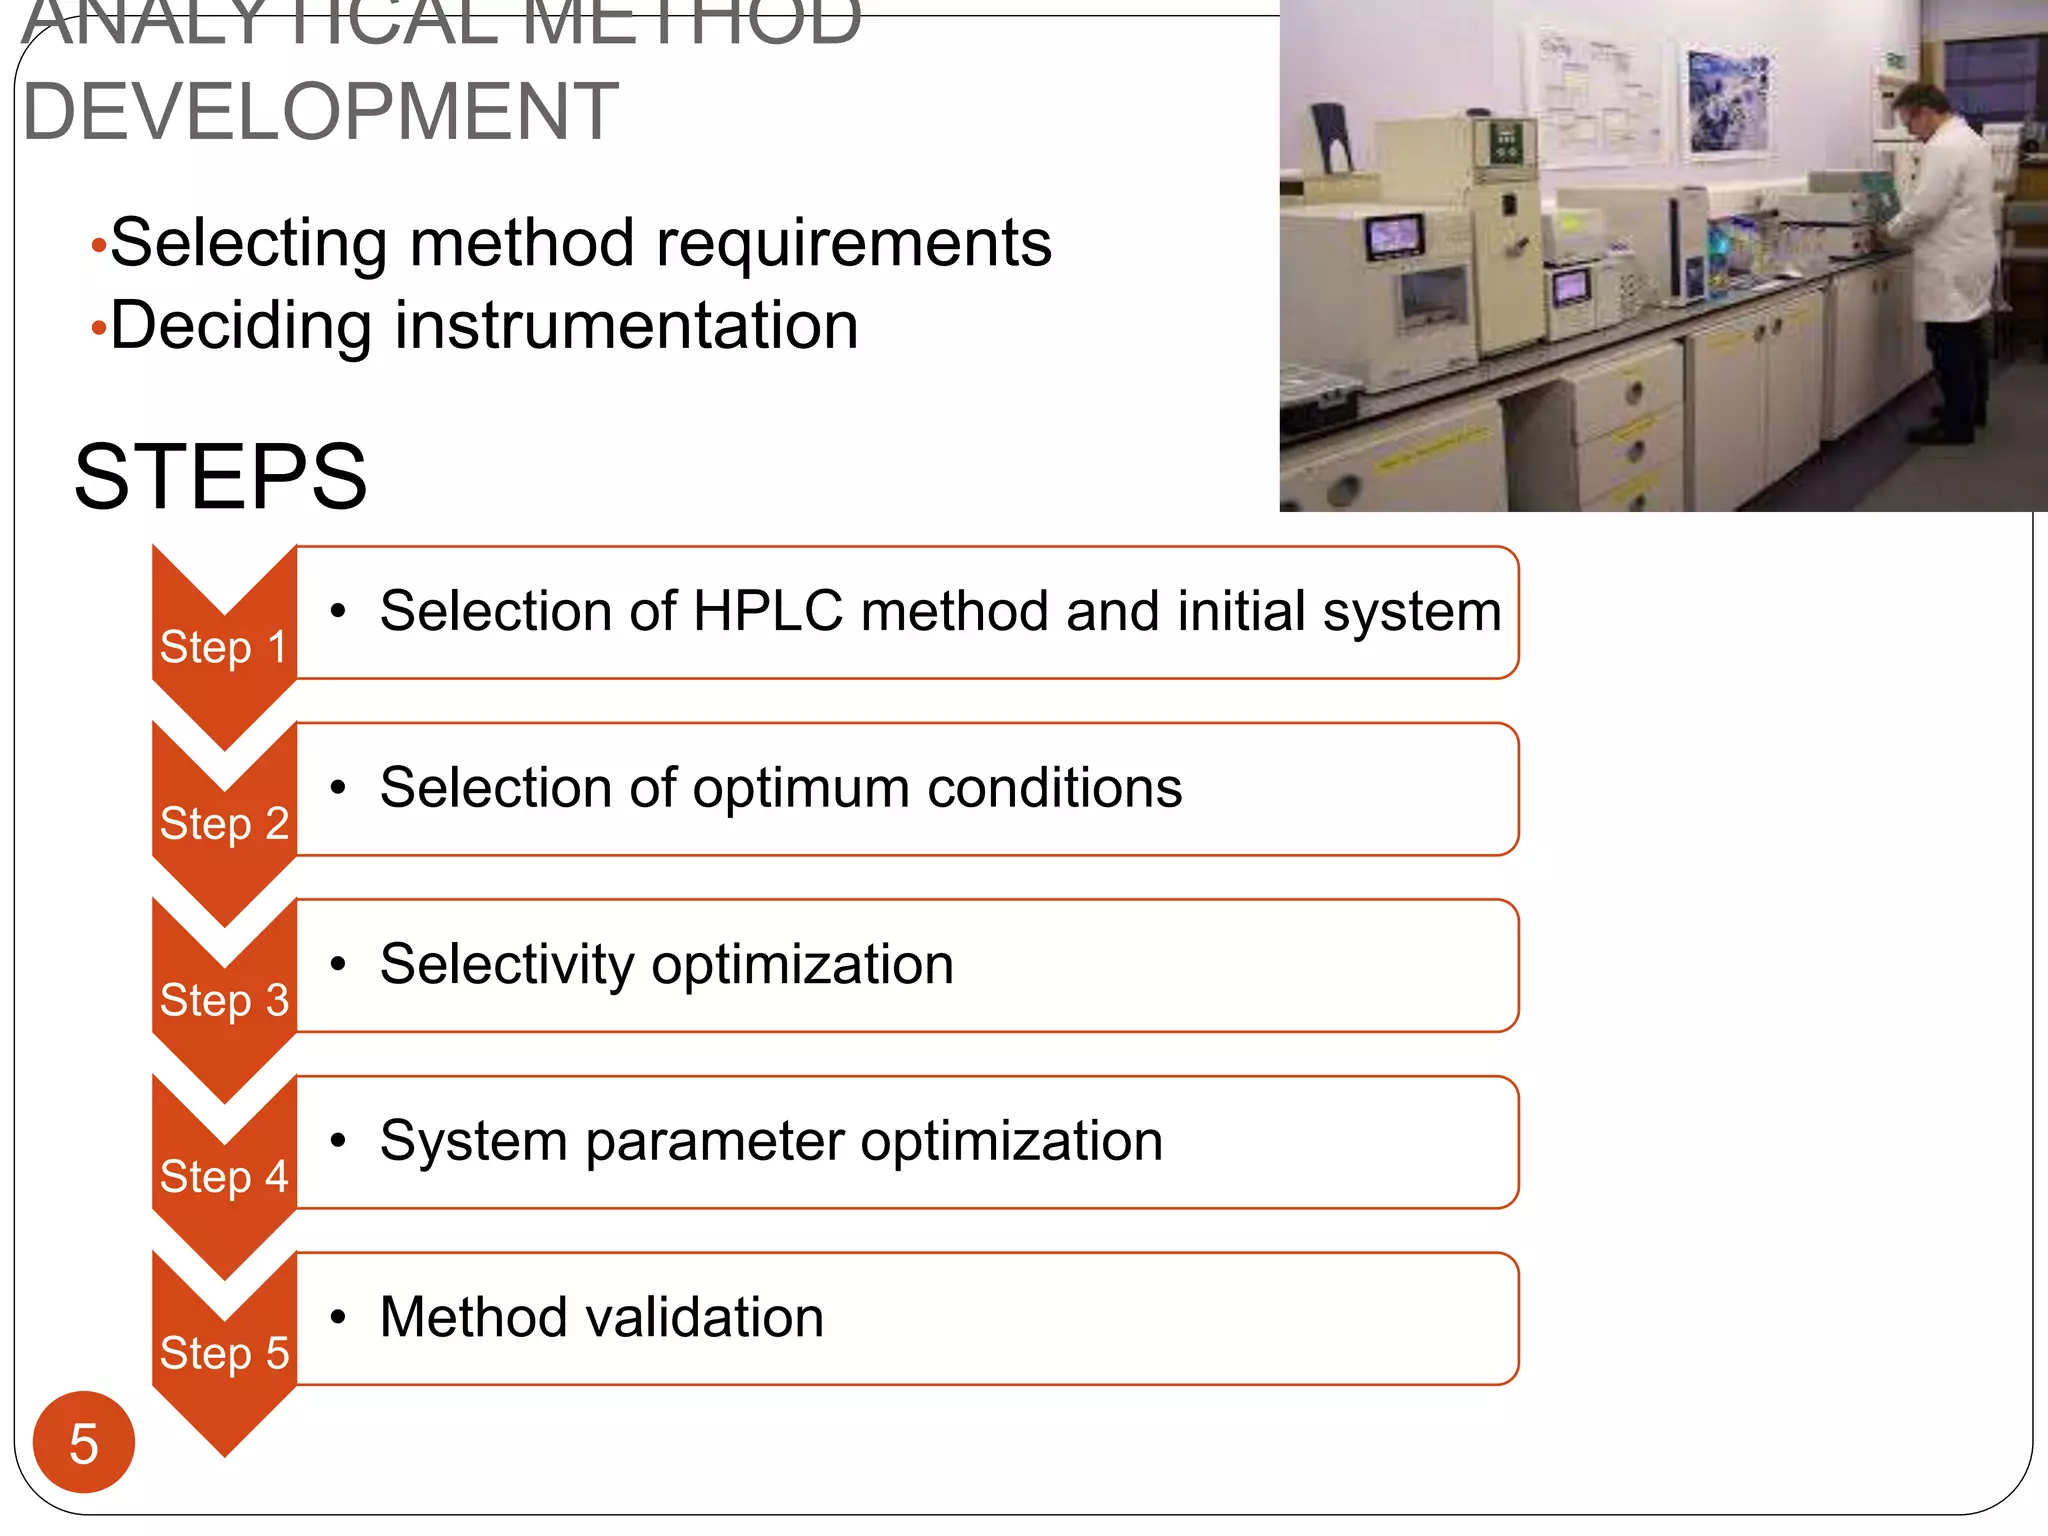
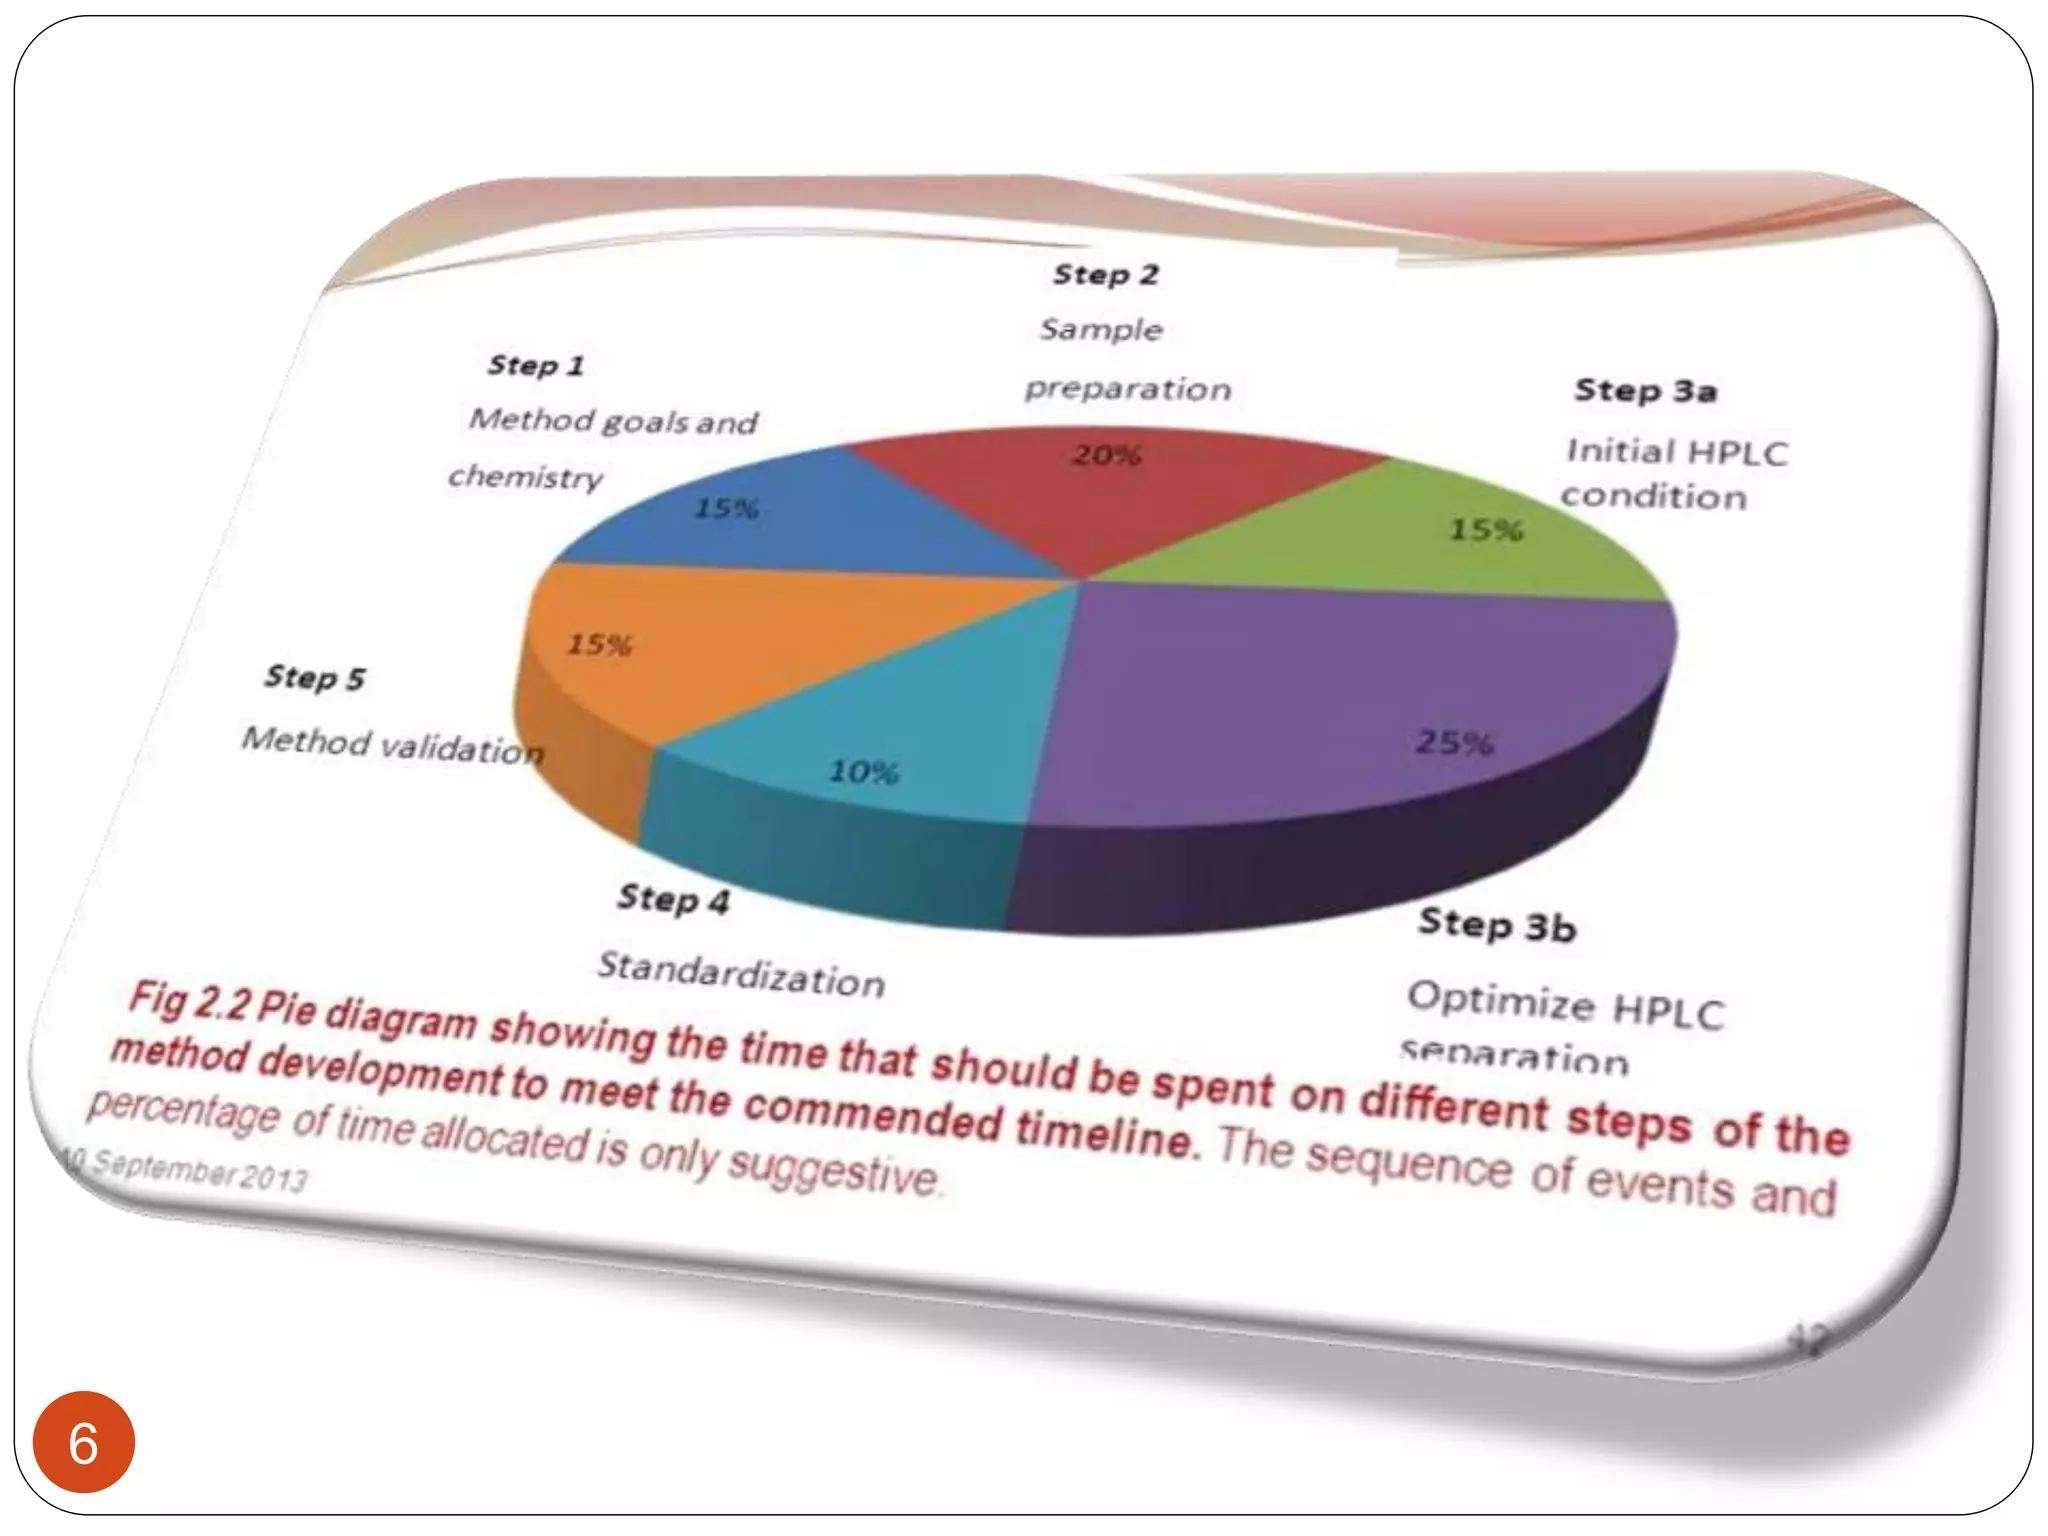
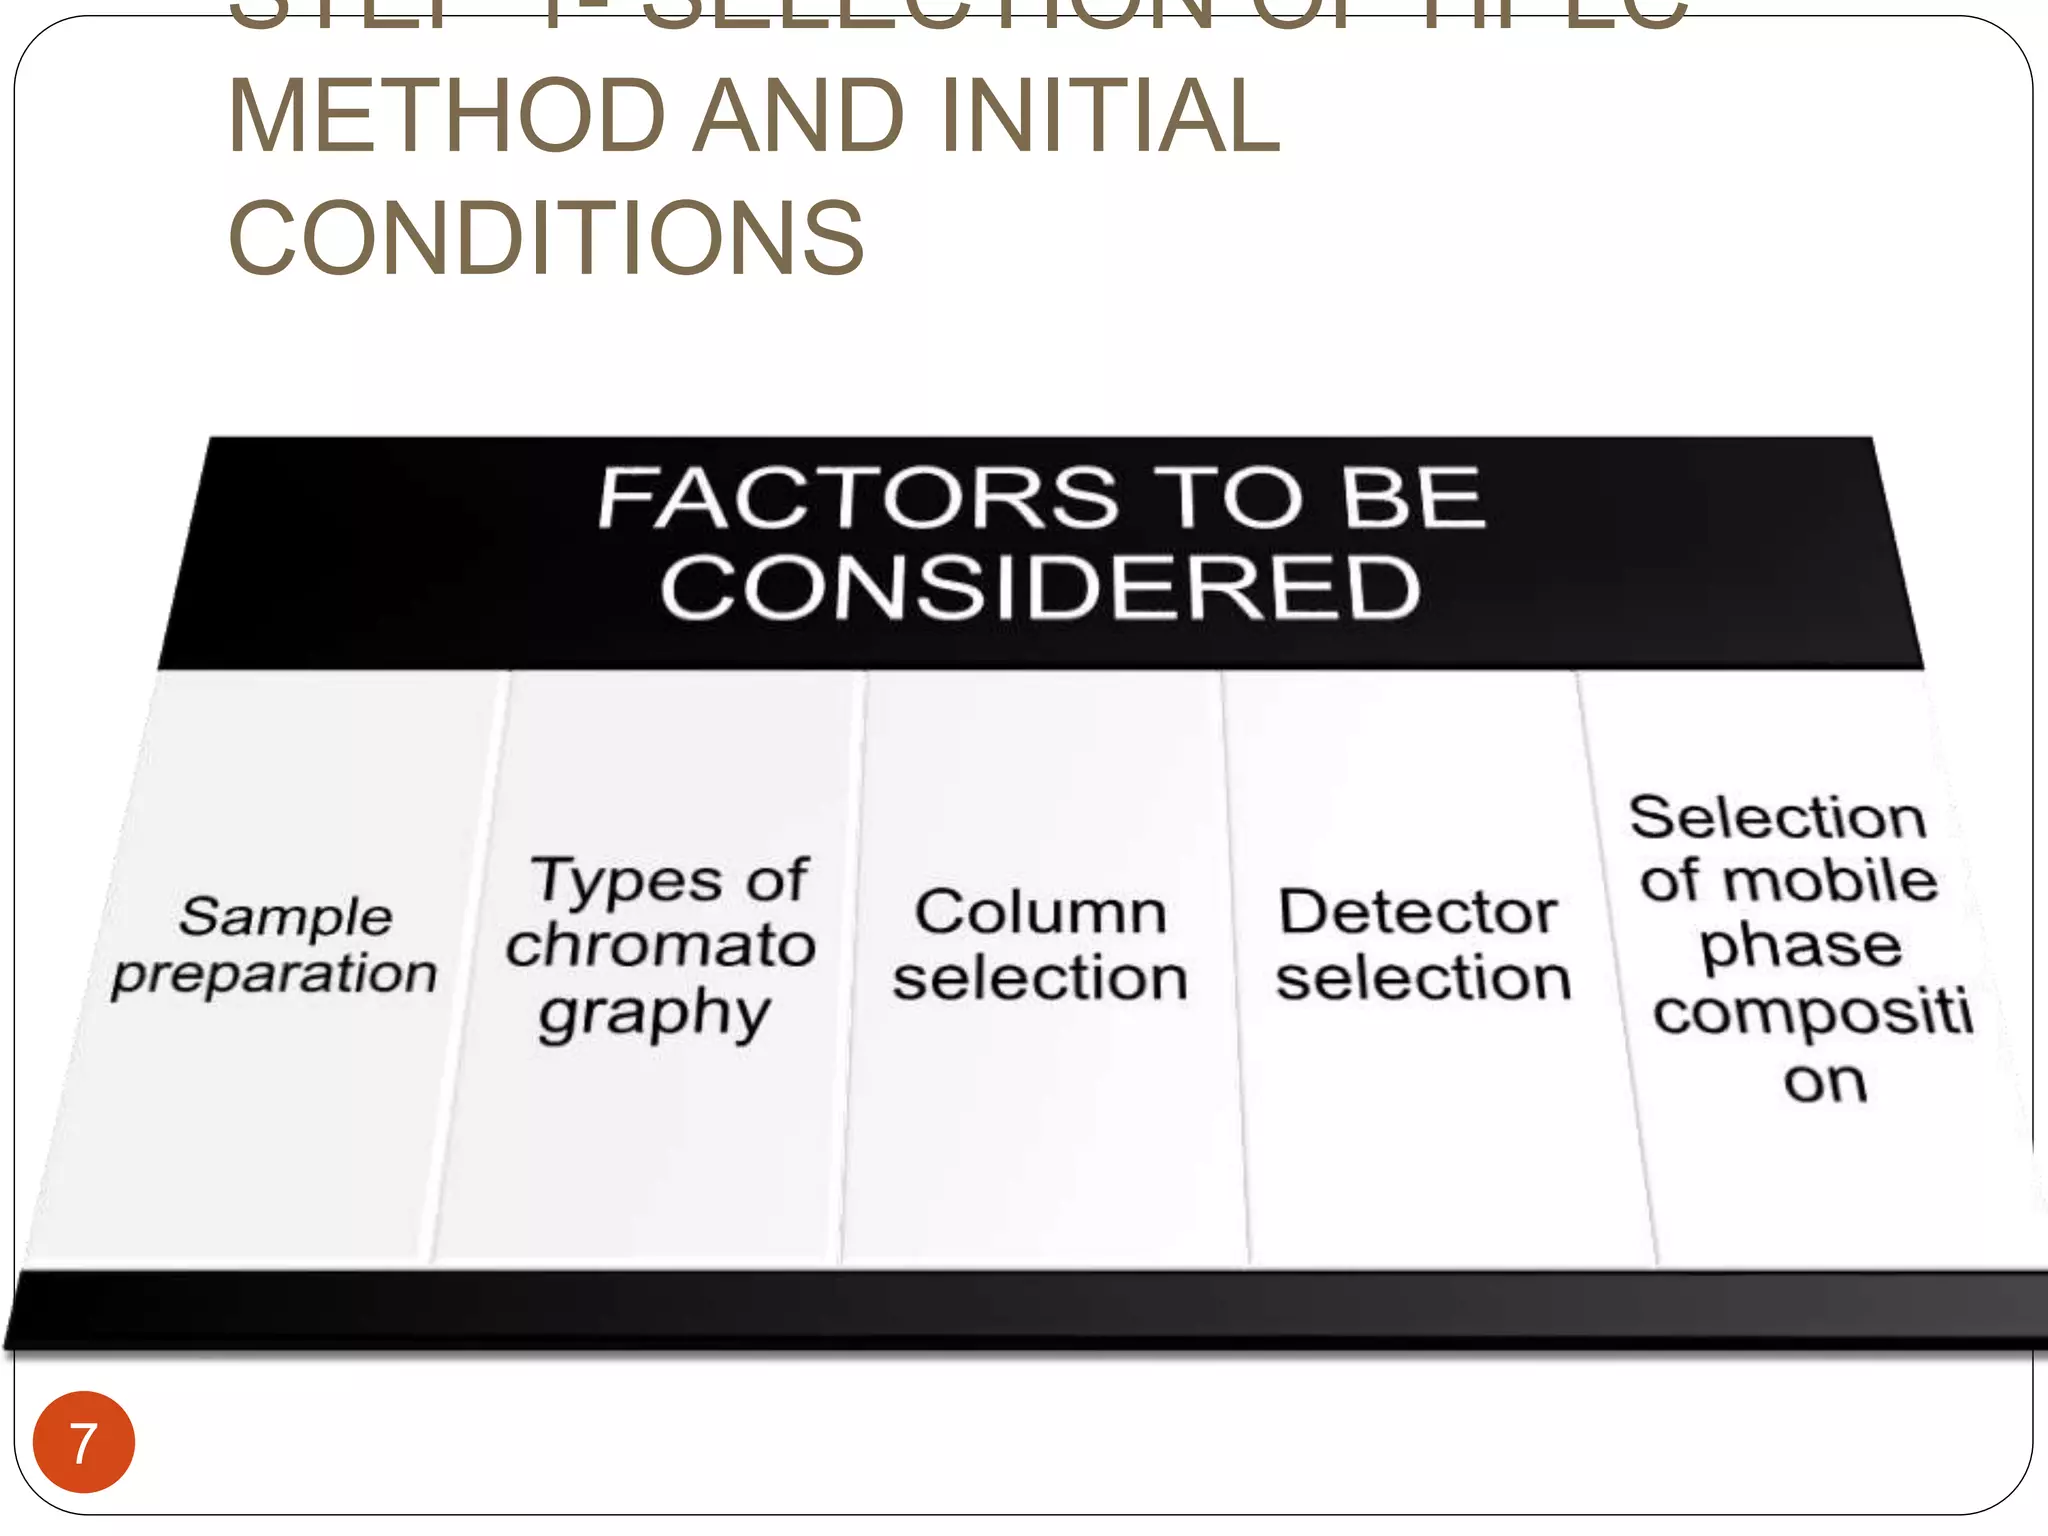
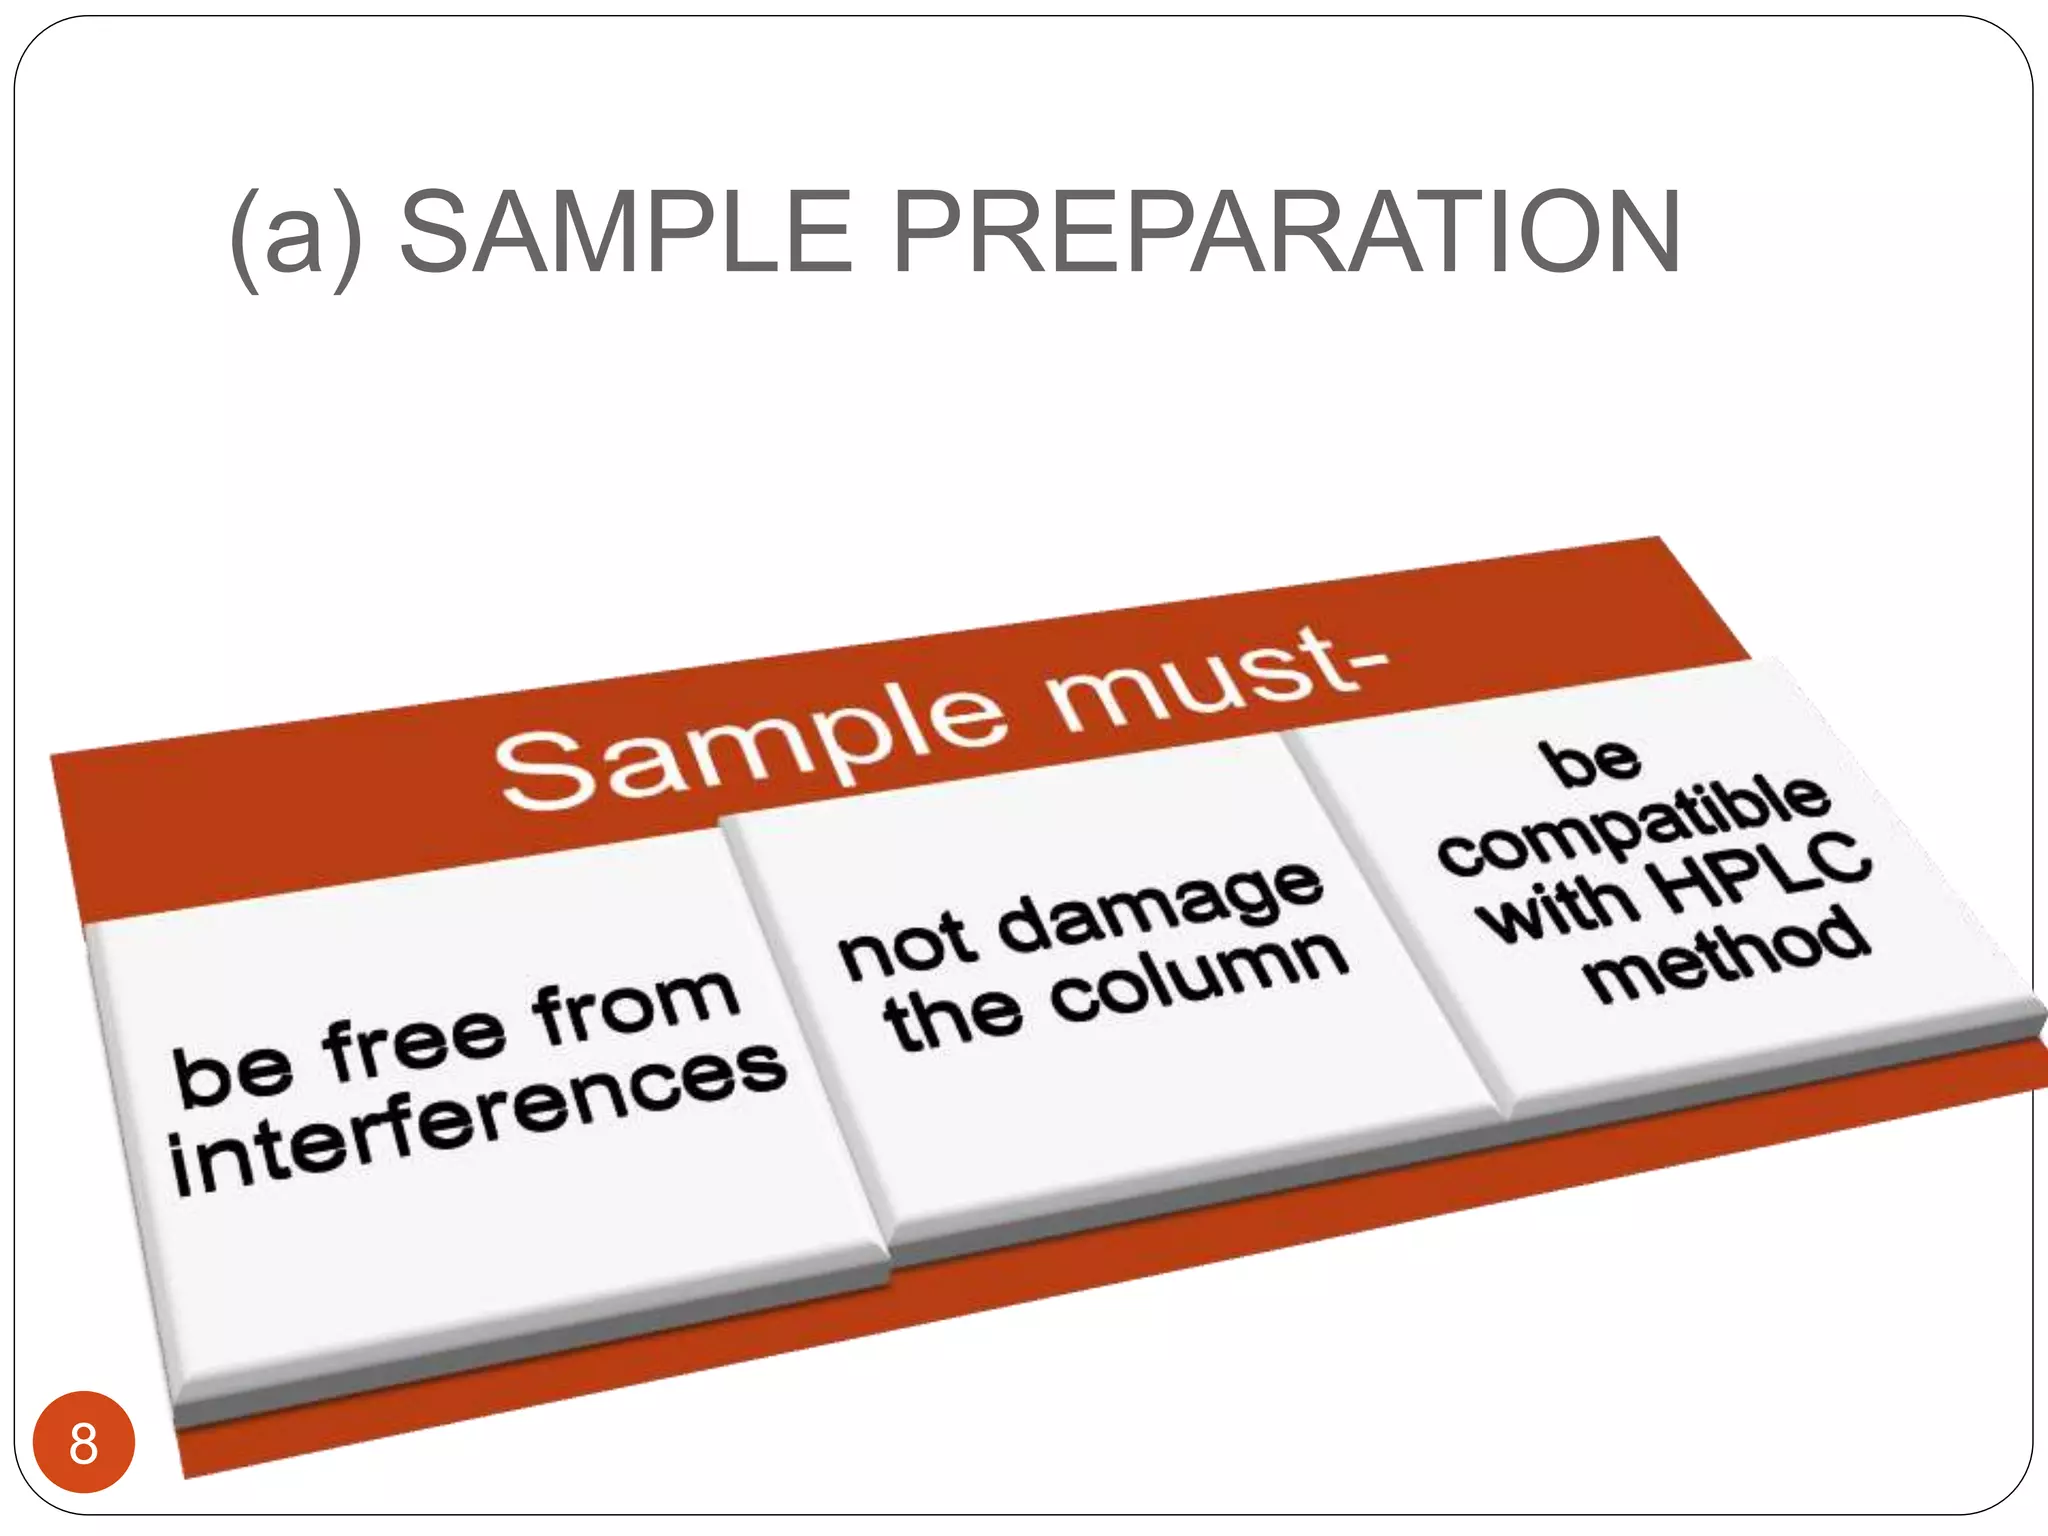
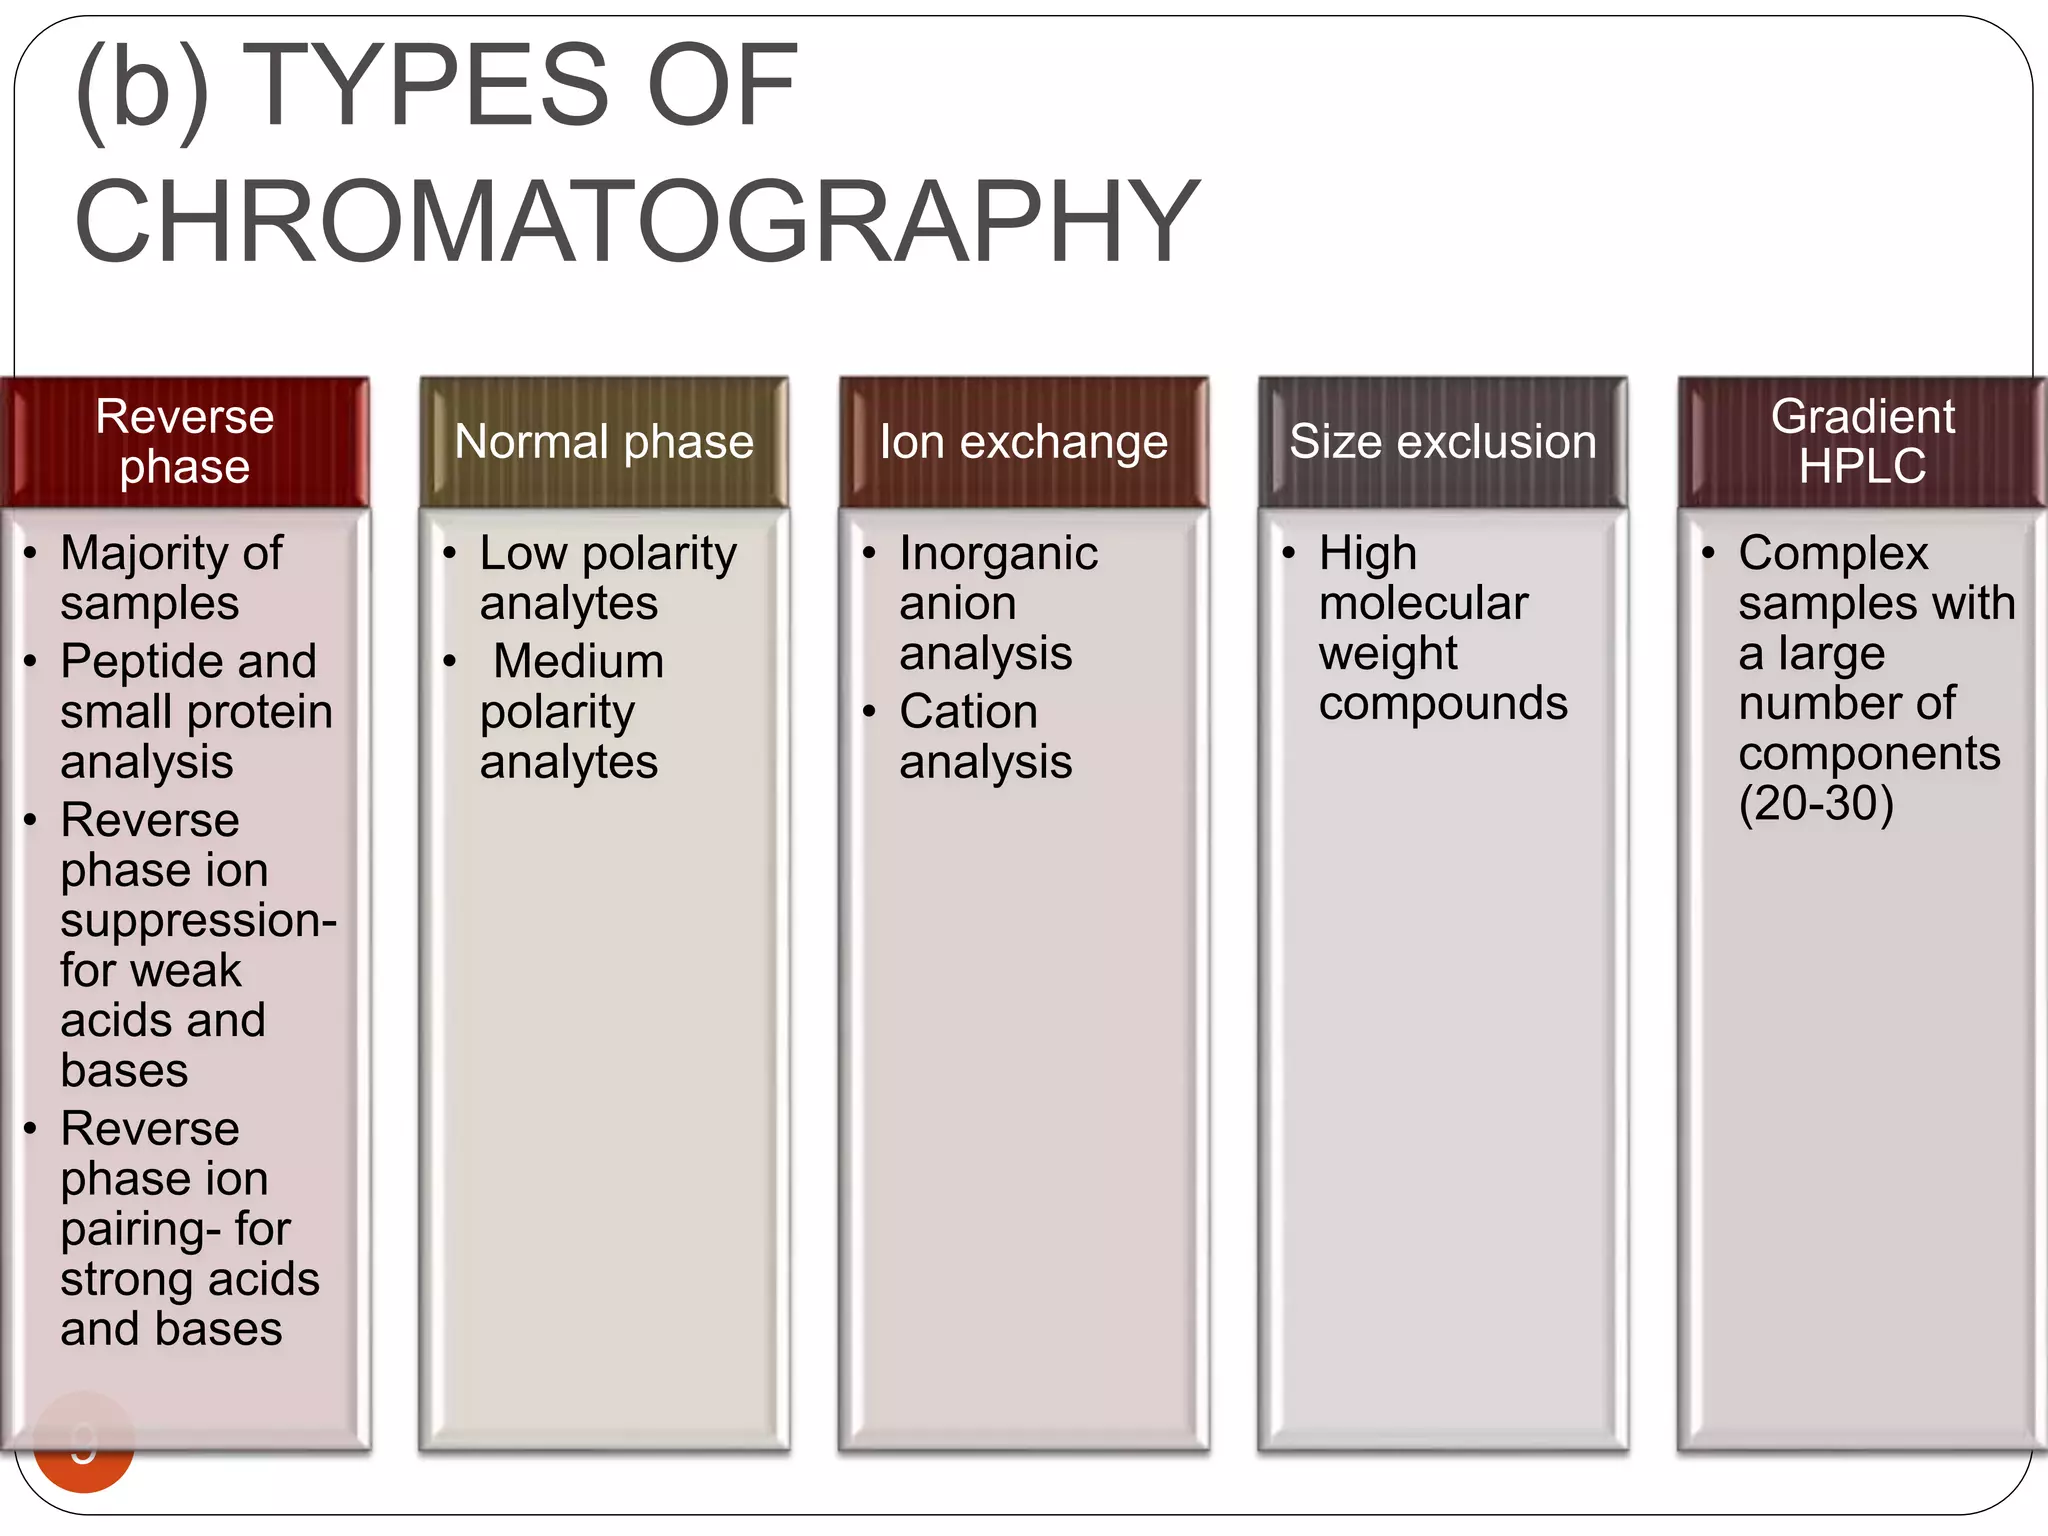
1
2
PRESENTED BY: AMEENA MEHAB
Ist YEAR MPHAR
St. JOSEPH COLLEGE OF PHARM
CONTENTS
3
 INTRODUCTION
 STEP 1- SELECTION OF HPLC METHOD AND
INITIAL CONDITIONS
 STEP 2: SELECTION OF INITIAL CONDITIONS
 STEP 3: SELECTIVITY OPTIMIZATION
 STEP 4: SYSTEM PARAMETER OPTIMIZATION
 STEP 5: VALIDATION
 CONCLUSION
 REFERENCES
INTRODUCTIO
N
HPLC is High Performance Liquid
Chromatography.
4
Improved
resolution
Faster
separation
Improved
accuracy,
precision and
sensitivity
ADVANTAGES
ANALYTICAL METHOD
DEVELOPMENT
•Selecting method requirements
•Deciding instrumentation
5
STEPS
Step 1
• Selection of HPLC method and initial system
Step 2
• Selection of optimum conditions
Step 3
• Selectivity optimization
Step 4
• System parameter optimization
Step 5
• Method validation
6
STEP 1- SELECTION OF HPLC
METHOD AND INITIAL
CONDITIONS
7
(a) SAMPLE PREPARATION
8
(b) TYPES OF
CHROMATOGRAPHY
9
Reverse
phase
• Majority of
samples
• Peptide and
small protein
analysis
• Reverse
phase ion
suppression-
for weak
acids and
bases
• Reverse
phase ion
pairing- for
strong acids
and bases
Normal phase
• Low polarity
analytes
• Medium
polarity
analytes
Ion exchange
• Inorganic
anion
analysis
• Cation
analysis
Size exclusion
• High
molecular
weight
compounds
Gradient
HPLC
• Complex
samples with
a large
number of
components
(20-30)
(c) COLUMN SELECTION
10
Interaction of
components
with packing
material
Properties of
packing material
Knowledge
of sample
Packing material
11
COLUMN DIMENSIONS
12
• Short (30-50 mm) –short run times, low
backpressure
• Long (250-300mm) –higher resolution, long run times
• Narrow – higher detector sensitivity
• Wide (10-22mm) –high sample loading
(d) DETECTOR
SELECTION
13
UV DETECTOR
• Detects only substances which absorb light in UV wavelength
range
• Detects all samples which contain chromophores
FLOURESCENCE DETECTOR
• Detects eluted solutes on basis of flourescence
• For trace analysis
ELECTRICAL CONDUCTIVITY DETECTOR
• Used with ion suppressor column
• To allow salts and buffers to be used in mobile phase without
affecting detector output
REFRACTIVE INDEX DETECTOR
• Least sensitive
• Only when other detectors are inappropriate
• Can handle concentration without overloading the detector
(e) MOBILE PHASE
SELECTION
14
• Organic phase concentration required for mobile
phase can be estimated by gradient elution method.
•Elution strength of mobile phase depends upon its
polarity.
•Ionic samples can be separated if they are present in
undissociated form.
•If retention time is too long, increase in organic phase
concentration is required.
•If tailing or fronting occurs, the mobile phase is not
totally compatible with the solutes.
STEP 2: SELECTION OF INITIAL
CONDITIONS
15
 This step determines the optimum conditions to
adequately retain all analytes.
o No analyte has a capacity factor of less than 0.5
o No analyte has a capacity factor of greater than 10-
15
Determination of initial conditions-
 By performing 2 gradient runs differing in only the run
time
 Binary system based on either acetonitrile/water or
methanol/water should be used.
STEP 3: SELECTIVITY
OPTIMIZATION
16
 Aim: To achieve adequate selectivity
 Mobile phase and stationary phase compositions
are taken into account
 To select these, the nature of analytes must be
considered
 Once the analyte types are identified, the relevant
optimization parameters may be selected
STEP 4: SYSTEM PARAMETER
OPTIMIZATION
17
 Used to find the desired balance between
resolution and analysis time.
 Parameters involved include column dimensions,
column packing, particle size, flow rate
 Parameters maybe changed without affecting
capacity factors or selectivity
TYPES OF OPTIMIZATION
18
• By change in initial mobile phase
composition and slope of gradient
according to chromatogram
obtained in the preliminary run
MANUALLY
• Experimental design
• Multi criteria decision making
USING
SOFTWARES
STEP 5: STEP 5: VALIDATION
19
 The objective of an analytical procedure is to
demonstrate that it is suitable for its intended
purpose
CONCLUSION
20
 Best column, best mobile phase, best detection
wavelength, efforts in their selection can make a
world of difference while developing HPLC method
for routine analysis.
 Determining the ideal combination of these factors
assure faster delivery of desired results- a validated
method for separation.
REFERENCES
21
 Instrumental methods of chemical analysis,
Gurdeep R Chatwal, Sham K Anand, Page no
2.624-2.639
 HPLC- Quantitative analysis of pharmaceutical
formulations, PD Sethi, Page no 11-16
22

HPLC method development

  • 1.
  • 2.
    2 PRESENTED BY: AMEENAMEHAB Ist YEAR MPHAR St. JOSEPH COLLEGE OF PHARM
  • 3.
    CONTENTS 3  INTRODUCTION  STEP1- SELECTION OF HPLC METHOD AND INITIAL CONDITIONS  STEP 2: SELECTION OF INITIAL CONDITIONS  STEP 3: SELECTIVITY OPTIMIZATION  STEP 4: SYSTEM PARAMETER OPTIMIZATION  STEP 5: VALIDATION  CONCLUSION  REFERENCES
  • 4.
    INTRODUCTIO N HPLC is HighPerformance Liquid Chromatography. 4 Improved resolution Faster separation Improved accuracy, precision and sensitivity ADVANTAGES
  • 5.
    ANALYTICAL METHOD DEVELOPMENT •Selecting methodrequirements •Deciding instrumentation 5 STEPS Step 1 • Selection of HPLC method and initial system Step 2 • Selection of optimum conditions Step 3 • Selectivity optimization Step 4 • System parameter optimization Step 5 • Method validation
  • 6.
  • 7.
    STEP 1- SELECTIONOF HPLC METHOD AND INITIAL CONDITIONS 7
  • 8.
  • 9.
    (b) TYPES OF CHROMATOGRAPHY 9 Reverse phase •Majority of samples • Peptide and small protein analysis • Reverse phase ion suppression- for weak acids and bases • Reverse phase ion pairing- for strong acids and bases Normal phase • Low polarity analytes • Medium polarity analytes Ion exchange • Inorganic anion analysis • Cation analysis Size exclusion • High molecular weight compounds Gradient HPLC • Complex samples with a large number of components (20-30)
  • 10.
    (c) COLUMN SELECTION 10 Interactionof components with packing material Properties of packing material Knowledge of sample
  • 11.
  • 12.
    COLUMN DIMENSIONS 12 • Short(30-50 mm) –short run times, low backpressure • Long (250-300mm) –higher resolution, long run times • Narrow – higher detector sensitivity • Wide (10-22mm) –high sample loading
  • 13.
    (d) DETECTOR SELECTION 13 UV DETECTOR •Detects only substances which absorb light in UV wavelength range • Detects all samples which contain chromophores FLOURESCENCE DETECTOR • Detects eluted solutes on basis of flourescence • For trace analysis ELECTRICAL CONDUCTIVITY DETECTOR • Used with ion suppressor column • To allow salts and buffers to be used in mobile phase without affecting detector output REFRACTIVE INDEX DETECTOR • Least sensitive • Only when other detectors are inappropriate • Can handle concentration without overloading the detector
  • 14.
    (e) MOBILE PHASE SELECTION 14 •Organic phase concentration required for mobile phase can be estimated by gradient elution method. •Elution strength of mobile phase depends upon its polarity. •Ionic samples can be separated if they are present in undissociated form. •If retention time is too long, increase in organic phase concentration is required. •If tailing or fronting occurs, the mobile phase is not totally compatible with the solutes.
  • 15.
    STEP 2: SELECTIONOF INITIAL CONDITIONS 15  This step determines the optimum conditions to adequately retain all analytes. o No analyte has a capacity factor of less than 0.5 o No analyte has a capacity factor of greater than 10- 15 Determination of initial conditions-  By performing 2 gradient runs differing in only the run time  Binary system based on either acetonitrile/water or methanol/water should be used.
  • 16.
    STEP 3: SELECTIVITY OPTIMIZATION 16 Aim: To achieve adequate selectivity  Mobile phase and stationary phase compositions are taken into account  To select these, the nature of analytes must be considered  Once the analyte types are identified, the relevant optimization parameters may be selected
  • 17.
    STEP 4: SYSTEMPARAMETER OPTIMIZATION 17  Used to find the desired balance between resolution and analysis time.  Parameters involved include column dimensions, column packing, particle size, flow rate  Parameters maybe changed without affecting capacity factors or selectivity
  • 18.
    TYPES OF OPTIMIZATION 18 •By change in initial mobile phase composition and slope of gradient according to chromatogram obtained in the preliminary run MANUALLY • Experimental design • Multi criteria decision making USING SOFTWARES
  • 19.
    STEP 5: STEP5: VALIDATION 19  The objective of an analytical procedure is to demonstrate that it is suitable for its intended purpose
  • 20.
    CONCLUSION 20  Best column,best mobile phase, best detection wavelength, efforts in their selection can make a world of difference while developing HPLC method for routine analysis.  Determining the ideal combination of these factors assure faster delivery of desired results- a validated method for separation.
  • 21.
    REFERENCES 21  Instrumental methodsof chemical analysis, Gurdeep R Chatwal, Sham K Anand, Page no 2.624-2.639  HPLC- Quantitative analysis of pharmaceutical formulations, PD Sethi, Page no 11-16
  • 22.