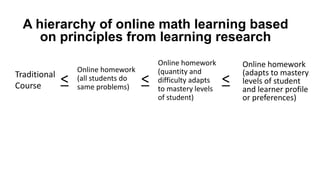
Learning at Scale
Using Research To Improve Learning Practices
and Technology for Teaching Math
Maria H. Andersen, Ph.D.
Chief Troublemaker, Edge of Learning
Math Faculty, Westminster College
What have we
learned?
10 Lessons
from
Learning at
Scale
Stand up if you know what a
MOOC is.
Stay standing if you have ever
signed up for a MOOC.
Stay standing if you have ever
finished a MOOC.
HarvardX and MITx: Four Years of Open
Online Courses
Authors: I. Chuang, A. Ho
Published: 2016
Study size: 4.4 million students across 290 MOOCs
If a MOOC held 100 students …
(Chuang & Ho, 2016)
(Chuang & Ho, 2016)
How many times a year do
you get a chance to start
over?
1. We need to improve
findability.
Learners are in the maze, and
they can’t see the big picture.
Many of you have
been in a maze like
what our students
experience.
Wouldn’t it be nice to
have a transporter to
get right to where
you want to go?
Why don’t students
seem to be able to
find information that
is clearly printed in
the syllabus?
The impact of findability on student motivation, self-
efficacy, and perceptions of online course quality
Authors: B. Simunich, D. Robins & V. Kelly
Published: 2015
Study size: n=81, students had to complete 7 tasks, navigating either a
well-constructed course (according to QM) or a “broken”
course
What else can we do to help
learners navigate this maze?
Help students to build a physical
map to anchor memories as they
learn.
7.00x Introduction to Biology: The Secret of
Life MITx on EdX Course Report - 2013 Spring
Authors: D. Seaton, J. Reich, S. Nesterko, et al.
Published: 2014
Study size: 38k signups, 3K certified
(Seaton et al, 2014)
6.00x Introduction to Computer Science and
Programming MITx on edX – 2012 Fall
Authors: S. Features, P. Grimson, J. Guttag
Published: 2014
Study size: 84.5k signups, 5.7K certified
14.73x The Challenges of Global Poverty
MITx on edX – 2013 Spring
Authors: P. Black, P. White
Published: 2014
Study size: 40k signups, 4.6K certified
(Seaton et al, 2014)
Introduction to Biology
(Features et al, 2014)
Introduction to Computer Science and Programming
(Black & White, 2014)
The Challenges of Global Poverty
Examining Engagement: Analysing Learner
Subpopulations in MOOCs
Authors: R. Ferguson, D. Clow
Published: 2015
Study size: 34k signups, 7k full participants, 4 MOOCs
(Ferguson & Clow, 2015)
HarvardX and MITx: Four Years of Open
Online Courses
Authors: I. Chuang, A. Ho
Published: 2016
Study size: 4.4 million students across 290 MOOCs
Find
Calculus.
(Chuang & Ho, 2016)
2. Students need to be coerced
into more frequent engagement.
Are you ever surprised by things
you can find on the Internet?
Stand up if you know who the
Borg are.
Stay standing if you’ve ever done an
internet search for a cat in a Borg
costume.
3. Use an
online math
learning
system.
Traditional
Course
Online homework
(quantity and
difficulty adapts
to mastery levels
of student)
Online homework
(all students do
same problems)
< <
A hierarchy of online math learning based
on principles from learning research
Online homework
(adapts to mastery
levels of student
and learner profile
or preferences)
<
Supports each
students’ pace
Interaction around content
Frequent accountability
Immediate feedback
Learning is not a spectator sport: doing is better
than watching for learning from a MOOC
Authors: K. Koedinger, J. Kim, J. Jia, et al
Published: 2015
Study size: 27k registrants, 1k completers, “Introduction to
Psychology as a Science” delivered through Coursera and
OLI platform
Our digital lives are with us everywhere,
our learning should be too.
Stand up if you teach online or
rely heavily on digital learning
materials.
Stay standing if you think it’s easy to
get students to participate in these.
Stay standing if you use discussion
boards with your students.
4. Get students to
participate in their learning
community.
1-9-90 Rule
1% creators
9% commenters/sharers
90% lurkers
Comments in MOOCs: who is doing the
talking and does it help?
Authors: B. Swinnerton, S. Hotchkiss & N.P. Morris
Published: 2017
Study size: 25k active learners, 8k commenters, 5k students who
completed a pre-course survey (roughly half commenters
and half non-commenters)
Predicting Student Retention in Massive Open
Online Courses using Hidden Markov Models
Authors: G. Balakrishnan
Published: 2013
Study size: 30k enrolled students in “Software as a Service” MOOC
(Balakrishnan, 2013)
Commenting in discussion boards
(Balakrishnan, 2013)
Commenting in discussion boards
(Balakrishnan, 2013)
Lurking in discussion boards
Use
announcements
to showcase great
discussion posts.
5. Use personas to
strategize about
interventions.
Using Data Mining to Differentiate Instruction
in College Algebra
Authors: R. Manspeaker
Published: 2011
Study size: 524 students in College Algebra using digital homework,
over 2 semesters
(Manspeaker, 2011)
Overachievers (OA)
Characteristics What do they struggle with?
• see mathematics as useful
• do not see how the class
specifically applies to their
lives
• high grades in math
• non-standard problems
• problems not found on
homework or worked in class
Underachievers (UA)
Characteristics What do they struggle with?
• Intelligent and well-
prepared
• Bored and frustrated with
the course
• Do reasonably well on the
first exam
• Procedural and non-standard
problems
• Get low scores in most
aspects of the course
• High risk for dropping out
(Manspeaker, 2011)
“Employees” (E)
Characteristics What do they struggle with?
• Feel the class is a menial job
for which they get “paid”
with a passing grade
• Dislike math
• Learn through memorizing
• Excel at procedural
problems
• Problems involving creative
thinking or independent
thought
• Attendance (starts strong,
then drops)
(Manspeaker, 2011)
(Manspeaker, 2011)
Rote Memorizers (RM)
Characteristics What do they struggle with?
• Rely on memorizing to get
through math
• Negative views of math
which will get worse over
time
• Poorest scores
• Emporium-style courses
• Everything
Sisyphean Strivers (SS)
Characteristics What do they struggle with?
• Excellent Attendance
• Do well on written
homework
• Have high understanding of
math if interviewed
• Do very poorly on exams
• Non-standard questions
• Application problems
• Exams
• Online homework
(Manspeaker, 2011)
Stand up if students drop your
classes.
Stay standing if the digital systems
you use make it easy to see which
students you should intervene with.
Stay standing if you have strategies
in place to try to intervene before
disengagement.
6. Anticipate and catch
students as they fall off the
path to success.
Community Insights: Emerging Benchmarks &
Student Success Trends from across the Civitas
Authors: Civitas Learning
Published: 2016
Study size: 2 million learners, 55 colleges
LMS activity in the first 14 days
Persistence: 92%
(or more)
Persistence: 76%
LMS activity in the first 14 days
Persistence: 47%
LMS activity in the first 14 days
Using Bayesian Learning to Classify College
Algebra Students by Understanding in Real-Time
Authors: A. Cousino
Published: 2013
Study size: 505 students over 2 semesters
(Cousino, 2013)
Examining Engagement: Analysing Learner
Subpopulations in MOOCs
Authors: R. Ferguson, D. Clow
Published: 2015
Study size: 34k signups, 7k full participants, 4 MOOCs
(Ferguson & Clow, 2015)
Samplers Visit, but only briefly (commented in some courses)
Strong Starters Complete the first week, but then dropout
Returners Made it through 2 weeks, but then dropout
Midway Dropouts Dropped out around assessment 3 or 4
Nearly There’s Made it through ¾ of the course, then dropped
Late Completers Completed course, but submitted things late
Keen Completers Completed course, mostly on time (>80%)
(Ferguson & Clow, 2015)
(Graph generated from data in Ferguson & Clow, 2015)
Deconstructing Disengagement: Analyzing Learner
Subpopulations in Massive Open Online Courses
Authors: R. Kizilcec, C. Piech, E. Schneider
Published: 2013
Study size: 94k active learners in 3 computer science MOOCs
7. Courses need a
catch-up option.
Why don’t we
offer 1-2 week
”slipped
schedule”
courses?
This might
mean the
courses have
to be offered
on 12-week
schedules.
8. Tweak instructional videos.
How Video Production Affects Student
Engagement: An Empirical Study of MOOC Videos
Authors: P. Guo, J. Kim, R. Rubin
Published: 2014
Study size: 6.9 million video watching sessions across four
courses on the edX MOOC platform
46% 33%
(Guo et al, 2014)
(Guo et al, 2014)
(Guo et al, 2014)
Planned vs. Chopped
9. Don’t aim for perfect.
Let students get stuck a little
more.
Your click decides your fate : Inferring Information
Processing and Attrition Behavior from MOOC
Video Clickstream Interactions
Authors: T. Sinha, P. Jermann, N. Li et al.
Published: 2014
Study size: 66k enrolled, 36.5k interacted with videos, there were 48
video lectures (producing 10 Gb of JSON data) from
“Functional Programming in Scala” run on Coursera
10 GB of JSON video click data
Play (Pl)
Pause (Pa)
SeekFw (Sf)
SeekBw (Sb)
ScrollFw (SSf)
ScrollBw (SSb)
RatechangeFast (Rf)
RatechangeSlow (Rs)
PlPaSbPl RfPaPlPa
(rewatch) (fast watching)
SSbSbPaPl
(clear concept)
(Sinha et al., 2014)
Information Processing Index (IPI)
(Sinha et al., 2014)
If students’ rewatching behavior
changes from low to high IPI, they
are 33% less likely to drop out.
Why do we lose students before
graduation?
Community Insights: Emerging Benchmarks &
Student Success Trends from across the Civitas
Authors: Civitas Learning
Published: 2016
Study size: 4 million learners (this part was conducted looking at 2
years of data), 55 colleges
(Civitas, 2016)
Academic Performance is not the Primary Risk to Departure
10. Make sure your courses
are have opportunities for
curiosity, challenge, and
creativity.
Let’s see what you remember…
1. Improve findability.
2. Coerce students into
more frequent
engagement.
3. Use an
online math
system.
4. Get students to participate
in their learning community.
5. Use personas
to strategize
about
interventions.
6. Anticipate
and catch
students as
they fall off the
path to
success.
7. Courses need a
catch-up option.
8. Tweak
Instructional
Videos.
9. Let students get stuck a little
more.
10. Make sure your courses
are have opportunities for
curiosity, challenge, and
creativity.
Cool. You
remember
everything. My
work here is done.
busynessgirl@gmail.c
om
busynessgirl.com
@busynessgirl
http://tinyletter.com/teachingchallenge

Learning at Scale: Using Research To Improve Learning Practices and Technology for Teaching Math

  • 1.
    Learning at Scale UsingResearch To Improve Learning Practices and Technology for Teaching Math Maria H. Andersen, Ph.D. Chief Troublemaker, Edge of Learning Math Faculty, Westminster College
  • 10.
  • 11.
  • 12.
    Stand up ifyou know what a MOOC is. Stay standing if you have ever signed up for a MOOC. Stay standing if you have ever finished a MOOC.
  • 13.
    HarvardX and MITx:Four Years of Open Online Courses Authors: I. Chuang, A. Ho Published: 2016 Study size: 4.4 million students across 290 MOOCs
  • 14.
    If a MOOCheld 100 students … (Chuang & Ho, 2016)
  • 15.
  • 16.
    How many timesa year do you get a chance to start over?
  • 17.
    1. We needto improve findability.
  • 18.
    Learners are inthe maze, and they can’t see the big picture.
  • 19.
    Many of youhave been in a maze like what our students experience.
  • 20.
    Wouldn’t it benice to have a transporter to get right to where you want to go?
  • 22.
    Why don’t students seemto be able to find information that is clearly printed in the syllabus?
  • 27.
    The impact offindability on student motivation, self- efficacy, and perceptions of online course quality Authors: B. Simunich, D. Robins & V. Kelly Published: 2015 Study size: n=81, students had to complete 7 tasks, navigating either a well-constructed course (according to QM) or a “broken” course
  • 28.
    What else canwe do to help learners navigate this maze?
  • 29.
    Help students tobuild a physical map to anchor memories as they learn.
  • 31.
    7.00x Introduction toBiology: The Secret of Life MITx on EdX Course Report - 2013 Spring Authors: D. Seaton, J. Reich, S. Nesterko, et al. Published: 2014 Study size: 38k signups, 3K certified (Seaton et al, 2014)
  • 32.
    6.00x Introduction toComputer Science and Programming MITx on edX – 2012 Fall Authors: S. Features, P. Grimson, J. Guttag Published: 2014 Study size: 84.5k signups, 5.7K certified
  • 33.
    14.73x The Challengesof Global Poverty MITx on edX – 2013 Spring Authors: P. Black, P. White Published: 2014 Study size: 40k signups, 4.6K certified
  • 34.
    (Seaton et al,2014) Introduction to Biology
  • 35.
    (Features et al,2014) Introduction to Computer Science and Programming
  • 36.
    (Black & White,2014) The Challenges of Global Poverty
  • 37.
    Examining Engagement: AnalysingLearner Subpopulations in MOOCs Authors: R. Ferguson, D. Clow Published: 2015 Study size: 34k signups, 7k full participants, 4 MOOCs
  • 38.
  • 39.
    HarvardX and MITx:Four Years of Open Online Courses Authors: I. Chuang, A. Ho Published: 2016 Study size: 4.4 million students across 290 MOOCs
  • 40.
  • 41.
    2. Students needto be coerced into more frequent engagement.
  • 42.
    Are you eversurprised by things you can find on the Internet? Stand up if you know who the Borg are. Stay standing if you’ve ever done an internet search for a cat in a Borg costume.
  • 43.
    3. Use an onlinemath learning system.
  • 44.
    Traditional Course Online homework (quantity and difficultyadapts to mastery levels of student) Online homework (all students do same problems) < < A hierarchy of online math learning based on principles from learning research Online homework (adapts to mastery levels of student and learner profile or preferences) <
  • 45.
  • 46.
  • 47.
  • 48.
  • 49.
    Learning is nota spectator sport: doing is better than watching for learning from a MOOC Authors: K. Koedinger, J. Kim, J. Jia, et al Published: 2015 Study size: 27k registrants, 1k completers, “Introduction to Psychology as a Science” delivered through Coursera and OLI platform
  • 52.
    Our digital livesare with us everywhere, our learning should be too.
  • 53.
    Stand up ifyou teach online or rely heavily on digital learning materials. Stay standing if you think it’s easy to get students to participate in these. Stay standing if you use discussion boards with your students.
  • 54.
    4. Get studentsto participate in their learning community.
  • 55.
    1-9-90 Rule 1% creators 9%commenters/sharers 90% lurkers
  • 56.
    Comments in MOOCs:who is doing the talking and does it help? Authors: B. Swinnerton, S. Hotchkiss & N.P. Morris Published: 2017 Study size: 25k active learners, 8k commenters, 5k students who completed a pre-course survey (roughly half commenters and half non-commenters)
  • 61.
    Predicting Student Retentionin Massive Open Online Courses using Hidden Markov Models Authors: G. Balakrishnan Published: 2013 Study size: 30k enrolled students in “Software as a Service” MOOC
  • 62.
  • 63.
  • 64.
  • 65.
  • 66.
    5. Use personasto strategize about interventions.
  • 67.
    Using Data Miningto Differentiate Instruction in College Algebra Authors: R. Manspeaker Published: 2011 Study size: 524 students in College Algebra using digital homework, over 2 semesters
  • 69.
    (Manspeaker, 2011) Overachievers (OA) CharacteristicsWhat do they struggle with? • see mathematics as useful • do not see how the class specifically applies to their lives • high grades in math • non-standard problems • problems not found on homework or worked in class
  • 70.
    Underachievers (UA) Characteristics Whatdo they struggle with? • Intelligent and well- prepared • Bored and frustrated with the course • Do reasonably well on the first exam • Procedural and non-standard problems • Get low scores in most aspects of the course • High risk for dropping out (Manspeaker, 2011)
  • 71.
    “Employees” (E) Characteristics Whatdo they struggle with? • Feel the class is a menial job for which they get “paid” with a passing grade • Dislike math • Learn through memorizing • Excel at procedural problems • Problems involving creative thinking or independent thought • Attendance (starts strong, then drops) (Manspeaker, 2011)
  • 72.
    (Manspeaker, 2011) Rote Memorizers(RM) Characteristics What do they struggle with? • Rely on memorizing to get through math • Negative views of math which will get worse over time • Poorest scores • Emporium-style courses • Everything
  • 73.
    Sisyphean Strivers (SS) CharacteristicsWhat do they struggle with? • Excellent Attendance • Do well on written homework • Have high understanding of math if interviewed • Do very poorly on exams • Non-standard questions • Application problems • Exams • Online homework (Manspeaker, 2011)
  • 75.
    Stand up ifstudents drop your classes. Stay standing if the digital systems you use make it easy to see which students you should intervene with. Stay standing if you have strategies in place to try to intervene before disengagement.
  • 76.
    6. Anticipate andcatch students as they fall off the path to success.
  • 77.
    Community Insights: EmergingBenchmarks & Student Success Trends from across the Civitas Authors: Civitas Learning Published: 2016 Study size: 2 million learners, 55 colleges
  • 78.
    LMS activity inthe first 14 days
  • 79.
    LMS activity inthe first 14 days Persistence: 92% (or more)
  • 80.
    Persistence: 76% LMS activityin the first 14 days
  • 81.
    Persistence: 47% LMS activityin the first 14 days
  • 84.
    Using Bayesian Learningto Classify College Algebra Students by Understanding in Real-Time Authors: A. Cousino Published: 2013 Study size: 505 students over 2 semesters
  • 85.
  • 87.
    Examining Engagement: AnalysingLearner Subpopulations in MOOCs Authors: R. Ferguson, D. Clow Published: 2015 Study size: 34k signups, 7k full participants, 4 MOOCs
  • 88.
  • 89.
    Samplers Visit, butonly briefly (commented in some courses) Strong Starters Complete the first week, but then dropout Returners Made it through 2 weeks, but then dropout Midway Dropouts Dropped out around assessment 3 or 4 Nearly There’s Made it through ¾ of the course, then dropped Late Completers Completed course, but submitted things late Keen Completers Completed course, mostly on time (>80%) (Ferguson & Clow, 2015)
  • 90.
    (Graph generated fromdata in Ferguson & Clow, 2015)
  • 91.
    Deconstructing Disengagement: AnalyzingLearner Subpopulations in Massive Open Online Courses Authors: R. Kizilcec, C. Piech, E. Schneider Published: 2013 Study size: 94k active learners in 3 computer science MOOCs
  • 95.
    7. Courses needa catch-up option.
  • 96.
    Why don’t we offer1-2 week ”slipped schedule” courses?
  • 97.
    This might mean the courseshave to be offered on 12-week schedules.
  • 98.
  • 99.
    How Video ProductionAffects Student Engagement: An Empirical Study of MOOC Videos Authors: P. Guo, J. Kim, R. Rubin Published: 2014 Study size: 6.9 million video watching sessions across four courses on the edX MOOC platform
  • 100.
    46% 33% (Guo etal, 2014)
  • 101.
  • 102.
  • 103.
  • 105.
    9. Don’t aimfor perfect. Let students get stuck a little more.
  • 106.
    Your click decidesyour fate : Inferring Information Processing and Attrition Behavior from MOOC Video Clickstream Interactions Authors: T. Sinha, P. Jermann, N. Li et al. Published: 2014 Study size: 66k enrolled, 36.5k interacted with videos, there were 48 video lectures (producing 10 Gb of JSON data) from “Functional Programming in Scala” run on Coursera
  • 107.
    10 GB ofJSON video click data Play (Pl) Pause (Pa) SeekFw (Sf) SeekBw (Sb) ScrollFw (SSf) ScrollBw (SSb) RatechangeFast (Rf) RatechangeSlow (Rs) PlPaSbPl RfPaPlPa (rewatch) (fast watching) SSbSbPaPl (clear concept) (Sinha et al., 2014)
  • 108.
    (Sinha et al.,2014) Information Processing Index (IPI)
  • 109.
    (Sinha et al.,2014) If students’ rewatching behavior changes from low to high IPI, they are 33% less likely to drop out.
  • 110.
    Why do welose students before graduation?
  • 111.
    Community Insights: EmergingBenchmarks & Student Success Trends from across the Civitas Authors: Civitas Learning Published: 2016 Study size: 4 million learners (this part was conducted looking at 2 years of data), 55 colleges
  • 112.
    (Civitas, 2016) Academic Performanceis not the Primary Risk to Departure
  • 113.
    10. Make sureyour courses are have opportunities for curiosity, challenge, and creativity.
  • 114.
    Let’s see whatyou remember…
  • 115.
  • 116.
    2. Coerce studentsinto more frequent engagement.
  • 117.
    3. Use an onlinemath system.
  • 118.
    4. Get studentsto participate in their learning community.
  • 119.
    5. Use personas tostrategize about interventions.
  • 120.
    6. Anticipate and catch studentsas they fall off the path to success.
  • 121.
    7. Courses needa catch-up option.
  • 122.
  • 123.
    9. Let studentsget stuck a little more.
  • 124.
    10. Make sureyour courses are have opportunities for curiosity, challenge, and creativity.
  • 125.
  • 126.

Editor's Notes

  • #3 I taught math in higher education for about 14 years. And the grass was nice, and I liked working with students, and all-in all, I was happy.
  • #4 But I began looking at the grass outside the fence of academe and I became tired of the slow pace of change, the paper grading, the whining, and the educational technology that didn’t seem to improve.
  • #5  About 5 years ago, I was enticed to go through the gate to the other side. I spent the last 5 years working either for or closely partnered with educational technology companies to build products for learning. I built MOOCs. I built adaptive learning platforms. I designed massive learning experiences at a school of 70,000 students (all online). Our biochem course had 8000 students and our college algebra course had 3000 students in it. It was fun, but working for one company felt too restrictive. I decided I wanted to be a wild horse.
  • #7 I took a leap of faith. (and I looked for a skydiving pony but the Internet did not deliver that one). I left a job about 5 months ago to have a “good think” on everything I’ve learned in my 5 years of extremely accelerated learning in the ed tech industry. In fact, this presentation is an outgrowth of that. I wanted to take a step back and see what we actually have gained from the last 5 years of crazy digital learning experiments.
  • #8 Personally, and looking through the lens of the higher education industry, I’ve watched us transition from institutions that were wholly face-to-face learning…
  • #9 To teaching online courses. Now, where is the instructor … Oh look! There’s the instructor. He’s the picture-in-picture. In all seriousness though, isn’t that what it feels like? We’ve gone from being in the same space with students to peeking in from the outside?
  • #10 And then we graduated from “merely” online courses to massive courses and learning experiences. For those that teach MOOCs, or manage large learning platforms, we are looking at learning from a scale of 10,000, 100,000 or millions of students engaged with the product. We manage a population of learners the size of a city.
  • #11 After watching all of this progression from multiple perspectives, I began to wonder … what have we actually learned? We’ve looked at learning through a statistical sample size larger than we have ever had before. What do we actually know now? Should we be adjusting anything down the line in the smaller courses? By the way, there will be a quiz.
  • #12 The purpose of showing you this data and relating these experiences (often from at-scale courses and MOOCs) is not because I want to encourage you all to go out and do these things. It is because for the first time in history, we have extremely large data sets that tell us about natural eLearning engagement and persistence patterns.
  • #15 This leads me to a question and a finding. First the question … What are the 20something students and students with Bachelors degrees going to MOOCs to learn that we are not teaching them in college? The finding – there is a hunger for courses outside the traditional structure of higher education, but mostly by those that already have successfully learned how to learn.
  • #16 The human development index of the country of residence of the student correlates solidly (r=0.83) with completion rates. Higher HDI scores are associated with higher life expectancy at birth, mean years of schooling and expected years of schooling for the population, and a decent standard of living. If we calculated an HDI for the populations we serve, would we see similar trends?
  • #17 Probably, you get to “launch courses” 2 to 3 times a year. Every time you carefully rework your syllabii to ensure the best possible outcome. What happens a week or two later? In the software world we talk about this term “agile” and what it means is that we have quick iteration cycles, typically 2-4 weeks. In MOOC-land, I was able to launch a course, watch several hundred/thousand students wander through the “startup materials” and then iterate for courses launching the next week. Every week we discovered lessons about what worked and what didn’t.
  • #18 As instructors, we can see the whole plan from above.
  • #20 Why aren’t students seeing the Announcements?
  • #21 Why aren’t students seeing the Announcements?
  • #22 Why would I move away from the grid format?
  • #28 But don’t just take my word for it. There have actually been studies. Here’s a small-n study on eLearning in particular – navigation is a huge frustration point for students. But also, there are thousands and thousands of studies and hundreds of books on the topic of usability in software experiences (which is essentially what we deliver though eLearning platforms).
  • #35 Exams are weeks 5, 9, and 13
  • #39 Red lines are a weekly email. Activity drops to HALF between emails/deadlines. The email/deadline sucks the learners back in for another cycle through another week. Don’t feel bad about frequent deadlines and announcements.
  • #41 Maybe math really is just harder to learn than everything else? Or … what if prerequisites are really THAT important?
  • #44 After looking at somewhere around 50 case studies, white papers, dissertations, and journal articles. I’m willing to go out on a ledge here and say that using an online math learning system can only help your students. I can no longer, in good conscience, recommend a course that uses only traditional pencil & paper homework.
  • #45 But Why? Why has the scale tipped in favor of online math? The first step up gives us spaced repetition, feedback, and greater accountability. The second step gives us more efficiency of learning, mastery of content. The third step would eliminate some of the boredom (theoretically) and deliver appropriate challenge.
  • #46 1. Online homework can adjust to the pace of each student. Students can go slower or faster and dive in to resources as needed.
  • #48 2. Repeated engagement throughout the week (not just once or twice a week).
  • #49 4. Immediate dopamine. Think of it as customer support. We want immediate results. We want immediate help. Think about this the next time you find yourself complaining about the poor service from a company. Students feel that way too.
  • #50 Based on the work of Rachel Manspeaker. Very interesting dissertation.
  • #51 The most influential impact comes from doing activities, with a normalized coefficient of 0.44 (a 1 standard deviation increase in doing activities produces 0.44 sd increase in quiz score). The strength of this relationship is more than six times the impact of watching video or reading pages (both
  • #52 The most influential impact comes from doing activities, with a normalized coefficient of 0.44 (a 1 standard deviation increase in doing activities produces 0.44 sd increase in quiz score). The strength of this relationship is more than six times the impact of watching video or reading pages (both
  • #53 3. We have, as a species, gone digital. 90% of our students have Smartphones. We are competing for the students’ digital attention. Without digital platforms that deliver learning, we might not get any learning. While our devices DO distract us, they also provide a way to carry around everything you are learning. Much the same way I can carry 500+ research papers in my laptop (or access them from the cloud), students can learn when they have time if they have their resources.
  • #55 Stand up if you believe that participating in discussion or groupwork in an online class is good for students. Stay standing if you think it’s easy to get students to participate.
  • #56 Internet communities (but also social communities)
  • #58 “Superposters” (creators) make more than 2 comments.
  • #59 Boxplots show the majority of commenters fall in the range from 2-4 comments for the whole course. This gives us some sense of natural non-incentivized participation rate. If you want participation/interaction, you will have to incentivize it.
  • #60 Here’s some kind of great irony, our most social-media saavy students (the 18-20somethings) posted less (by median) than the older students.
  • #61 This does tell us something interesting about PT workers though. And this number about FT educators has got to be some kind of proof that teachers are really busier than everyone else.
  • #63 Participating in online discussion
  • #64 Participating in online discussion
  • #65 Even lurking is an activity that correlates with persistence. Too bad it’s near impossible to get analytics on who has viewed threads, huh?
  • #66 Drive the lurkers back in to see what another student said that was so great.
  • #67 What is a “persona”? For our purpose, a persona represents a cluster of math learners who exhibit similar behavioral and decision making patterns
  • #68 They had assessment questions after the videos, so they measured engagement by looking at play data and engagement with the questions after the videos.
  • #70 OA is an overachiever. Between weeks 6 and 8, the OA students start to learn topics that are new to them. Their habits weren’t formed to deal with new stuff.
  • #71 OA is an overachiever. Between weeks 6 and 8, the OA students start to learn topics that are new to them. Their habits weren’t formed to deal with new stuff.
  • #72 OA is an overachiever. Between weeks 6 and 8, the OA students start to learn topics that are new to them. Their habits weren’t formed to deal with new stuff.
  • #73 OA is an overachiever. Between weeks 6 and 8, the OA students start to learn topics that are new to them. Their habits weren’t formed to deal with new stuff.
  • #74 OA is an overachiever. Between weeks 6 and 8, the OA students start to learn topics that are new to them. Their habits weren’t formed to deal with new stuff.
  • #77 There’s a clear path laid for students to follow at the beginning of the course, but students have to actually start down that path to be successful.
  • #79 LMS activity is more than just logins to a particular course. It is all LMS logins at the institution over this 2-week period.
  • #80 For students who login more than 5 times, predicted persistance is 92%.
  • #81 4 or less logins in the first 14 days
  • #82 Only 0 or 1 login in the first 14 days. Furthermore, about half these students will leave the institution.
  • #84 It turns out there’s another crucial point in a course (particularly in a math course) where we are at risk for losing students. This is one that you might not have thought of.
  • #85 Based on the work of Rachel Manspeaker. Very interesting dissertation.
  • #86 OA is an overachiever. Between weeks 6 and 8, the OA students start to learn topics that are new to them. Their habits weren’t formed to deal with new stuff.
  • #87 Stand up if you have had any of the following circumstances in the last year: were sick days in a row, had a sick child or relative for several days in a row, car broke down for a week, got in a car accident, went to a several-day conference for work, got married, got divorced, got dumped, or had any other major life crisis. Stay standing if found it was easy to keep up with your job while these things were going on.
  • #90 Doesn’t add to 100, it’s complicated. Two of the MOOCs had quite a different structure and some categories did not appear for these and other categories were much higher. Note that 31% of those that started, dropped and never came back.
  • #93 From week to week in the courses, researchers tracked the student movement between categories.
  • #94 Pay particular attention to the students who ”fall out” each week.
  • #95 Pay really close attention. Notice anything? They never get back on track. In fact, the best you can hope for after you fall out is to bounce between audit (some engagement with the course) and out (no engagement with the course).
  • #96 Once you get left behind in a digital course, you can’t catch back up.
  • #99 Many of us recorded our instructional videos years ago. We know a lot more now about what is effective.
  • #100 They had assessment questions after the videos, so they measured engagement by looking at play data and engagement with the questions after the videos.
  • #101 Including some kind of talking head increased engagement to 46% (vs 33% for non talking head videos). Intersperse ”talking head” between slides or tablet work or use PIP options.
  • #102 Keep your videos shorter than 6 minutes. Students often do not watch to the end. Many “autoplay” videos were immediately paused. [removed from study data].
  • #103 There was also slightly higher engagement in a less formal setting (sitting at a desk vs a studio recording). Record where you feel comfortable, where you’re more likely to make eye contact and be more engaging and enthusiastic.
  • #104 Also better engagement on PLANNED vs unplanned lectures. In other words, while it is easy to cut up lectures recorded in class, it is not always engaging.
  • #105 There was more engagement on tablet-style videos than slides.
  • #108 These code combinations are called n-grams and were grouped into 7 categories.
  • #109 These code combinations are called n-grams and were grouped into 7 behavioral action categories and an Information Processing Index.
  • #110 These behavioral action categories were then collected to infer the students’ perception of the video lecture segment. Compare the two regions where the information processing index is high.
  • #111 But I suspect it is do to an education design that is increasingly transactional instead of transformational.
  • #112 Academic Performance is not the Primary Risk to Departure
  • #113 Note: 2 years of data, 4 million learners Transactional vs transformational
  • #116 1. We need to improve findability.
  • #117 Students need to be coerced into more frequent engagement.
  • #122 Once you get left behind in a digital course, you can’t catch back up.