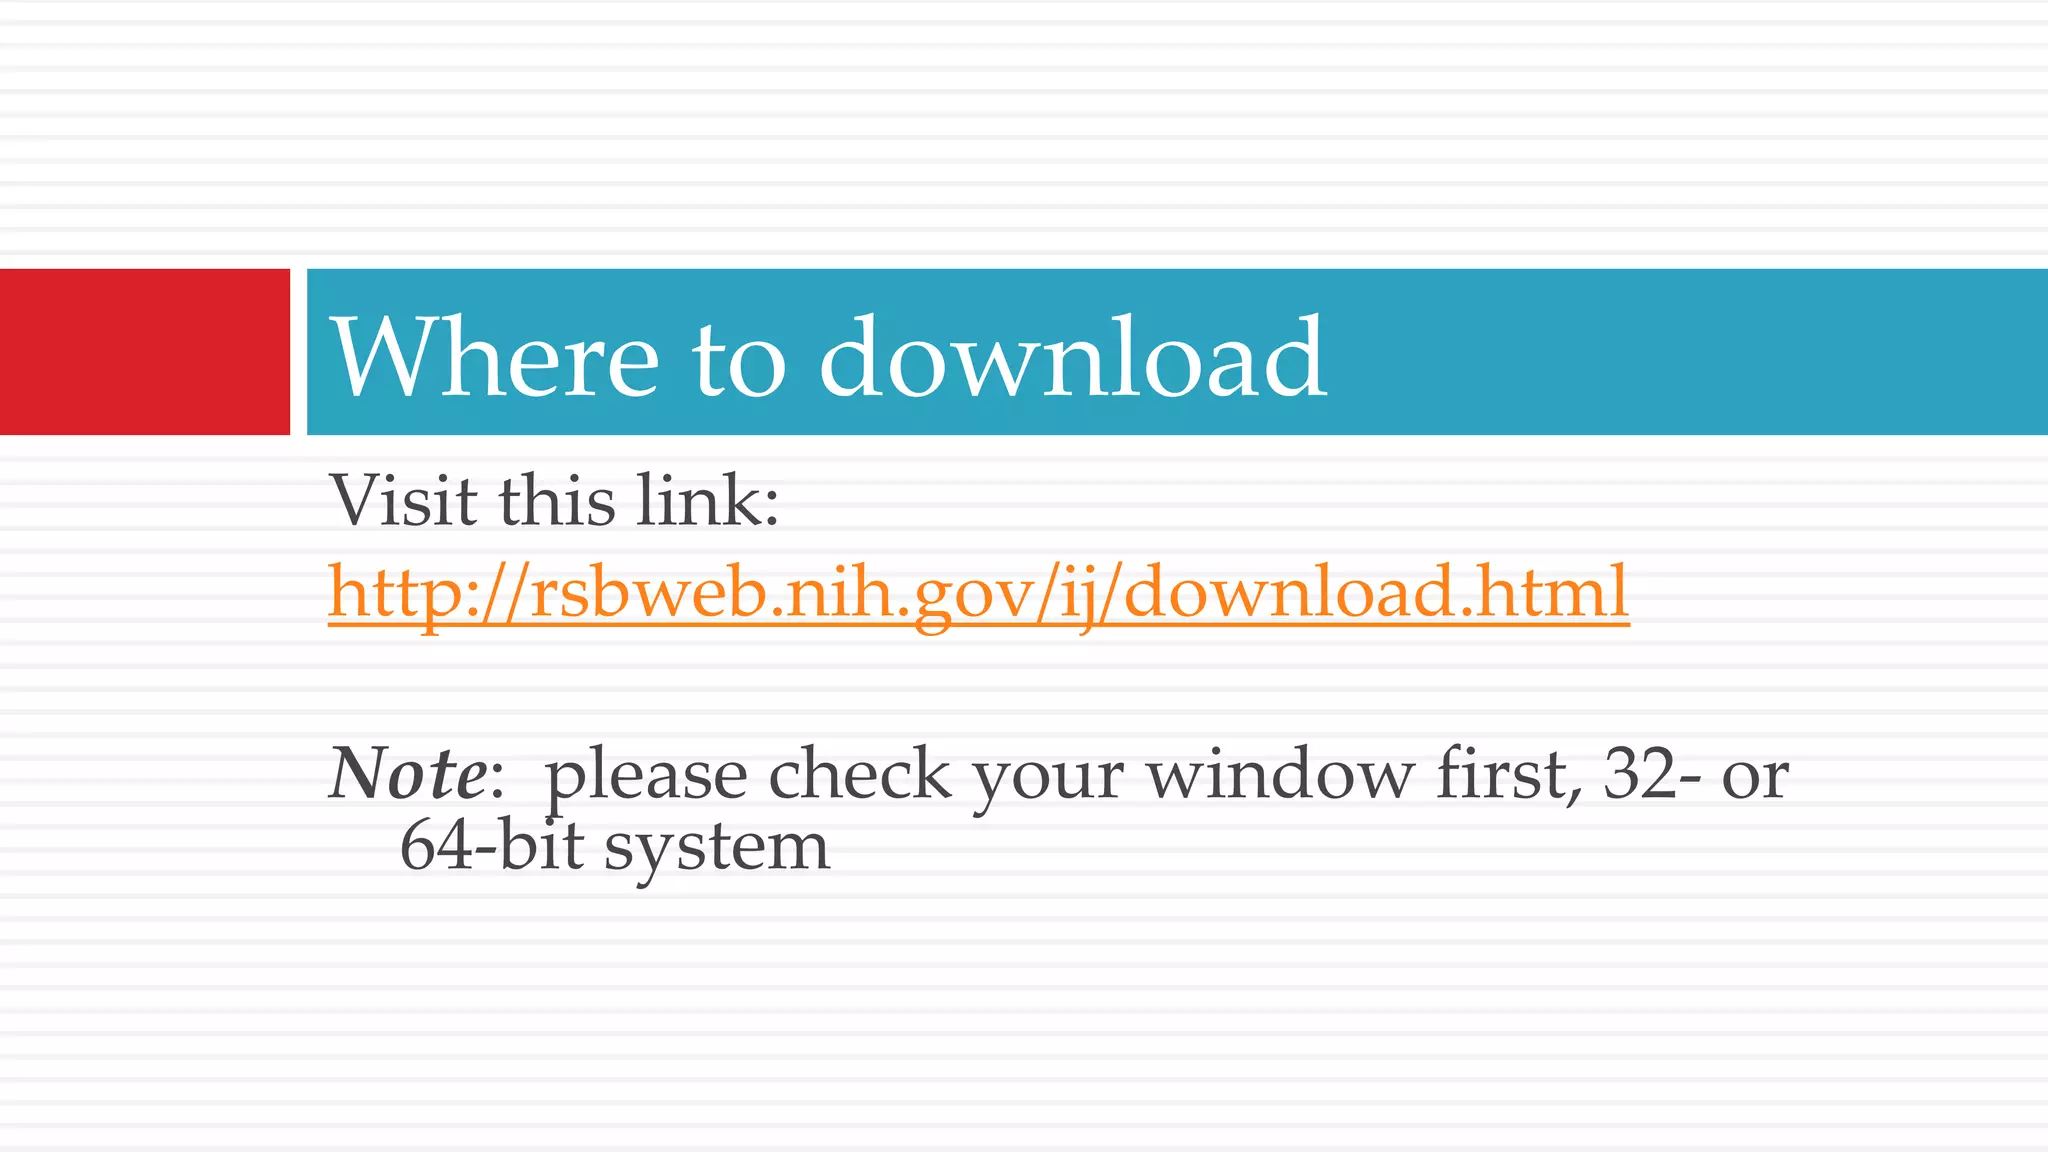
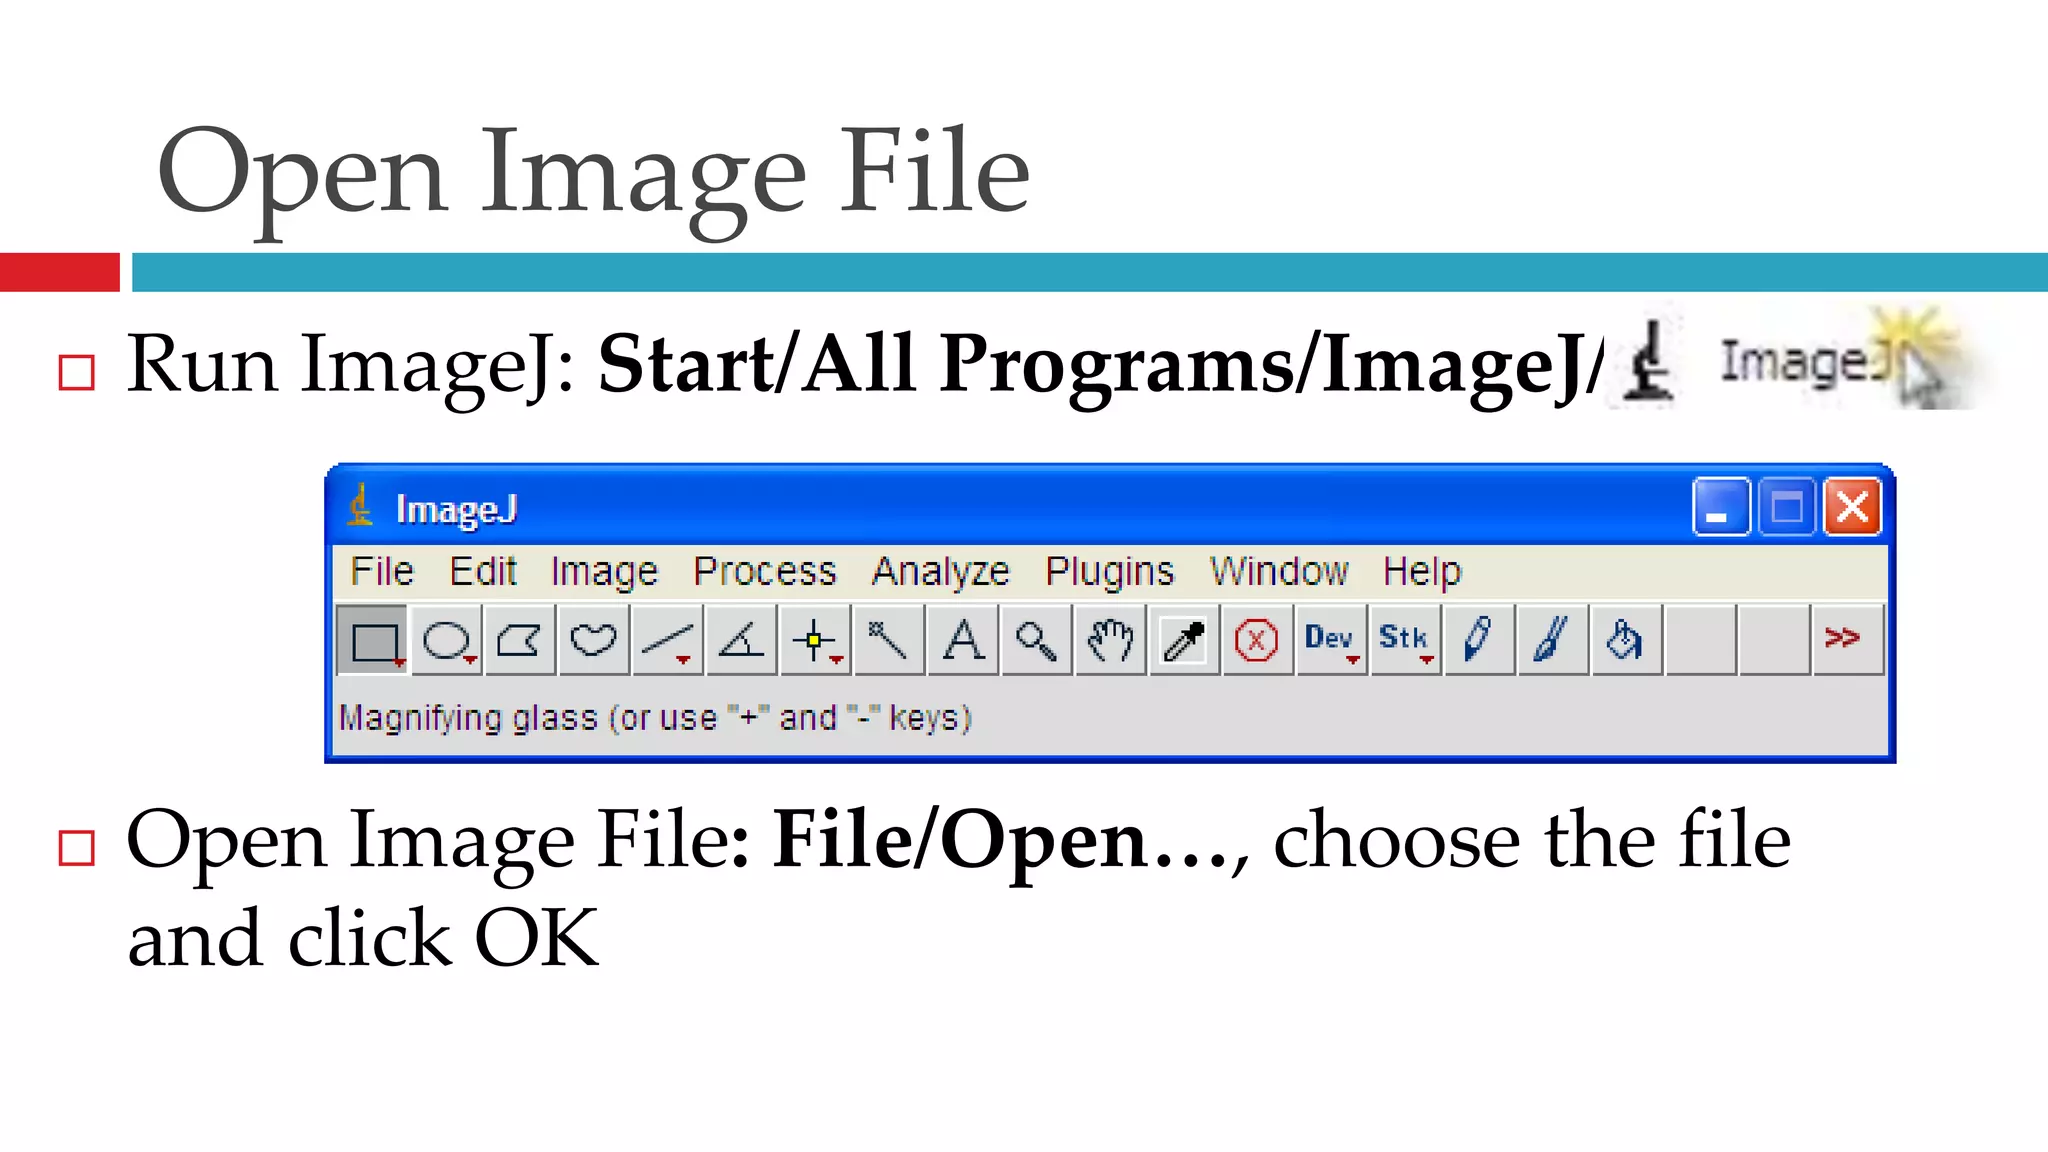
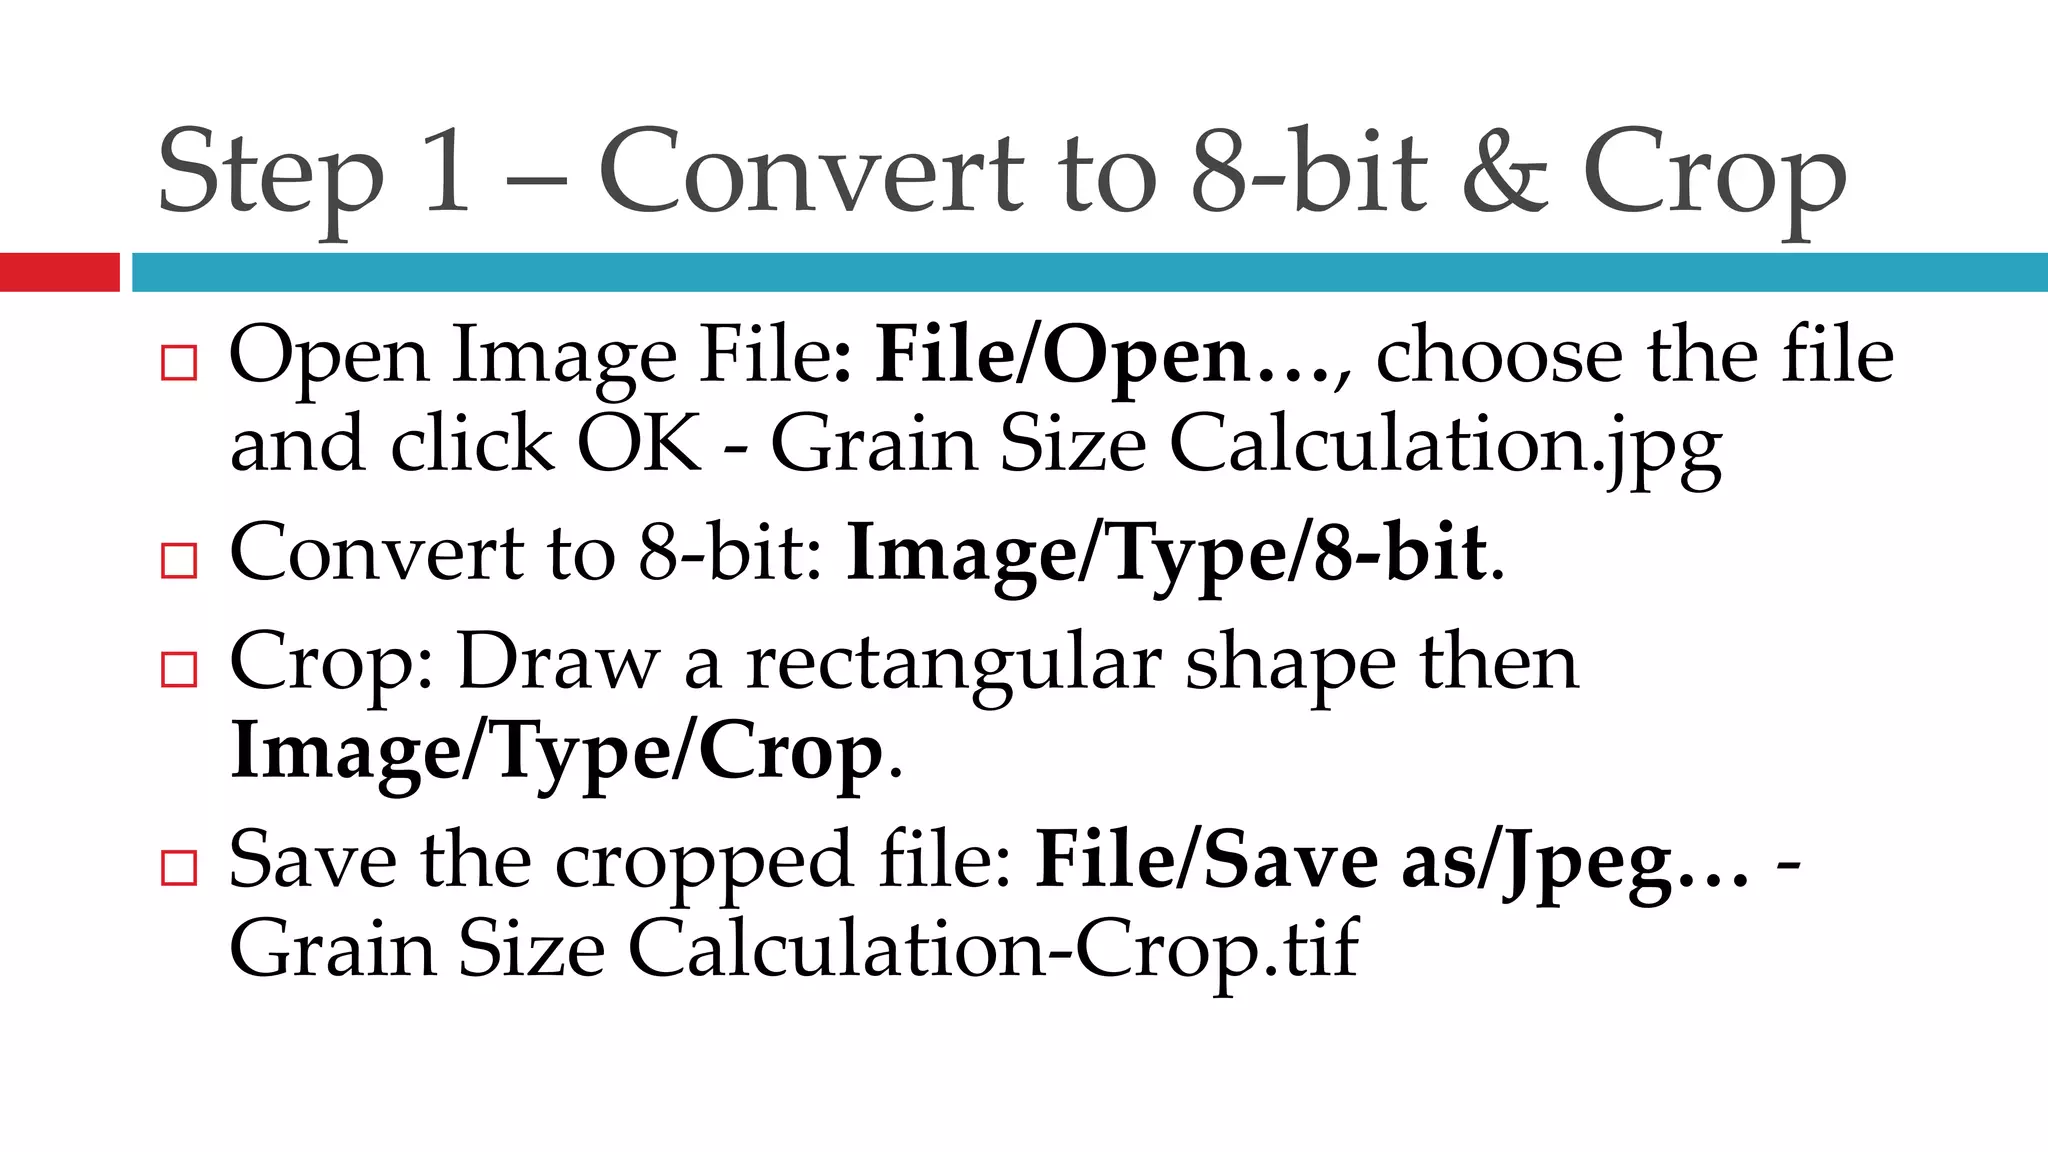
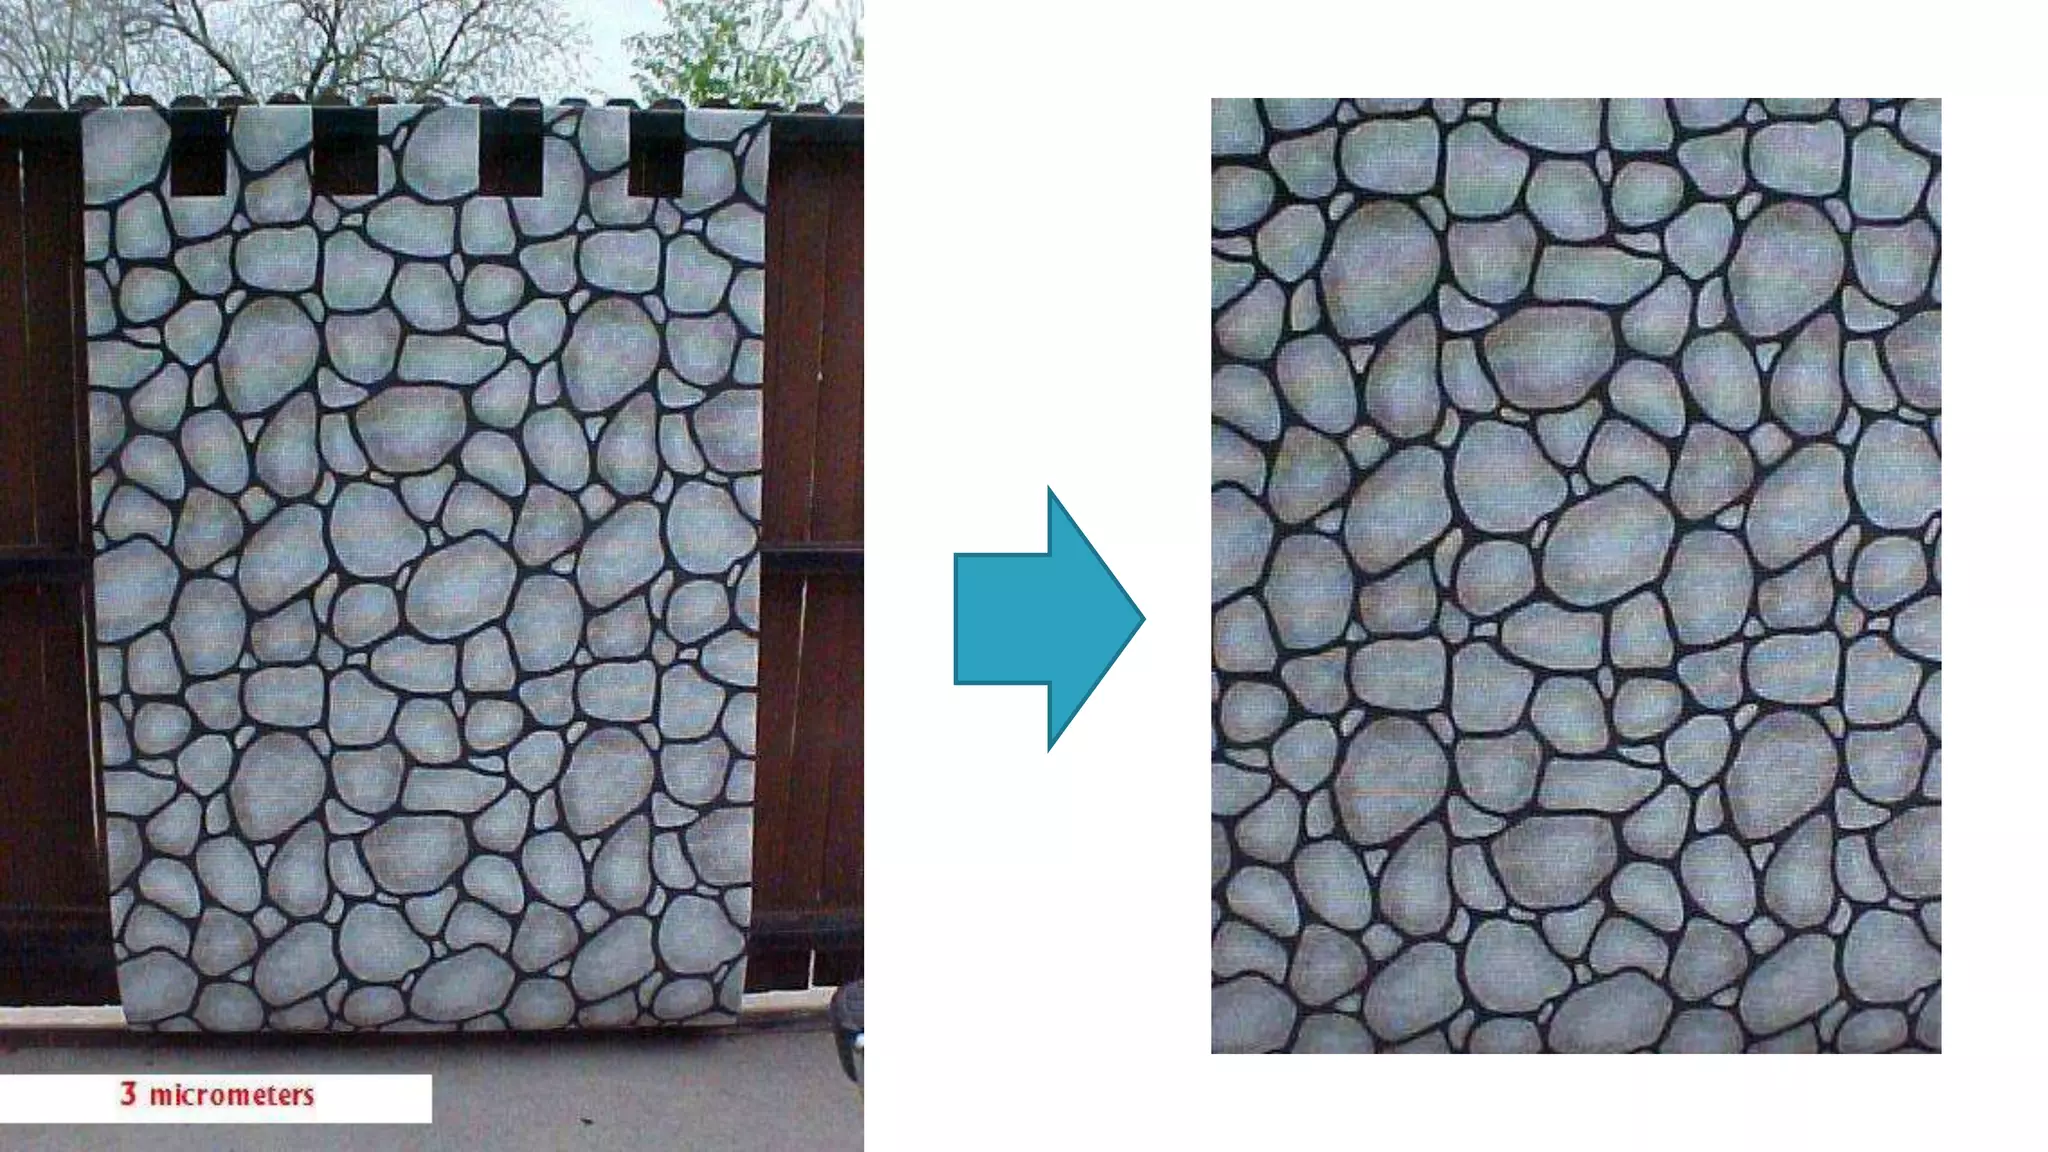
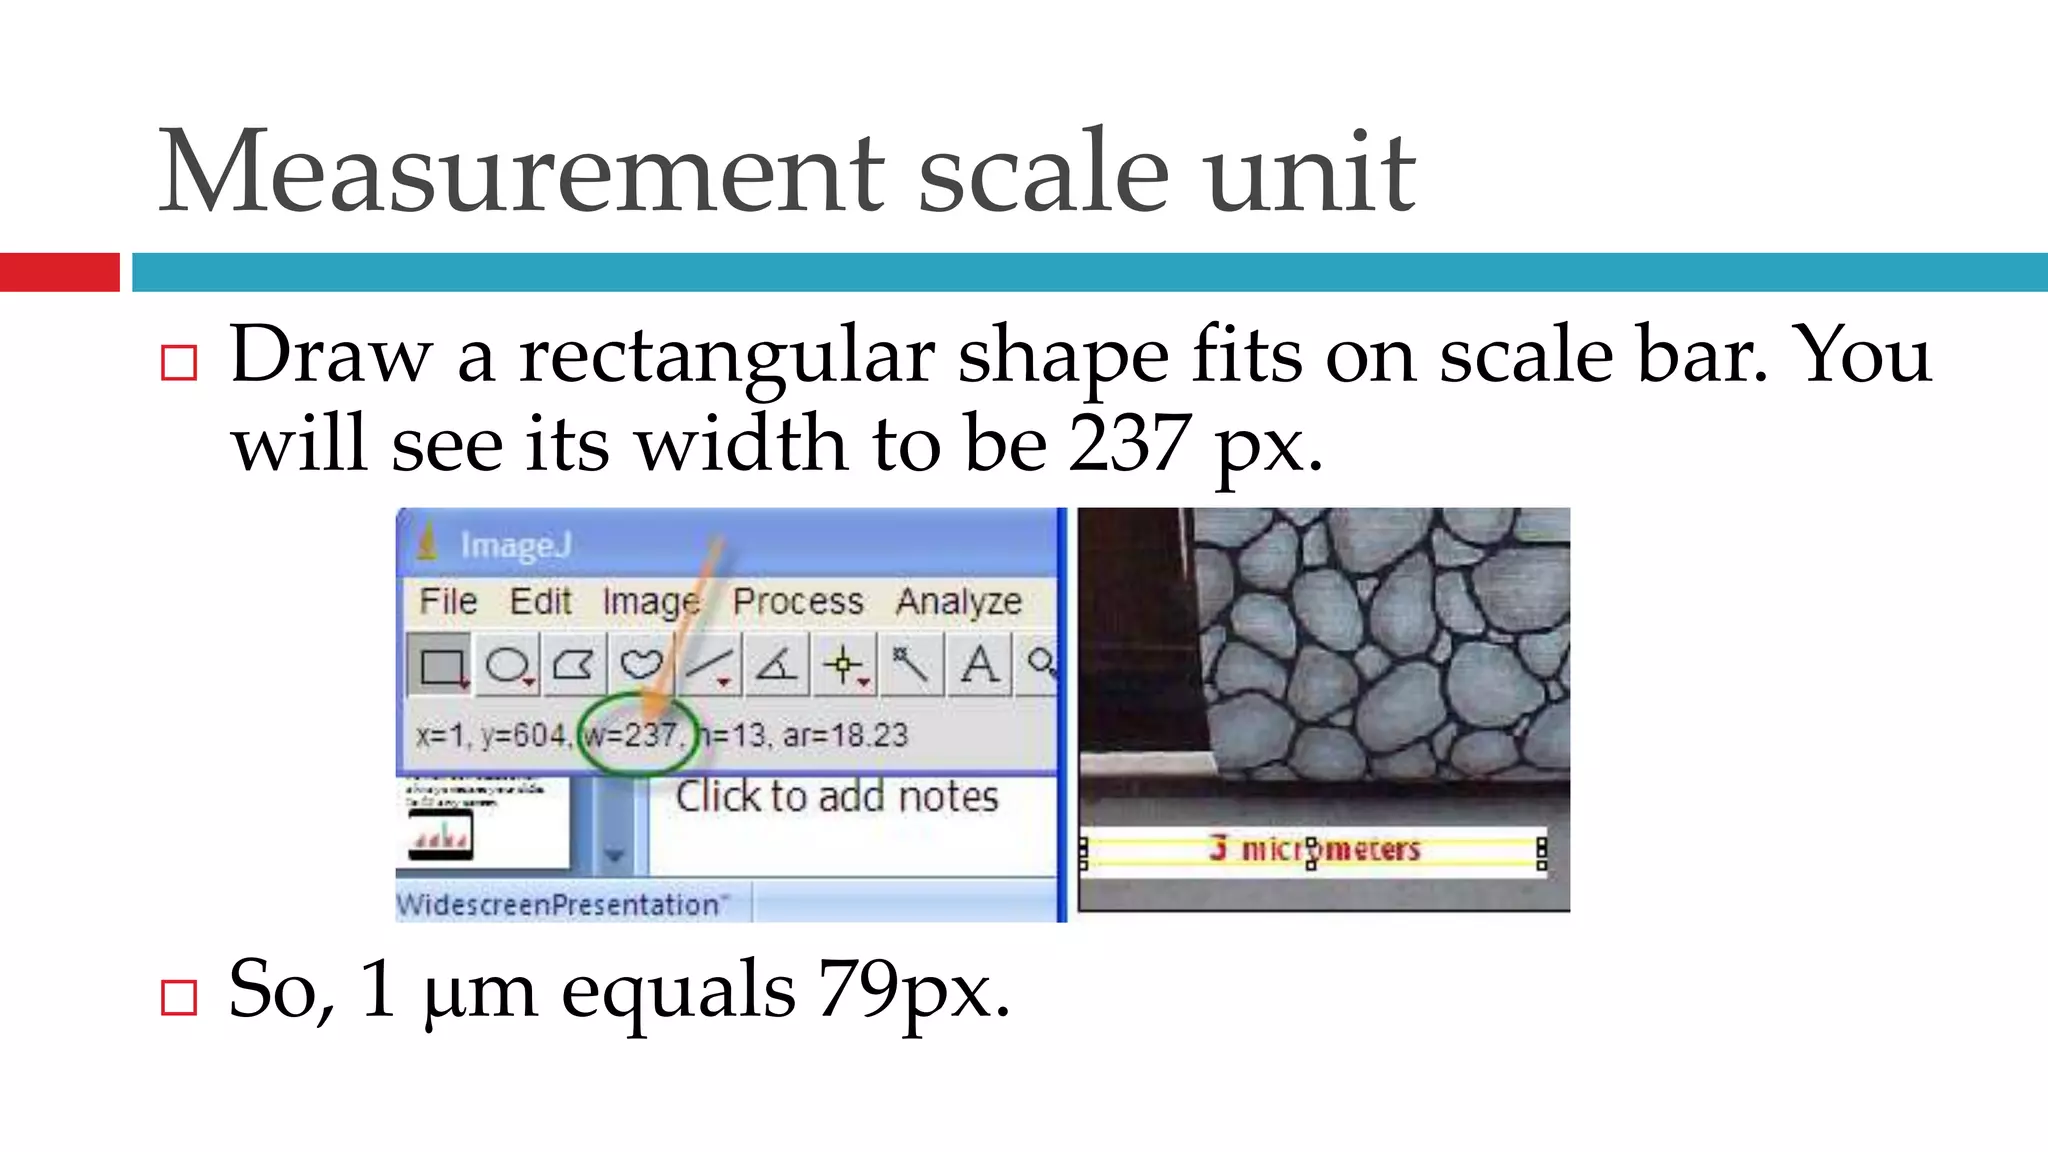
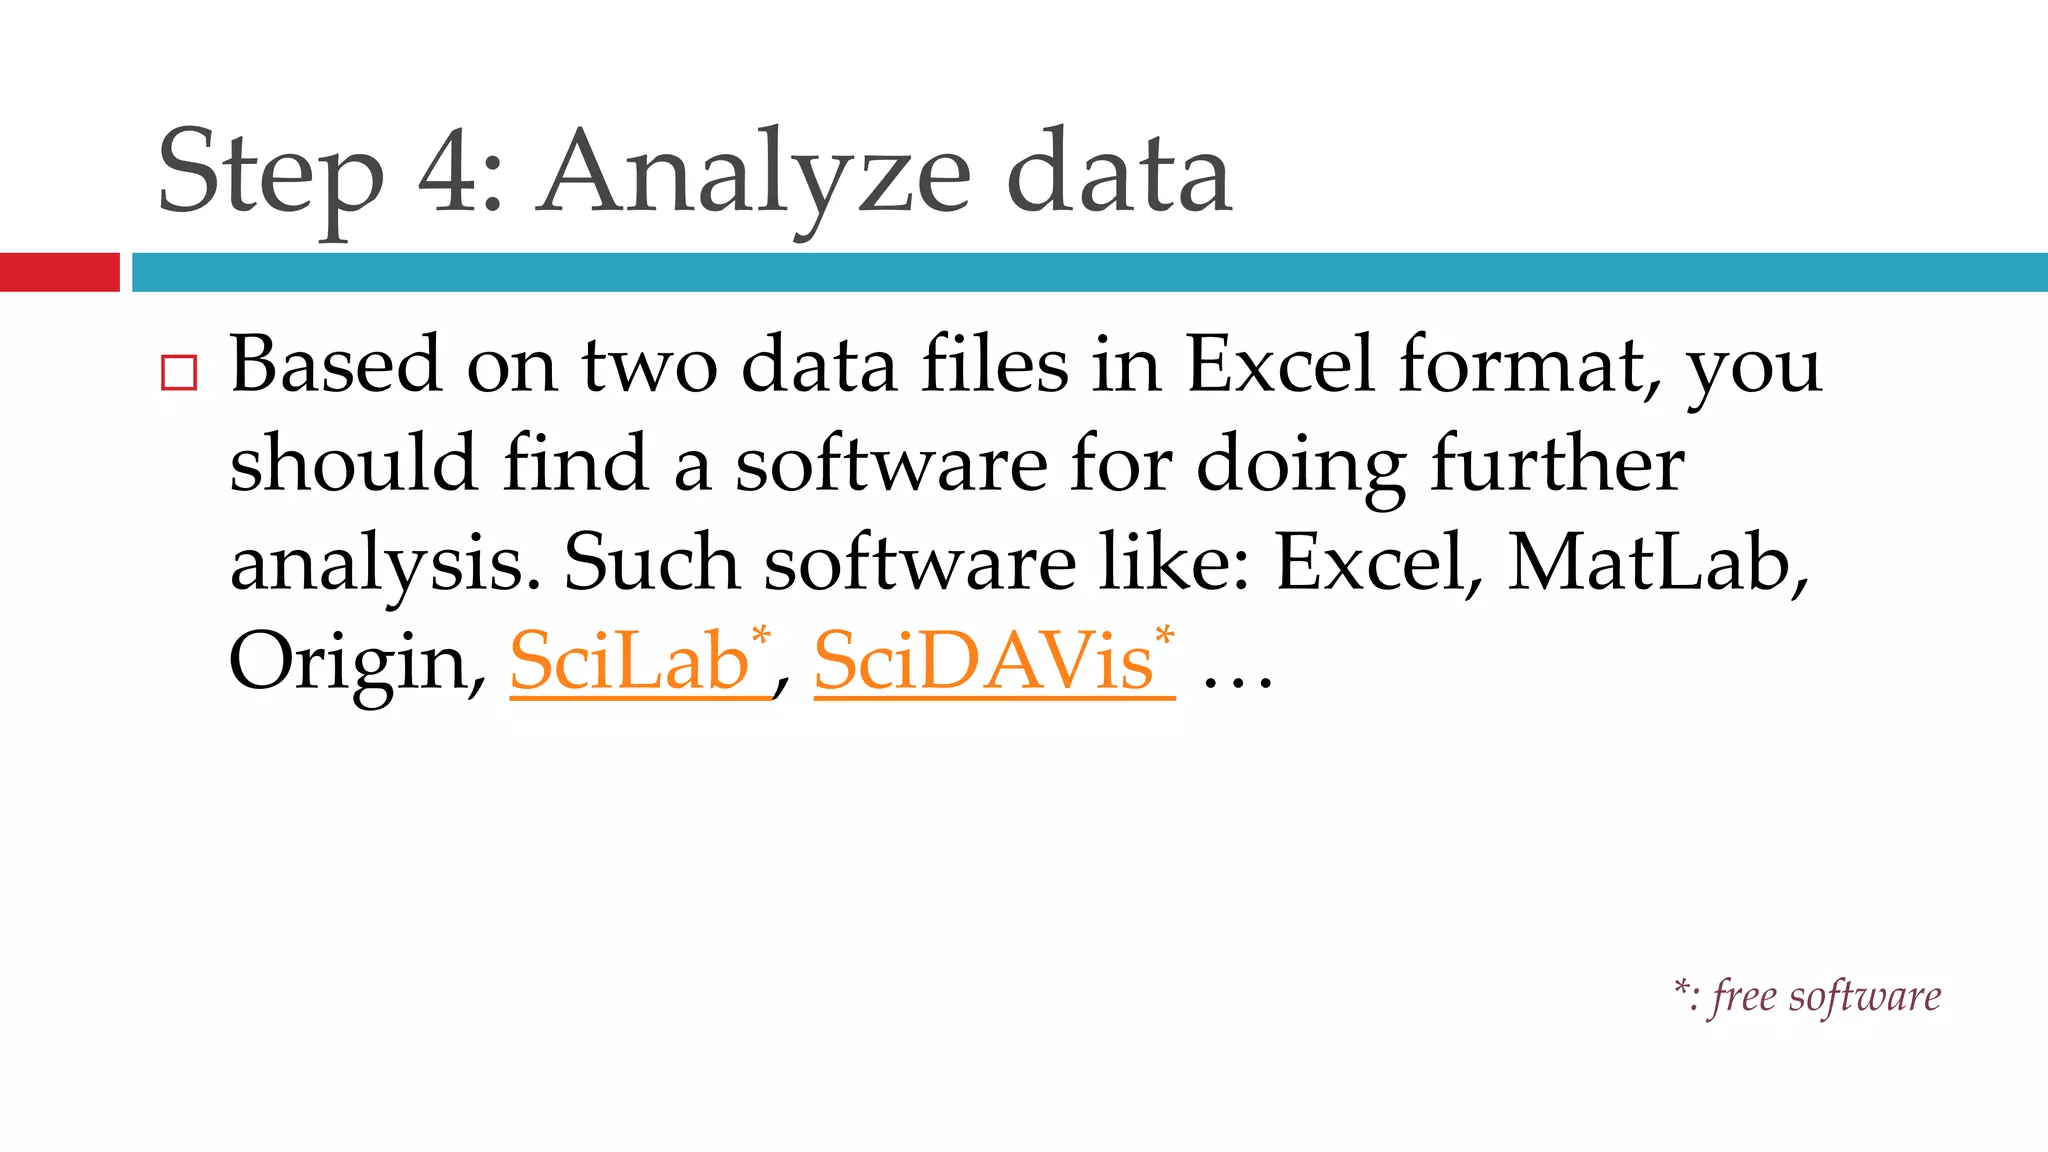
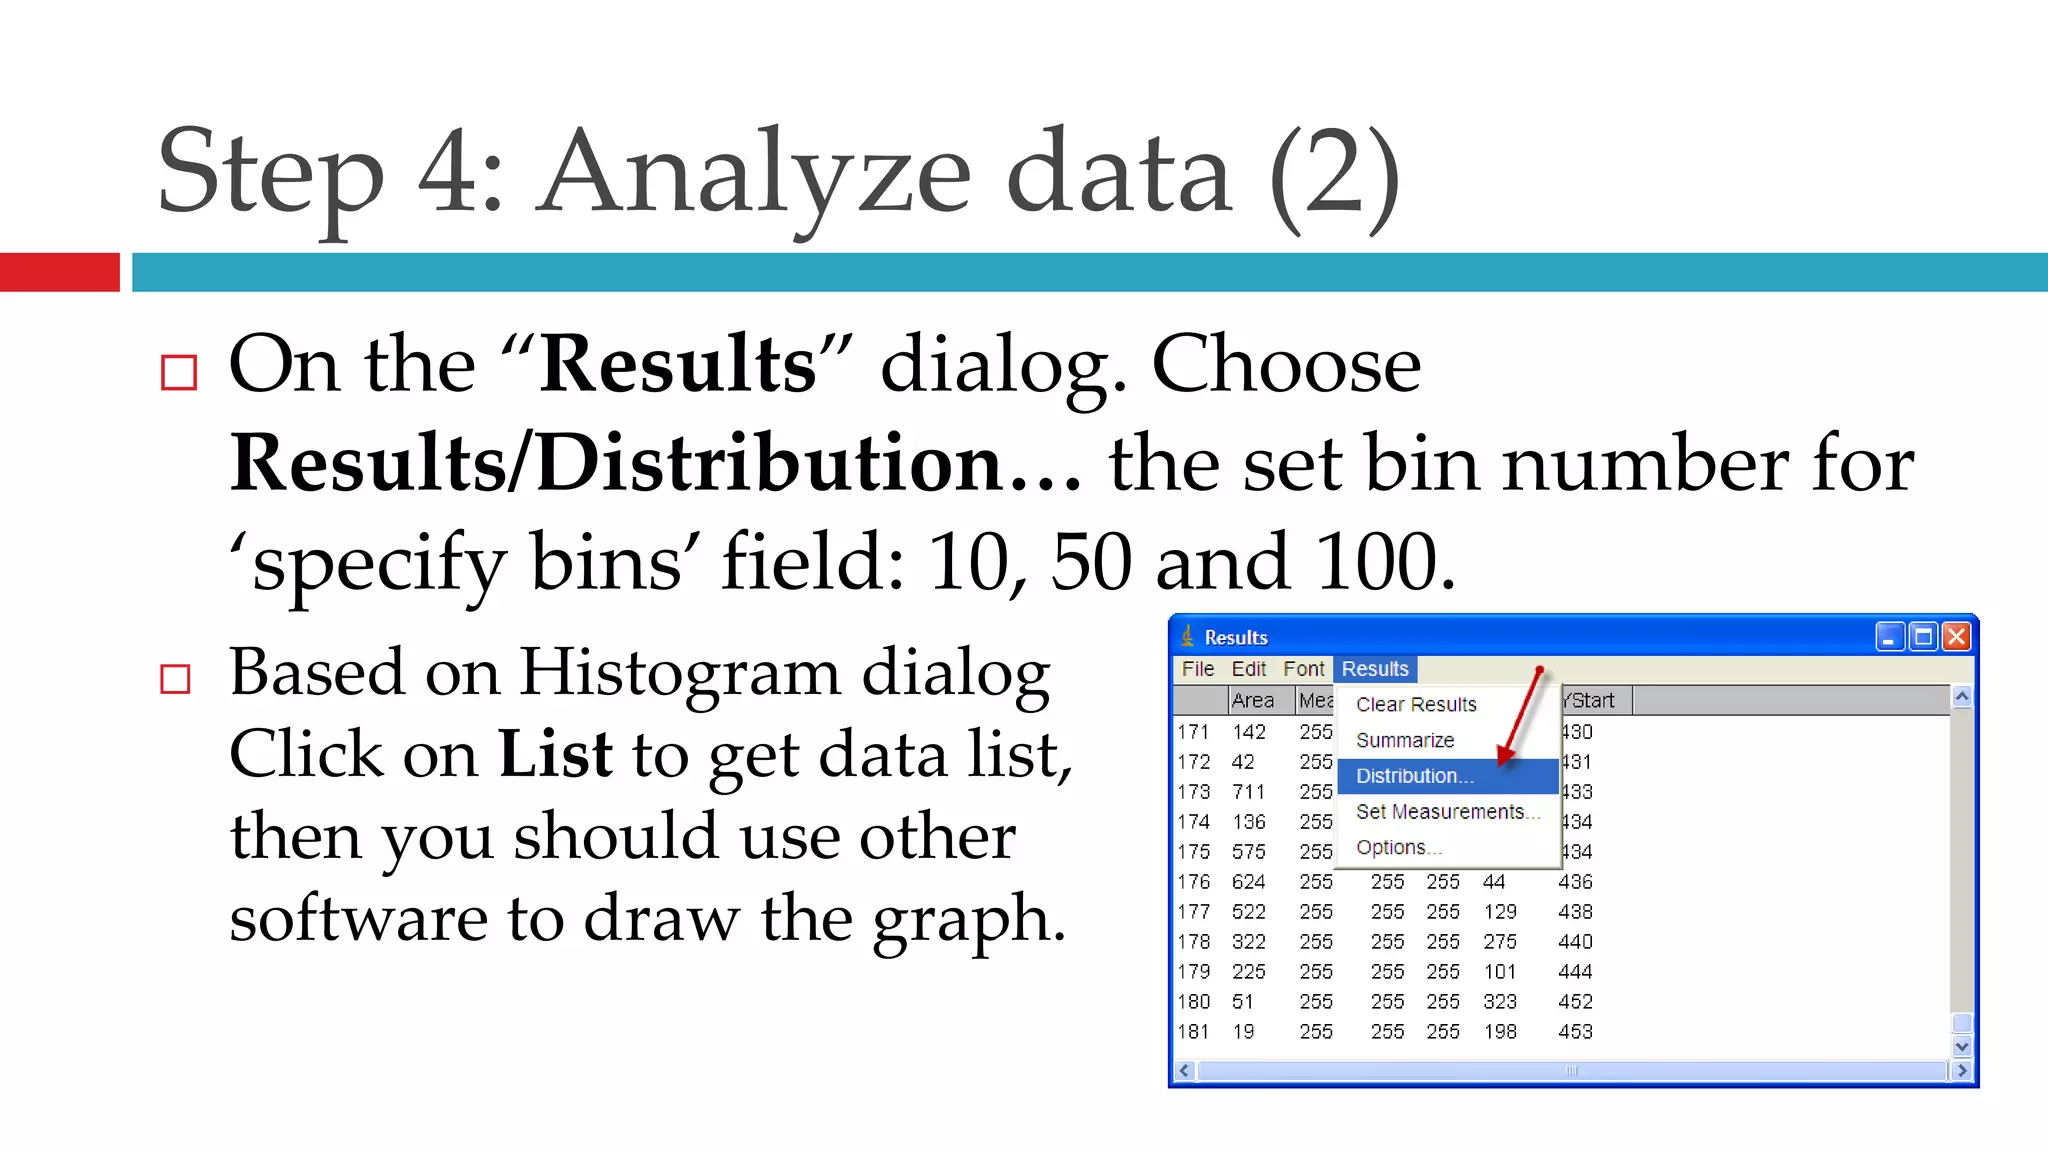
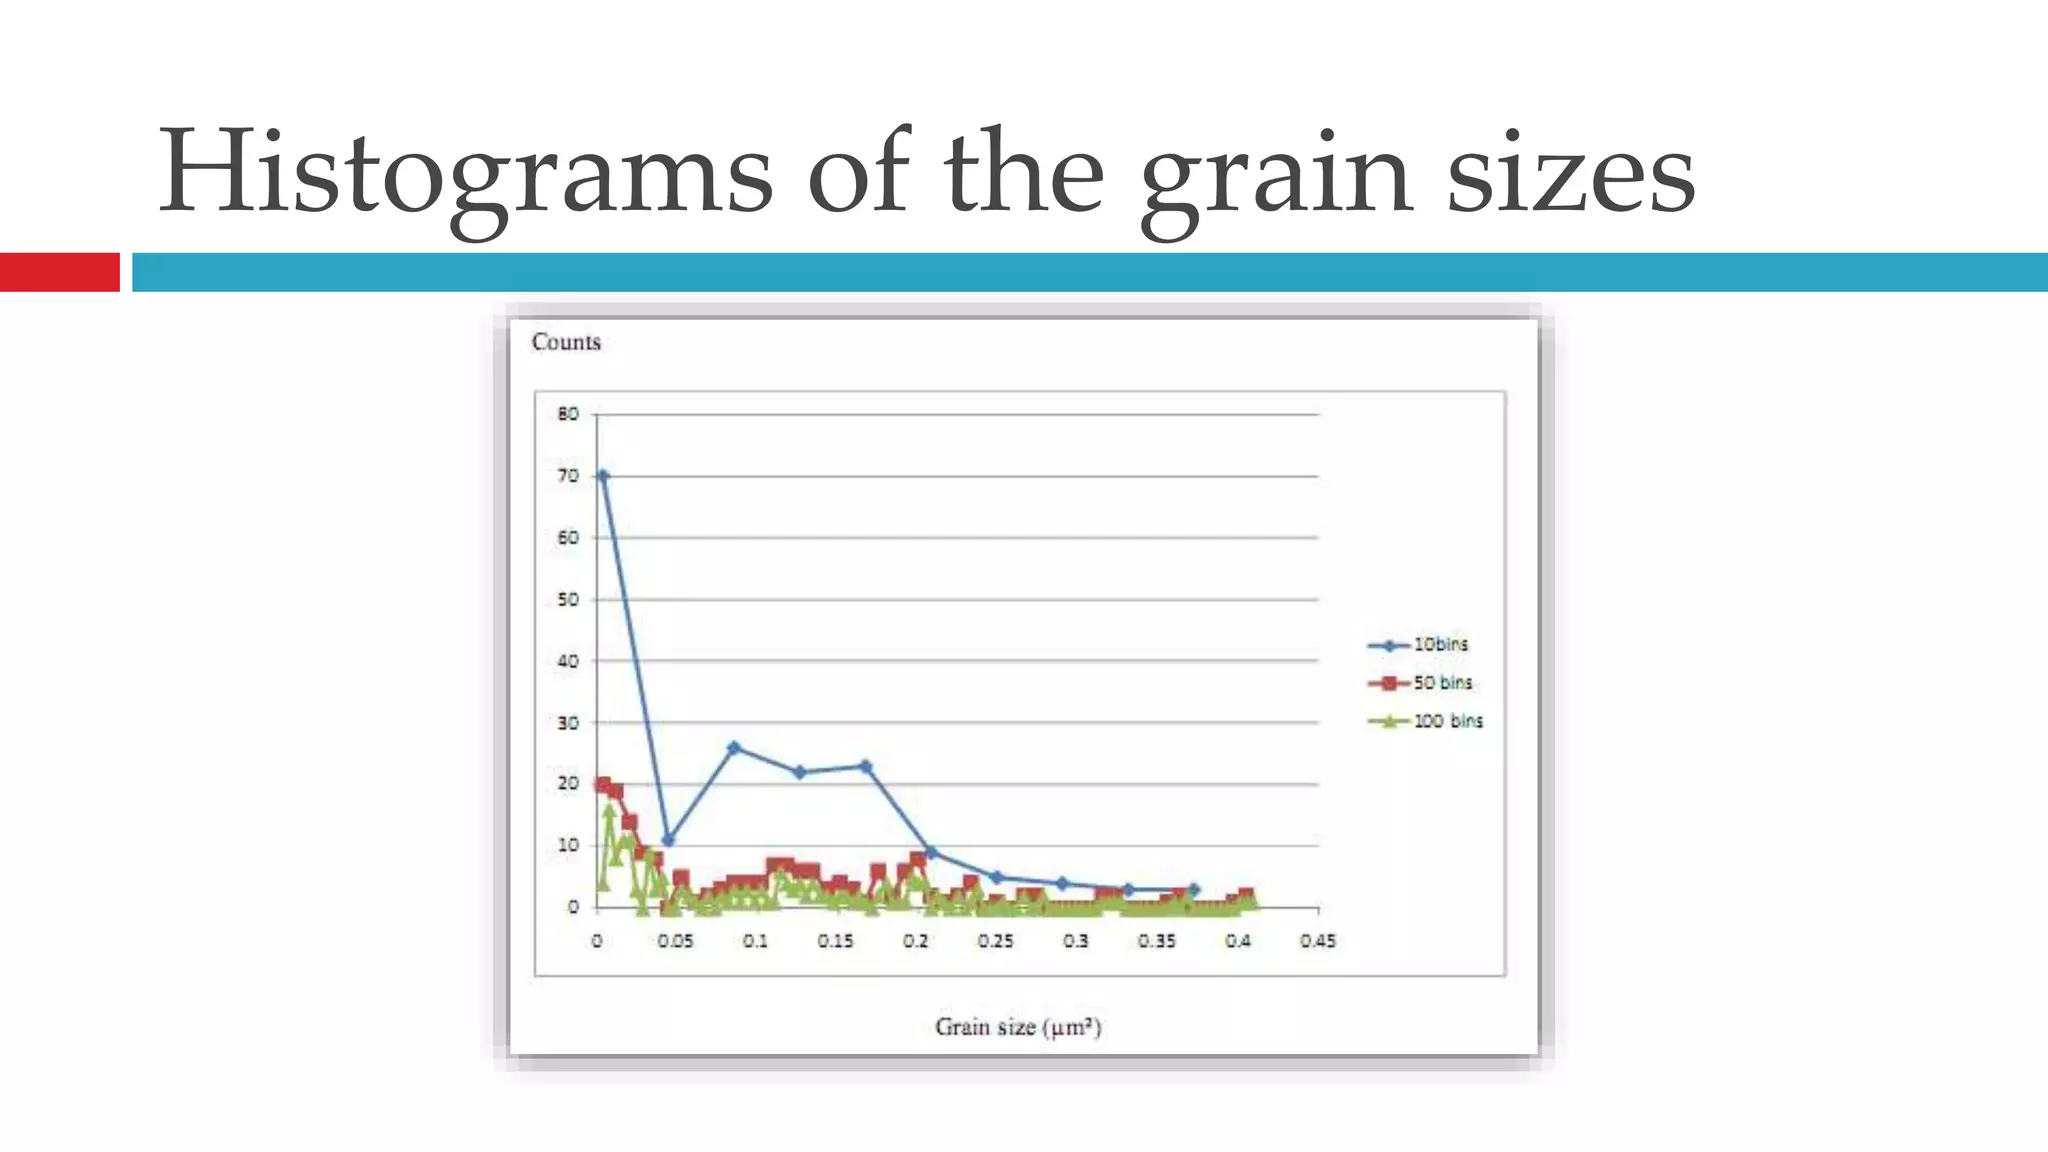
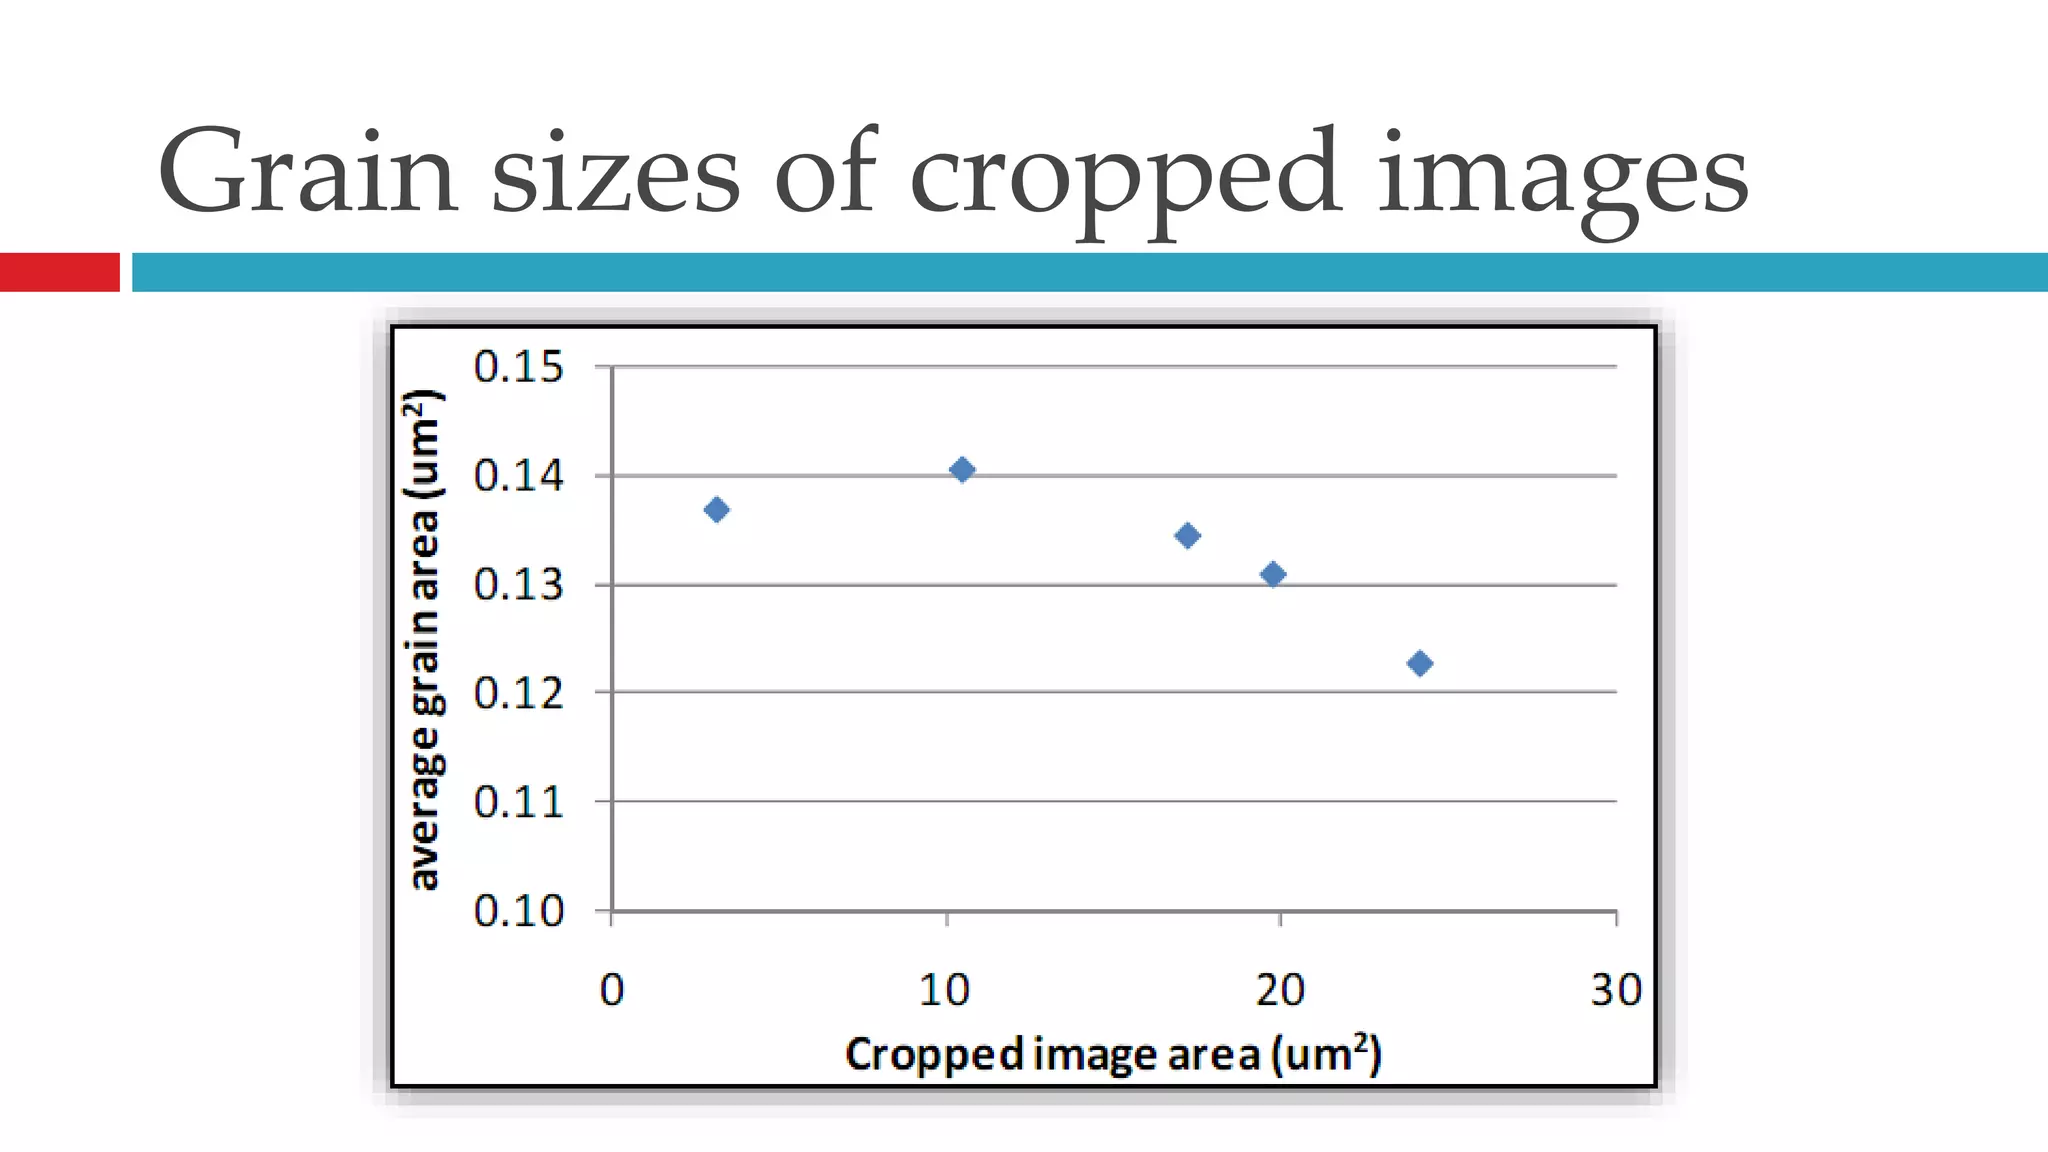
Analyze Particlesby using imageJhttp://rsb.info.nih.gov/ij/docs/menus/analyze.html#apBy Nguyen Hoang Viet, PhD.
ContentWhere to downloadHow to run ImageJImage Processing & Calculation
Visit this link:http://rsbweb.nih.gov/ij/download.htmlNote:  please check your window first, 32- or 64-bit systemWhere to download
First – Run ImageJ program and Load the your image file.How to run ImageJ
Open Image FileRun ImageJ: Start/All Programs/ImageJ/Open Image File: File/Open…, choose the file and click OK
Image Processing & Calculation
Step 1 – Convert to 8-bit & CropOpen Image File: File/Open…, choose the file and click OK - Grain Size Calculation.jpgConvert to 8-bit: Image/Type/8-bit.Crop: Draw a rectangular shape then Image/Type/Crop.Save the cropped file: File/Save as/Jpeg… - Grain Size Calculation-Crop.tif
Measurement scale unitDraw a rectangular shape fits on scale bar. You will see its width to be 237 px.So, 1 m equals 79px.
Step 2: Convert to grainy imageImage/Adjust/Threshold:Other processing:Process/Binary/Erode
Process/Binary/Dilate Step 3: Analyze ParticlesAnalyze/Analyze Particles …There are two data files:Results.xlsSummary.xlsAverage grain size:708 px2= 0,113m2.
How to set new scale barAnalyze/Set ScaleThen, the unit in imageJwill be µm (micrometer)
Step 4: Analyze data Based on two data files in Excel format, you should find a software for doing further analysis. Such software like: Excel, MatLab, Origin, SciLab*, SciDAVis* …*: free software
Step 4: Analyze data (2) On the “Results” dialog. Choose Results/Distribution… the set bin number for ‘specify bins’ field: 10, 50 and 100.Based on Histogram dialogClick on List to get data list,then you should use other software to draw the graph.
Terms: What is bin(s)?In a particle size distribution measurement, typically each distribution, whether is displayed cumulatively or differentially, is composed of a few hundred data points in a pre-set size range. Each data points is called a bin. Since every particle is measured, each bin is a collection of particles in the size range that bin represents. Depending on the distribution broadness, the total size range can be reset to a finer division, therefore showing the distribution details, i.e., each bin can be pre-set to cover a smaller size range. Other advantages include fine differential between two particles and more accurate statistic values calculated from the distribution.More at http://www.spectrex.com/html_files/practanl.html
Histograms of the grain sizes
Grain sizes of cropped images
Acknowledgement Thank my students, ATP k52 (Fall 2010), for doing well this homework and have good suggestion for further processing.

Grain size analysis by using ImageJ

  • 1.
    Analyze Particlesby usingimageJhttp://rsb.info.nih.gov/ij/docs/menus/analyze.html#apBy Nguyen Hoang Viet, PhD.
  • 2.
    ContentWhere to downloadHowto run ImageJImage Processing & Calculation
  • 3.
    Visit this link:http://rsbweb.nih.gov/ij/download.htmlNote: please check your window first, 32- or 64-bit systemWhere to download
  • 4.
    First – RunImageJ program and Load the your image file.How to run ImageJ
  • 5.
    Open Image FileRunImageJ: Start/All Programs/ImageJ/Open Image File: File/Open…, choose the file and click OK
  • 6.
  • 7.
    Step 1 –Convert to 8-bit & CropOpen Image File: File/Open…, choose the file and click OK - Grain Size Calculation.jpgConvert to 8-bit: Image/Type/8-bit.Crop: Draw a rectangular shape then Image/Type/Crop.Save the cropped file: File/Save as/Jpeg… - Grain Size Calculation-Crop.tif
  • 9.
    Measurement scale unitDrawa rectangular shape fits on scale bar. You will see its width to be 237 px.So, 1 m equals 79px.
  • 10.
    Step 2: Convertto grainy imageImage/Adjust/Threshold:Other processing:Process/Binary/Erode
  • 11.
    Process/Binary/Dilate Step 3:Analyze ParticlesAnalyze/Analyze Particles …There are two data files:Results.xlsSummary.xlsAverage grain size:708 px2= 0,113m2.
  • 12.
    How to setnew scale barAnalyze/Set ScaleThen, the unit in imageJwill be µm (micrometer)
  • 13.
    Step 4: Analyzedata Based on two data files in Excel format, you should find a software for doing further analysis. Such software like: Excel, MatLab, Origin, SciLab*, SciDAVis* …*: free software
  • 14.
    Step 4: Analyzedata (2) On the “Results” dialog. Choose Results/Distribution… the set bin number for ‘specify bins’ field: 10, 50 and 100.Based on Histogram dialogClick on List to get data list,then you should use other software to draw the graph.
  • 15.
    Terms: What isbin(s)?In a particle size distribution measurement, typically each distribution, whether is displayed cumulatively or differentially, is composed of a few hundred data points in a pre-set size range. Each data points is called a bin. Since every particle is measured, each bin is a collection of particles in the size range that bin represents. Depending on the distribution broadness, the total size range can be reset to a finer division, therefore showing the distribution details, i.e., each bin can be pre-set to cover a smaller size range. Other advantages include fine differential between two particles and more accurate statistic values calculated from the distribution.More at http://www.spectrex.com/html_files/practanl.html
  • 16.
  • 17.
    Grain sizes ofcropped images
  • 18.
    Acknowledgement Thank mystudents, ATP k52 (Fall 2010), for doing well this homework and have good suggestion for further processing.
  • 19.
    Any questions? Pleaseemail me at viet4777@gmail.com for further informationDiscussion time!
  • 20.
    Widescreen PresentationEven ifyou do not have a widescreen display, you can still create and present 16:9 slides. PowerPoint’s Slide Show always resizes your slides to fit any screen.This template is formatted with a 16:9 “widescreen” aspect ratio. It’s a great way to take advantage of laptops, televisions and projectors equipped with widescreen displays.
  • 21.
    Widescreen AdvantagesSide byside material fits more naturally.Widescreen adds drama to graphics and images.
  • 22.
    Widescreen GraphicsEven asingle graphic, such as a chart, can be presented more dramatically in widescreen.
  • 23.
    Pictures can alsobe presented more dramatically in widescreen.Widescreen Pictures
  • 24.
    Creating 16:9 PresentationsTosetup a widescreen presentation, do one of the following:Start with this template. Simply delete the example slides and add your own content.Or, go to the Design tab and open the Page Setup Dialog. Click the Slide Sizedropdown and pick On-screen Show (16:9) (Note: we also support 16:10, which is a common widescreen laptop resolution. )Important: Always start with your slide size set to the aspect ratio you intend to use. If you change the slide size after you’ve created some slides, your pictures and other graphics will be resized. This could potentially distort their appearance.
  • 25.
    Slide Show TipsTopresent in true widescreen, you’ll need a computer and, optionally, a projector or flat panel that can output widescreen resolutions.Common computer widescreen resolutions are 1280 x 800 and 1440 x 900. (These are 16:10 aspect ratio, but will work well with 16:9 projectors and screens.)Standard high definition televisions resolutions are1280 x 720 and 1920 x 1080. Use the Test Pattern on the next slide to verify your slide show settings.
  • 26.
    Widescreen Test Pattern(16:9)Aspect Ratio Test(Should appear circular)4x316x9