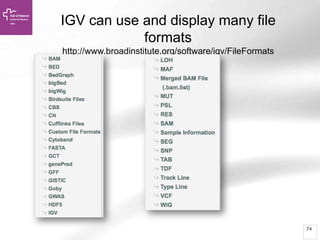
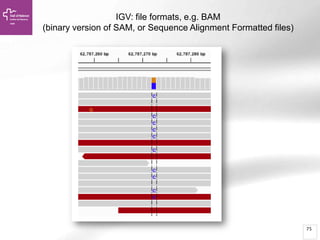
Download as PDF, PPTX

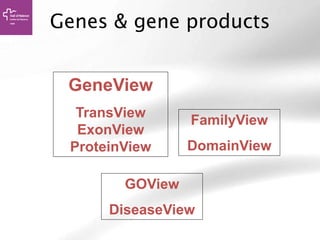
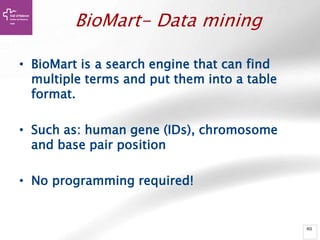
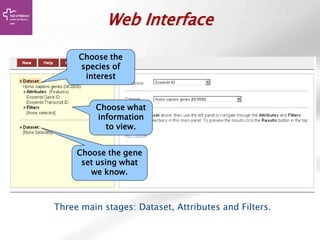
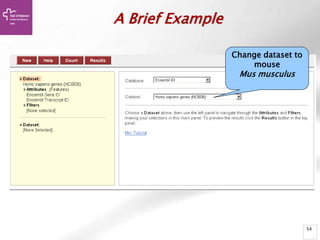
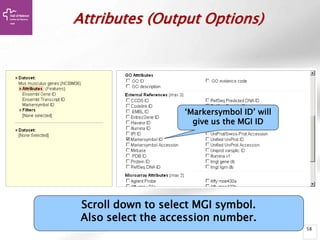
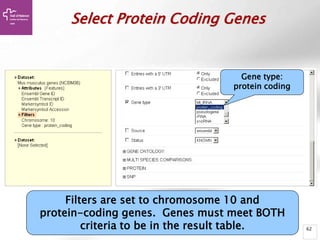
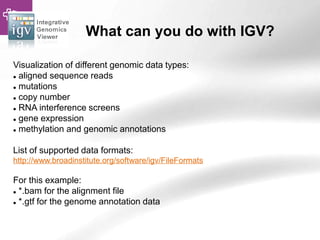
![Searching sequences: Results
• Alignment Locations vs.
Karyotype. The alignment [A] shows
all hits on the genome. The best hit
is boxed. In this case, BLAT shows
one hit.
• Alignment Locations vs. Query. The
alignment [B] shows hits, or High
Scoring Pairs (HSPs), as a red bar
along the query sequence (the black
and white bar below).
• Alignment Summary. The
summary [C] shows a table of hits,
with customisable columns. Links
are provided from the table. The
link 'A' shows an alignment of the
query and target sequence. 'G'
shows the hit on the genome. 'C'
brings you to the location tab,
where you can see the BLAT hit in
context of genes in that region.](https://image.slidesharecdn.com/bbr-1-140522075509-phpapp01/85/Genome-Browsing-Genomic-Data-Mining-and-Genome-Data-Visualization-with-Ensembl-Biomart-and-IGV-UEB-UAT-Bioinformatics-Course-Session-1-3-VHIR-Barcelona-16-320.jpg)


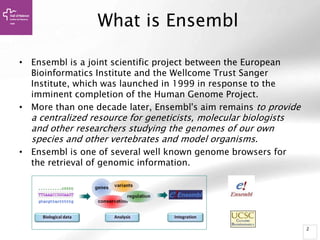
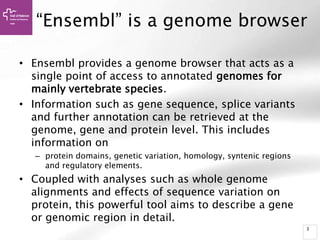
The document provides an overview of Ensembl, a genome browser developed to facilitate access to annotated genomes, primarily for vertebrates, by offering information on gene sequences, variations, and annotations. It highlights the functionalities of Ensembl, including genome searching, data visualization tools like IGV, and data mining with BioMart for genomic information retrieval. Additionally, it addresses the appropriate use cases for Ensembl and the alternatives available for specific queries or data types.


![Polymer [ बहुलक ] Chemistry Notes PDF - Irfanullah Mehar - JJ Sir Chemistry.pdf](https://cdn.slidesharecdn.com/ss_thumbnails/polymerchemistrynotespdf-irfanullahmehar-jjsirchemistry-260210172118-3f9b37f7-thumbnail.jpg?width=640&height=640&fit=bounds)


