SlideShare a Scribd company logo
1 of 43
Caveats and Comments
1
Overview:
This is my analysis, not Stanford’s. My goal is to understand the trajectory of COVID. It is not confidential and can be freely shared. The R program code is
available at https://github.com/StevenLShafer/COVID19/. The daily analysis are available at https://1drv.ms/u/s!AuOyHP_aTIy7rowrt2AjGpWm_frnEQ?e=KBcNbh.
You are welcome to use the R code on GitHub for any purpose.
I am attempting to keep the analysis and commentary apolitical. I am now including partisan lean as a metric to help understand the epidemic. I occasionally point
out misrepresentations by government officials. I occasionally point out where government recommendations have placed Americans at increasing risk.
I try to provide a daily update in the morning, except Sundays. My analysis my be delayed by my clinical responsibilities as a Stanford anesthesiologist.
There is a lot of information on the figures. If something isn’t clear, please see the explanation on slide 2.
Data sources:
β€’ USA Case Data: https://github.com/CSSEGISandData/COVID-19/raw/master/csse_covid_19_data/csse_covid_19_time_series/time_series_covid19_confirmed_US.csv
β€’ USA Death Data: https://github.com/CSSEGISandData/COVID-19/raw/master/csse_covid_19_data/csse_covid_19_time_series/time_series_covid19_deaths_US.csv
β€’ USA Testing and Hospitalization Data: https://raw.githubusercontent.com/COVID19Tracking/covid-tracking-data/master/data/states_daily_4pm_et.csv
β€’ Global Case Data: https://github.com/CSSEGISandData/COVID-19/raw/master/csse_covid_19_data/csse_covid_19_time_series/time_series_covid19_confirmed_global.csv
β€’ Global Death Data: https://github.com/CSSEGISandData/COVID-19/raw/master/csse_covid_19_data/csse_covid_19_time_series/time_series_covid19_deaths_global.csv
β€’ Global Testing Data: https://raw.githubusercontent.com/owid/covid-19-data/master/public/data/owid-covid-data.csv
β€’ Mobility Data: https://www.gstatic.com/covid19/mobility/Global_Mobility_Report.csv
β€’ Partisan Lean: MIT Election Data and Science Lab: https://doi.org/10.7910/DVN/VOQCHQ/HEIJCQ
β€’ Ensemble Model: https://github.com/reichlab/covid19-forecast-hub/raw/master/data-processed/COVIDhub-ensemble/2020-xx-xx-COVIDhub-ensemble.csv
Models:
1. Future projections of case numbers are based on the Gompertz function (https://en.wikipedia.org/wiki/Gompertz_function): log π‘π‘’π‘šπ‘’π‘™π‘Žπ‘‘π‘–π‘£π‘’ π‘π‘Žπ‘ π‘’π‘  =
π‘π‘’π‘Ÿπ‘Ÿπ‘’π‘›π‘‘ π‘π‘Žπ‘ π‘’π‘  + π‘šπ‘Žπ‘₯π‘–π‘šπ‘’π‘š π‘π‘Žπ‘ π‘’π‘  βˆ’ π‘π‘’π‘Ÿπ‘Ÿπ‘’π‘›π‘‘ π‘π‘Žπ‘ π‘’π‘  1 βˆ’ π‘’βˆ’π‘˜ 𝑑 . This is a naΓ―ve asymptotic model. k is the rate constant, such that log(2) / k = time to 50%
rise. t is the number of days. Wikipedia The Gompertz function is estimated from the last 3 weeks of data for cumulative cases (red dots in the figures).
Deaths are predicted from a log linear regression of deaths over the past 21 days. For the US, and individual states, I am also including the 98% prediction
interval from the COVID-19 Forecast Hub (https://covid19forecasthub.org/).
2. The rate of change in daily cases and deaths is the slope of delta cases / day over the last 14 days, divided by the average number of cases.
Locations
The locations for the modeling are where Pamela and I have family and friends, locations of interest to friends and colleagues, or countries in the news (e.g.,
China, South Korea, Sweden, Brazil) or with significant economic impact on the United States (e.g., Japan, Canada, Mexico). Locations are easy to add.
Stay safe, well, resilient, and kind.
Steve Shafer
steven.shafer@Stanford.edu
2,586,092
152,804
1
10
100
1,000
10,000
100,000
1,000,000
10,000,000
100,000,000
Actual(points)/Predicted(line)
Phase
Pre-Model
Modeled
Deaths
Tests
USA projection as of 2020-05-27
0
10,000
20,000
30,000
0
2,000
4,000
6,000
Cases/Day
Deaths/Day
Cases: 1,662,302 (32,123) -- Deaths: 98,220 (829) -- Case Mortality: 5.9% -- Daily Change in Cases: -0.5%
Explanation of the Figures
2
Brown dots:
cumulative tests
Red dots: cumulative cases
used to estimate Gompertz
function, presently set to last
3 weeks
Red line: predicted cumulative
cases based on the Gompertz
function estimated from the red
dots
Red number: total cases
on June 30th, based on
the Gompertz function
estimated from the red
dots
Black number: total
Deaths on July 31th,
based on log-linear
regression of the past
21 days
Black line: predicted
cumulative deaths, based
on a log linear regression
of deaths over past 21
days.
Axis for deaths / day, usually
1/10th of the axis for cases /
day on the left side of the
figure.
Green line: linear regression
over 8 days, used to calculate
percent increase / decrease
(see below)
Daily change in cases,
calculated as the slope of the
green line (above left) /
number of new cases
yesterday.
Case mortality:
cumulative deaths
/ cumulative cases.
Cases / day calculated
from cumulative cases
used to estimate the
Gompertz function
Cases / day calculated
from cumulative cases
not used to estimate the
Gompertz function
Deaths / day,
axis is on the left
Blue line: today
Blue dots: cumulative cases not
used to estimate Gompertz
function
Cumulative cases
(yesterday’s cases)
and cumulative deaths
(yesterday’s deaths)
Axis for cases / day.
Axis for deaths / day
appears to the right.
Geographic
location
Date of analysis,
also shown as
blue vertical line
below
Purple wedge: 98% ensemble
prediction interval from COVID-19
Forecast Hub (USA and US
States only)
Worldwide
41,985,285
1,245,451
1
10
100
1,000
10,000
100,000
1,000,000
10,000,000
100,000,000
Cumulative
Phase
Pre-Model
Modeled
Deaths
Worldwide projection as of 2020-09-21
10
1,000
100,000
CasesandDeaths/Day
Cases: 31,027,306 (241,287) -- Deaths: 960,679 (3,696) -- Case Mortality: 3.1% -- Daily Change: +0.6% Cases, -1.0% Deaths
2020-09-21 Summary: 3
USA
8,146,675
237,527
1
10
100
1,000
10,000
100,000
1,000,000
10,000,000
100,000,000
Cumulative
Phase
Pre-Model
Modeled
Deaths
Tests
USA projection as of 2020-09-21
Mother'sDay
MemorialDay
July4th
July15,2020
LaborDay
10
1,000
100,000
CasesandDeaths/Day
Cases: 6,810,879 (36,765) -- Deaths: 199,509 (227) -- Case Mortality: 2.9% -- Daily Change: +2.2% Cases, +0.4% Deaths
2020-09-21 Summary: 4
Non-authoritarian Asian ensemble
131,751
2,747
1
10
100
1,000
10,000
100,000
1,000,000
10,000,000
100,000,000
Cumulative
Phase
Pre-Model
Modeled
Deaths
Tests
Japan, South Korea, Thailand, and Vietnam (Population = 328 MM)
Non-authoritarian Asian ensemble projection as of 2020-09-21
1.0
10.0
100.0
1,000.0
CasesandDeaths/Day
Cases: 106,761 (550) -- Deaths: 1,987 (6) -- Case Mortality: 1.9% -- Daily Change: -0.8% Cases, -1.7% Deaths
2020-09-21 Summary: 5
Western Europe
3,349,281
163,296
1
10
100
1,000
10,000
100,000
1,000,000
10,000,000
100,000,000
Cumulative
Phase
Pre-Model
Modeled
Deaths
Tests
Belgium, France, Germany, Greece, Italy, Portugal, Spain, Netherlands, Luxembourg, and the UK (Population = 344MM)
Western Europe projection as of 2020-09-21
10
1,000
100,000
CasesandDeaths/Day
Cases: 2,256,481 (9,191) -- Deaths: 157,348 (59) -- Case Mortality: 7.0% -- Daily Change: -1.2% Cases, +5.0% Deaths
2020-09-21 Summary: 6
Comparison of COVID-19 Cases & Deaths
between US & Europe
Cases
Deaths
44,494
12,906
664
144
3
10
30
100
300
1,000
3,000
10,000
30,000
100,000
Date
DailyCasesandDeaths
Location
USA (318MM)
Western Europe (344MM)
Log plot of 7 day average
Comparison of COVID-19 Cases & Deaths between US & Europe
The numbers on the right are yesterday's figures, and will differ a bit from the plotted rolling mean
2020-09-21 Summary: 7
Worldwide cases
USA
India
Brazil
Russia
Colombia
Peru
Mexico
SouthAfrica
Spain
Argentina
France
Chile
Iran
UnitedKingdom
Bangladesh
SaudiArabia
Iraq
Pakistan
Turkey
Italy
Philippines
Germany
Indonesia
Israel
Ukraine
Canada
Bolivia
Ecuador
Romania
DominicanRepublic
Kazakhstan
Belgium
Egypt
Morocco
Netherlands
China
Sweden
Guatemala
Poland
Japan
Belarus
Honduras
Ethiopia
Portugal
Venezuela
Nepal
Nigeria
Uzbekistan
Algeria
CzechRepublic
Switzerland
Ghana
Kyrgyzstan
Azerbaijan
Afghanistan
Austria
Kenya
Paraguay
Serbia
Libya
ElSalvador
Australia
Denmark
SouthKorea
Cameroon
USA
0
2,000,000
4,000,000
6,000,000
1 6 11 16 21 26 31 36 41 46 51 56 61 66
Rank
Totalcasestodate
Worldwide cases
Excludes countries with population < 5,000,000
2020-09-21 Summary: 8
Worldwide cases
Chile
Israel
Peru
Brazil
USA
Colombia
Spain
Argentina
SouthAfrica
Bolivia
SaudiArabia
DominicanRepublic
Iraq
Sweden
Belgium
Honduras
Ecuador
Kyrgyzstan
Russia
Belarus
France
Kazakhstan
UnitedKingdom
Switzerland
Guatemala
Portugal
Iran
Mexico
Netherlands
Italy
Romania
CzechRepublic
Paraguay
Azerbaijan
India
Austria
Serbia
Libya
Canada
Denmark
Turkey
Ukraine
ElSalvador
Germany
Philippines
Morocco
Bulgaria
Venezuela
Nepal
Bangladesh
Poland
Ghana
Uzbekistan
Hungary
Pakistan
Finland
Algeria
Greece
Afghanistan
Tajikistan
Australia
Egypt
Slovakia
Zambia
Cameroon
USA
None
1 in 200
1 in 100
1 in 67
1 in 50
1 in 40
1 in 33
1 6 11 16 21 26 31 36 41 46 51 56 61 66
Rank
Totalcasestodate
Worldwide cases
Excludes countries with population < 5,000,000
2020-09-21 Summary: 9
Average new cases over past 7 days
Israel
Argentina
Spain
Peru
CzechRepublic
Colombia
Brazil
Iraq
USA
France
Belgium
Libya
Paraguay
Chile
Netherlands
Ecuador
Austria
India
Hungary
Denmark
Honduras
DominicanRepublic
Ukraine
Morocco
Portugal
UnitedKingdom
Bolivia
Romania
Tunisia
Nepal
Switzerland
Iran
Russia
Mexico
Philippines
Guatemala
Jordan
SouthAfrica
Venezuela
Canada
Slovakia
Italy
Greece
Sweden
Uzbekistan
Belarus
Turkey
SaudiArabia
Germany
Poland
Bulgaria
Indonesia
Azerbaijan
ElSalvador
Kyrgyzstan
Serbia
Bangladesh
Finland
Mozambique
Myanmar
Ethiopia
Zambia
Algeria
Angola
Uganda
USA
None
1 in 10,000
1 in 5,000
1 in 3,333
1 in 2,500
1 in 2,000
1 in 1,667
1 in 1,429
1 6 11 16 21 26 31 36 41 46 51 56 61 66
Rank
Averagecases/day
Average new cases over past 7 days
Excludes countries with population < 5,000,000
2020-09-21 Summary: 10
Worldwide deaths
USA
Brazil
India
Mexico
UnitedKingdom
Italy
Peru
France
Spain
Iran
Colombia
Russia
SouthAfrica
Argentina
Chile
Ecuador
Belgium
Indonesia
Germany
Canada
Iraq
Bolivia
Turkey
Pakistan
Netherlands
Sweden
Egypt
Philippines
Bangladesh
China
SaudiArabia
Romania
Ukraine
Guatemala
Poland
Honduras
DominicanRepublic
Switzerland
Portugal
Morocco
Algeria
Kazakhstan
Japan
Afghanistan
Israel
Nigeria
Ethiopia
Kyrgyzstan
Australia
Sudan
ElSalvador
Belarus
Austria
Bulgaria
Serbia
Hungary
Paraguay
Kenya
Denmark
Yemen
Azerbaijan
Venezuela
CzechRepublic
Libya
Uzbekistan
USA
0
50,000
100,000
150,000
200,000
1 6 11 16 21 26 31 36 41 46 51 56 61 66
Rank
Totaldeathstodate
Worldwide deaths
Excludes countries with population < 5,000,000
2020-09-21 Summary: 11
Worldwide deaths
Peru
Belgium
Bolivia
Ecuador
Spain
Chile
UnitedKingdom
Brazil
Mexico
Sweden
USA
Italy
Colombia
France
Netherlands
Iran
SouthAfrica
Argentina
Honduras
Canada
Iraq
Switzerland
Guatemala
DominicanRepublic
Romania
Kyrgyzstan
Portugal
Israel
SaudiArabia
Russia
Germany
Denmark
ElSalvador
Kazakhstan
Bulgaria
Serbia
Turkey
Paraguay
Austria
Belarus
Ukraine
India
Libya
Azerbaijan
Egypt
Hungary
Finland
Poland
Morocco
Philippines
Afghanistan
CzechRepublic
Algeria
Australia
Indonesia
Pakistan
Sudan
Bangladesh
Greece
Zambia
Nicaragua
Yemen
Haiti
Cameroon
Senegal
USA
None
1 in 5,000
1 in 2,500
1 in 1,667
1 in 1,250
1 in 1,000
1 in 833
1 6 11 16 21 26 31 36 41 46 51 56 61 66
Rank
Totaldeathstodate
Worldwide deaths
Excludes countries with population < 5,000,000
2020-09-21 Summary: 12
Average daily deaths over past 7 days
Argentina
Bolivia
Colombia
Peru
Brazil
Mexico
Chile
Israel
Paraguay
Iraq
Iran
Spain
USA
Ecuador
Honduras
Libya
Romania
Guatemala
SouthAfrica
DominicanRepublic
Ukraine
SaudiArabia
India
Morocco
Philippines
Turkey
Russia
Bulgaria
France
Hungary
Tunisia
CzechRepublic
Portugal
ElSalvador
Indonesia
Belarus
Greece
Switzerland
Poland
Nepal
Venezuela
UnitedKingdom
Kazakhstan
Belgium
Sweden
Algeria
Azerbaijan
Netherlands
Australia
Italy
Uzbekistan
Egypt
Myanmar
Angola
Bangladesh
Zambia
Austria
Denmark
Canada
Serbia
Jordan
Ethiopia
Syria
Kenya
Afghanistan
USA
None
1 in 1,000,000
1 in 500,000
1 in 333,333
1 in 250,000
1 in 200,000
1 in 166,667
1 in 142,857
1 6 11 16 21 26 31 36 41 46 51 56 61 66
Rank
Averagedeaths/day
Average daily deaths over past 7 days
Excludes countries with population < 5,000,000
2020-09-21 Summary: 13
Case Mortality vs. Testing
AREBHR
LUX
DNK
MLTISR
USA
ISL
RUS
AUS
LTU
GBR
QATMDV
BEL
PRT
IRL
NZL
BLR
CAN
SAU
DEU
ESP
NOR
KWT
AUT
FIN
CHL
SRBLVA
SGP
KAZ
CHE
EST
NLD
ROU
GRC
CZE
TUR
ITA
SVN
PAN
POL
SVK
BGR
ZAF
HUN
HRVMAR
URY
COL
SLV
IRQ
CUBUKR
IND
MYS
IRN
KOR
DOM
RWA
CRI
PRYARG
NPL
PHLLBY
BRA
BOL
PER
ECU
JPN
TUN
GHA
PAK
LKA
MEX
FJI
BGD
SEN
ETH
TGO
UGA
KENJOR
ZWE
ZMB
THA
IDN
CIVMOZ
TWN
MMR
VNM
MWI
NGA
USA
0.0
2.5
5.0
7.5
10.0
12.5
0 25 50 75
% Tested
%CaseMortality
Case Mortality vs. Testing as of 2020-09-21
ARE: United Arab Emirates, BHR:Bahrain, MLT: Malta, ISR: Israel, LTU: Lithuania, ISL: Iceland
2020-09-21 Summary: 14
Mortality Trends
0
2
4
6
8
10
12
14
USCaseRateMortality
Mortality Type:
13 day rolling median
Cumulative
Daily Raw
Daily vs. Cumulative US Case Rate Mortality
Last week excluded because deaths are often backdated
2020-09-21 Summary: 15
Change in New Cases per Day
New cases are:
Increasing > +3%
Increasing between +1% and +3%
No Change (-1% to +1%)
Decreasing between -1% and -3%
Decreasing > -3%
New cases by state as of 2020-09-21
2020-09-21 Summary: 16
Cases as a Percent of Peak Cases
HI TX FL
OK LA MS AL GA
AZ NM KS AR TN NC SC DC
CA UT CO NE MO KY WV VA MD DE
OR NV WY SD IA IN OH PA NJ CT RI
WA ID MT ND MN IL MI NY MA
WI VT NH
AK ME
0
25
50
75
100
0
25
50
75
100
0
25
50
75
100
0
25
50
75
100
0
25
50
75
100
0
25
50
75
100
0
25
50
75
100
0
25
50
75
100
PercentofPeak
Daily Cases as a Percent of Peak Cases
2020-09-21 Summary: 17
Change in New Deaths per Day
New deaths are:
Increasing > +0.5%
Increasing between +0.1% and +0.5%
No Change (-0.1% to +0.1%)
Decreasing between -0.1% and -0.5%
Decreasing > -0.5%
New deaths by state as of 2020-09-21
2020-09-21 Summary: 18
Deaths as a Percent of Peak Deaths
HI TX FL
OK LA MS AL GA
AZ NM KS AR TN NC SC DC
CA UT CO NE MO KY WV VA MD DE
OR NV WY SD IA IN OH PA NJ CT RI
WA ID MT ND MN IL MI NY MA
WI VT NH
AK ME
0
25
50
75
100
0
25
50
75
100
0
25
50
75
100
0
25
50
75
100
0
25
50
75
100
0
25
50
75
100
0
25
50
75
100
0
25
50
75
100
PercentofPeak
Daily Deaths as a Percent of Peak Deaths
2020-09-21 Summary: 19
Change in cases vs. change in deaths over
last 14 days
AL
AK
AZ
AR
CA
CO
CT DE
DC
FL
GA
HI
ID
IL
IN
IA
KS
KY
ME
MA
MI
MN
MT
NE
NV
NH
NM
NY
NC
ND
OH
OK
OR
PA
RI
SC
TX
UT
VT
VA WV
WI
WY
-6
-3
0
3
6
-6 -3 0 3 6
Change in cases (%/day)
Changeindeaths(%/day)
Change in cases vs. change in deaths over last 14 days as of 2020-09-21
Size is proportional total cases per capita
2020-09-21 Summary: 20
Total US COVID-19 Cases
California
Texas
Florida
NewYork
Georgia
Illinois
Arizona
NewJersey
NorthCarolina
Tennessee
Louisiana
Pennsylvania
Alabama
Ohio
Virginia
SouthCarolina
Massachusetts
Michigan
Maryland
Missouri
Indiana
Wisconsin
Mississippi
Minnesota
Washington
Iowa
Oklahoma
Nevada
Arkansas
Colorado
Utah
Kentucky
Connecticut
Kansas
Nebraska
Idaho
Oregon
NewMexico
RhodeIsland
Delaware
SouthDakota
NorthDakota
DistrictofColumbia
WestVirginia
Hawaii
Montana
NewHampshire
Alaska
Maine
Wyoming
Vermont
0
250,000
500,000
750,000
1 6 11 16 21 26 31 36 41 46 51
Rank
Totalcases
Masks
No
Yes
Governor
aa
Democratic
Republican
Total US COVID-19 Cases
p masks as of July 20, 2020: 0.49, p governor: 0.82. NB: association != causation.
2020-09-21 Summary: 21
Total US COVID-19 Cases
Louisiana
Florida
Mississippi
Alabama
Arizona
Georgia
Tennessee
SouthCarolina
Iowa
Arkansas
Nevada
Texas
NorthDakota
NewYork
NewJersey
RhodeIsland
Illinois
Nebraska
DistrictofColumbia
SouthDakota
Idaho
Delaware
California
Utah
Maryland
Oklahoma
Massachusetts
Missouri
NorthCarolina
Wisconsin
Kansas
Indiana
Virginia
Minnesota
Connecticut
Kentucky
NewMexico
Michigan
Ohio
Pennsylvania
Colorado
Washington
Montana
Alaska
Wyoming
Hawaii
WestVirginia
Oregon
NewHampshire
Maine
Vermont
None
1 in 100
1 in 50
1 in 33
1 in 25
1 6 11 16 21 26 31 36 41 46 51
Rank
TotalCases
Masks
No
Yes
Governor
aa
Democratic
Republican
Total US COVID-19 Cases
p masks as of July 20, 2020: 0.25, p governor: 0.032. NB: association != causation.
2020-09-21 Summary: 22
Average US COVID-19 cases over the past
7 days
NorthDakota
Wisconsin
SouthDakota
Oklahoma
Utah
Arkansas
Iowa
Missouri
Tennessee
Nebraska
SouthCarolina
Alabama
Kansas
Idaho
Montana
Mississippi
Georgia
Texas
Kentucky
Minnesota
Illinois
Louisiana
Florida
Indiana
Wyoming
NorthCarolina
Virginia
Delaware
WestVirginia
Alaska
Nevada
Arizona
Maryland
California
Colorado
RhodeIsland
Ohio
DistrictofColumbia
Hawaii
Michigan
Pennsylvania
NewMexico
Washington
Oregon
NewJersey
Connecticut
NewYork
NewHampshire
Maine
Vermont
Massachusetts
None
1 in 10,000
1 in 5,000
1 in 3,333
1 in 2,500
1 in 2,000
1 6 11 16 21 26 31 36 41 46 51
Rank
NewCases/Day
Masks
No
Yes
Governor
aa
Democratic
Republican
Average US COVID-19 cases over the past 7 days
p masks as of July 20, 2020: 0.00034, p governor: 0.0016. NB: association != causation.
2020-09-21 Summary: 23
Total US COVID-19 Deaths
NewYork
NewJersey
Texas
California
Florida
Massachusetts
Illinois
Pennsylvania
Michigan
Georgia
Arizona
Louisiana
Ohio
Connecticut
Maryland
Indiana
NorthCarolina
SouthCarolina
Virginia
Mississippi
Alabama
Tennessee
Washington
Minnesota
Colorado
Missouri
Nevada
Iowa
Wisconsin
Arkansas
Kentucky
RhodeIsland
Oklahoma
NewMexico
Delaware
DistrictofColumbia
Kansas
Oregon
Idaho
Nebraska
Utah
NewHampshire
WestVirginia
SouthDakota
NorthDakota
Montana
Maine
Hawaii
Vermont
Wyoming
Alaska
0
10,000
20,000
30,000
1 6 11 16 21 26 31 36 41 46 51
Rank
TotalDeaths
Masks
No
Yes
Governor
aa
Democratic
Republican
Total US COVID-19 Deaths
p masks as of July 20, 2020: 0.066, p governor: 0.28. NB: association != causation.
2020-09-21 Summary: 24
Total US COVID-19 Deaths
NewJersey
NewYork
Massachusetts
Connecticut
Louisiana
RhodeIsland
Mississippi
DistrictofColumbia
Arizona
Michigan
Illinois
Maryland
Delaware
Georgia
Pennsylvania
SouthCarolina
Florida
Indiana
Texas
Nevada
Alabama
NewMexico
Iowa
Ohio
Arkansas
California
Minnesota
Virginia
Colorado
Tennessee
NewHampshire
NorthCarolina
Missouri
Washington
NorthDakota
Kentucky
Idaho
Oklahoma
Nebraska
SouthDakota
Wisconsin
Kansas
WestVirginia
Montana
Utah
Oregon
Maine
Vermont
Wyoming
Hawaii
Alaska
None
1 in 2,000
1 in 1,000
1 in 667
1 in 500
1 6 11 16 21 26 31 36 41 46 51
Rank
TotalDeaths
Masks
No
Yes
Governor
aa
Democratic
Republican
Total US COVID-19 Deaths
p masks as of July 20, 2020: 0.029, p governor: 0.33. NB: association != causation.
2020-09-21 Summary: 25
Average US COVID-19 deaths over the past
7 days
Arkansas
Mississippi
Louisiana
Virginia
NorthDakota
Florida
SouthCarolina
Georgia
WestVirginia
Nevada
Texas
Kansas
Tennessee
Montana
Arizona
SouthDakota
NorthCarolina
Alabama
California
Ohio
Massachusetts
Hawaii
RhodeIsland
Missouri
Iowa
Wyoming
NewMexico
Idaho
Illinois
Kentucky
Oklahoma
Minnesota
Indiana
Pennsylvania
Delaware
Maryland
Washington
Michigan
DistrictofColumbia
Wisconsin
Oregon
Colorado
NewJersey
Connecticut
NewYork
Maine
Nebraska
NewHampshire
Utah
Alaska
Vermont
None
1 in 500,000
1 in 250,000
1 in 166,667
1 in 125,000
1 in 100,000
1 6 11 16 21 26 31 36 41 46 51
Rank
Deaths/Day
Masks
No
Yes
Governor
aa
Democratic
Republican
Average US COVID-19 deaths over the past 7 days
p masks as of July 20, 2020: 0.77, p governor: 0.19. NB: association != causation.
2020-09-21 Summary: 26
Daily testing trends
HI TX FL
OK LA MS AL GA
AZ NM KS AR TN NC SC DC
CA UT CO NE MO KY WV VA MD DE
OR NV WY SD IA IN OH PA NJ CT RI
WA ID MT ND MN IL MI NY MA
WI VT NH
AK ME
min
max
min
max
min
max
min
max
min
max
min
max
min
max
min
max
Dailytestingfrommintomax
Daily testing trends from min to max
Line = Friedman's supersmoother
2020-09-21 Summary: 27
Change in daily tests over past 14 days
Tennessee
Utah
Minnesota
WestVirginia
NewMexico
Ohio
Florida
NorthCarolina
Colorado
NewYork
Nevada
Hawaii
DistrictofColumbia
Idaho
Illinois
Wyoming
Oklahoma
Michigan
Maryland
Montana
Kentucky
Missouri
SouthCarolina
Maine
Arkansas
Washington
Texas
NorthDakota
Indiana
Arizona
Virginia
Massachusetts
Mississippi
Nebraska
NewJersey
Connecticut
Iowa
SouthDakota
NewHampshire
Pennsylvania
California
Wisconsin
Delaware
Georgia
Alaska
Louisiana
Oregon
Kansas
Alabama
Vermont
RhodeIsland
-4.0
-2.0
0.0
2.0
4.0
1 6 11 16 21 26 31 36 41 46 51
Rank
Changeindailytests(%/day)
Masks
No
Yes
Governor
aa
Democratic
Republican
Change in daily tests over past 14 days
p masks as of July 20, 2020: 0.54, p governor: 0.79. NB: association != causation.
2020-09-21 Summary: 28
Percent Tested
Alaska
NewYork
DistrictofColumbia
Louisiana
NewMexico
Illinois
Connecticut
Tennessee
NewJersey
California
Michigan
Massachusetts
NorthDakota
RhodeIsland
Arkansas
WestVirginia
Montana
Delaware
Maine
Oklahoma
NorthCarolina
Georgia
Maryland
Vermont
Wisconsin
Ohio
Florida
Utah
Mississippi
Kentucky
Minnesota
Iowa
Washington
Virginia
SouthCarolina
Nebraska
Alabama
Nevada
SouthDakota
Hawaii
Missouri
Indiana
Texas
Arizona
NewHampshire
Kansas
Idaho
Wyoming
Oregon
Pennsylvania
Colorado
0
20
40
60
1 6 11 16 21 26 31 36 41 46 51
Rank
PercentTested
Masks
No
Yes
Governor
aa
Democratic
Republican
Percent Tested
p masks as of July 20, 2020: 0.044, p governor: 0.15. NB: association != causation.
2020-09-21 Summary: 29
Percent of Positive COVID Tests
Arizona
Alabama
Florida
Mississippi
Idaho
Texas
SouthCarolina
Nevada
Georgia
Kansas
Iowa
SouthDakota
Nebraska
Missouri
Indiana
Arkansas
Utah
Pennsylvania
NorthDakota
Maryland
Colorado
RhodeIsland
Wisconsin
Louisiana
Virginia
Delaware
Oklahoma
Minnesota
NorthCarolina
Tennessee
Massachusetts
NewJersey
Kentucky
California
Illinois
Wyoming
Ohio
Oregon
Washington
NewYork
DistrictofColumbia
Hawaii
Connecticut
Michigan
Montana
NewHampshire
NewMexico
WestVirginia
Alaska
Maine
Vermont
0.0
5.0
10.0
15.0
1 6 11 16 21 26 31 36 41 46 51
Rank
PercentofPositiveTests
Masks
No
Yes
Governor
aa
Democratic
Republican
Percent of Positive COVID Tests
p masks as of July 20, 2020: 0.011, p governor: 0.0025. NB: association != causation.
2020-09-21 Summary: 30
Positive fraction trends
HI TX FL
OK LA MS AL GA
AZ NM KS AR TN NC SC DC
CA UT CO NE MO KY WV VA MD DE
OR NV WY SD IA IN OH PA NJ CT RI
WA ID MT ND MN IL MI NY MA
WI VT NH
AK ME
min
max
min
max
min
max
min
max
min
max
min
max
min
max
min
max
Fractionpositivefrommintomax
Positive fraction trends from min to max
2020-09-21 Summary: 31
Change in positive tests over past 14 days
NorthDakota
Wisconsin
WestVirginia
Montana
SouthDakota
Utah
Alaska
Texas
Wyoming
Missouri
Iowa
Kansas
Oklahoma
Idaho
Minnesota
Nebraska
Alabama
Oregon
Delaware
Florida
Arkansas
SouthCarolina
Pennsylvania
Nevada
Colorado
NewHampshire
Virginia
Maryland
Georgia
Tennessee
Vermont
NewMexico
RhodeIsland
Indiana
Washington
Michigan
Hawaii
California
Illinois
NorthCarolina
Louisiana
Mississippi
Arizona
Ohio
NewJersey
Massachusetts
DistrictofColumbia
Kentucky
NewYork
Connecticut
Maine
-1.0
0.0
1.0
1 6 11 16 21 26 31 36 41 46 51
Rank
Changeinpositivetests(%/day)
Masks
No
Yes
Governor
aa
Democratic
Republican
Change in positive tests over past 14 days
p masks as of July 20, 2020: 0.0053, p governor: 0.0025. NB: association != causation.
2020-09-21 Summary: 32
Change in tests vs. change in positive tests
over last 14 days
AL
AK
AZ
AR
CA
CO
CT
DE
DC
GA
HI
ID
IL
IN
IAKS
KY
LA
ME
MD
MA
MI
MN
MO
MT
NE
NVNH
NM
NY
NC
ND
OH
OR
RI
SD
TN
TX UT
VT
WV
WI
-1
0
1
-5.0 -2.5 0.0 2.5 5.0
Change in tests (%/day)
Changeinpositivetests(%/day)
Change in tests vs. change in positive tests over last 14 days as of 2020-09-21
Size is proportional daily deaths per capita over the past 7 days
2020-09-21 Summary: 33
Current hospitalizations as a percent of peak
since FebruaryMissouri
NorthDakota
SouthDakota
WestVirginia
Wyoming
Nebraska
Alaska
Oklahoma
Kansas
Kentucky
NorthCarolina
Utah
Arkansas
Hawaii
Iowa
Idaho
Montana
Virginia
Georgia
Wisconsin
Tennessee
Ohio
Indiana
Oregon
Mississippi
SouthCarolina
Alabama
Washington
Minnesota
California
Nevada
NewMexico
Illinois
Louisiana
Texas
RhodeIsland
Maine
Florida
Colorado
DistrictofColumbia
Delaware
Maryland
Michigan
Pennsylvania
Arizona
Massachusetts
Vermont
NewHampshire
NewJersey
Connecticut
NewYork
0
30
60
90
1 6 11 16 21 26 31 36 41 46 51
Rank
Hospitalizations(%ofpeak)
Masks
No
Yes
Governor
aa
Democratic
Republican
Current hospitalizations as a percent of peak since February
p masks as of July 20, 2020: 0.0029, p governor: 0.029. NB: association != causation.
2020-09-21 Summary: 34
Hospitalizations trends
HI TX FL
OK LA MS AL GA
AZ NM KS AR TN NC SC DC
CA UT CO NE MO KY WV VA MD DE
OR NV WY SD IA IN OH PA NJ CT RI
WA ID MT ND MN IL MI NY MA
WI VT NH
AK ME
min
max
min
max
min
max
min
max
min
max
min
max
min
max
min
max
Hospitalizationsfrommintomax
Hospitalizations trends from min to max
2020-09-21 Summary: 35
Change in hospitalizations over past 14
days
SouthDakota
Maine
Connecticut
Wisconsin
NorthDakota
Utah
Wyoming
RhodeIsland
DistrictofColumbia
Massachusetts
Missouri
WestVirginia
NewYork
NewHampshire
Oklahoma
Nebraska
Kansas
NorthCarolina
Alaska
Delaware
Oregon
Illinois
Indiana
NewJersey
NewMexico
Kentucky
Idaho
Arkansas
SouthCarolina
Michigan
Colorado
Virginia
Pennsylvania
Minnesota
Iowa
Maryland
Georgia
Alabama
Vermont
Tennessee
Ohio
Washington
Texas
Mississippi
California
Nevada
Louisiana
Hawaii
Arizona
Florida
Montana
-2.0
0.0
2.0
4.0
1 6 11 16 21 26 31 36 41 46 51
Rank
Changeinhospitalizations(%/day)
Masks
No
Yes
Governor
aa
Democratic
Republican
Change in hospitalizations over past 14 days
p masks as of July 20, 2020: 0.42, p governor: 0.77. NB: association != causation.
2020-09-21 Summary: 36
Case Mortality vs. Testing
AL
AK
AZ
AR
CA
CO
CT
DE
DC
FL
GA
HI
ID
ILIN
IA
KS
KY
LA
ME
MD
MA
MI
MN
MS
MO MT
NE
NV
NH
NJ
NM
NY
NC
ND
OH
OK
OR
PA
RI
SC
SD
TN
TX
UT
VT
VA
WA
WV
WI
WY
2
4
6
8
20 30 40 50 60
% Tested
%Mortality
Mortality vs. Testing as of 2020-09-21
2020-09-21 Summary: 37
Change in New Cases per Day
Direction
Increasing > +2%
Increasing between +0.5% and +2%
No Change (-0.5% to +0.5%)
Decreasing between -0.5% and -2%
Decreasing > -2%
NA
Trends by county as of 2020-09-21
NA = Inadequate data
2020-09-21 Summary: 38
Percent Change by Partisan Lean
-10
-5
0
5
10
0 25 50 75 100
Percent Republican
Percentchangeinnewcasesperday
25
50
75
Republican
Counties by 2016 presidential election results
Dark green line is a Friedman's supersmoother
2020-09-21 Summary: 39
Percent Change by Population
-10
-5
0
5
10
1,000 10,000 100,000 1,000,000 10,000,000
Population
Percentchangeinnewcasesperday
25
50
75
Republican
Counties by Population
Dark green line is a Friedman's 'super smoother'
2020-09-21 Summary: 40
Cases as a Percent of Population
0.001%
0.01%
0.1%
1%
10%
20%
1,000 10,000 100,000 1,000,000 10,000,000
County Population
Totalcases
Total Cases as a Percent of County Population
Slanted lines are counties with small integer numbers of cases, green line: Friedman's 'super smoother'
2020-09-21 Summary: 41
Deaths as a Percent of Population
0.0001%
0.001%
0.01%
0.1%
1%
1,000 10,000 100,000 1,000,000 10,000,000
County Population
Totaldeaths
Total Deaths as a Percent of County Population
Slanted lines are counties with small integer numbers of cases, green line: Friedman's 'super smoother'
2020-09-21 Summary: 42
Case Mortality vs. Population
0.1%
1%
10%
100%
1,000 10,000 100,000 1,000,000 10,000,000
County Population
Casemortality
Case Mortality vs. County Population
2020-09-21 Summary: 43

More Related Content

What's hot

COVID-19 Update (Summary): October 9, 2020
COVID-19 Update (Summary): October 9, 2020COVID-19 Update (Summary): October 9, 2020
COVID-19 Update (Summary): October 9, 2020Steve Shafer
Β 
COVID-19 Update (Summary): September 28, 2020
COVID-19 Update (Summary): September 28, 2020 COVID-19 Update (Summary): September 28, 2020
COVID-19 Update (Summary): September 28, 2020 Steve Shafer
Β 
COVID-19 Update (Summary): October 5, 2020
COVID-19 Update (Summary): October 5, 2020 COVID-19 Update (Summary): October 5, 2020
COVID-19 Update (Summary): October 5, 2020 Steve Shafer
Β 
COVID-19 Update (Summary): September 27, 2020
COVID-19 Update (Summary): September 27, 2020 COVID-19 Update (Summary): September 27, 2020
COVID-19 Update (Summary): September 27, 2020 Steve Shafer
Β 
COVID-19 Update (Summary): October 10, 2020
COVID-19 Update (Summary): October 10, 2020COVID-19 Update (Summary): October 10, 2020
COVID-19 Update (Summary): October 10, 2020Steve Shafer
Β 
COVID-19 Update (Summary): October 2, 2020
COVID-19 Update (Summary): October 2, 2020 COVID-19 Update (Summary): October 2, 2020
COVID-19 Update (Summary): October 2, 2020 Steve Shafer
Β 
COVID-19 Update (Summary): October 3, 2020
COVID-19 Update (Summary): October 3, 2020 COVID-19 Update (Summary): October 3, 2020
COVID-19 Update (Summary): October 3, 2020 Steve Shafer
Β 
COVID-19 Update (Summary): July 31, 2020
COVID-19 Update (Summary): July 31, 2020COVID-19 Update (Summary): July 31, 2020
COVID-19 Update (Summary): July 31, 2020Steve Shafer
Β 
COVID-19 Update (Summary): August 10, 2020
COVID-19 Update (Summary): August 10, 2020COVID-19 Update (Summary): August 10, 2020
COVID-19 Update (Summary): August 10, 2020Steve Shafer
Β 
COVID-19 Update (Summary): August 1, 2020
COVID-19 Update (Summary): August 1, 2020COVID-19 Update (Summary): August 1, 2020
COVID-19 Update (Summary): August 1, 2020Steve Shafer
Β 
COVID-19 Update (Summary): August 3, 2020
COVID-19 Update (Summary): August 3, 2020COVID-19 Update (Summary): August 3, 2020
COVID-19 Update (Summary): August 3, 2020Steve Shafer
Β 
COVID-19 Update (Summary): August 11, 2020
COVID-19 Update (Summary): August 11, 2020COVID-19 Update (Summary): August 11, 2020
COVID-19 Update (Summary): August 11, 2020Steve Shafer
Β 
COVID-19 Update (Summary): August 29, 2020
COVID-19 Update (Summary): August 29, 2020COVID-19 Update (Summary): August 29, 2020
COVID-19 Update (Summary): August 29, 2020Steve Shafer
Β 
COVID-19 Update (Summary): August 25, 2020
COVID-19 Update (Summary): August 25, 2020 COVID-19 Update (Summary): August 25, 2020
COVID-19 Update (Summary): August 25, 2020 Steve Shafer
Β 
COVID-19 Update (Summary): August 31, 2020
COVID-19 Update (Summary): August 31, 2020COVID-19 Update (Summary): August 31, 2020
COVID-19 Update (Summary): August 31, 2020Steve Shafer
Β 
COVID-19 Update (Summary): August 4, 2020
COVID-19 Update (Summary): August 4, 2020COVID-19 Update (Summary): August 4, 2020
COVID-19 Update (Summary): August 4, 2020Steve Shafer
Β 
COVID-19 Update (Summary): August 24, 2020
COVID-19 Update (Summary): August 24, 2020 COVID-19 Update (Summary): August 24, 2020
COVID-19 Update (Summary): August 24, 2020 Steve Shafer
Β 
COVID-19 Update (Summary): August 6, 2020
COVID-19 Update (Summary): August 6, 2020COVID-19 Update (Summary): August 6, 2020
COVID-19 Update (Summary): August 6, 2020Steve Shafer
Β 
COVID-19 Update (Summary): July 29, 2020
COVID-19 Update (Summary): July 29, 2020COVID-19 Update (Summary): July 29, 2020
COVID-19 Update (Summary): July 29, 2020Steve Shafer
Β 
COVID-19 Update (Summary): September 2, 2020
COVID-19 Update (Summary): September 2, 2020COVID-19 Update (Summary): September 2, 2020
COVID-19 Update (Summary): September 2, 2020Steve Shafer
Β 

What's hot (20)

COVID-19 Update (Summary): October 9, 2020
COVID-19 Update (Summary): October 9, 2020COVID-19 Update (Summary): October 9, 2020
COVID-19 Update (Summary): October 9, 2020
Β 
COVID-19 Update (Summary): September 28, 2020
COVID-19 Update (Summary): September 28, 2020 COVID-19 Update (Summary): September 28, 2020
COVID-19 Update (Summary): September 28, 2020
Β 
COVID-19 Update (Summary): October 5, 2020
COVID-19 Update (Summary): October 5, 2020 COVID-19 Update (Summary): October 5, 2020
COVID-19 Update (Summary): October 5, 2020
Β 
COVID-19 Update (Summary): September 27, 2020
COVID-19 Update (Summary): September 27, 2020 COVID-19 Update (Summary): September 27, 2020
COVID-19 Update (Summary): September 27, 2020
Β 
COVID-19 Update (Summary): October 10, 2020
COVID-19 Update (Summary): October 10, 2020COVID-19 Update (Summary): October 10, 2020
COVID-19 Update (Summary): October 10, 2020
Β 
COVID-19 Update (Summary): October 2, 2020
COVID-19 Update (Summary): October 2, 2020 COVID-19 Update (Summary): October 2, 2020
COVID-19 Update (Summary): October 2, 2020
Β 
COVID-19 Update (Summary): October 3, 2020
COVID-19 Update (Summary): October 3, 2020 COVID-19 Update (Summary): October 3, 2020
COVID-19 Update (Summary): October 3, 2020
Β 
COVID-19 Update (Summary): July 31, 2020
COVID-19 Update (Summary): July 31, 2020COVID-19 Update (Summary): July 31, 2020
COVID-19 Update (Summary): July 31, 2020
Β 
COVID-19 Update (Summary): August 10, 2020
COVID-19 Update (Summary): August 10, 2020COVID-19 Update (Summary): August 10, 2020
COVID-19 Update (Summary): August 10, 2020
Β 
COVID-19 Update (Summary): August 1, 2020
COVID-19 Update (Summary): August 1, 2020COVID-19 Update (Summary): August 1, 2020
COVID-19 Update (Summary): August 1, 2020
Β 
COVID-19 Update (Summary): August 3, 2020
COVID-19 Update (Summary): August 3, 2020COVID-19 Update (Summary): August 3, 2020
COVID-19 Update (Summary): August 3, 2020
Β 
COVID-19 Update (Summary): August 11, 2020
COVID-19 Update (Summary): August 11, 2020COVID-19 Update (Summary): August 11, 2020
COVID-19 Update (Summary): August 11, 2020
Β 
COVID-19 Update (Summary): August 29, 2020
COVID-19 Update (Summary): August 29, 2020COVID-19 Update (Summary): August 29, 2020
COVID-19 Update (Summary): August 29, 2020
Β 
COVID-19 Update (Summary): August 25, 2020
COVID-19 Update (Summary): August 25, 2020 COVID-19 Update (Summary): August 25, 2020
COVID-19 Update (Summary): August 25, 2020
Β 
COVID-19 Update (Summary): August 31, 2020
COVID-19 Update (Summary): August 31, 2020COVID-19 Update (Summary): August 31, 2020
COVID-19 Update (Summary): August 31, 2020
Β 
COVID-19 Update (Summary): August 4, 2020
COVID-19 Update (Summary): August 4, 2020COVID-19 Update (Summary): August 4, 2020
COVID-19 Update (Summary): August 4, 2020
Β 
COVID-19 Update (Summary): August 24, 2020
COVID-19 Update (Summary): August 24, 2020 COVID-19 Update (Summary): August 24, 2020
COVID-19 Update (Summary): August 24, 2020
Β 
COVID-19 Update (Summary): August 6, 2020
COVID-19 Update (Summary): August 6, 2020COVID-19 Update (Summary): August 6, 2020
COVID-19 Update (Summary): August 6, 2020
Β 
COVID-19 Update (Summary): July 29, 2020
COVID-19 Update (Summary): July 29, 2020COVID-19 Update (Summary): July 29, 2020
COVID-19 Update (Summary): July 29, 2020
Β 
COVID-19 Update (Summary): September 2, 2020
COVID-19 Update (Summary): September 2, 2020COVID-19 Update (Summary): September 2, 2020
COVID-19 Update (Summary): September 2, 2020
Β 

Similar to COVID-19 Update (Summary): September 21, 2020

COVID-19 Update (Summary): August 15, 2020
COVID-19 Update (Summary): August 15, 2020COVID-19 Update (Summary): August 15, 2020
COVID-19 Update (Summary): August 15, 2020Steve Shafer
Β 
COVID-19 Update (Summary): August 12, 2020
COVID-19 Update (Summary): August 12, 2020COVID-19 Update (Summary): August 12, 2020
COVID-19 Update (Summary): August 12, 2020Steve Shafer
Β 
COVID-19 Update (Summary): August 8, 2020
COVID-19 Update (Summary): August 8, 2020COVID-19 Update (Summary): August 8, 2020
COVID-19 Update (Summary): August 8, 2020Steve Shafer
Β 
COVID-19 Update (Summary): August 13, 2020
COVID-19 Update (Summary): August 13, 2020COVID-19 Update (Summary): August 13, 2020
COVID-19 Update (Summary): August 13, 2020Steve Shafer
Β 
COVID-19 Update (Summary): September 10, 2020
COVID-19 Update (Summary): September 10, 2020COVID-19 Update (Summary): September 10, 2020
COVID-19 Update (Summary): September 10, 2020Steve Shafer
Β 
COVID-19 Update (Summary): August 7, 2020
COVID-19 Update (Summary): August 7, 2020COVID-19 Update (Summary): August 7, 2020
COVID-19 Update (Summary): August 7, 2020Steve Shafer
Β 
COVID-19 Update (Summary): September 11, 2020
COVID-19 Update (Summary): September 11, 2020COVID-19 Update (Summary): September 11, 2020
COVID-19 Update (Summary): September 11, 2020Steve Shafer
Β 
COVID-19 Update (Summary): September 13, 2020
COVID-19 Update (Summary): September 13, 2020COVID-19 Update (Summary): September 13, 2020
COVID-19 Update (Summary): September 13, 2020Steve Shafer
Β 
COVID-19 Update (Summary): September 3, 2020
COVID-19 Update (Summary): September 3, 2020COVID-19 Update (Summary): September 3, 2020
COVID-19 Update (Summary): September 3, 2020Steve Shafer
Β 
COVID-19 Update (Summary): August 14, 2020
COVID-19 Update (Summary): August 14, 2020COVID-19 Update (Summary): August 14, 2020
COVID-19 Update (Summary): August 14, 2020Steve Shafer
Β 
COVID-19 Update (Summary): September 14, 2020
COVID-19 Update (Summary): September 14, 2020COVID-19 Update (Summary): September 14, 2020
COVID-19 Update (Summary): September 14, 2020Steve Shafer
Β 
COVID-19 Update (Summary): September 12, 2020
COVID-19 Update (Summary): September 12, 2020COVID-19 Update (Summary): September 12, 2020
COVID-19 Update (Summary): September 12, 2020Steve Shafer
Β 
COVID-19 Update (Summary): September 9, 2020
COVID-19 Update (Summary): September 9, 2020COVID-19 Update (Summary): September 9, 2020
COVID-19 Update (Summary): September 9, 2020Steve Shafer
Β 
COVID-19 Update (Summary): September 8, 2020
COVID-19 Update (Summary): September 8, 2020COVID-19 Update (Summary): September 8, 2020
COVID-19 Update (Summary): September 8, 2020Steve Shafer
Β 

Similar to COVID-19 Update (Summary): September 21, 2020 (14)

COVID-19 Update (Summary): August 15, 2020
COVID-19 Update (Summary): August 15, 2020COVID-19 Update (Summary): August 15, 2020
COVID-19 Update (Summary): August 15, 2020
Β 
COVID-19 Update (Summary): August 12, 2020
COVID-19 Update (Summary): August 12, 2020COVID-19 Update (Summary): August 12, 2020
COVID-19 Update (Summary): August 12, 2020
Β 
COVID-19 Update (Summary): August 8, 2020
COVID-19 Update (Summary): August 8, 2020COVID-19 Update (Summary): August 8, 2020
COVID-19 Update (Summary): August 8, 2020
Β 
COVID-19 Update (Summary): August 13, 2020
COVID-19 Update (Summary): August 13, 2020COVID-19 Update (Summary): August 13, 2020
COVID-19 Update (Summary): August 13, 2020
Β 
COVID-19 Update (Summary): September 10, 2020
COVID-19 Update (Summary): September 10, 2020COVID-19 Update (Summary): September 10, 2020
COVID-19 Update (Summary): September 10, 2020
Β 
COVID-19 Update (Summary): August 7, 2020
COVID-19 Update (Summary): August 7, 2020COVID-19 Update (Summary): August 7, 2020
COVID-19 Update (Summary): August 7, 2020
Β 
COVID-19 Update (Summary): September 11, 2020
COVID-19 Update (Summary): September 11, 2020COVID-19 Update (Summary): September 11, 2020
COVID-19 Update (Summary): September 11, 2020
Β 
COVID-19 Update (Summary): September 13, 2020
COVID-19 Update (Summary): September 13, 2020COVID-19 Update (Summary): September 13, 2020
COVID-19 Update (Summary): September 13, 2020
Β 
COVID-19 Update (Summary): September 3, 2020
COVID-19 Update (Summary): September 3, 2020COVID-19 Update (Summary): September 3, 2020
COVID-19 Update (Summary): September 3, 2020
Β 
COVID-19 Update (Summary): August 14, 2020
COVID-19 Update (Summary): August 14, 2020COVID-19 Update (Summary): August 14, 2020
COVID-19 Update (Summary): August 14, 2020
Β 
COVID-19 Update (Summary): September 14, 2020
COVID-19 Update (Summary): September 14, 2020COVID-19 Update (Summary): September 14, 2020
COVID-19 Update (Summary): September 14, 2020
Β 
COVID-19 Update (Summary): September 12, 2020
COVID-19 Update (Summary): September 12, 2020COVID-19 Update (Summary): September 12, 2020
COVID-19 Update (Summary): September 12, 2020
Β 
COVID-19 Update (Summary): September 9, 2020
COVID-19 Update (Summary): September 9, 2020COVID-19 Update (Summary): September 9, 2020
COVID-19 Update (Summary): September 9, 2020
Β 
COVID-19 Update (Summary): September 8, 2020
COVID-19 Update (Summary): September 8, 2020COVID-19 Update (Summary): September 8, 2020
COVID-19 Update (Summary): September 8, 2020
Β 

More from Steve Shafer

COVID-19 Update (US States): October 11, 2020
COVID-19 Update (US States): October 11, 2020COVID-19 Update (US States): October 11, 2020
COVID-19 Update (US States): October 11, 2020Steve Shafer
Β 
COVID-19 Update (US Counties): October 11, 2020
COVID-19 Update (US Counties): October 11, 2020COVID-19 Update (US Counties): October 11, 2020
COVID-19 Update (US Counties): October 11, 2020Steve Shafer
Β 
COVID-19 Update (Summary): October 11, 2020
COVID-19 Update (Summary): October 11, 2020COVID-19 Update (Summary): October 11, 2020
COVID-19 Update (Summary): October 11, 2020Steve Shafer
Β 
COVID-19 Update (International): October 11, 2020
COVID-19 Update (International): October 11, 2020COVID-19 Update (International): October 11, 2020
COVID-19 Update (International): October 11, 2020Steve Shafer
Β 
COVID-19 Update (US States): October 10, 2020
COVID-19 Update (US States): October 10, 2020COVID-19 Update (US States): October 10, 2020
COVID-19 Update (US States): October 10, 2020Steve Shafer
Β 
COVID-19 Update (US Counties): October 10, 2020
COVID-19 Update (US Counties): October 10, 2020COVID-19 Update (US Counties): October 10, 2020
COVID-19 Update (US Counties): October 10, 2020Steve Shafer
Β 
COVID-19 Update (International): October 10, 2020
COVID-19 Update (International): October 10, 2020COVID-19 Update (International): October 10, 2020
COVID-19 Update (International): October 10, 2020Steve Shafer
Β 
COVID-19 Update (US States): October 9, 2020
COVID-19 Update (US States): October 9, 2020COVID-19 Update (US States): October 9, 2020
COVID-19 Update (US States): October 9, 2020Steve Shafer
Β 
COVID-19 Update (US Counties): October 9, 2020
COVID-19 Update (US Counties): October 9, 2020COVID-19 Update (US Counties): October 9, 2020
COVID-19 Update (US Counties): October 9, 2020Steve Shafer
Β 
COVID-19 Update (International): October 9, 2020
COVID-19 Update (International): October 9, 2020COVID-19 Update (International): October 9, 2020
COVID-19 Update (International): October 9, 2020Steve Shafer
Β 
COVID-19 Update (US States): October 8, 2020
COVID-19 Update (US States): October 8, 2020 COVID-19 Update (US States): October 8, 2020
COVID-19 Update (US States): October 8, 2020 Steve Shafer
Β 
COVID-19 Update (US Counties): October 8, 2020
COVID-19 Update (US Counties): October 8, 2020 COVID-19 Update (US Counties): October 8, 2020
COVID-19 Update (US Counties): October 8, 2020 Steve Shafer
Β 
COVID-19 Update (International): October 8, 2020
COVID-19 Update (International): October 8, 2020 COVID-19 Update (International): October 8, 2020
COVID-19 Update (International): October 8, 2020 Steve Shafer
Β 
COVID-19 Update (US States): October 7, 2020
COVID-19 Update (US States): October 7, 2020 COVID-19 Update (US States): October 7, 2020
COVID-19 Update (US States): October 7, 2020 Steve Shafer
Β 
COVID-19 Update (US Counties): October 7, 2020
COVID-19 Update (US Counties): October 7, 2020 COVID-19 Update (US Counties): October 7, 2020
COVID-19 Update (US Counties): October 7, 2020 Steve Shafer
Β 
COVID-19 Update (Summary): October 7, 2020
COVID-19 Update (Summary): October 7, 2020 COVID-19 Update (Summary): October 7, 2020
COVID-19 Update (Summary): October 7, 2020 Steve Shafer
Β 
COVID-19 Update (International): October 7, 2020
COVID-19 Update (International): October 7, 2020 COVID-19 Update (International): October 7, 2020
COVID-19 Update (International): October 7, 2020 Steve Shafer
Β 
COVID-19 Update (US States): October 6, 2020
COVID-19 Update (US States): October 6, 2020 COVID-19 Update (US States): October 6, 2020
COVID-19 Update (US States): October 6, 2020 Steve Shafer
Β 
COVID-19 Update (US Counties): October 6, 2020
COVID-19 Update (US Counties): October 6, 2020 COVID-19 Update (US Counties): October 6, 2020
COVID-19 Update (US Counties): October 6, 2020 Steve Shafer
Β 
COVID-19 Update (International): October 6, 2020
COVID-19 Update (International): October 6, 2020 COVID-19 Update (International): October 6, 2020
COVID-19 Update (International): October 6, 2020 Steve Shafer
Β 

More from Steve Shafer (20)

COVID-19 Update (US States): October 11, 2020
COVID-19 Update (US States): October 11, 2020COVID-19 Update (US States): October 11, 2020
COVID-19 Update (US States): October 11, 2020
Β 
COVID-19 Update (US Counties): October 11, 2020
COVID-19 Update (US Counties): October 11, 2020COVID-19 Update (US Counties): October 11, 2020
COVID-19 Update (US Counties): October 11, 2020
Β 
COVID-19 Update (Summary): October 11, 2020
COVID-19 Update (Summary): October 11, 2020COVID-19 Update (Summary): October 11, 2020
COVID-19 Update (Summary): October 11, 2020
Β 
COVID-19 Update (International): October 11, 2020
COVID-19 Update (International): October 11, 2020COVID-19 Update (International): October 11, 2020
COVID-19 Update (International): October 11, 2020
Β 
COVID-19 Update (US States): October 10, 2020
COVID-19 Update (US States): October 10, 2020COVID-19 Update (US States): October 10, 2020
COVID-19 Update (US States): October 10, 2020
Β 
COVID-19 Update (US Counties): October 10, 2020
COVID-19 Update (US Counties): October 10, 2020COVID-19 Update (US Counties): October 10, 2020
COVID-19 Update (US Counties): October 10, 2020
Β 
COVID-19 Update (International): October 10, 2020
COVID-19 Update (International): October 10, 2020COVID-19 Update (International): October 10, 2020
COVID-19 Update (International): October 10, 2020
Β 
COVID-19 Update (US States): October 9, 2020
COVID-19 Update (US States): October 9, 2020COVID-19 Update (US States): October 9, 2020
COVID-19 Update (US States): October 9, 2020
Β 
COVID-19 Update (US Counties): October 9, 2020
COVID-19 Update (US Counties): October 9, 2020COVID-19 Update (US Counties): October 9, 2020
COVID-19 Update (US Counties): October 9, 2020
Β 
COVID-19 Update (International): October 9, 2020
COVID-19 Update (International): October 9, 2020COVID-19 Update (International): October 9, 2020
COVID-19 Update (International): October 9, 2020
Β 
COVID-19 Update (US States): October 8, 2020
COVID-19 Update (US States): October 8, 2020 COVID-19 Update (US States): October 8, 2020
COVID-19 Update (US States): October 8, 2020
Β 
COVID-19 Update (US Counties): October 8, 2020
COVID-19 Update (US Counties): October 8, 2020 COVID-19 Update (US Counties): October 8, 2020
COVID-19 Update (US Counties): October 8, 2020
Β 
COVID-19 Update (International): October 8, 2020
COVID-19 Update (International): October 8, 2020 COVID-19 Update (International): October 8, 2020
COVID-19 Update (International): October 8, 2020
Β 
COVID-19 Update (US States): October 7, 2020
COVID-19 Update (US States): October 7, 2020 COVID-19 Update (US States): October 7, 2020
COVID-19 Update (US States): October 7, 2020
Β 
COVID-19 Update (US Counties): October 7, 2020
COVID-19 Update (US Counties): October 7, 2020 COVID-19 Update (US Counties): October 7, 2020
COVID-19 Update (US Counties): October 7, 2020
Β 
COVID-19 Update (Summary): October 7, 2020
COVID-19 Update (Summary): October 7, 2020 COVID-19 Update (Summary): October 7, 2020
COVID-19 Update (Summary): October 7, 2020
Β 
COVID-19 Update (International): October 7, 2020
COVID-19 Update (International): October 7, 2020 COVID-19 Update (International): October 7, 2020
COVID-19 Update (International): October 7, 2020
Β 
COVID-19 Update (US States): October 6, 2020
COVID-19 Update (US States): October 6, 2020 COVID-19 Update (US States): October 6, 2020
COVID-19 Update (US States): October 6, 2020
Β 
COVID-19 Update (US Counties): October 6, 2020
COVID-19 Update (US Counties): October 6, 2020 COVID-19 Update (US Counties): October 6, 2020
COVID-19 Update (US Counties): October 6, 2020
Β 
COVID-19 Update (International): October 6, 2020
COVID-19 Update (International): October 6, 2020 COVID-19 Update (International): October 6, 2020
COVID-19 Update (International): October 6, 2020
Β 

Recently uploaded

All Time Service Available Call Girls Marine Drive πŸ“³ 9820252231 For 18+ VIP C...
All Time Service Available Call Girls Marine Drive πŸ“³ 9820252231 For 18+ VIP C...All Time Service Available Call Girls Marine Drive πŸ“³ 9820252231 For 18+ VIP C...
All Time Service Available Call Girls Marine Drive πŸ“³ 9820252231 For 18+ VIP C...Arohi Goyal
Β 
Call Girls Bhubaneswar Just Call 9907093804 Top Class Call Girl Service Avail...
Call Girls Bhubaneswar Just Call 9907093804 Top Class Call Girl Service Avail...Call Girls Bhubaneswar Just Call 9907093804 Top Class Call Girl Service Avail...
Call Girls Bhubaneswar Just Call 9907093804 Top Class Call Girl Service Avail...Dipal Arora
Β 
Kesar Bagh Call Girl Price 9548273370 , Lucknow Call Girls Service
Kesar Bagh Call Girl Price 9548273370 , Lucknow Call Girls ServiceKesar Bagh Call Girl Price 9548273370 , Lucknow Call Girls Service
Kesar Bagh Call Girl Price 9548273370 , Lucknow Call Girls Servicemakika9823
Β 
Call Girls Kochi Just Call 9907093804 Top Class Call Girl Service Available
Call Girls Kochi Just Call 9907093804 Top Class Call Girl Service AvailableCall Girls Kochi Just Call 9907093804 Top Class Call Girl Service Available
Call Girls Kochi Just Call 9907093804 Top Class Call Girl Service AvailableDipal Arora
Β 
The Most Attractive Hyderabad Call Girls Kothapet π– ‹ 6297143586 π– ‹ Will You Mis...
The Most Attractive Hyderabad Call Girls Kothapet π– ‹ 6297143586 π– ‹ Will You Mis...The Most Attractive Hyderabad Call Girls Kothapet π– ‹ 6297143586 π– ‹ Will You Mis...
The Most Attractive Hyderabad Call Girls Kothapet π– ‹ 6297143586 π– ‹ Will You Mis...chandars293
Β 
πŸ’ŽVVIP Kolkata Call Girls Parganas🩱7001035870🩱Independent Girl ( Ac Rooms Avai...
πŸ’ŽVVIP Kolkata Call Girls Parganas🩱7001035870🩱Independent Girl ( Ac Rooms Avai...πŸ’ŽVVIP Kolkata Call Girls Parganas🩱7001035870🩱Independent Girl ( Ac Rooms Avai...
πŸ’ŽVVIP Kolkata Call Girls Parganas🩱7001035870🩱Independent Girl ( Ac Rooms Avai...Taniya Sharma
Β 
Call Girls Varanasi Just Call 9907093804 Top Class Call Girl Service Available
Call Girls Varanasi Just Call 9907093804 Top Class Call Girl Service AvailableCall Girls Varanasi Just Call 9907093804 Top Class Call Girl Service Available
Call Girls Varanasi Just Call 9907093804 Top Class Call Girl Service AvailableDipal Arora
Β 
VIP Mumbai Call Girls Hiranandani Gardens Just Call 9920874524 with A/C Room ...
VIP Mumbai Call Girls Hiranandani Gardens Just Call 9920874524 with A/C Room ...VIP Mumbai Call Girls Hiranandani Gardens Just Call 9920874524 with A/C Room ...
VIP Mumbai Call Girls Hiranandani Gardens Just Call 9920874524 with A/C Room ...Garima Khatri
Β 
Premium Call Girls Cottonpet Whatsapp 7001035870 Independent Escort Service
Premium Call Girls Cottonpet Whatsapp 7001035870 Independent Escort ServicePremium Call Girls Cottonpet Whatsapp 7001035870 Independent Escort Service
Premium Call Girls Cottonpet Whatsapp 7001035870 Independent Escort Servicevidya singh
Β 
VIP Russian Call Girls in Varanasi Samaira 8250192130 Independent Escort Serv...
VIP Russian Call Girls in Varanasi Samaira 8250192130 Independent Escort Serv...VIP Russian Call Girls in Varanasi Samaira 8250192130 Independent Escort Serv...
VIP Russian Call Girls in Varanasi Samaira 8250192130 Independent Escort Serv...Neha Kaur
Β 
High Profile Call Girls Coimbatore Saanvi☎️ 8250192130 Independent Escort Se...
High Profile Call Girls Coimbatore Saanvi☎️  8250192130 Independent Escort Se...High Profile Call Girls Coimbatore Saanvi☎️  8250192130 Independent Escort Se...
High Profile Call Girls Coimbatore Saanvi☎️ 8250192130 Independent Escort Se...narwatsonia7
Β 
β™›VVIP Hyderabad Call Girls ChintalkuntaπŸ–•7001035870πŸ–•Riya Kappor Top Call Girl ...
β™›VVIP Hyderabad Call Girls ChintalkuntaπŸ–•7001035870πŸ–•Riya Kappor Top Call Girl ...β™›VVIP Hyderabad Call Girls ChintalkuntaπŸ–•7001035870πŸ–•Riya Kappor Top Call Girl ...
β™›VVIP Hyderabad Call Girls ChintalkuntaπŸ–•7001035870πŸ–•Riya Kappor Top Call Girl ...astropune
Β 
Low Rate Call Girls Kochi Anika 8250192130 Independent Escort Service Kochi
Low Rate Call Girls Kochi Anika 8250192130 Independent Escort Service KochiLow Rate Call Girls Kochi Anika 8250192130 Independent Escort Service Kochi
Low Rate Call Girls Kochi Anika 8250192130 Independent Escort Service KochiSuhani Kapoor
Β 
Call Girls Horamavu WhatsApp Number 7001035870 Meeting With Bangalore Escorts
Call Girls Horamavu WhatsApp Number 7001035870 Meeting With Bangalore EscortsCall Girls Horamavu WhatsApp Number 7001035870 Meeting With Bangalore Escorts
Call Girls Horamavu WhatsApp Number 7001035870 Meeting With Bangalore Escortsvidya singh
Β 
Bangalore Call Girls Hebbal Kempapura Number 7001035870 Meetin With Bangalor...
Bangalore Call Girls Hebbal Kempapura Number 7001035870  Meetin With Bangalor...Bangalore Call Girls Hebbal Kempapura Number 7001035870  Meetin With Bangalor...
Bangalore Call Girls Hebbal Kempapura Number 7001035870 Meetin With Bangalor...narwatsonia7
Β 
Call Girls Nagpur Just Call 9907093804 Top Class Call Girl Service Available
Call Girls Nagpur Just Call 9907093804 Top Class Call Girl Service AvailableCall Girls Nagpur Just Call 9907093804 Top Class Call Girl Service Available
Call Girls Nagpur Just Call 9907093804 Top Class Call Girl Service AvailableDipal Arora
Β 
Top Rated Bangalore Call Girls Richmond Circle ⟟ 8250192130 ⟟ Call Me For Gen...
Top Rated Bangalore Call Girls Richmond Circle ⟟ 8250192130 ⟟ Call Me For Gen...Top Rated Bangalore Call Girls Richmond Circle ⟟ 8250192130 ⟟ Call Me For Gen...
Top Rated Bangalore Call Girls Richmond Circle ⟟ 8250192130 ⟟ Call Me For Gen...narwatsonia7
Β 
Call Girls Coimbatore Just Call 9907093804 Top Class Call Girl Service Available
Call Girls Coimbatore Just Call 9907093804 Top Class Call Girl Service AvailableCall Girls Coimbatore Just Call 9907093804 Top Class Call Girl Service Available
Call Girls Coimbatore Just Call 9907093804 Top Class Call Girl Service AvailableDipal Arora
Β 
VIP Call Girls Tirunelveli Aaradhya 8250192130 Independent Escort Service Tir...
VIP Call Girls Tirunelveli Aaradhya 8250192130 Independent Escort Service Tir...VIP Call Girls Tirunelveli Aaradhya 8250192130 Independent Escort Service Tir...
VIP Call Girls Tirunelveli Aaradhya 8250192130 Independent Escort Service Tir...narwatsonia7
Β 
VIP Call Girls Indore Kirti πŸ’šπŸ˜‹ 9256729539 πŸš€ Indore Escorts
VIP Call Girls Indore Kirti πŸ’šπŸ˜‹  9256729539 πŸš€ Indore EscortsVIP Call Girls Indore Kirti πŸ’šπŸ˜‹  9256729539 πŸš€ Indore Escorts
VIP Call Girls Indore Kirti πŸ’šπŸ˜‹ 9256729539 πŸš€ Indore Escortsaditipandeya
Β 

Recently uploaded (20)

All Time Service Available Call Girls Marine Drive πŸ“³ 9820252231 For 18+ VIP C...
All Time Service Available Call Girls Marine Drive πŸ“³ 9820252231 For 18+ VIP C...All Time Service Available Call Girls Marine Drive πŸ“³ 9820252231 For 18+ VIP C...
All Time Service Available Call Girls Marine Drive πŸ“³ 9820252231 For 18+ VIP C...
Β 
Call Girls Bhubaneswar Just Call 9907093804 Top Class Call Girl Service Avail...
Call Girls Bhubaneswar Just Call 9907093804 Top Class Call Girl Service Avail...Call Girls Bhubaneswar Just Call 9907093804 Top Class Call Girl Service Avail...
Call Girls Bhubaneswar Just Call 9907093804 Top Class Call Girl Service Avail...
Β 
Kesar Bagh Call Girl Price 9548273370 , Lucknow Call Girls Service
Kesar Bagh Call Girl Price 9548273370 , Lucknow Call Girls ServiceKesar Bagh Call Girl Price 9548273370 , Lucknow Call Girls Service
Kesar Bagh Call Girl Price 9548273370 , Lucknow Call Girls Service
Β 
Call Girls Kochi Just Call 9907093804 Top Class Call Girl Service Available
Call Girls Kochi Just Call 9907093804 Top Class Call Girl Service AvailableCall Girls Kochi Just Call 9907093804 Top Class Call Girl Service Available
Call Girls Kochi Just Call 9907093804 Top Class Call Girl Service Available
Β 
The Most Attractive Hyderabad Call Girls Kothapet π– ‹ 6297143586 π– ‹ Will You Mis...
The Most Attractive Hyderabad Call Girls Kothapet π– ‹ 6297143586 π– ‹ Will You Mis...The Most Attractive Hyderabad Call Girls Kothapet π– ‹ 6297143586 π– ‹ Will You Mis...
The Most Attractive Hyderabad Call Girls Kothapet π– ‹ 6297143586 π– ‹ Will You Mis...
Β 
πŸ’ŽVVIP Kolkata Call Girls Parganas🩱7001035870🩱Independent Girl ( Ac Rooms Avai...
πŸ’ŽVVIP Kolkata Call Girls Parganas🩱7001035870🩱Independent Girl ( Ac Rooms Avai...πŸ’ŽVVIP Kolkata Call Girls Parganas🩱7001035870🩱Independent Girl ( Ac Rooms Avai...
πŸ’ŽVVIP Kolkata Call Girls Parganas🩱7001035870🩱Independent Girl ( Ac Rooms Avai...
Β 
Call Girls Varanasi Just Call 9907093804 Top Class Call Girl Service Available
Call Girls Varanasi Just Call 9907093804 Top Class Call Girl Service AvailableCall Girls Varanasi Just Call 9907093804 Top Class Call Girl Service Available
Call Girls Varanasi Just Call 9907093804 Top Class Call Girl Service Available
Β 
VIP Mumbai Call Girls Hiranandani Gardens Just Call 9920874524 with A/C Room ...
VIP Mumbai Call Girls Hiranandani Gardens Just Call 9920874524 with A/C Room ...VIP Mumbai Call Girls Hiranandani Gardens Just Call 9920874524 with A/C Room ...
VIP Mumbai Call Girls Hiranandani Gardens Just Call 9920874524 with A/C Room ...
Β 
Premium Call Girls Cottonpet Whatsapp 7001035870 Independent Escort Service
Premium Call Girls Cottonpet Whatsapp 7001035870 Independent Escort ServicePremium Call Girls Cottonpet Whatsapp 7001035870 Independent Escort Service
Premium Call Girls Cottonpet Whatsapp 7001035870 Independent Escort Service
Β 
VIP Russian Call Girls in Varanasi Samaira 8250192130 Independent Escort Serv...
VIP Russian Call Girls in Varanasi Samaira 8250192130 Independent Escort Serv...VIP Russian Call Girls in Varanasi Samaira 8250192130 Independent Escort Serv...
VIP Russian Call Girls in Varanasi Samaira 8250192130 Independent Escort Serv...
Β 
High Profile Call Girls Coimbatore Saanvi☎️ 8250192130 Independent Escort Se...
High Profile Call Girls Coimbatore Saanvi☎️  8250192130 Independent Escort Se...High Profile Call Girls Coimbatore Saanvi☎️  8250192130 Independent Escort Se...
High Profile Call Girls Coimbatore Saanvi☎️ 8250192130 Independent Escort Se...
Β 
β™›VVIP Hyderabad Call Girls ChintalkuntaπŸ–•7001035870πŸ–•Riya Kappor Top Call Girl ...
β™›VVIP Hyderabad Call Girls ChintalkuntaπŸ–•7001035870πŸ–•Riya Kappor Top Call Girl ...β™›VVIP Hyderabad Call Girls ChintalkuntaπŸ–•7001035870πŸ–•Riya Kappor Top Call Girl ...
β™›VVIP Hyderabad Call Girls ChintalkuntaπŸ–•7001035870πŸ–•Riya Kappor Top Call Girl ...
Β 
Low Rate Call Girls Kochi Anika 8250192130 Independent Escort Service Kochi
Low Rate Call Girls Kochi Anika 8250192130 Independent Escort Service KochiLow Rate Call Girls Kochi Anika 8250192130 Independent Escort Service Kochi
Low Rate Call Girls Kochi Anika 8250192130 Independent Escort Service Kochi
Β 
Call Girls Horamavu WhatsApp Number 7001035870 Meeting With Bangalore Escorts
Call Girls Horamavu WhatsApp Number 7001035870 Meeting With Bangalore EscortsCall Girls Horamavu WhatsApp Number 7001035870 Meeting With Bangalore Escorts
Call Girls Horamavu WhatsApp Number 7001035870 Meeting With Bangalore Escorts
Β 
Bangalore Call Girls Hebbal Kempapura Number 7001035870 Meetin With Bangalor...
Bangalore Call Girls Hebbal Kempapura Number 7001035870  Meetin With Bangalor...Bangalore Call Girls Hebbal Kempapura Number 7001035870  Meetin With Bangalor...
Bangalore Call Girls Hebbal Kempapura Number 7001035870 Meetin With Bangalor...
Β 
Call Girls Nagpur Just Call 9907093804 Top Class Call Girl Service Available
Call Girls Nagpur Just Call 9907093804 Top Class Call Girl Service AvailableCall Girls Nagpur Just Call 9907093804 Top Class Call Girl Service Available
Call Girls Nagpur Just Call 9907093804 Top Class Call Girl Service Available
Β 
Top Rated Bangalore Call Girls Richmond Circle ⟟ 8250192130 ⟟ Call Me For Gen...
Top Rated Bangalore Call Girls Richmond Circle ⟟ 8250192130 ⟟ Call Me For Gen...Top Rated Bangalore Call Girls Richmond Circle ⟟ 8250192130 ⟟ Call Me For Gen...
Top Rated Bangalore Call Girls Richmond Circle ⟟ 8250192130 ⟟ Call Me For Gen...
Β 
Call Girls Coimbatore Just Call 9907093804 Top Class Call Girl Service Available
Call Girls Coimbatore Just Call 9907093804 Top Class Call Girl Service AvailableCall Girls Coimbatore Just Call 9907093804 Top Class Call Girl Service Available
Call Girls Coimbatore Just Call 9907093804 Top Class Call Girl Service Available
Β 
VIP Call Girls Tirunelveli Aaradhya 8250192130 Independent Escort Service Tir...
VIP Call Girls Tirunelveli Aaradhya 8250192130 Independent Escort Service Tir...VIP Call Girls Tirunelveli Aaradhya 8250192130 Independent Escort Service Tir...
VIP Call Girls Tirunelveli Aaradhya 8250192130 Independent Escort Service Tir...
Β 
VIP Call Girls Indore Kirti πŸ’šπŸ˜‹ 9256729539 πŸš€ Indore Escorts
VIP Call Girls Indore Kirti πŸ’šπŸ˜‹  9256729539 πŸš€ Indore EscortsVIP Call Girls Indore Kirti πŸ’šπŸ˜‹  9256729539 πŸš€ Indore Escorts
VIP Call Girls Indore Kirti πŸ’šπŸ˜‹ 9256729539 πŸš€ Indore Escorts
Β 

COVID-19 Update (Summary): September 21, 2020

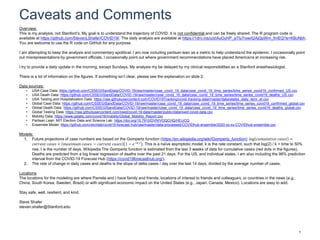
  • 1. Caveats and Comments 1 Overview: This is my analysis, not Stanford’s. My goal is to understand the trajectory of COVID. It is not confidential and can be freely shared. The R program code is available at https://github.com/StevenLShafer/COVID19/. The daily analysis are available at https://1drv.ms/u/s!AuOyHP_aTIy7rowrt2AjGpWm_frnEQ?e=KBcNbh. You are welcome to use the R code on GitHub for any purpose. I am attempting to keep the analysis and commentary apolitical. I am now including partisan lean as a metric to help understand the epidemic. I occasionally point out misrepresentations by government officials. I occasionally point out where government recommendations have placed Americans at increasing risk. I try to provide a daily update in the morning, except Sundays. My analysis my be delayed by my clinical responsibilities as a Stanford anesthesiologist. There is a lot of information on the figures. If something isn’t clear, please see the explanation on slide 2. Data sources: β€’ USA Case Data: https://github.com/CSSEGISandData/COVID-19/raw/master/csse_covid_19_data/csse_covid_19_time_series/time_series_covid19_confirmed_US.csv β€’ USA Death Data: https://github.com/CSSEGISandData/COVID-19/raw/master/csse_covid_19_data/csse_covid_19_time_series/time_series_covid19_deaths_US.csv β€’ USA Testing and Hospitalization Data: https://raw.githubusercontent.com/COVID19Tracking/covid-tracking-data/master/data/states_daily_4pm_et.csv β€’ Global Case Data: https://github.com/CSSEGISandData/COVID-19/raw/master/csse_covid_19_data/csse_covid_19_time_series/time_series_covid19_confirmed_global.csv β€’ Global Death Data: https://github.com/CSSEGISandData/COVID-19/raw/master/csse_covid_19_data/csse_covid_19_time_series/time_series_covid19_deaths_global.csv β€’ Global Testing Data: https://raw.githubusercontent.com/owid/covid-19-data/master/public/data/owid-covid-data.csv β€’ Mobility Data: https://www.gstatic.com/covid19/mobility/Global_Mobility_Report.csv β€’ Partisan Lean: MIT Election Data and Science Lab: https://doi.org/10.7910/DVN/VOQCHQ/HEIJCQ β€’ Ensemble Model: https://github.com/reichlab/covid19-forecast-hub/raw/master/data-processed/COVIDhub-ensemble/2020-xx-xx-COVIDhub-ensemble.csv Models: 1. Future projections of case numbers are based on the Gompertz function (https://en.wikipedia.org/wiki/Gompertz_function): log π‘π‘’π‘šπ‘’π‘™π‘Žπ‘‘π‘–π‘£π‘’ π‘π‘Žπ‘ π‘’π‘  = π‘π‘’π‘Ÿπ‘Ÿπ‘’π‘›π‘‘ π‘π‘Žπ‘ π‘’π‘  + π‘šπ‘Žπ‘₯π‘–π‘šπ‘’π‘š π‘π‘Žπ‘ π‘’π‘  βˆ’ π‘π‘’π‘Ÿπ‘Ÿπ‘’π‘›π‘‘ π‘π‘Žπ‘ π‘’π‘  1 βˆ’ π‘’βˆ’π‘˜ 𝑑 . This is a naΓ―ve asymptotic model. k is the rate constant, such that log(2) / k = time to 50% rise. t is the number of days. Wikipedia The Gompertz function is estimated from the last 3 weeks of data for cumulative cases (red dots in the figures). Deaths are predicted from a log linear regression of deaths over the past 21 days. For the US, and individual states, I am also including the 98% prediction interval from the COVID-19 Forecast Hub (https://covid19forecasthub.org/). 2. The rate of change in daily cases and deaths is the slope of delta cases / day over the last 14 days, divided by the average number of cases. Locations The locations for the modeling are where Pamela and I have family and friends, locations of interest to friends and colleagues, or countries in the news (e.g., China, South Korea, Sweden, Brazil) or with significant economic impact on the United States (e.g., Japan, Canada, Mexico). Locations are easy to add. Stay safe, well, resilient, and kind. Steve Shafer steven.shafer@Stanford.edu
  • 2. 2,586,092 152,804 1 10 100 1,000 10,000 100,000 1,000,000 10,000,000 100,000,000 Actual(points)/Predicted(line) Phase Pre-Model Modeled Deaths Tests USA projection as of 2020-05-27 0 10,000 20,000 30,000 0 2,000 4,000 6,000 Cases/Day Deaths/Day Cases: 1,662,302 (32,123) -- Deaths: 98,220 (829) -- Case Mortality: 5.9% -- Daily Change in Cases: -0.5% Explanation of the Figures 2 Brown dots: cumulative tests Red dots: cumulative cases used to estimate Gompertz function, presently set to last 3 weeks Red line: predicted cumulative cases based on the Gompertz function estimated from the red dots Red number: total cases on June 30th, based on the Gompertz function estimated from the red dots Black number: total Deaths on July 31th, based on log-linear regression of the past 21 days Black line: predicted cumulative deaths, based on a log linear regression of deaths over past 21 days. Axis for deaths / day, usually 1/10th of the axis for cases / day on the left side of the figure. Green line: linear regression over 8 days, used to calculate percent increase / decrease (see below) Daily change in cases, calculated as the slope of the green line (above left) / number of new cases yesterday. Case mortality: cumulative deaths / cumulative cases. Cases / day calculated from cumulative cases used to estimate the Gompertz function Cases / day calculated from cumulative cases not used to estimate the Gompertz function Deaths / day, axis is on the left Blue line: today Blue dots: cumulative cases not used to estimate Gompertz function Cumulative cases (yesterday’s cases) and cumulative deaths (yesterday’s deaths) Axis for cases / day. Axis for deaths / day appears to the right. Geographic location Date of analysis, also shown as blue vertical line below Purple wedge: 98% ensemble prediction interval from COVID-19 Forecast Hub (USA and US States only)
  • 3. Worldwide 41,985,285 1,245,451 1 10 100 1,000 10,000 100,000 1,000,000 10,000,000 100,000,000 Cumulative Phase Pre-Model Modeled Deaths Worldwide projection as of 2020-09-21 10 1,000 100,000 CasesandDeaths/Day Cases: 31,027,306 (241,287) -- Deaths: 960,679 (3,696) -- Case Mortality: 3.1% -- Daily Change: +0.6% Cases, -1.0% Deaths 2020-09-21 Summary: 3
  • 4. USA 8,146,675 237,527 1 10 100 1,000 10,000 100,000 1,000,000 10,000,000 100,000,000 Cumulative Phase Pre-Model Modeled Deaths Tests USA projection as of 2020-09-21 Mother'sDay MemorialDay July4th July15,2020 LaborDay 10 1,000 100,000 CasesandDeaths/Day Cases: 6,810,879 (36,765) -- Deaths: 199,509 (227) -- Case Mortality: 2.9% -- Daily Change: +2.2% Cases, +0.4% Deaths 2020-09-21 Summary: 4
  • 5. Non-authoritarian Asian ensemble 131,751 2,747 1 10 100 1,000 10,000 100,000 1,000,000 10,000,000 100,000,000 Cumulative Phase Pre-Model Modeled Deaths Tests Japan, South Korea, Thailand, and Vietnam (Population = 328 MM) Non-authoritarian Asian ensemble projection as of 2020-09-21 1.0 10.0 100.0 1,000.0 CasesandDeaths/Day Cases: 106,761 (550) -- Deaths: 1,987 (6) -- Case Mortality: 1.9% -- Daily Change: -0.8% Cases, -1.7% Deaths 2020-09-21 Summary: 5
  • 6. Western Europe 3,349,281 163,296 1 10 100 1,000 10,000 100,000 1,000,000 10,000,000 100,000,000 Cumulative Phase Pre-Model Modeled Deaths Tests Belgium, France, Germany, Greece, Italy, Portugal, Spain, Netherlands, Luxembourg, and the UK (Population = 344MM) Western Europe projection as of 2020-09-21 10 1,000 100,000 CasesandDeaths/Day Cases: 2,256,481 (9,191) -- Deaths: 157,348 (59) -- Case Mortality: 7.0% -- Daily Change: -1.2% Cases, +5.0% Deaths 2020-09-21 Summary: 6
  • 7. Comparison of COVID-19 Cases & Deaths between US & Europe Cases Deaths 44,494 12,906 664 144 3 10 30 100 300 1,000 3,000 10,000 30,000 100,000 Date DailyCasesandDeaths Location USA (318MM) Western Europe (344MM) Log plot of 7 day average Comparison of COVID-19 Cases & Deaths between US & Europe The numbers on the right are yesterday's figures, and will differ a bit from the plotted rolling mean 2020-09-21 Summary: 7
  • 10. Average new cases over past 7 days Israel Argentina Spain Peru CzechRepublic Colombia Brazil Iraq USA France Belgium Libya Paraguay Chile Netherlands Ecuador Austria India Hungary Denmark Honduras DominicanRepublic Ukraine Morocco Portugal UnitedKingdom Bolivia Romania Tunisia Nepal Switzerland Iran Russia Mexico Philippines Guatemala Jordan SouthAfrica Venezuela Canada Slovakia Italy Greece Sweden Uzbekistan Belarus Turkey SaudiArabia Germany Poland Bulgaria Indonesia Azerbaijan ElSalvador Kyrgyzstan Serbia Bangladesh Finland Mozambique Myanmar Ethiopia Zambia Algeria Angola Uganda USA None 1 in 10,000 1 in 5,000 1 in 3,333 1 in 2,500 1 in 2,000 1 in 1,667 1 in 1,429 1 6 11 16 21 26 31 36 41 46 51 56 61 66 Rank Averagecases/day Average new cases over past 7 days Excludes countries with population < 5,000,000 2020-09-21 Summary: 10
  • 13. Average daily deaths over past 7 days Argentina Bolivia Colombia Peru Brazil Mexico Chile Israel Paraguay Iraq Iran Spain USA Ecuador Honduras Libya Romania Guatemala SouthAfrica DominicanRepublic Ukraine SaudiArabia India Morocco Philippines Turkey Russia Bulgaria France Hungary Tunisia CzechRepublic Portugal ElSalvador Indonesia Belarus Greece Switzerland Poland Nepal Venezuela UnitedKingdom Kazakhstan Belgium Sweden Algeria Azerbaijan Netherlands Australia Italy Uzbekistan Egypt Myanmar Angola Bangladesh Zambia Austria Denmark Canada Serbia Jordan Ethiopia Syria Kenya Afghanistan USA None 1 in 1,000,000 1 in 500,000 1 in 333,333 1 in 250,000 1 in 200,000 1 in 166,667 1 in 142,857 1 6 11 16 21 26 31 36 41 46 51 56 61 66 Rank Averagedeaths/day Average daily deaths over past 7 days Excludes countries with population < 5,000,000 2020-09-21 Summary: 13
  • 14. Case Mortality vs. Testing AREBHR LUX DNK MLTISR USA ISL RUS AUS LTU GBR QATMDV BEL PRT IRL NZL BLR CAN SAU DEU ESP NOR KWT AUT FIN CHL SRBLVA SGP KAZ CHE EST NLD ROU GRC CZE TUR ITA SVN PAN POL SVK BGR ZAF HUN HRVMAR URY COL SLV IRQ CUBUKR IND MYS IRN KOR DOM RWA CRI PRYARG NPL PHLLBY BRA BOL PER ECU JPN TUN GHA PAK LKA MEX FJI BGD SEN ETH TGO UGA KENJOR ZWE ZMB THA IDN CIVMOZ TWN MMR VNM MWI NGA USA 0.0 2.5 5.0 7.5 10.0 12.5 0 25 50 75 % Tested %CaseMortality Case Mortality vs. Testing as of 2020-09-21 ARE: United Arab Emirates, BHR:Bahrain, MLT: Malta, ISR: Israel, LTU: Lithuania, ISL: Iceland 2020-09-21 Summary: 14
  • 15. Mortality Trends 0 2 4 6 8 10 12 14 USCaseRateMortality Mortality Type: 13 day rolling median Cumulative Daily Raw Daily vs. Cumulative US Case Rate Mortality Last week excluded because deaths are often backdated 2020-09-21 Summary: 15
  • 16. Change in New Cases per Day New cases are: Increasing > +3% Increasing between +1% and +3% No Change (-1% to +1%) Decreasing between -1% and -3% Decreasing > -3% New cases by state as of 2020-09-21 2020-09-21 Summary: 16
  • 17. Cases as a Percent of Peak Cases HI TX FL OK LA MS AL GA AZ NM KS AR TN NC SC DC CA UT CO NE MO KY WV VA MD DE OR NV WY SD IA IN OH PA NJ CT RI WA ID MT ND MN IL MI NY MA WI VT NH AK ME 0 25 50 75 100 0 25 50 75 100 0 25 50 75 100 0 25 50 75 100 0 25 50 75 100 0 25 50 75 100 0 25 50 75 100 0 25 50 75 100 PercentofPeak Daily Cases as a Percent of Peak Cases 2020-09-21 Summary: 17
  • 18. Change in New Deaths per Day New deaths are: Increasing > +0.5% Increasing between +0.1% and +0.5% No Change (-0.1% to +0.1%) Decreasing between -0.1% and -0.5% Decreasing > -0.5% New deaths by state as of 2020-09-21 2020-09-21 Summary: 18
  • 19. Deaths as a Percent of Peak Deaths HI TX FL OK LA MS AL GA AZ NM KS AR TN NC SC DC CA UT CO NE MO KY WV VA MD DE OR NV WY SD IA IN OH PA NJ CT RI WA ID MT ND MN IL MI NY MA WI VT NH AK ME 0 25 50 75 100 0 25 50 75 100 0 25 50 75 100 0 25 50 75 100 0 25 50 75 100 0 25 50 75 100 0 25 50 75 100 0 25 50 75 100 PercentofPeak Daily Deaths as a Percent of Peak Deaths 2020-09-21 Summary: 19
  • 20. Change in cases vs. change in deaths over last 14 days AL AK AZ AR CA CO CT DE DC FL GA HI ID IL IN IA KS KY ME MA MI MN MT NE NV NH NM NY NC ND OH OK OR PA RI SC TX UT VT VA WV WI WY -6 -3 0 3 6 -6 -3 0 3 6 Change in cases (%/day) Changeindeaths(%/day) Change in cases vs. change in deaths over last 14 days as of 2020-09-21 Size is proportional total cases per capita 2020-09-21 Summary: 20
  • 21. Total US COVID-19 Cases California Texas Florida NewYork Georgia Illinois Arizona NewJersey NorthCarolina Tennessee Louisiana Pennsylvania Alabama Ohio Virginia SouthCarolina Massachusetts Michigan Maryland Missouri Indiana Wisconsin Mississippi Minnesota Washington Iowa Oklahoma Nevada Arkansas Colorado Utah Kentucky Connecticut Kansas Nebraska Idaho Oregon NewMexico RhodeIsland Delaware SouthDakota NorthDakota DistrictofColumbia WestVirginia Hawaii Montana NewHampshire Alaska Maine Wyoming Vermont 0 250,000 500,000 750,000 1 6 11 16 21 26 31 36 41 46 51 Rank Totalcases Masks No Yes Governor aa Democratic Republican Total US COVID-19 Cases p masks as of July 20, 2020: 0.49, p governor: 0.82. NB: association != causation. 2020-09-21 Summary: 21
  • 22. Total US COVID-19 Cases Louisiana Florida Mississippi Alabama Arizona Georgia Tennessee SouthCarolina Iowa Arkansas Nevada Texas NorthDakota NewYork NewJersey RhodeIsland Illinois Nebraska DistrictofColumbia SouthDakota Idaho Delaware California Utah Maryland Oklahoma Massachusetts Missouri NorthCarolina Wisconsin Kansas Indiana Virginia Minnesota Connecticut Kentucky NewMexico Michigan Ohio Pennsylvania Colorado Washington Montana Alaska Wyoming Hawaii WestVirginia Oregon NewHampshire Maine Vermont None 1 in 100 1 in 50 1 in 33 1 in 25 1 6 11 16 21 26 31 36 41 46 51 Rank TotalCases Masks No Yes Governor aa Democratic Republican Total US COVID-19 Cases p masks as of July 20, 2020: 0.25, p governor: 0.032. NB: association != causation. 2020-09-21 Summary: 22
  • 23. Average US COVID-19 cases over the past 7 days NorthDakota Wisconsin SouthDakota Oklahoma Utah Arkansas Iowa Missouri Tennessee Nebraska SouthCarolina Alabama Kansas Idaho Montana Mississippi Georgia Texas Kentucky Minnesota Illinois Louisiana Florida Indiana Wyoming NorthCarolina Virginia Delaware WestVirginia Alaska Nevada Arizona Maryland California Colorado RhodeIsland Ohio DistrictofColumbia Hawaii Michigan Pennsylvania NewMexico Washington Oregon NewJersey Connecticut NewYork NewHampshire Maine Vermont Massachusetts None 1 in 10,000 1 in 5,000 1 in 3,333 1 in 2,500 1 in 2,000 1 6 11 16 21 26 31 36 41 46 51 Rank NewCases/Day Masks No Yes Governor aa Democratic Republican Average US COVID-19 cases over the past 7 days p masks as of July 20, 2020: 0.00034, p governor: 0.0016. NB: association != causation. 2020-09-21 Summary: 23
  • 24. Total US COVID-19 Deaths NewYork NewJersey Texas California Florida Massachusetts Illinois Pennsylvania Michigan Georgia Arizona Louisiana Ohio Connecticut Maryland Indiana NorthCarolina SouthCarolina Virginia Mississippi Alabama Tennessee Washington Minnesota Colorado Missouri Nevada Iowa Wisconsin Arkansas Kentucky RhodeIsland Oklahoma NewMexico Delaware DistrictofColumbia Kansas Oregon Idaho Nebraska Utah NewHampshire WestVirginia SouthDakota NorthDakota Montana Maine Hawaii Vermont Wyoming Alaska 0 10,000 20,000 30,000 1 6 11 16 21 26 31 36 41 46 51 Rank TotalDeaths Masks No Yes Governor aa Democratic Republican Total US COVID-19 Deaths p masks as of July 20, 2020: 0.066, p governor: 0.28. NB: association != causation. 2020-09-21 Summary: 24
  • 25. Total US COVID-19 Deaths NewJersey NewYork Massachusetts Connecticut Louisiana RhodeIsland Mississippi DistrictofColumbia Arizona Michigan Illinois Maryland Delaware Georgia Pennsylvania SouthCarolina Florida Indiana Texas Nevada Alabama NewMexico Iowa Ohio Arkansas California Minnesota Virginia Colorado Tennessee NewHampshire NorthCarolina Missouri Washington NorthDakota Kentucky Idaho Oklahoma Nebraska SouthDakota Wisconsin Kansas WestVirginia Montana Utah Oregon Maine Vermont Wyoming Hawaii Alaska None 1 in 2,000 1 in 1,000 1 in 667 1 in 500 1 6 11 16 21 26 31 36 41 46 51 Rank TotalDeaths Masks No Yes Governor aa Democratic Republican Total US COVID-19 Deaths p masks as of July 20, 2020: 0.029, p governor: 0.33. NB: association != causation. 2020-09-21 Summary: 25
  • 26. Average US COVID-19 deaths over the past 7 days Arkansas Mississippi Louisiana Virginia NorthDakota Florida SouthCarolina Georgia WestVirginia Nevada Texas Kansas Tennessee Montana Arizona SouthDakota NorthCarolina Alabama California Ohio Massachusetts Hawaii RhodeIsland Missouri Iowa Wyoming NewMexico Idaho Illinois Kentucky Oklahoma Minnesota Indiana Pennsylvania Delaware Maryland Washington Michigan DistrictofColumbia Wisconsin Oregon Colorado NewJersey Connecticut NewYork Maine Nebraska NewHampshire Utah Alaska Vermont None 1 in 500,000 1 in 250,000 1 in 166,667 1 in 125,000 1 in 100,000 1 6 11 16 21 26 31 36 41 46 51 Rank Deaths/Day Masks No Yes Governor aa Democratic Republican Average US COVID-19 deaths over the past 7 days p masks as of July 20, 2020: 0.77, p governor: 0.19. NB: association != causation. 2020-09-21 Summary: 26
  • 27. Daily testing trends HI TX FL OK LA MS AL GA AZ NM KS AR TN NC SC DC CA UT CO NE MO KY WV VA MD DE OR NV WY SD IA IN OH PA NJ CT RI WA ID MT ND MN IL MI NY MA WI VT NH AK ME min max min max min max min max min max min max min max min max Dailytestingfrommintomax Daily testing trends from min to max Line = Friedman's supersmoother 2020-09-21 Summary: 27
  • 28. Change in daily tests over past 14 days Tennessee Utah Minnesota WestVirginia NewMexico Ohio Florida NorthCarolina Colorado NewYork Nevada Hawaii DistrictofColumbia Idaho Illinois Wyoming Oklahoma Michigan Maryland Montana Kentucky Missouri SouthCarolina Maine Arkansas Washington Texas NorthDakota Indiana Arizona Virginia Massachusetts Mississippi Nebraska NewJersey Connecticut Iowa SouthDakota NewHampshire Pennsylvania California Wisconsin Delaware Georgia Alaska Louisiana Oregon Kansas Alabama Vermont RhodeIsland -4.0 -2.0 0.0 2.0 4.0 1 6 11 16 21 26 31 36 41 46 51 Rank Changeindailytests(%/day) Masks No Yes Governor aa Democratic Republican Change in daily tests over past 14 days p masks as of July 20, 2020: 0.54, p governor: 0.79. NB: association != causation. 2020-09-21 Summary: 28
  • 30. Percent of Positive COVID Tests Arizona Alabama Florida Mississippi Idaho Texas SouthCarolina Nevada Georgia Kansas Iowa SouthDakota Nebraska Missouri Indiana Arkansas Utah Pennsylvania NorthDakota Maryland Colorado RhodeIsland Wisconsin Louisiana Virginia Delaware Oklahoma Minnesota NorthCarolina Tennessee Massachusetts NewJersey Kentucky California Illinois Wyoming Ohio Oregon Washington NewYork DistrictofColumbia Hawaii Connecticut Michigan Montana NewHampshire NewMexico WestVirginia Alaska Maine Vermont 0.0 5.0 10.0 15.0 1 6 11 16 21 26 31 36 41 46 51 Rank PercentofPositiveTests Masks No Yes Governor aa Democratic Republican Percent of Positive COVID Tests p masks as of July 20, 2020: 0.011, p governor: 0.0025. NB: association != causation. 2020-09-21 Summary: 30
  • 31. Positive fraction trends HI TX FL OK LA MS AL GA AZ NM KS AR TN NC SC DC CA UT CO NE MO KY WV VA MD DE OR NV WY SD IA IN OH PA NJ CT RI WA ID MT ND MN IL MI NY MA WI VT NH AK ME min max min max min max min max min max min max min max min max Fractionpositivefrommintomax Positive fraction trends from min to max 2020-09-21 Summary: 31
  • 32. Change in positive tests over past 14 days NorthDakota Wisconsin WestVirginia Montana SouthDakota Utah Alaska Texas Wyoming Missouri Iowa Kansas Oklahoma Idaho Minnesota Nebraska Alabama Oregon Delaware Florida Arkansas SouthCarolina Pennsylvania Nevada Colorado NewHampshire Virginia Maryland Georgia Tennessee Vermont NewMexico RhodeIsland Indiana Washington Michigan Hawaii California Illinois NorthCarolina Louisiana Mississippi Arizona Ohio NewJersey Massachusetts DistrictofColumbia Kentucky NewYork Connecticut Maine -1.0 0.0 1.0 1 6 11 16 21 26 31 36 41 46 51 Rank Changeinpositivetests(%/day) Masks No Yes Governor aa Democratic Republican Change in positive tests over past 14 days p masks as of July 20, 2020: 0.0053, p governor: 0.0025. NB: association != causation. 2020-09-21 Summary: 32
  • 33. Change in tests vs. change in positive tests over last 14 days AL AK AZ AR CA CO CT DE DC GA HI ID IL IN IAKS KY LA ME MD MA MI MN MO MT NE NVNH NM NY NC ND OH OR RI SD TN TX UT VT WV WI -1 0 1 -5.0 -2.5 0.0 2.5 5.0 Change in tests (%/day) Changeinpositivetests(%/day) Change in tests vs. change in positive tests over last 14 days as of 2020-09-21 Size is proportional daily deaths per capita over the past 7 days 2020-09-21 Summary: 33
  • 34. Current hospitalizations as a percent of peak since FebruaryMissouri NorthDakota SouthDakota WestVirginia Wyoming Nebraska Alaska Oklahoma Kansas Kentucky NorthCarolina Utah Arkansas Hawaii Iowa Idaho Montana Virginia Georgia Wisconsin Tennessee Ohio Indiana Oregon Mississippi SouthCarolina Alabama Washington Minnesota California Nevada NewMexico Illinois Louisiana Texas RhodeIsland Maine Florida Colorado DistrictofColumbia Delaware Maryland Michigan Pennsylvania Arizona Massachusetts Vermont NewHampshire NewJersey Connecticut NewYork 0 30 60 90 1 6 11 16 21 26 31 36 41 46 51 Rank Hospitalizations(%ofpeak) Masks No Yes Governor aa Democratic Republican Current hospitalizations as a percent of peak since February p masks as of July 20, 2020: 0.0029, p governor: 0.029. NB: association != causation. 2020-09-21 Summary: 34
  • 35. Hospitalizations trends HI TX FL OK LA MS AL GA AZ NM KS AR TN NC SC DC CA UT CO NE MO KY WV VA MD DE OR NV WY SD IA IN OH PA NJ CT RI WA ID MT ND MN IL MI NY MA WI VT NH AK ME min max min max min max min max min max min max min max min max Hospitalizationsfrommintomax Hospitalizations trends from min to max 2020-09-21 Summary: 35
  • 36. Change in hospitalizations over past 14 days SouthDakota Maine Connecticut Wisconsin NorthDakota Utah Wyoming RhodeIsland DistrictofColumbia Massachusetts Missouri WestVirginia NewYork NewHampshire Oklahoma Nebraska Kansas NorthCarolina Alaska Delaware Oregon Illinois Indiana NewJersey NewMexico Kentucky Idaho Arkansas SouthCarolina Michigan Colorado Virginia Pennsylvania Minnesota Iowa Maryland Georgia Alabama Vermont Tennessee Ohio Washington Texas Mississippi California Nevada Louisiana Hawaii Arizona Florida Montana -2.0 0.0 2.0 4.0 1 6 11 16 21 26 31 36 41 46 51 Rank Changeinhospitalizations(%/day) Masks No Yes Governor aa Democratic Republican Change in hospitalizations over past 14 days p masks as of July 20, 2020: 0.42, p governor: 0.77. NB: association != causation. 2020-09-21 Summary: 36
  • 37. Case Mortality vs. Testing AL AK AZ AR CA CO CT DE DC FL GA HI ID ILIN IA KS KY LA ME MD MA MI MN MS MO MT NE NV NH NJ NM NY NC ND OH OK OR PA RI SC SD TN TX UT VT VA WA WV WI WY 2 4 6 8 20 30 40 50 60 % Tested %Mortality Mortality vs. Testing as of 2020-09-21 2020-09-21 Summary: 37
  • 38. Change in New Cases per Day Direction Increasing > +2% Increasing between +0.5% and +2% No Change (-0.5% to +0.5%) Decreasing between -0.5% and -2% Decreasing > -2% NA Trends by county as of 2020-09-21 NA = Inadequate data 2020-09-21 Summary: 38
  • 39. Percent Change by Partisan Lean -10 -5 0 5 10 0 25 50 75 100 Percent Republican Percentchangeinnewcasesperday 25 50 75 Republican Counties by 2016 presidential election results Dark green line is a Friedman's supersmoother 2020-09-21 Summary: 39
  • 40. Percent Change by Population -10 -5 0 5 10 1,000 10,000 100,000 1,000,000 10,000,000 Population Percentchangeinnewcasesperday 25 50 75 Republican Counties by Population Dark green line is a Friedman's 'super smoother' 2020-09-21 Summary: 40
  • 41. Cases as a Percent of Population 0.001% 0.01% 0.1% 1% 10% 20% 1,000 10,000 100,000 1,000,000 10,000,000 County Population Totalcases Total Cases as a Percent of County Population Slanted lines are counties with small integer numbers of cases, green line: Friedman's 'super smoother' 2020-09-21 Summary: 41
  • 42. Deaths as a Percent of Population 0.0001% 0.001% 0.01% 0.1% 1% 1,000 10,000 100,000 1,000,000 10,000,000 County Population Totaldeaths Total Deaths as a Percent of County Population Slanted lines are counties with small integer numbers of cases, green line: Friedman's 'super smoother' 2020-09-21 Summary: 42
  • 43. Case Mortality vs. Population 0.1% 1% 10% 100% 1,000 10,000 100,000 1,000,000 10,000,000 County Population Casemortality Case Mortality vs. County Population 2020-09-21 Summary: 43