Download to read offline

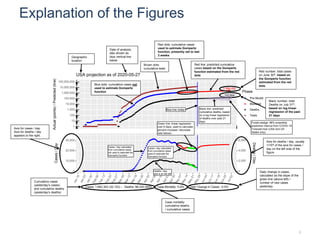
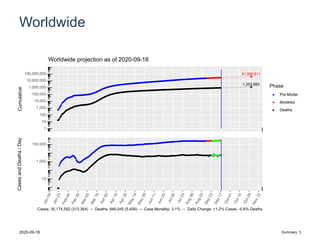
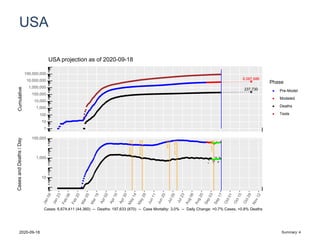
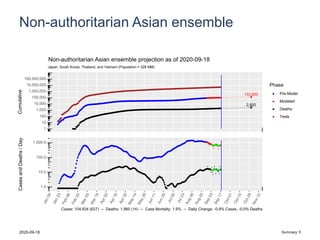
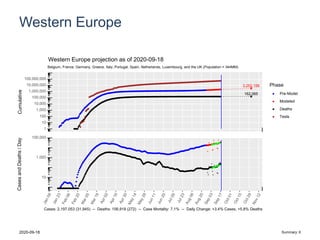
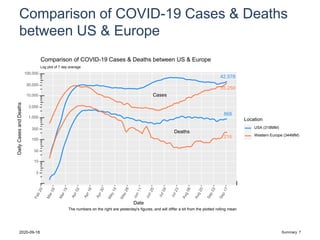
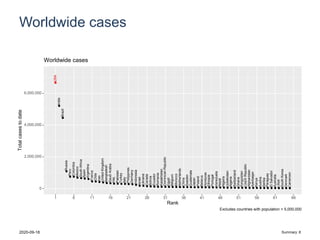
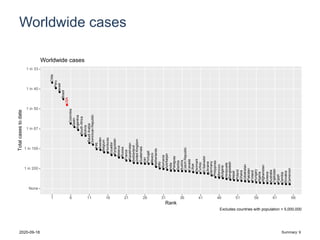
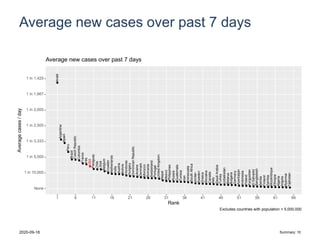
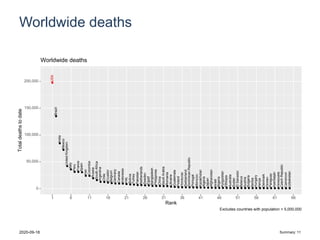
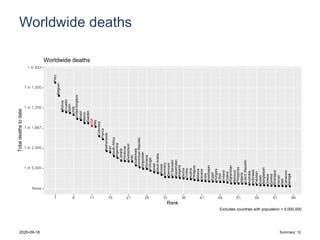
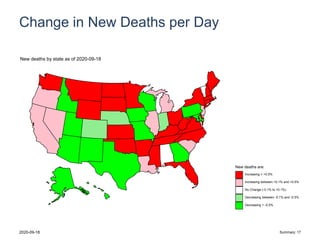
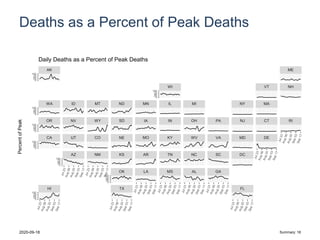
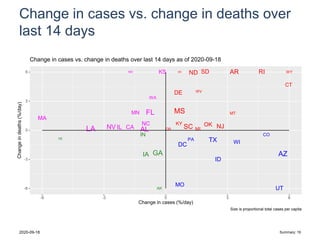
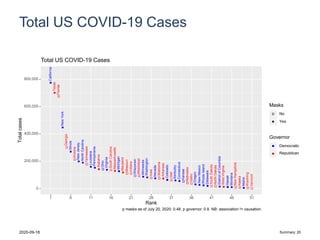
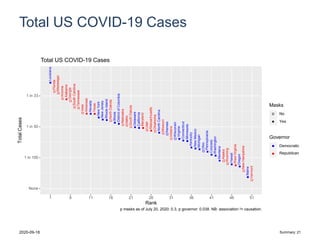
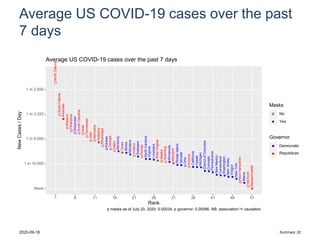
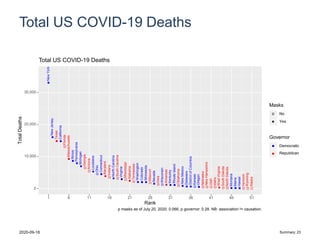
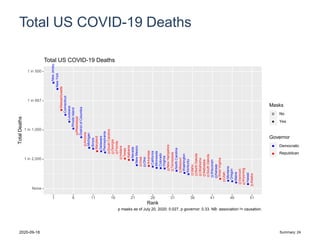
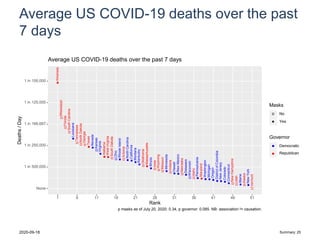
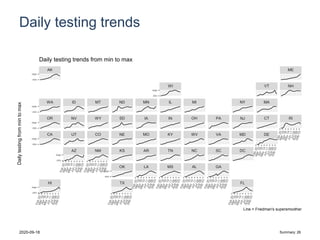
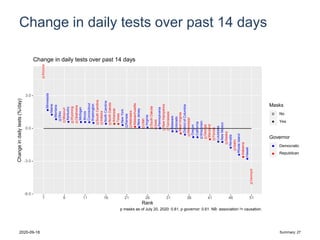
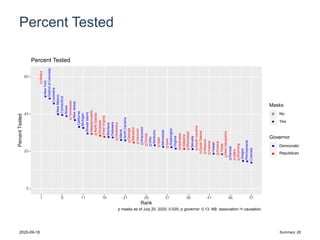

This document provides an overview and analysis of COVID-19 cases and projections worldwide and in several locations. It summarizes data sources and models used in the analysis. Updates are typically provided daily, with some delays possible due to the author's clinical responsibilities. Charts and graphs presented on different slides provide current case and death numbers, projected trajectories, and comparisons between locations.


![CTEV [ clubfoot] DR ARUN LAL ,DR MOHAMED ASHRAF travancore medical college k...](https://cdn.slidesharecdn.com/ss_thumbnails/ctevclubfootdrarunlaldrmohamedashraftravancoremedicalcollegekollamkeralaindia-260208063247-18fc466c-thumbnail.jpg?width=640&height=640&fit=bounds)


