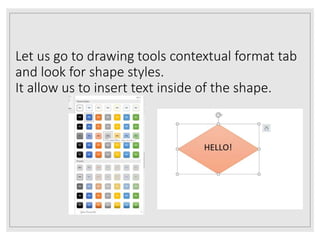
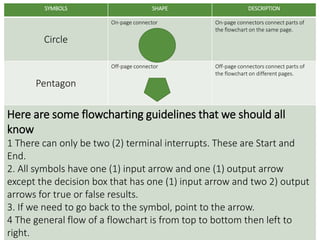
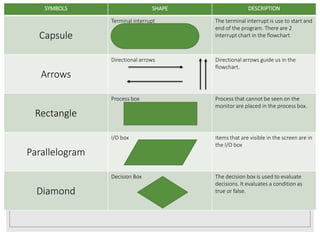
This document provides instructions for creating simple flowcharts using shapes and symbols in Microsoft Word. It outlines the basic flowcharting symbols available in Word, including circles, arrows, rectangles, parallelograms, diamonds, and pentagons. The document explains how to access the Drawing Tools Contextual Format tab to insert shapes and text. It also provides guidelines for constructing flowcharts, such as only having two terminal interrupts, each symbol having one input and output arrow except for decision boxes, and maintaining a top-to-bottom, left-to-right general flow.
Consistent formatting is important in models. It helps communicate what particular cells are for, and helps to communicate useful information about the structure of the model.
In order to facilitate easy, consistent formatting, we have a set of FAST format macros.
Consistent formatting is important in models. It helps communicate what particular cells are for, and helps to communicate useful information about the structure of the model.
In order to facilitate easy, consistent formatting, we have a set of FAST format macros.
When building models in excel sometimes files become large, slowing down your modelling progress and making simple calculations painstakingly slow.
Size is often a function of the number of calculations and complexity of formulae. There are also causes of excess file size that are not related to model complexity. This modelling guide explains how to reduce file size in excel, by dealing with two such causes – end cells and unused styles.
You know that if you ask people to fill out a spreadsheet they will fill it out in a variety of ways. It’s
almost as they had a meeting to discuss all the possibilities and then proceeded to show you exactly
how many different ways the same information can be entered!
SEE MORE, INCLUDING A FREE TRIAL, AT: www.PivotTable-Pro.com
This presentation demonstrates how AutoCorrect works as you enter text and formulas, and shows how you can add or remove AutoCorrect rules.
Contents:
***Using AutoCorrect***
How AutoCorrect Works
Undoing AutoCorrect Changes
How AutoCorrect Changes Capitalizations
***AutoCorrect Settings***
Turning AutoCorrect Rules On or Off
Entering Custom AutoCorrect Rules
Setting Exceptions to Capitalization Rules
Everybody knows that in financial modelling, inputs, calculations and outputs should be separate.
When you’re in the “build phase” of a model, there can be short term benefits of locating inputs next to the calculations they are driving.
The guide explains those benefits, and shows you how to quickly and easily move the inputs to dedicated input sheets at the end of the build.
You can enter data into Calc in several ways: using the keyboard, the mouse [dragging and dropping], the Fill tool, and selection lists. Calc also provides the ability to enter information into multiple sheets of the same document at the same time.
After entering data, you can format and display it in various ways.
Formatting data
Creating a chart
Formatting 3D charts
Formatting the chart elements
Gallery of chart types
In this lesson, you create a mold tooling for a telephone handset.
You start with a model of a telephone handset. Before creating the mold tooling, you add mounting bosses to the model. This demonstrates the fastening features commonly used on molded products.
Empowerment technology is any tool or system that enables individuals and communities to take control of their lives, make informed decisions, and ultimately enhance their well-being. It can be used to improve access to education, healthcare, employment, and other resources.
Read| The latest issue of The Challenger is here! We are thrilled to announce that our school paper has qualified for the NATIONAL SCHOOLS PRESS CONFERENCE (NSPC) 2024. Thank you for your unwavering support and trust. Dive into the stories that made us stand out!
Welcome to TechSoup New Member Orientation and Q&A (May 2024).pdfTechSoup
In this webinar you will learn how your organization can access TechSoup's wide variety of product discount and donation programs. From hardware to software, we'll give you a tour of the tools available to help your nonprofit with productivity, collaboration, financial management, donor tracking, security, and more.
Embracing GenAI - A Strategic ImperativePeter Windle
Artificial Intelligence (AI) technologies such as Generative AI, Image Generators and Large Language Models have had a dramatic impact on teaching, learning and assessment over the past 18 months. The most immediate threat AI posed was to Academic Integrity with Higher Education Institutes (HEIs) focusing their efforts on combating the use of GenAI in assessment. Guidelines were developed for staff and students, policies put in place too. Innovative educators have forged paths in the use of Generative AI for teaching, learning and assessments leading to pockets of transformation springing up across HEIs, often with little or no top-down guidance, support or direction.
This Gasta posits a strategic approach to integrating AI into HEIs to prepare staff, students and the curriculum for an evolving world and workplace. We will highlight the advantages of working with these technologies beyond the realm of teaching, learning and assessment by considering prompt engineering skills, industry impact, curriculum changes, and the need for staff upskilling. In contrast, not engaging strategically with Generative AI poses risks, including falling behind peers, missed opportunities and failing to ensure our graduates remain employable. The rapid evolution of AI technologies necessitates a proactive and strategic approach if we are to remain relevant.
Operation “Blue Star” is the only event in the history of Independent India where the state went into war with its own people. Even after about 40 years it is not clear if it was culmination of states anger over people of the region, a political game of power or start of dictatorial chapter in the democratic setup.
The people of Punjab felt alienated from main stream due to denial of their just demands during a long democratic struggle since independence. As it happen all over the word, it led to militant struggle with great loss of lives of military, police and civilian personnel. Killing of Indira Gandhi and massacre of innocent Sikhs in Delhi and other India cities was also associated with this movement.
Palestine last event orientationfvgnh .pptxRaedMohamed3
An EFL lesson about the current events in Palestine. It is intended to be for intermediate students who wish to increase their listening skills through a short lesson in power point.
Synthetic Fiber Construction in lab .pptxPavel ( NSTU)
Synthetic fiber production is a fascinating and complex field that blends chemistry, engineering, and environmental science. By understanding these aspects, students can gain a comprehensive view of synthetic fiber production, its impact on society and the environment, and the potential for future innovations. Synthetic fibers play a crucial role in modern society, impacting various aspects of daily life, industry, and the environment. ynthetic fibers are integral to modern life, offering a range of benefits from cost-effectiveness and versatility to innovative applications and performance characteristics. While they pose environmental challenges, ongoing research and development aim to create more sustainable and eco-friendly alternatives. Understanding the importance of synthetic fibers helps in appreciating their role in the economy, industry, and daily life, while also emphasizing the need for sustainable practices and innovation.
2. Let see!
At the end of the lesson, we should be
able to:
1. Use the Drawing Tools Contextual
Format tab.
2. Determine the basic flowcharting
symbols in MS Word.
3. Create simple flowcharts using
flowcharting symbols in MS Word.
3. On a new blank document, select the insert tab.
Look on the shape group use the screen shot as
a guide.
4. The different shapes that we can insert are lines,
rectangles, basic shapes, block arrows, equation
shapes, flowchart, stars and banners and
callouts.
5. The Format Tab is activated when we insert a
shape of MS word. Select the shape that we
inserted . Select format to activate the format
tab. It will looks like this.
The format tab includes group tools such as
insert shapes, shape styles, wordstyle, text,
arrange and size.
6. Let us go to drawing tools contextual format tab
and look for shape styles.
It allow us to insert text inside of the shape.
7. SYMBOLS SHAPE DESCRIPTION
Circle
On-page connector On-page connectors connect parts of
the flowchart on the same page.
Pentagon
Off-page connector Off-page connectors connect parts of
the flowchart on different pages.
Here are some flowcharting guidelines that we should all
know
1 There can only be two (2) terminal interrupts. These are Start and
End.
2. All symbols have one (1) input arrow and one (1) output arrow
except the decision box that has one (1) input arrow and two 2) output
arrows for true or false results.
3. If we need to go back to the symbol, point to the arrow.
4 The general flow of a flowchart is from top to bottom then left to
right.
8. SYMBOLS SHAPE DESCRIPTION
Capsule
Terminal interrupt The terminal interrupt is use to start and
end of the program. There are 2
interrupt chart in the flowchart
Arrows
Directional arrows Directional arrows guide us in the
flowchart.
Rectangle
Process box Process that cannot be seen on the
monitor are placed in the process box.
Parallelogram
I/O box Items that are visible in the screen are in
the I/O box
Diamond
Decision Box The decision box is used to evaluate
decisions. It evaluates a condition as
true or false.