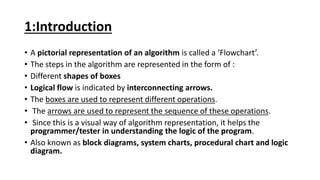
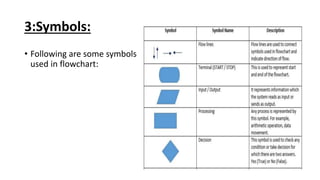
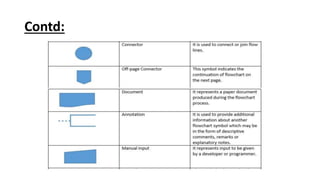
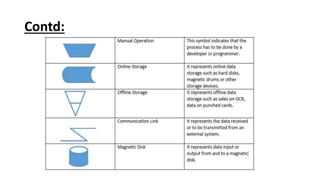
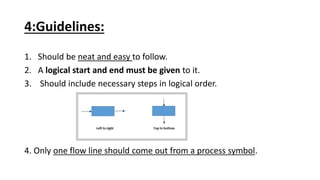
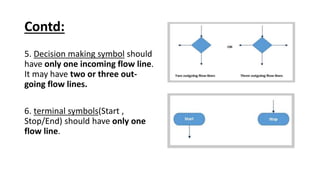
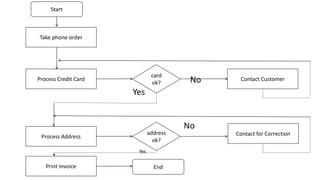
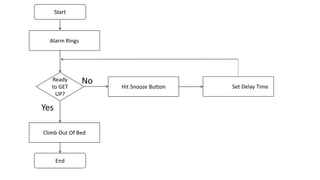
Flow Chart
1. Introduction
2. Why needed
3. Symbols
4. Guidelines
5. Benefits
6. Limitations
7. Examples
A picture is worth a thousand words....
1:Introduction
• A pictorial representation of an algorithm is called a ‘Flowchart’.
• The steps in the algorithm are represented in the form of :
• Different shapes of boxes
• Logical flow is indicated by interconnecting arrows.
• The boxes are used to represent different operations.
• The arrows are used to represent the sequence of these operations.
• Since this is a visual way of algorithm representation, it helps the
programmer/tester in understanding the logic of the program.
• Also known as block diagrams, system charts, procedural chart and logic
diagram.
2:Why needed
• It's more effective to visualize graphically than to describe with
• words.
• That is the essence(nature , core) of what flow charts do.
• Flow charts explain a process clearly through symbols and text.
• Flow charts give you the gist(core, heart) of the process flow in a
single glance.
3:Symbols:
• Following are some symbols
used in flowchart:
Contd:
Contd:
4:Guidelines:
1. Should be neat and easy to follow.
2. A logical start and end must be given to it.
3. Should include necessary steps in logical order.
4. Only one flow line should come out from a process symbol.
Contd:
5. Decision making symbol should
have only one incoming flow line.
It may have two or three out-
going flow lines.
6. terminal symbols(Start ,
Stop/End) should have only one
flow line.
Contd:
7. The symbol should contain the information(process, data or text).
8. The number of flow-lines can be reduced using connector symbol.
The connectors are mainly required in complex flowcharts.
9. The intersected flow-lines should be avoided.
10. The correctness of the flowchart can be tested by passing the test
data through it.
11. It becomes the validity test of the flowchart.
5:Benefits:
• Logic of the problem can be understood easily.
• Makes the communication easier to all the involved people.
• Analysis of the problem becomes effective and easier.
• Allow the programmer to develop error free programs.
• Allows the testing of program in every contingency(event).
• Serve as good documentation tool for beginners.
6:Limitations:
• Not efficient for complex programs.
• Costly for large programs.
• Difficult to modify
• No updation.
7:Example:
Online order system.
No
Yes
No
Yes
Start
Take phone order
Process Credit Card
Process Address
card
ok?
Contact for Correction
Contact Customer
address
ok?
Print Invoice End
Another Example:
Alarm System.
No
Yes
Start
Alarm Rings
Ready
to GET
UP?
Hit Snooze Button Set Delay Time
Climb Out Of Bed
End
References:
• http://mundrisoft.com/tech-bytes/flowchart-in-software-
engineering-testing/
• https://whatis.techtarget.com/definition/flowchart
• https://www.smartdraw.com/flowchart/
• https://www.youtube.com/watch?v=4I8xpRdBjMw

Flow chart

  • 1.
    Flow Chart 1. Introduction 2.Why needed 3. Symbols 4. Guidelines 5. Benefits 6. Limitations 7. Examples
  • 2.
    A picture isworth a thousand words....
  • 3.
    1:Introduction • A pictorialrepresentation of an algorithm is called a ‘Flowchart’. • The steps in the algorithm are represented in the form of : • Different shapes of boxes • Logical flow is indicated by interconnecting arrows. • The boxes are used to represent different operations. • The arrows are used to represent the sequence of these operations. • Since this is a visual way of algorithm representation, it helps the programmer/tester in understanding the logic of the program. • Also known as block diagrams, system charts, procedural chart and logic diagram.
  • 4.
    2:Why needed • It'smore effective to visualize graphically than to describe with • words. • That is the essence(nature , core) of what flow charts do. • Flow charts explain a process clearly through symbols and text. • Flow charts give you the gist(core, heart) of the process flow in a single glance.
  • 5.
    3:Symbols: • Following aresome symbols used in flowchart:
  • 6.
  • 7.
  • 8.
    4:Guidelines: 1. Should beneat and easy to follow. 2. A logical start and end must be given to it. 3. Should include necessary steps in logical order. 4. Only one flow line should come out from a process symbol.
  • 9.
    Contd: 5. Decision makingsymbol should have only one incoming flow line. It may have two or three out- going flow lines. 6. terminal symbols(Start , Stop/End) should have only one flow line.
  • 10.
    Contd: 7. The symbolshould contain the information(process, data or text). 8. The number of flow-lines can be reduced using connector symbol. The connectors are mainly required in complex flowcharts. 9. The intersected flow-lines should be avoided. 10. The correctness of the flowchart can be tested by passing the test data through it. 11. It becomes the validity test of the flowchart.
  • 11.
    5:Benefits: • Logic ofthe problem can be understood easily. • Makes the communication easier to all the involved people. • Analysis of the problem becomes effective and easier. • Allow the programmer to develop error free programs. • Allows the testing of program in every contingency(event). • Serve as good documentation tool for beginners.
  • 12.
    6:Limitations: • Not efficientfor complex programs. • Costly for large programs. • Difficult to modify • No updation.
  • 13.
  • 14.
    No Yes No Yes Start Take phone order ProcessCredit Card Process Address card ok? Contact for Correction Contact Customer address ok? Print Invoice End
  • 15.
  • 16.
    No Yes Start Alarm Rings Ready to GET UP? HitSnooze Button Set Delay Time Climb Out Of Bed End
  • 17.