Download to read offline
![data
Data, after all, is stuff machines can handle […]
we could create a world in which it would be programs
-- not just people -- that would enjoy the data.
For data, as for documents, the value of any part of the web is
increased by the amount of other stuff out there.
For documents it is the ability to follow links,
but for open data it is the ability to also interconnect and join,
to summarise and compare, to monitor, extrapolate, to infer.
Tim Berners-Lee, 2009
NOW!
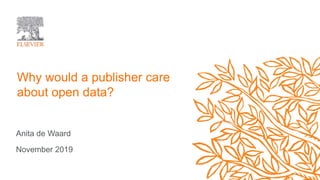
• Provenance of data: STAR Methods at Cell
• Contributor Roles (CRediT) taxonomy
• Citation and linking to data and software
• Versioned linking to data & software
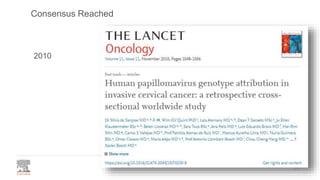
REAGENT/RESOURCE SOURCE IDENTIFIER
Antibodies
Rabbit monoclonal anti-
Snail
Cell Signaling
Technology
Cat#3879S; RRID:
AB_2255011
Mouse monoclonal anti-
Tubulin (clone DM1A)
Sigma-Aldrich Cat#T9026; RRID:
AB_477593
Rabbit polyclonal anti-
BMAL1
This paper N/A
Bacterial and Virus Strains
pAAV-hSyn-DIO-
hM3D(Gq)-mCherry
Krashes et al.,
2011
Addgene AAV5;
44361-AAV5
AAV5-EF1a-DIO-
hChR2(H134R)-EYFP
Hope Center Viral
Vectors Core
N/A
Cowpox virus Brighton
Red
BEI Resources NR-88
Zika-SMGC-1,
GENBANK: KX266255
Isolated from
patient (Wa 2016)
N/A
Staphylococcus aureus ATCC ATCC 29213
Streptococcus pyogenes:
M1 serotype strain: strain
SF370; M1 GAS
ATCC ATCC 700294
Biological Samples
Healthy adult BA9 brain
tissue
University of
Maryland Brain &
Tissue Bank
Cat#UMB1455](https://image.slidesharecdn.com/hpc20191120-191119214514/85/Why-would-a-publisher-care-about-open-data-3-320.jpg)


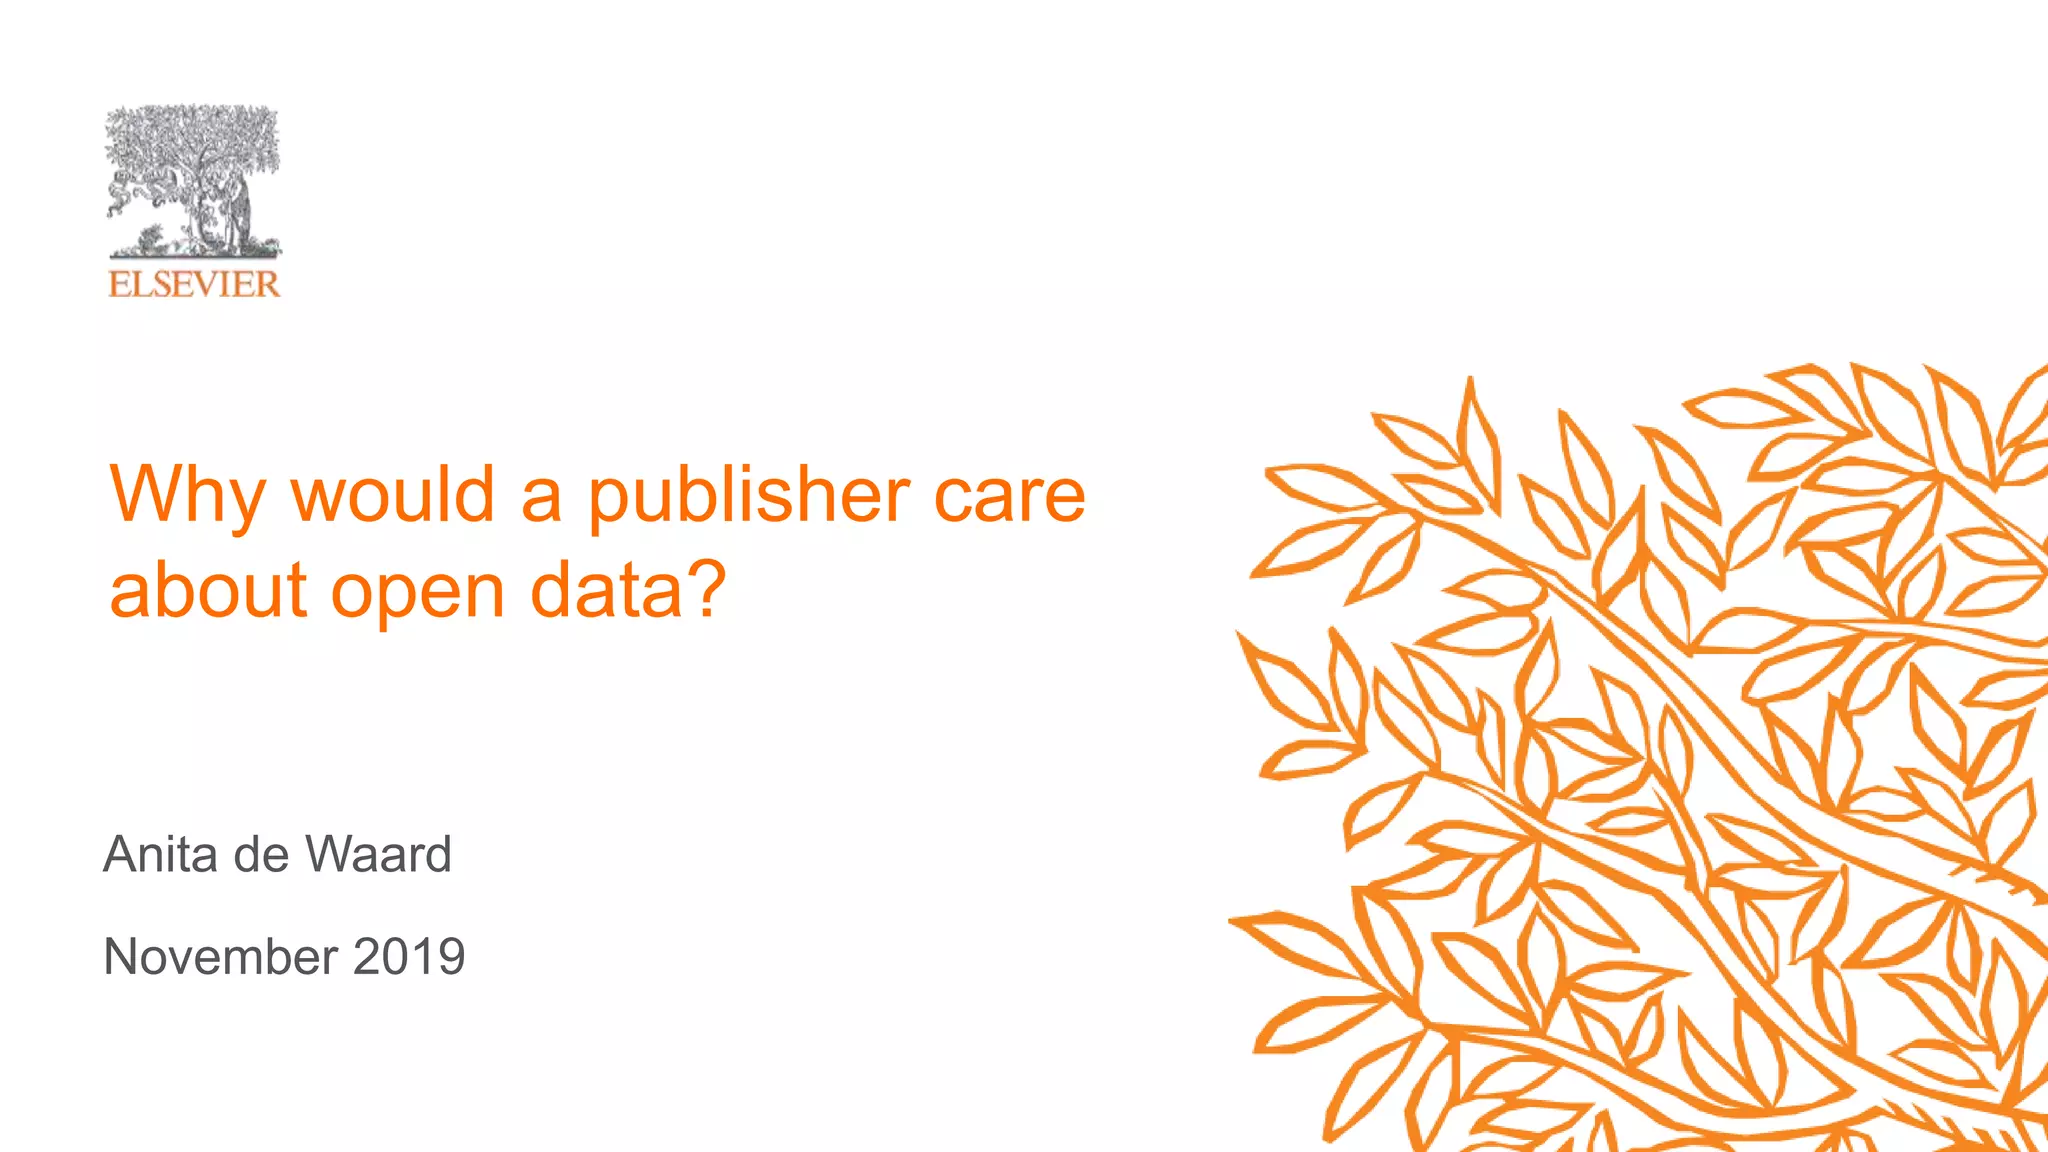
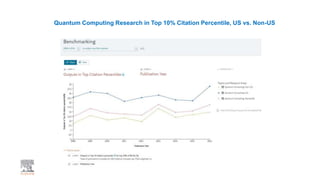
![32
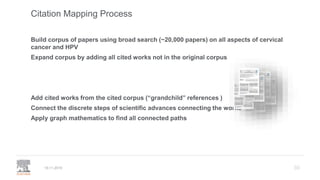
Building the Corpus
19.11.2019
'papillomaviridae' AND 'cancer' AND [article]/lim - 2,747 results from 1975-2019
• 55,414 references total cited in this set
• 29,064 unique references (the references overlap) 1870-2019
• 719,470 references cited in this set of 29,064 papers
• 259,908 unique in this set.
Total corpus of work using this method is 182,402 unique articles
• Citation network has 103,443 edges](https://image.slidesharecdn.com/hpc20191120-191119214514/85/Why-would-a-publisher-care-about-open-data-32-320.jpg)


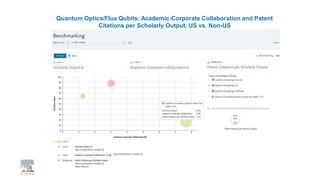
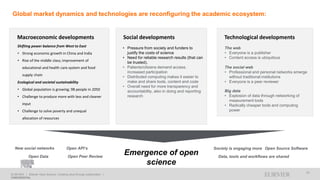
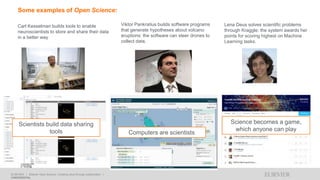
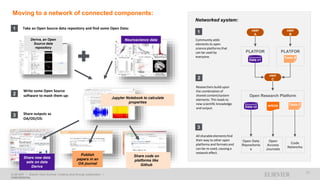

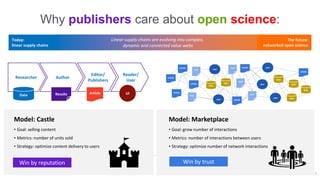
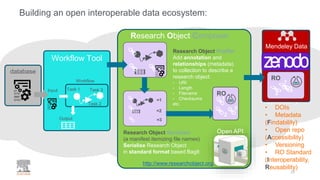
A publisher would care about open data for several reasons: 1) Open data increases the value of all parts of the web by allowing programs, not just people, to utilize the data through interconnecting and joining it. 2) Publishers are evolving from linear supply chains focused on content delivery to users, to becoming marketplaces that optimize the number of interactions between users through networked open science. 3) The future of publishing involves networked open science where data is openly accessible, annotated with metadata, and linked together in research objects, increasing findability, accessibility, interoperability, and reusability of research outputs.


![Valen Metadata and the [Data] Repository](https://cdn.slidesharecdn.com/ss_thumbnails/valen-2-feb23-170223194717-thumbnail.jpg?width=640&height=640&fit=bounds)


