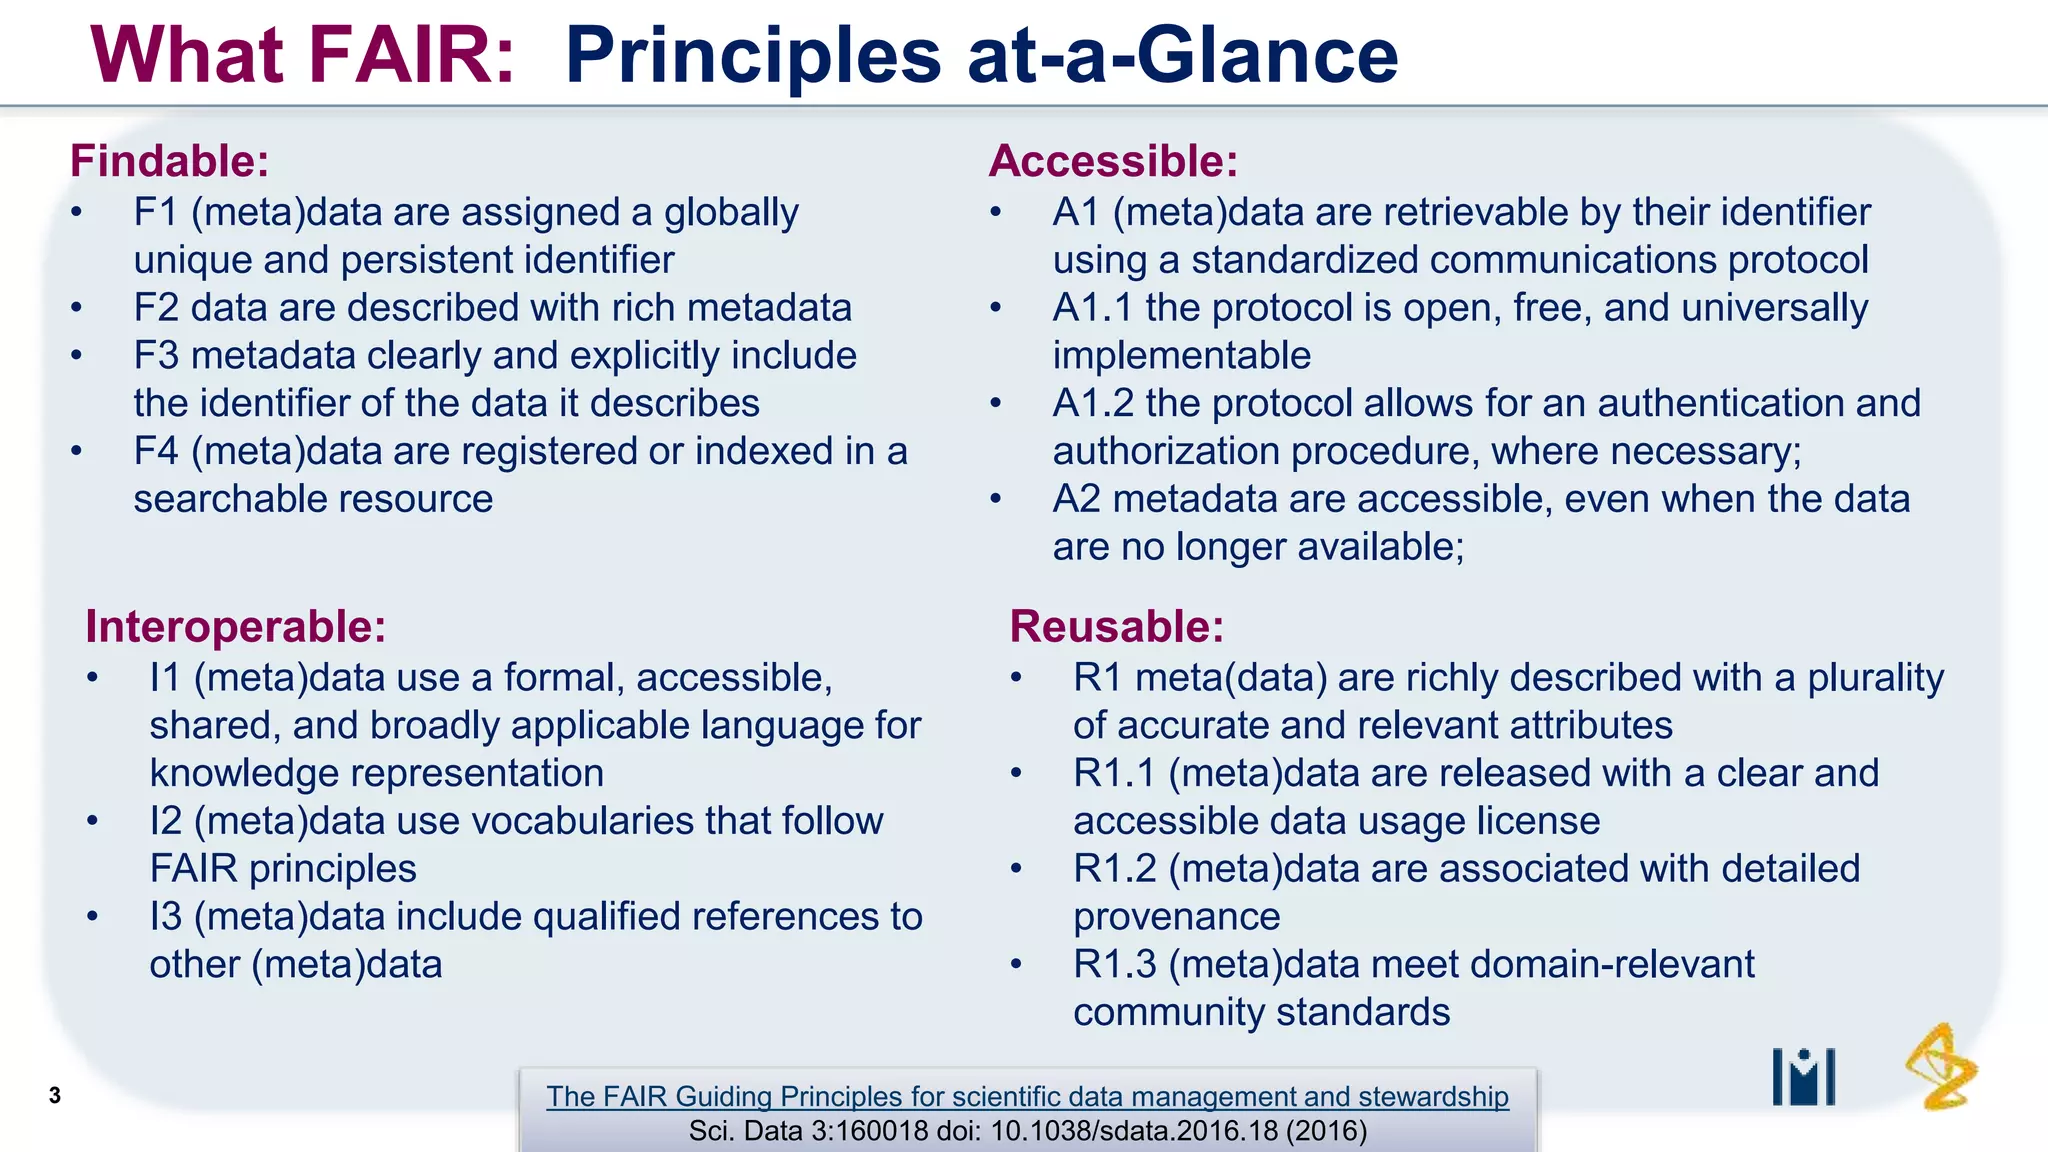
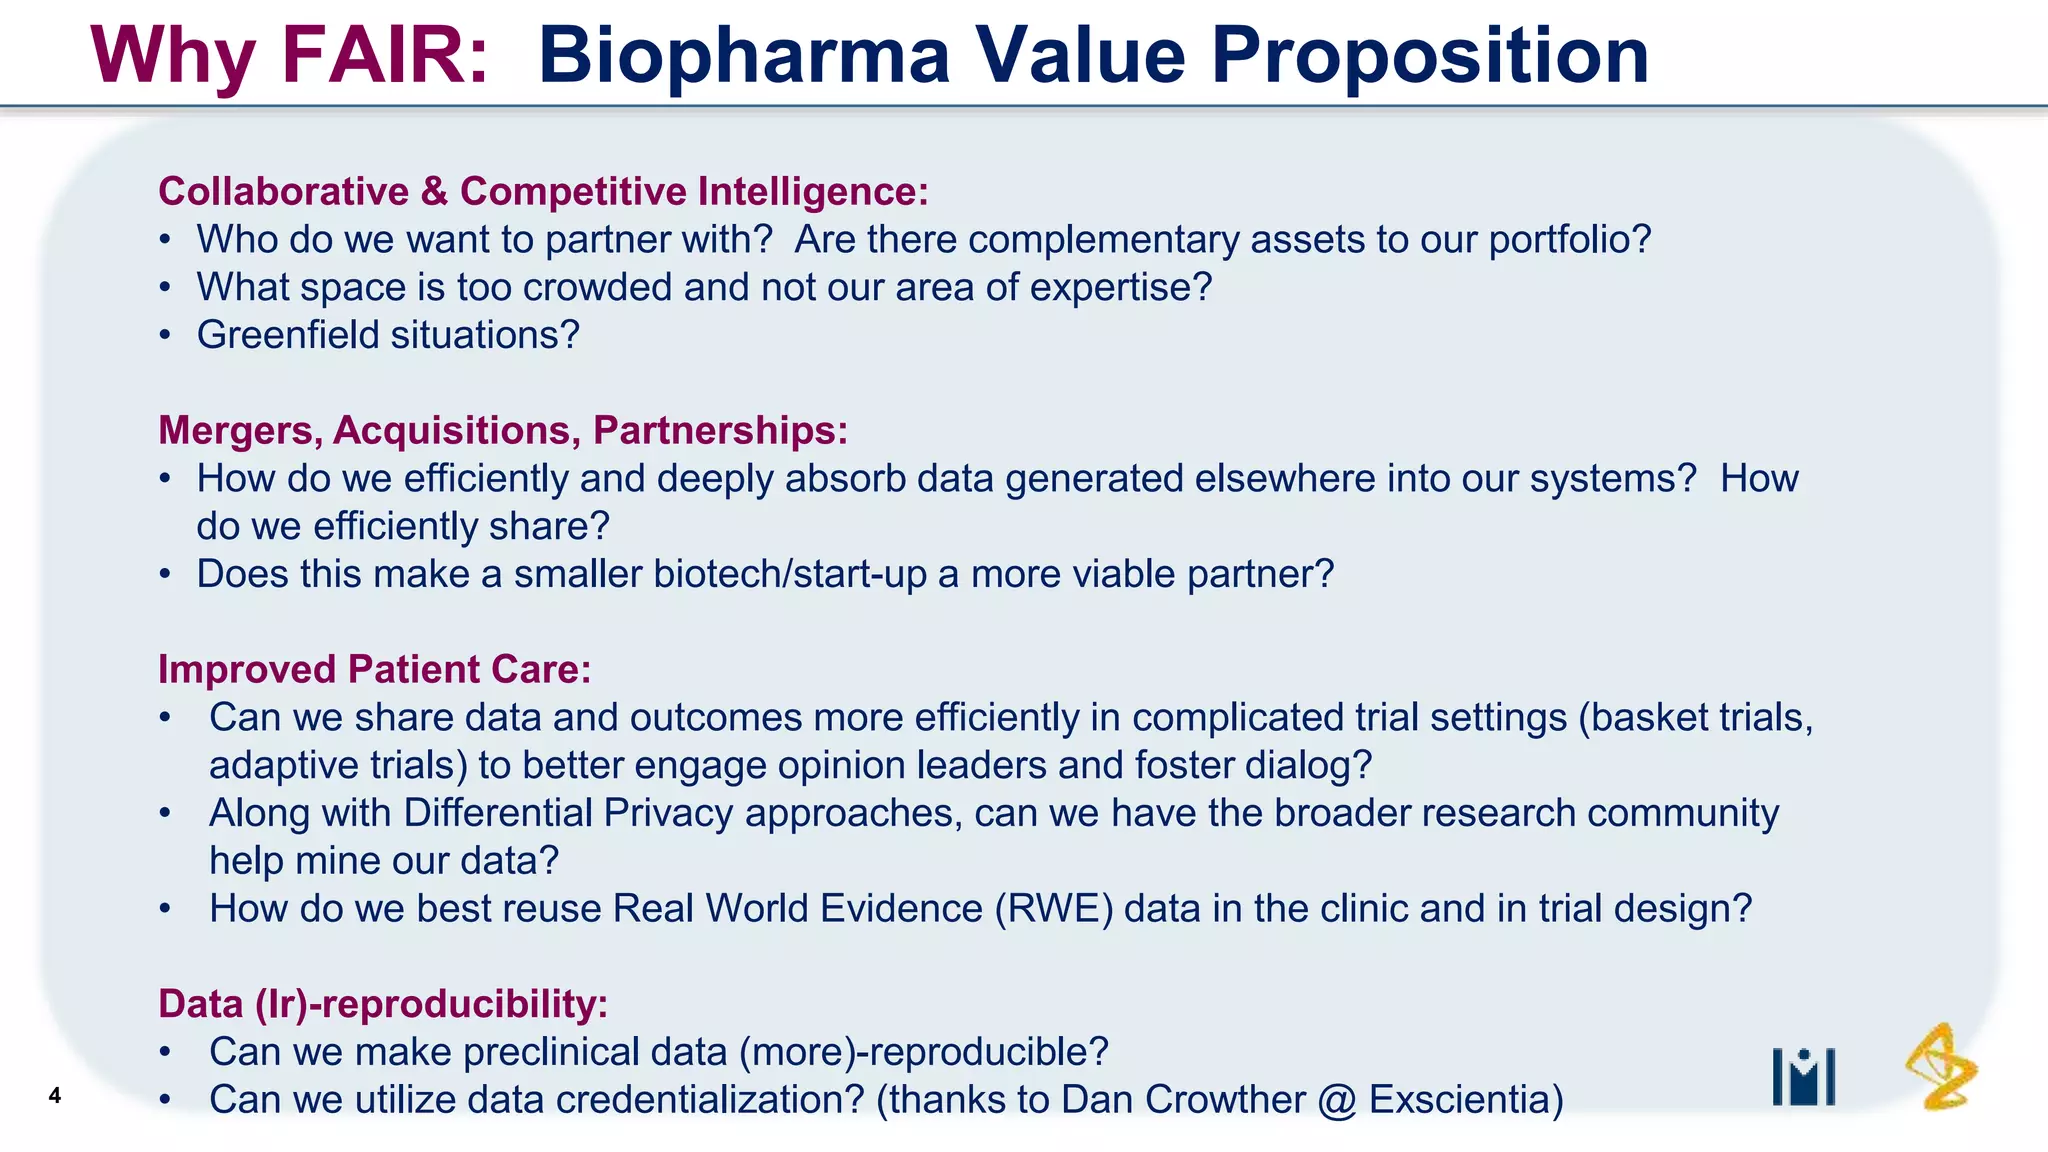
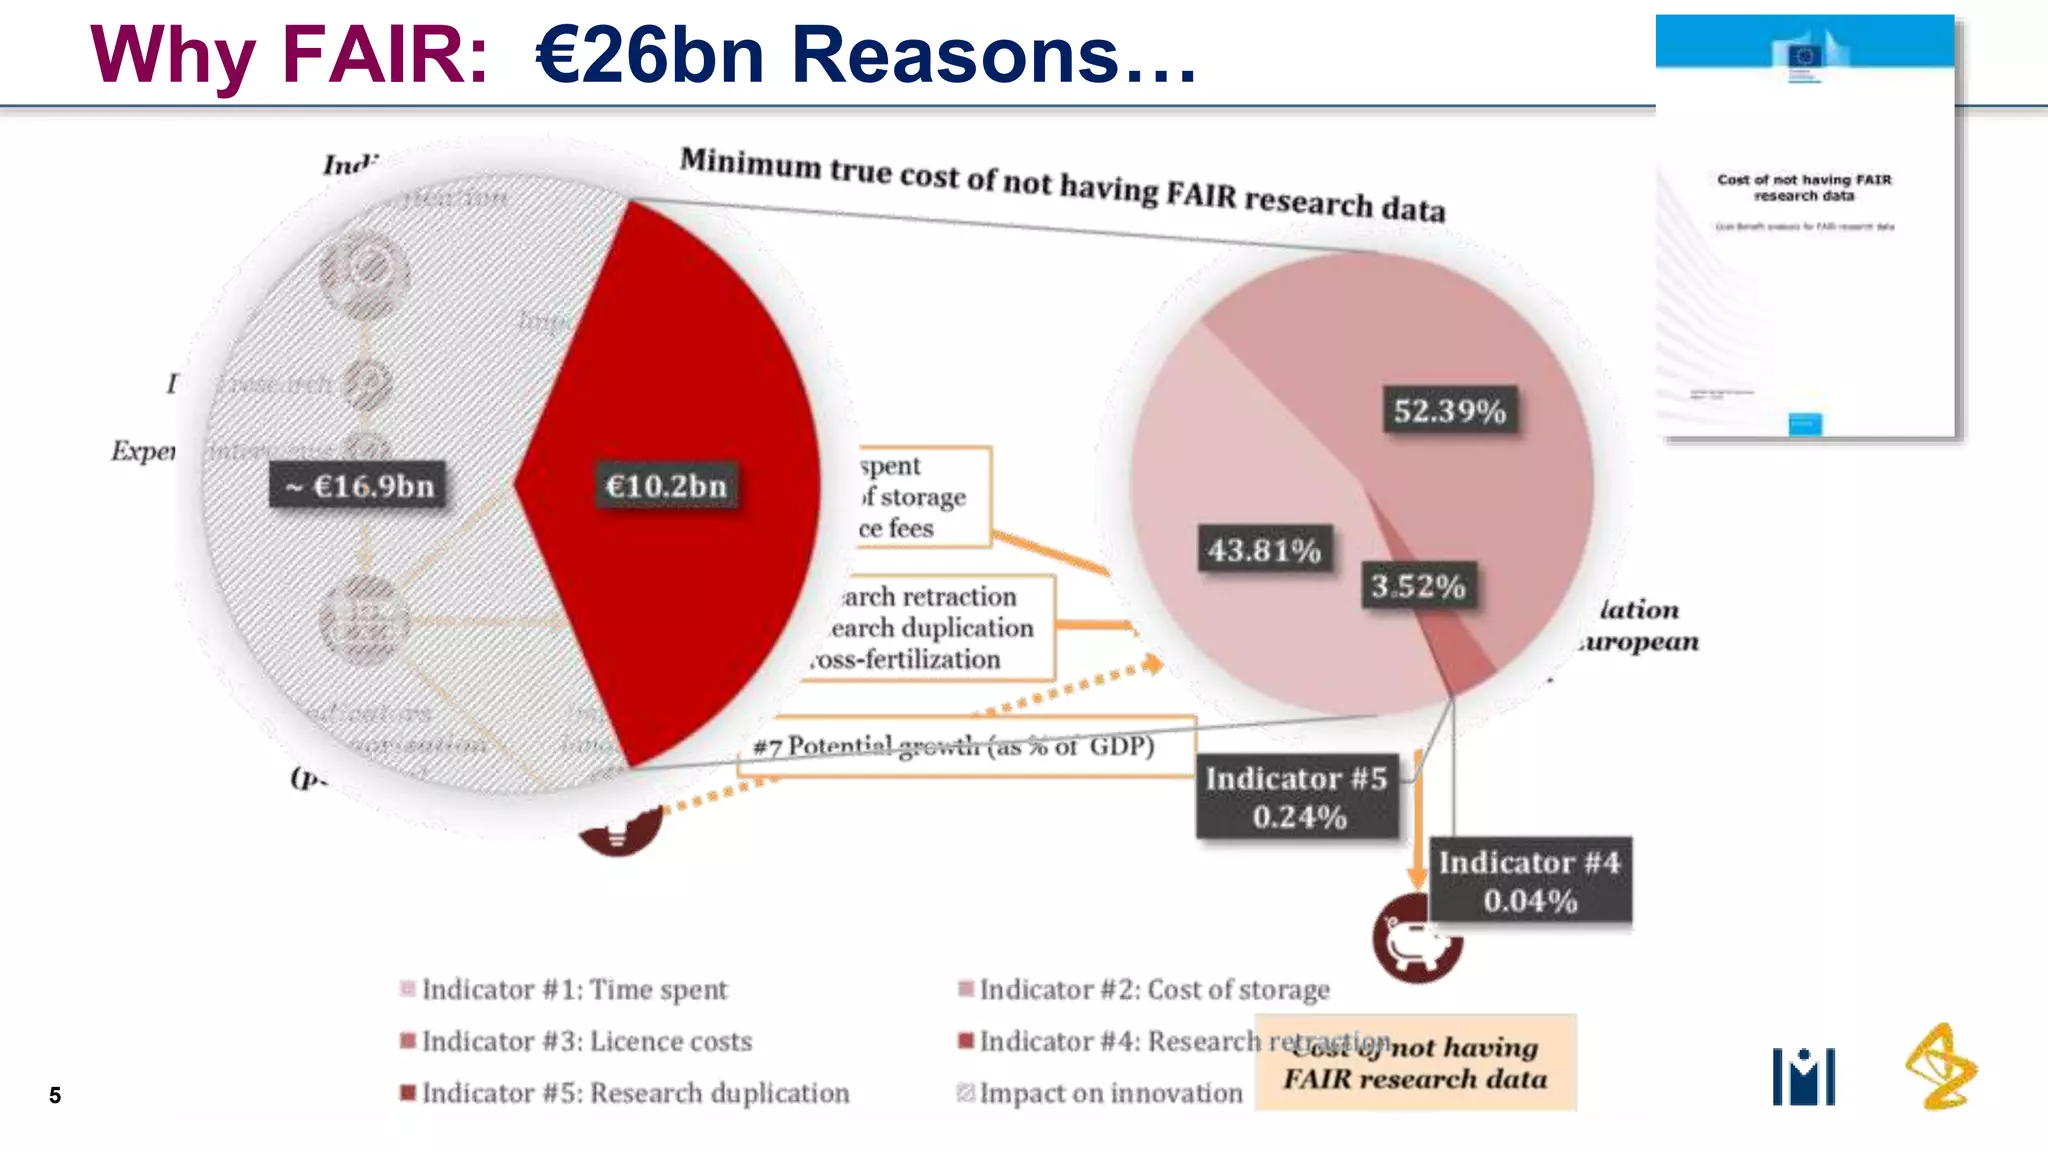
What to do About FAIR…
In the experience of most pharma professionals, FAIR remains fairly abstract, bordering on inconclusive. This session will outline specific case studies – real problems with real data, and address opportunities and real concerns.
·
Why making data Findable, Actionable, Interoperable and Reusable is important.
Talk presented at the Data Driven Drug Development (D4) conference on March 20th, 2019.
Malware, short for "malicious software," is a digital threat designed to infiltrate, damage, or gain unauthorized access to computer systems, networks, and devices. Malware comes in various forms, such as viruses, worms, trojans, ransomware, and spyware, each with distinct functionalities and methods of attack. These malicious programs exploit vulnerabilities in software or user behavior to compromise data integrity, privacy, and system functionality. To combat malware, comprehensive cybersecurity measures are essential, including regular software updates, robust antivirus solutions, user education, and cautious online behavior.
Security is a large topic and so full of jargon that it can be hard to know where to get started when thinking about it. Threat Modeling gives you a framework to help you start building security policies.
In this talk, Dan Hardiker, CTO at Adaptavist, will cover what a security model is, when and why it's useful, what its main components are (assets, actors, and vectors), and how they interact. We'll build a basic threat model, enable you to apply these to your systems, and give you references for further learning.
describe about SARS-2 virus
Coronaviruses (CoV) are a large family of viruses that cause illness ranging from the common cold to more severe diseases such as Middle East Respiratory Syndrome (MERS-CoV) and Severe Acute Respiratory Syndrome (SARS-CoV).
A novel coronavirus of zoonotic origin it mean this disease are spsread by animals to humans.
Coronavirus disease (COVID-19) is a new strain that was discovered in 2019 and has not been previously identified in humans.
The first person infected in Wuhan(hubei) in China on 17 November 2019.
The outbreak was declared a Public Health Emergency of International Concern on 30 January 2020.
COVID-19 is the name given by the WHO. On 11 February 2020. for the disease caused by the novel corona virus SARS-CoV-2.
Travel – associated cases have also been reported in a few other countries.
Outbreaks in health care workers indicate human to human transmission.
In India, first patient found in kerala on 30 January 2020.
Structure of the SARS-CoV-2 spike glycoprotein reveals the architecture of the key player of viral entry into host cells and provides a blue print for vaccine design.
Diagnosis is made based on Clinical features and history of International travel or a close contact with nCOVID POSITIVELY TESTED patients.
The CDC(The Centres for Disease Control and Prevention) recommends collection of three specimen types, lower respiratory, upper respiratory, and serum (Blood) specimens for testing.
Real – time Reverse Transcription –Polymerase Chain Reaction (rRT-PCR) test is used to diagnose nCOVID-19 in respiratory serum samples from clinical specimens.
Find the latest research on a wide range of molecular and serological assays currently available or under development:
Detection of Virus and Its Components (including Molecular Diagnostics ).
Serological (including Neutralization).
People who are at high risk
Elderly – more than 60 years.
People with decreased immunity.
People with co-morbidities such as Diabetes, Hypertension, Kidney disease etc.
Infants.
Vector-borne diseases are illnesses caused by pathogens and parasites in human populations. This presentation contains key facts about these diseases and global and European trends. WHO/Europe is making this presentation available to countries and partner organizations for use in their campaigns for World Health Day 2014.
ESOFT Metro Campus - Diploma in Software Engineering - (Module IV) Database Concepts
(Template - Virtusa Corporate)
Contents:
Introduction to Databases
Data
Information
Database
Database System
Database Applications
Evolution of Databases
Traditional Files Based Systems
Limitations in Traditional Files
The Database Approach
Advantages of Database Approach
Disadvantages of Database Approach
Database Management Systems
DBMS Functions
Database Architecture
ANSI-SPARC 3 Level Architecture
The Relational Data Model
What is a Relation?
Primary Key
Cardinality and Degree
Relationships
Foreign Key
Data Integrity
Data Dictionary
Database Design
Requirements Collection and analysis
Conceptual Design
Logical Design
Physical Design
Entity Relationship Model
A mini-world example
Entities
Relationships
ERD Notations
Cardinality
Optional Participation
Entities and Relationships
Attributes
Entity Relationship Diagram
Entities
ERD Showing Weak Entities
Super Type / Sub Type Relationships
Mapping ERD to Relational
Map Regular Entities
Map Weak Entities
Map Binary Relationships
Map Associated Entities
Map Unary Relationships
Map Ternary Relationships
Map Supertype/Subtype Relationships
Normalization
Advantages of Normalization
Disadvantages of Normalization
Normal Forms
Functional Dependency
Purchase Order Relation in 0NF
Purchase Order Relation in 1NF
Purchase Order Relations in 2NF
Purchase Order Relations in 3NF
Normalized Relations
BCNF – Boyce Codd Normal Form
Structured Query Language
What We Can Do with SQL ?
SQL Commands
SQL CREATE DATABASE
SQL CREATE TABLE
SQL DROP
SQL Constraints
SQL NOT NULL
SQL PRIMARY KEY
SQL CHECK
SQL FOREIGN KEY
SQL ALTER TABLE
SQL INSERT INTO
SQL INSERT INTO SELECT
SQL SELECT
SQL SELECT DISTINCT
SQL WHERE
SQL AND & OR
SQL ORDER BY
SQL UPDATE
SQL DELETE
SQL LIKE
SQL IN
SQL BETWEEN
SQL INNER JOIN
SQL LEFT JOIN
SQL RIGHT JOIN
SQL UNION
SQL AS
SQL Aggregate Functions
SQL Scalar functions
SQL GROUP BY
SQL HAVING
Database Administration
SQL Database Administration
Ransomware and tips to prevent ransomware attacksdinCloud Inc.
What is ransomware? How to protect against the threat of ransomware and what to do when there is a ransomware attack? These 8 tips will help you in preventing you and your organization from ransomware attacks.
Presentation investigating the state of FAIR practice and what is needed to turn FAIR data into reality given at the Danish FAIR conference in Copenhagen on 20th November 2018. https://vidensportal.deic.dk/en/Programme/FAIR_Toolbox_Nov2018 The presentation reflect on recent FAIR studies and international initiatives and outlines the recommendations emerging from the European Commission's FAIR Data Expert Group report - http://tinyurl.com/FAIR-EG
Turning FAIR into Reality: Final outcomes from the European Commission FAIR D...Sarah Jones
A multi-speaker presentation given by the European Commission FAIR Data Expert Group at ScieDataCon as part of International Data Week in Botswana in November 2018.
Simon Hodson, Chair of the Group explained the remit and background. Natalie Harrower outlined key concepts. Francoise Genova spoke on the recommendations related to research data culture. Daniel Mietchen addressed the infrastructure needed and our proposals for a FAIR ecosystem, and Sarah Jones spoke to the cultural aspects needed to drive change and outlined the FAIR Action Plan.
The report has been revised in light of the 500+ comments received as part of the open consultation and will be formally released on 23rd November as part of the Austrian Presidency events.
FAIR data: what it means, how we achieve it, and the role of RDASarah Jones
Presentation on FAIR data, the FAIR Data Action Plan developed by the European Commission Expert Group and the role of the Research Data Alliance on implementing FAIR. The presentation was given at the RDAFinland workshop held on 6th June - https://www.csc.fi/web/training/-/rda_and_fair_supporting_finnish_researchers
FAIR Ddata in trustworthy repositories: the basicsOpenAIRE
This video illustrates how certified digital repositories contribute to making and keeping research data findable, accessible, interoperable and reusable (FAIR). Trustworthy repositories support Open Access to data, as well as Restricted Access when necessary, and they offer support for metadata, sustainable and interoperable file formats, and persistent identifiers for future citation. Presented by Marjan Grootveld (DANS, OpenAIRE).
Main references
• Core Trust Seal for trustworthy digital repositories: https://www.coretrustseal.org/
• EUDAT FAIR checklist: https://doi.org/10.5281/zenodo.1065991
• European Commission’s Guidelines on FAIR data management: http://ec.europa.eu/research/participants/data/ref/h2020/grants_manual/hi/oa_pilot/h2020-hi-oa-data-mgt_en.pdf
• FAIR data principles: www.force11.org/group/fairgroup/fairprinciples
• Overview of metadata standards and tools: https://rdamsc.dcc.ac.uk/
Overview of FAIR and the IMI FAIRplus project at the UK Conference of Bioinformatics and Computational Biology 2020: https://www.earlham.ac.uk/uk-conference-bioinformatics-and-computational-biology-2020
A presentation given on the Horizon 2020 open data pilot as part of a series of OpenAIRE webinars for Open Access week 2014 - http://www.fosteropenscience.eu/event/openaire-webinars-during-oa-week-2014
The Horizon 2020 Open Data Pilot - OpenAIRE webinar (Oct. 21 2014) by Sarah J...OpenAIRE
Sarah Jones (HATII, Digital Curation Center) will provide more information on the Open Research Data Pilot in H2020: who should participate and how to comply (in collaboration with FOSTER)
Date: Tuesday, October 21 2014
PARTHENOS Common Policies and Implementation StrategiesParthenos
Presentation by Hella Hollander for the PARTHENOS workshop "Introducing PARTHENOS - Integrating the Digital Humanities" on 14 December 2016 in Prato, Italy.
Similar to Making Data FAIR (Findable, Accessible, Interoperable, Reusable) (20)
FAIR Data Knowledge Graphs–from Theory to PracticeTom Plasterer
FAIR data has flown up the hype curve without a clear sense of return from the required data stewardship investment. The killer use case for FAIR data is a science knowledge graph. It enables you to richly address novel questions of your and the world’s data. We started with data catalogues (findability) which exploited linked/referenced data using a few focused vocabularies (interoperability), for credentialed users (accessibility), with provenance and attribution (reusability) to make this happen. Our processes enable simple creation of dataset records and linking to source data, providing a seamless federated knowledge graph for novice and advanced users alike.
Presented May 7th, 2019 at the Knowledge Graph Conference, Columbia University.
FAIR data has flown up the hype curve without a clear sense of return from the required data stewardship investment. The killer use case for FAIR data is a science knowledge graph. It enables you to richly address novel questions of your and the world’s data. We started with data catalogues (findability) which exploited linked/referenced data using a few focused vocabularies (interoperability), for credentialed users (accessibility), with provenance and attribution (reusability) to make this happen.
This talk was presented at The Molecular Medicine Tri-Conference/Bio-IT West on March 11, 2019.
Dataset Catalogs as a Foundation for FAIR* DataTom Plasterer
BioPharma and the broader research community is faced with the challenge of simply finding the appropriate internal and external datasets for downstream analytics, knowledge-generation and collaboration. With datasets as the core asset, we wanted to promote both human and machine exploitability, using web-centric data cataloguing principles as described in the W3C Data on the Web Best Practices. To do so, we adopted DCAT (Data CATalog Vocabulary) and VoID (Vocabulary of Interlinked Datasets) for both RDF and non-RDF datasets at summary, version and distribution levels. Further, we’ve described datasets using a limited set of well-vetted public vocabularies, focused on cross-omics analytes and clinical features of the catalogued datasets.
BioPharma and FAIR Data, a Collaborative AdvantageTom Plasterer
The concept of FAIR (Findable, Accessible, Interoperable and Reusable) data is becoming a reality as stakeholders from industry, academia, funding agencies and publishers are embracing this approach. For BioPharma being able to effectively share and reuse data is a tremendous competitive advantage, within a company, with peer organizations, key opinion leaders and regulatory agencies. A few key drivers, success stories and preliminary results of an industry data stewardship survey are presented.
Edge Informatics and FAIR (Findable, Accessible, Interoperable and Reusable) ...Tom Plasterer
Edge Informatics is an approach to accelerate collaboration in the BioPharma pipeline. By combining technical and social solutions knowledge can be shared and leveraged across the multiple internal and external silos participating in the drug development process. This is accomplished by making data assets findable, accessible, interoperable and reusable (FAIR). Public consortia and internal efforts embracing FAIR data and Edge Informatics are highlighted, in both preclinical and clinical domains.
This talk was presented at the Molecular Medicine Tri-Conference in San Francisco, CA on February 20, 2017
Harnessing Edge Informatics to Accelerate Collaboration in BioPharma (Bio-IT ...Tom Plasterer
As scientists in the life sciences we are trained to pursue singular goals around a publication or a validated target or a drug submission. Our failure rates are exceedingly high especially as we move closer to patients in the attempt to collect sufficient clinical evidence to demonstrate the value of novel therapeutics. This wastes resources as well as time for patients depending upon us for the next breakthrough.
Edge Informatics is an approach to ameliorate these failures. Using both technical and social solutions together knowledge can be shared and leveraged across the drug development process. This is accomplished by making data assets discoverable, accessible, self-described, reusable and annotatable. The Open PHACTS project pioneered this approach and has provided a number of the technical and social solutions to enable Edge Informatics. A number of pre-competitive consortia and some content providers have also embraced this approach, facilitating networks of collaborators within and outside a given organization. When taken together more accurate, timely and inclusive decision-making is fostered.
As BioPharma adapts to incorporate nimble networks of suppliers, collaborators, and regulators the ability to link data is critical for dynamic interoperability. Adoption of linked data paradigm allows BioPharma to focus on core business: delivering valuable therapeutics in a timely manner.
Enabling Discovery in High-Risk Plaque using Semantic Web ApproachesTom Plasterer
Enabling Discovery in High-Risk Plaque using Semantic Web Approaches
The HRP initiative (HRP) is a joint research and development effort to advance the understanding, recognition and management of high-risk plaque for the benefit of multiple stakeholders in the healthcare system. As the primary underlying cause of heart attacks, high-risk, or vulnerable plaque is the number one cause of death in the Western world. There are currently no methods of screening, diagnosis or treatment for high-risk plaque.
The HRP initiative leverages recent advances in biology and information technology to design and optimize a care-cycle for high-risk plaque, promising to reduce morbidity, mortality and cost associated with cardiovascular disease. This Initiative is being led by the world’s foremost scientists in the fields of cardiology, pathology, and imaging, and is made possible through funding by leading pharmaceutical and medical technology entities.
HRP takes advantages of semantic web technologies for physician and researcher-lead data analysis and data interoperability. One of the key applications is a web tool linking patient demographics, clinical chemistries, physical measurements and cardiovascular imaging modalities. This empowers scientists to rapidly compare multiple clinical parameters to find patients of interest, assisting greatly in defining high-risk plaque.
Title: Sense of Taste
Presenter: Dr. Faiza, Assistant Professor of Physiology
Qualifications:
MBBS (Best Graduate, AIMC Lahore)
FCPS Physiology
ICMT, CHPE, DHPE (STMU)
MPH (GC University, Faisalabad)
MBA (Virtual University of Pakistan)
Learning Objectives:
Describe the structure and function of taste buds.
Describe the relationship between the taste threshold and taste index of common substances.
Explain the chemical basis and signal transduction of taste perception for each type of primary taste sensation.
Recognize different abnormalities of taste perception and their causes.
Key Topics:
Significance of Taste Sensation:
Differentiation between pleasant and harmful food
Influence on behavior
Selection of food based on metabolic needs
Receptors of Taste:
Taste buds on the tongue
Influence of sense of smell, texture of food, and pain stimulation (e.g., by pepper)
Primary and Secondary Taste Sensations:
Primary taste sensations: Sweet, Sour, Salty, Bitter, Umami
Chemical basis and signal transduction mechanisms for each taste
Taste Threshold and Index:
Taste threshold values for Sweet (sucrose), Salty (NaCl), Sour (HCl), and Bitter (Quinine)
Taste index relationship: Inversely proportional to taste threshold
Taste Blindness:
Inability to taste certain substances, particularly thiourea compounds
Example: Phenylthiocarbamide
Structure and Function of Taste Buds:
Composition: Epithelial cells, Sustentacular/Supporting cells, Taste cells, Basal cells
Features: Taste pores, Taste hairs/microvilli, and Taste nerve fibers
Location of Taste Buds:
Found in papillae of the tongue (Fungiform, Circumvallate, Foliate)
Also present on the palate, tonsillar pillars, epiglottis, and proximal esophagus
Mechanism of Taste Stimulation:
Interaction of taste substances with receptors on microvilli
Signal transduction pathways for Umami, Sweet, Bitter, Sour, and Salty tastes
Taste Sensitivity and Adaptation:
Decrease in sensitivity with age
Rapid adaptation of taste sensation
Role of Saliva in Taste:
Dissolution of tastants to reach receptors
Washing away the stimulus
Taste Preferences and Aversions:
Mechanisms behind taste preference and aversion
Influence of receptors and neural pathways
Impact of Sensory Nerve Damage:
Degeneration of taste buds if the sensory nerve fiber is cut
Abnormalities of Taste Detection:
Conditions: Ageusia, Hypogeusia, Dysgeusia (parageusia)
Causes: Nerve damage, neurological disorders, infections, poor oral hygiene, adverse drug effects, deficiencies, aging, tobacco use, altered neurotransmitter levels
Neurotransmitters and Taste Threshold:
Effects of serotonin (5-HT) and norepinephrine (NE) on taste sensitivity
Supertasters:
25% of the population with heightened sensitivity to taste, especially bitterness
Increased number of fungiform papillae
Adv. biopharm. APPLICATION OF PHARMACOKINETICS : TARGETED DRUG DELIVERY SYSTEMSAkankshaAshtankar
MIP 201T & MPH 202T
ADVANCED BIOPHARMACEUTICS & PHARMACOKINETICS : UNIT 5
APPLICATION OF PHARMACOKINETICS : TARGETED DRUG DELIVERY SYSTEMS By - AKANKSHA ASHTANKAR
ABDOMINAL TRAUMA in pediatrics part one.drhasanrajab
Abdominal trauma in pediatrics refers to injuries or damage to the abdominal organs in children. It can occur due to various causes such as falls, motor vehicle accidents, sports-related injuries, and physical abuse. Children are more vulnerable to abdominal trauma due to their unique anatomical and physiological characteristics. Signs and symptoms include abdominal pain, tenderness, distension, vomiting, and signs of shock. Diagnosis involves physical examination, imaging studies, and laboratory tests. Management depends on the severity and may involve conservative treatment or surgical intervention. Prevention is crucial in reducing the incidence of abdominal trauma in children.
These lecture slides, by Dr Sidra Arshad, offer a quick overview of the physiological basis of a normal electrocardiogram.
Learning objectives:
1. Define an electrocardiogram (ECG) and electrocardiography
2. Describe how dipoles generated by the heart produce the waveforms of the ECG
3. Describe the components of a normal electrocardiogram of a typical bipolar lead (limb II)
4. Differentiate between intervals and segments
5. Enlist some common indications for obtaining an ECG
6. Describe the flow of current around the heart during the cardiac cycle
7. Discuss the placement and polarity of the leads of electrocardiograph
8. Describe the normal electrocardiograms recorded from the limb leads and explain the physiological basis of the different records that are obtained
9. Define mean electrical vector (axis) of the heart and give the normal range
10. Define the mean QRS vector
11. Describe the axes of leads (hexagonal reference system)
12. Comprehend the vectorial analysis of the normal ECG
13. Determine the mean electrical axis of the ventricular QRS and appreciate the mean axis deviation
14. Explain the concepts of current of injury, J point, and their significance
Study Resources:
1. Chapter 11, Guyton and Hall Textbook of Medical Physiology, 14th edition
2. Chapter 9, Human Physiology - From Cells to Systems, Lauralee Sherwood, 9th edition
3. Chapter 29, Ganong’s Review of Medical Physiology, 26th edition
4. Electrocardiogram, StatPearls - https://www.ncbi.nlm.nih.gov/books/NBK549803/
5. ECG in Medical Practice by ABM Abdullah, 4th edition
6. Chapter 3, Cardiology Explained, https://www.ncbi.nlm.nih.gov/books/NBK2214/
7. ECG Basics, http://www.nataliescasebook.com/tag/e-c-g-basics
Here is the updated list of Top Best Ayurvedic medicine for Gas and Indigestion and those are Gas-O-Go Syp for Dyspepsia | Lavizyme Syrup for Acidity | Yumzyme Hepatoprotective Capsules etc
NVBDCP.pptx Nation vector borne disease control programSapna Thakur
NVBDCP was launched in 2003-2004 . Vector-Borne Disease: Disease that results from an infection transmitted to humans and other animals by blood-feeding arthropods, such as mosquitoes, ticks, and fleas. Examples of vector-borne diseases include Dengue fever, West Nile Virus, Lyme disease, and malaria.
micro teaching on communication m.sc nursing.pdfAnurag Sharma
Microteaching is a unique model of practice teaching. It is a viable instrument for the. desired change in the teaching behavior or the behavior potential which, in specified types of real. classroom situations, tends to facilitate the achievement of specified types of objectives.
Rasamanikya is a excellent preparation in the field of Rasashastra, it is used in various Kushtha Roga, Shwasa, Vicharchika, Bhagandara, Vatarakta, and Phiranga Roga. In this article Preparation& Comparative analytical profile for both Formulationon i.e Rasamanikya prepared by Kushmanda swarasa & Churnodhaka Shodita Haratala. The study aims to provide insights into the comparative efficacy and analytical aspects of these formulations for enhanced therapeutic outcomes.
Making Data FAIR (Findable, Accessible, Interoperable, Reusable)
1. Making Data FAIR*
Tom Plasterer, PhD
Director, Bioinformatics, Research Bioinformatics 20 Mar 2019
* Findable, Accessible, Interoperable and Reusable
2. 3
What FAIR: Principles at-a-Glance
Findable:
• F1 (meta)data are assigned a globally
unique and persistent identifier
• F2 data are described with rich metadata
• F3 metadata clearly and explicitly include
the identifier of the data it describes
• F4 (meta)data are registered or indexed in a
searchable resource
The FAIR Guiding Principles for scientific data management and stewardship
Sci. Data 3:160018 doi: 10.1038/sdata.2016.18 (2016)
Accessible:
• A1 (meta)data are retrievable by their identifier
using a standardized communications protocol
• A1.1 the protocol is open, free, and universally
implementable
• A1.2 the protocol allows for an authentication and
authorization procedure, where necessary;
• A2 metadata are accessible, even when the data
are no longer available;
Interoperable:
• I1 (meta)data use a formal, accessible,
shared, and broadly applicable language for
knowledge representation
• I2 (meta)data use vocabularies that follow
FAIR principles
• I3 (meta)data include qualified references to
other (meta)data
Reusable:
• R1 meta(data) are richly described with a plurality
of accurate and relevant attributes
• R1.1 (meta)data are released with a clear and
accessible data usage license
• R1.2 (meta)data are associated with detailed
provenance
• R1.3 (meta)data meet domain-relevant
community standards
3. 4
Collaborative & Competitive Intelligence:
• Who do we want to partner with? Are there complementary assets to our portfolio?
• What space is too crowded and not our area of expertise?
• Greenfield situations?
Mergers, Acquisitions, Partnerships:
• How do we efficiently and deeply absorb data generated elsewhere into our systems? How
do we efficiently share?
• Does this make a smaller biotech/start-up a more viable partner?
Improved Patient Care:
• Can we share data and outcomes more efficiently in complicated trial settings (basket trials,
adaptive trials) to better engage opinion leaders and foster dialog?
• Along with Differential Privacy approaches, can we have the broader research community
help mine our data?
• How do we best reuse Real World Evidence (RWE) data in the clinic and in trial design?
Data (Ir)-reproducibility:
• Can we make preclinical data (more)-reproducible?
• Can we utilize data credentialization? (thanks to Dan Crowther @ Exscientia)
Why FAIR: Biopharma Value Proposition
5. 6
When FAIR: A Brief History
Moving away from Narrative
• Nanopublications
Incubating Standards in Open PHACTS
• VoID, PROV-O
Lorentz Center Workshop
• FORCE 11 FAIR Guiding Principles
• Participants: IMI members, US researchers,
Content providers, ELIXIR; European Open
Science Cloud, Big Data to Knowledge (BD2K)
Current Status:
• FAIR Data Workshops (EU-ELIXIR nodes)
• Inclusion in Horizon 2020, NIH Advocacy
• IMI2 Data FAIR-ification Call
• Vendors getting up to speed
6. 7
Linked Data Community of Practice
How familiar are you with the
FAIR principles and metrics?
When FAIR: Community Awareness
7. 8
Linked Data Community of Practice
What is the maturity
level of your
organization with
respect to
implementation of
FAIR?
When FAIR: Getting Started
8. 9
How FAIR: Pistoia FAIR Implementation Group
• Business challenge:
- Effective application and analysis of data
assets in life science industry demands that
it is made Findable, Accessible,
Interoperable and Reusable
• Update and plans:
- Workshop at The Hyve, Utrecht NL in June
2018 resulted in a published feature
article:-
- Workshop at EPAM, Boston US in Dec
2018 contributed to the business case
thinking
- Phase 1 for 2019 plans:-
• Develop the business case to define
distinctive role for the project
• Develop the FAIR Toolkit concept
• Select a use case: e.g. clinical science
to engage with CROs at a workshop
- Seeking more funding – join us!
PM: Ian Harrow Collaborators
1.Metric Tools & Best Practice
2.Training resources
3.Culture change process
4.Use case examples
5.Cost benefit examples
• Adapt for Life Science industry
• Leverage existing FAIR resources
FAIR Toolkit
Implementation
for LS Industry
FAIR
9. 10
How FAIR: Pistoia Ontologies Mapping Project
• Business challenge:
– Use of different ontologies within
same data domain hampers
interoperability and application.
Solve by mapping between them.
• Update and plans:
– Phase 3 completed by end of 2018
• Predicted mappings delivered as a
prototype Ontology Mapping Service
for phenotype and disease domain
• Mappings will be available through
public wiki and OxO mapping repository
at EMBL-EBI
• Mapping algorithm, Paxo is available
openly on GitHub
– Phase 4 for 2019 plans:-
• To extend mapping of biological and
chemical ontologies for support of
laboratory analytics
• FAIR implementation is planned
– Seeking more funding – join us!
PartnersPM: Ian Harrow
12. 13
How FAIR:
Overview:
• ELIXIR - Project Coordinator & Janssen - Project Leader
• 22 participants with 12 academic, 7 EFPIA, 3 SME
• €8.23M budget with €4M H2020 EC funding + €4.23M EFPIA in-kind
• 42 months
Goals:
• Establish a value-based process for prioritization and selection of IMI project databases
• Develop FAIRification toolkit e.g. develop guidelines, tools and metrics - FAIR Cookbook
• Apply this toolkit to FAIRify datasets from selected IMI projects and EFPIA companies
• Deliver training for data handlers (academia, SMEs and pharmaceuticals) to change and
sustain the data management culture
• Foster and innovation ecosystem on FAIR open data to power future reuse, knowledge
generation and societal benefit e.g. FAIR innovation and SME events
Members:
PM: Serena Scollen
16. 17
Start FAIR: Find me Datasets about:
Projects
Study
Indication/
Disease
Technology
Targets
Cohort DatesAgent
Therapeutic
Area
Drugs
17. 18
Dataset Catalog is a collection of Dataset Records
• Catalogs are needed to supporting FAIR (Findable) data
• Catalogs can and should support Enterprise MDM strategies
• Consumers can be internal or external
Dataset Catalogs are needed so data consumers can find Datasets
• Dataset records need sufficient metadata to support discoverability
• Dataset terms are NOT the data instance
Dataset Catalogs surface dataset provenance and enable data access
Dataset Catalogs can provide datasets for multiple consumption patters
• Analytics readiness and fit
• ‘Walking’ across information models
Start FAIR: Findability Starts with Catalogs
19. Start FAIR: Dataset to Knowlege Graph to Analytics
Data Catalog Filter
Phase 1
Experiment Metadata Filter
Phase 2
Ad hoc Analyses Filtering
Phase 3
Outbound
to Data Analytics
Data Science
Tools
Statistical
Filtering
e.g., clinical trial with > 50
participants
Dataset
Catalog
Descriptions
20. R&D | RDI
Why FAIR?
• Cost avoidance, Business Advantage, Data Stewardship
When FAIR?
• Now! Peers, especially in Europe, are doing it
How FAIR?
• FAIRplus, GO-FAIR, Pistoia FAIR Implementation Group
Start FAIR
• Findability first, adopt a FAIR-compliant Data Catalog
FAIR-for-Biopharma: Take-aways
21. R&D | RDI
Thanks
Key Influencers
David Wood
Tim Berners-Lee
Lee Harland
Jane Lomax
James Malone
Dean Allemang
Barend Mons
Carole Goble
Bernadette Hyland
Bob Stanley
Eric Little
Michel Dumontier
John Wilbanks
Hans Constandt
Filip Pattyn
Tim Hoctor
Kees Van Boche
Serena Scollen
AstraZeneca/Pistoia FAIR
Data Community
Mathew Woodwark
Rajan Desai
Nic Sinibaldi
Chia-Chien Chiang
Kerstin Forsberg
Ola Engkvist
Ian Dix
Colin Wood
Ted Slater
Martin Romacker
Eric Neumann
John Wise
Carmen Nitsche
Ian Harrow
Jeff Saltzman
Kathy Reinold
Editor's Notes
Eric Schulte’s talk: Ready, Set, GO-FAIR: https://vimeo.com/282650465
50% (or higher) preclinical research could not be reproduced with a cost of $28B/year
http://journals.plos.org/plosbiology/article?id=10.1371/journal.pbio.1002165
Pistoia paper: Implementation and relevance of FAIR data principles in biopharmaceutical R&D; https://www.ncbi.nlm.nih.gov/pubmed/30690198