Downloaded 314 times
![Whole-body vibration when riding on rough roads
SNRA Publ. no. 2000:31E
Introduction
Apart from the direct impact road roughness and texture has on vehicles and the environ-
ment, these road characteristics are also an indirect source of the noise, infrasonic sound
and whole-body vibration that cause stress on road users. The effect of this stress/load can
be divided into the following three categories, for which criteria can be stipulated and well-
motivated limits set:
1. discomfort
2. performance ability
3. health impact
The effect on the human body depends on the type of load. It varies from individual to
individual, depending on the person’s own particular situation. Reactions can be acute (like
speech impairment), gradually increase during travel (like motion sickness) or steadily de-
velop over time (like spinal injury). The effects can be transient, as in temporary visual im-
pairment, or chronic as in kidney damage. Temporary exposure can cause stress reactions,
like a faster pulse or higher blood pressure, which in turn entails a greater stress on the
heart. Sustained exposure can tire the brain a nd produce drowsiness. Daily exposure can, in
the long run, impair health and result in long periods of sick leave or even early retirement.
Sometimes these ailments can require medical treatment, which in turn can have side ef-
fects that can substantially impair quality of life. Musculo-skeletal injury is by far the great-
est working environment problem in the Western world today.
In the mid 1970’s, the exposure of truck drivers to vibration was an issue raised at the fed-
eral government level in the USA, formulated as ”Do vibrations (as well as noise, toxic
fumes and other factors that contribute to truck “ride quality”) have a negative effect on
driver health and on highway safety?” A research programme that extended over several
years, ”Ride Quality of Commercial Motor Vehicles and the Impact on Truck Driver Per-
formance” was initiated in 1977 to answer this question. The findings were summarised in
a report published in 1982 entitled ”Truck Cab Vibrations and Highway Safety” [66]. This
report was jointly produced by leading researchers, road authorities, vehicle manufacturers,
hauliers and commercial drivers. It shows that the answer to the key question as to whether
there is any correlation between cab vibrations and road safety is YES, that there is good
reason to believe that vibrations affect drivers’ health, and that vibrations must be elimi-
nated at source through effective road maintenance rather than merely dampened. The
report concludes that if the deterioration of the road network is allowed to continue, the
result will be serious health and road safety problems.
Today, further on down the road, we can see how the American road network has been
upgraded. According to the FHWA report Life-Cycle Cost Analysis in Pavement Design,
action is nowadays initiated on federal roads before the condition reaches a level corre-
sponding to IRI 2.7 mm/m [67 ]. In the study conducted during summer on Swedish Na-
tional Highway 90, IRI1 values close to 100 mm/m have been measured3, 37 times above
the American limit. Hw 90 is known to be much rougher during the spring thaw.
At the time of writing, an EC directive stipulating limits for exposure to whole-body vibra-
tion based on health and safety criteria is in the process of being drawn up.
3 Laser/inertial Profilometers have limitated laser measuring range (MR). On the Profilometers used in Sweden MR for vertical distance
is +/ - 100 mm. Since the distance from the laser beam to the front axle of the Profilometer vehicle is close to 1 m, profile slopes (used
when calculating IRI) will begin to be underestimated when they exceed about 100 mm / 1 m = 100 mm/m in static theory case. In
practise, Profilometer pitch and roll dynamic motion reduces this range of use further.
3(79)](https://image.slidesharecdn.com/skakstudieengelsk-13369415317251-phpapp02-120513154534-phpapp02/85/Whole-Body-Vibrations-When-Riding-on-Rough-Roads-5-320.jpg)
![Whole-body vibration when riding on rough roads
SNRA Publ. no. 2000:31E
Vibration
2
(weighted acceleration [m/s ])
on stretchers, and in the case
of the bulldozer, at the
operator’s seat. Some studies indicate that
exposure to vibrations of
1.6
2
1.30-1.35 m/s for 10
1.4 minutes a day can be
harmful even for healthy
1.2
people. The journey by
1 ambulance on the rough
stretch of highway took a
0.8
little more than 15 minutes.
0.6
Clearing forest for new road construction, bulldozer
0.4 CASE 1150 C
0.2 Mobile Intensive Care Unit Ambulance
0
Emergency Ambulance
Rough road, IRI
average = 4.0 mm/m Smooth road, IRI
average = 1.2 mm/m
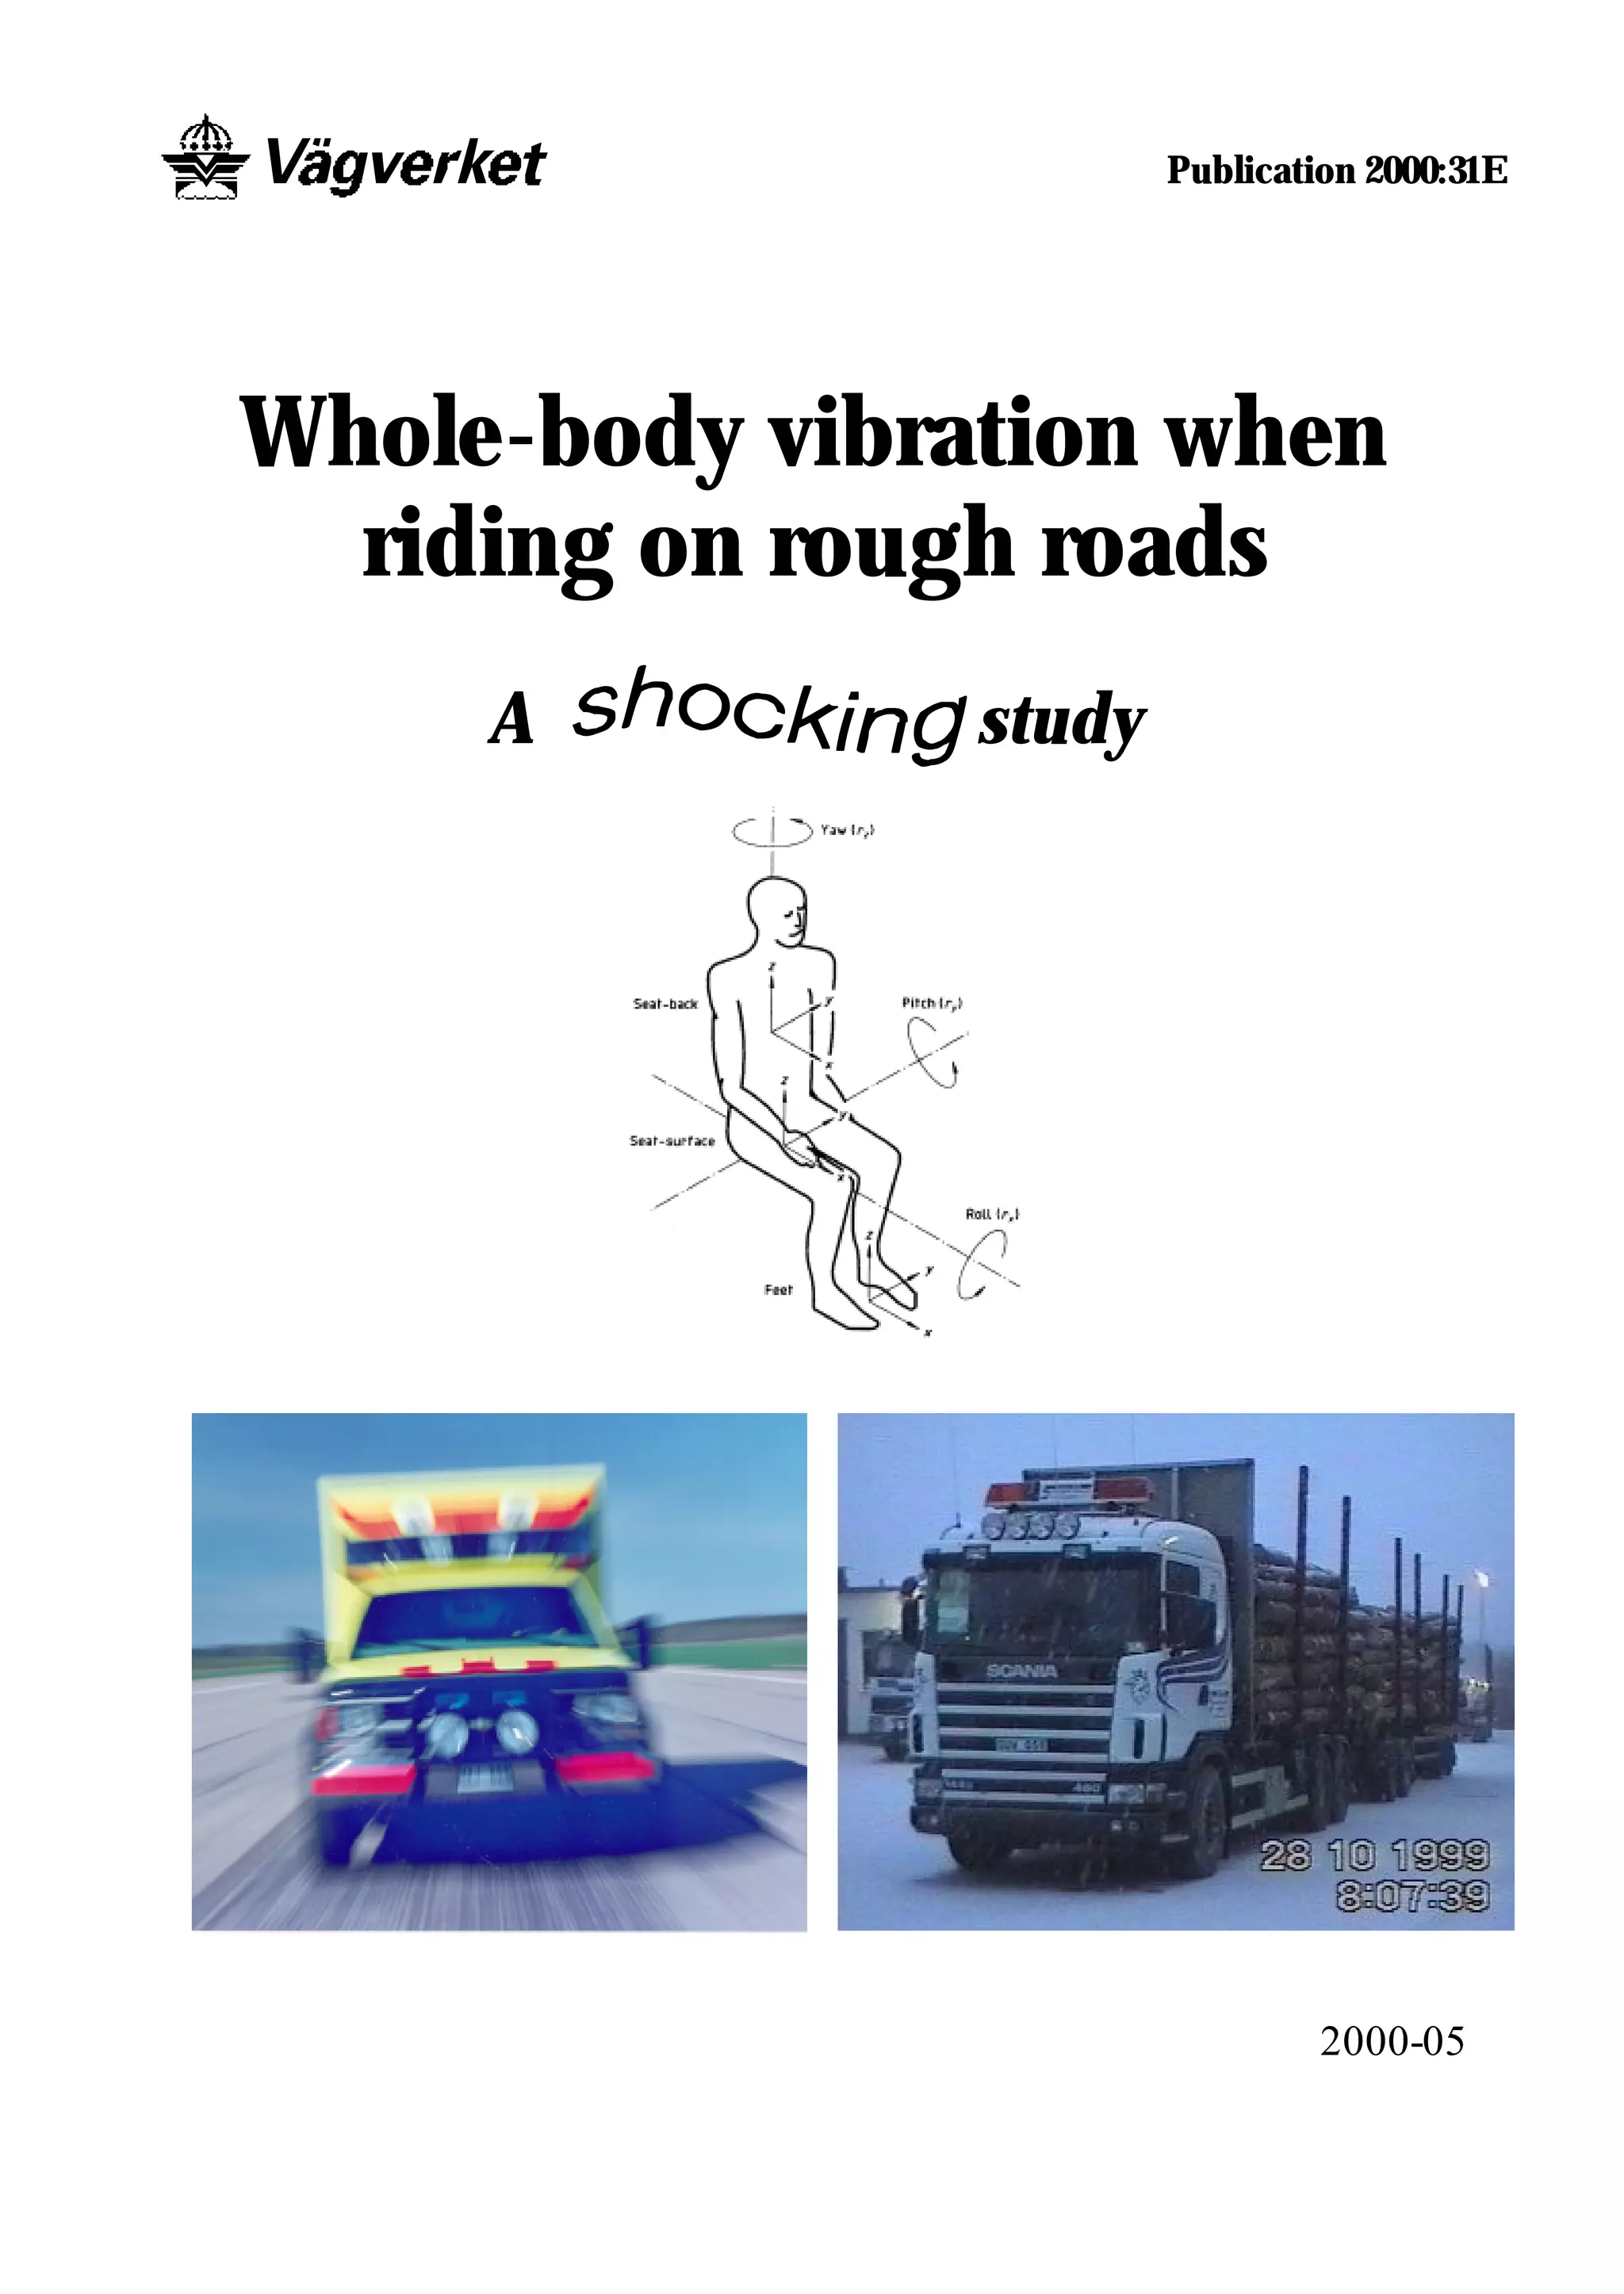
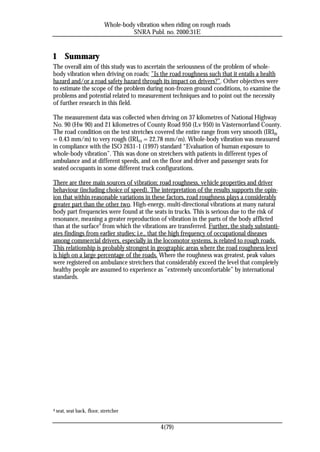
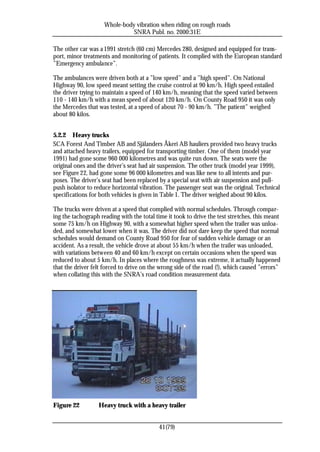
During a 15-minute ride on a stretch of National Highway 90, the vibration level in one
type of ambulance was high enough to pose a potential health ha zard had a healthy person
been exposed to it for as little as 10 minutes a day. It was shown that the vibration on the
ambulance stretchers was as great as at the drivers’ seat in wheel loaders loading blasted
rock, bulldozers clearing way in forests for new road construction, etc. See the figure
above. Vibration problems are even greater in the spring due to seasonal frost damage re-
lated a dditional roughness.
5(79)](https://image.slidesharecdn.com/skakstudieengelsk-13369415317251-phpapp02-120513154534-phpapp02/85/Whole-Body-Vibrations-When-Riding-on-Rough-Roads-7-320.jpg)
![Whole-body vibration when riding on rough roads
SNRA Publ. no. 2000:31E
2 Reader instructions
The project is presented in three separate reports:
1. The first is a technical analysis of the whole-body vibrations measured in trucks and
ambulances. This report was compiled by Kjell Ahlin, Licentiate in Engineering at In-
gemansson Technology AB [64], and may be of interest for researchers etc.
2. The second analyses the impact on the human body of the vibrations measured. This
report was compiled by Professor Ronnie Lundström at the National Institute for
Working Life [65]. A summary of the conclusions is presented in Chapter 7. The report
is available (in Swedish) at SNRA as well as NIWL websites, using the following links:
http://www.vv.se/aktuellt/pressmed/2000/VVRapport.pdf or http://umetech.niwl.se/Published/.Publ.html
3. The third is the report at hand, compiled by Johan Granlund, MSc (Civil Engineering),
of the Swedish National Road Administration. This report presents the results from
collating the data collected in the annual road condition surveys with the whole-body
vibrations measured on the test stretches. It also compares the results with the ISO
limits for whole-body vibrations, and assesses the magnitude of the problem on the
state network. This report is available on the SNRA website, using the following link
for the Swedish version http://www.vv.se/publ_blank/bokhylla/miljo/2000_31/intro.htm and this link for
the English version http://www.vv.se/for_lang/english/publications/index.htm
6(79)](https://image.slidesharecdn.com/skakstudieengelsk-13369415317251-phpapp02-120513154534-phpapp02/85/Whole-Body-Vibrations-When-Riding-on-Rough-Roads-8-320.jpg)
![Whole-body vibration when riding on rough roads
SNRA Publ. no. 2000:31E
3 Definition of terms
The definitions of the following terms are based on those in the Swedish National Enc yclopaedia [1] with its
appurtenant dictionaries [34], the Swedish Centre for Technical Terminology glossaries [9], Engineering
Mechanics [40], Handbook of Human Vibrations [11], Vägtrafikteknisk nomenklatur (Highway Engineer-
ing Terminology) [16] published by the Transport Research Institute and ASTM´s Terminology Relating to
Vehicle-Pavement Systems [20]
Accident frequency
Number of accidents at a certain intersection, stretch or unit of distance.
Differences in the accident ratio between two road networks show that one
is ”more dangerous” for an individual than the other. Differences in acci-
dent frequency between two road networks depends partially on the differ-
ence in the accident ratio, and partially on the difference in the number of
vehicles using the road networks. A simple way to reduce the accident fre-
quency on a road with heavy traffic volume is to divert certain parts of traf-
fic to other smaller roads. However, as the accident ratio is generally higher
on smaller roads, this would increase the total number of accidents. From
this perspective, the accident ratio is better than the accident frequency for
assessing how dangerous roads are. The road network in Jämtland County
(known to have low traffic volumes but poor roads) has the highest accident
ratio in Sweden.
Accident ratio
Number of accidents related to units of measure in traffic; i.e., the term vehicle kilometres
is the unit commonly used on road stretches. At junctions the unit of measure is the num-
ber of vehicles entering the intersection.
Accuracy
The ability of the measurement instrument to give results close to the true value for the
parameter measured. The greater the accuracy, the less the error.
Alignment
The design of the road profile in space.
Amplitude
Amplitude is the maximum deviation from the mean of a signal (e.g., road roughness, or
vibration), see Figure 10.
Comfort
A subjective state of well-being or absence of mechanical disturbance in relation to the
induced environment (mechanical vibration or repetitive shock).
7(79)](https://image.slidesharecdn.com/skakstudieengelsk-13369415317251-phpapp02-120513154534-phpapp02/85/Whole-Body-Vibrations-When-Riding-on-Rough-Roads-9-320.jpg)

![Whole-body vibration when riding on rough roads
SNRA Publ. no. 2000:31E
Crest factor
The ratio between the frequency-weighted peak value and the frequency-weighted root
mean square for the parameter studied. See Figure 3.
Criteria
A criterion is a verbal description of the effect, e.g. discomfort, reduced performance ability
or physical injury that is of interest. Limits (threshold values, target values, etc.) are set to
ensure an acceptably low probability of the effect that the criterion defines. In other words,
the criteria explain the reasons for the different limits.
Crossfall
The angle between the horizontal plane and the surface of the roadway, carriageway or
shoulder, measured at a right angle to the longitudinal direction of the road.
Ergonomics
Study of the relationship between people and their work environment, especially the
equipment they use. See also [52].
Estimated vibration dose value, eVDV)
An estimation of a cumulative measure of the vibrations and shocks that a person is ex-
posed to during the period under study, based on the frequency-weighted root mean square
for the vibration. See Formula 1.
If the vibration level varies or contains shock elements, the vibration dose value
must be determined directly from the complete measurement series. This is usually
the case when the crest factor exceeds 6 – 9, which makes eVDV less useful for ride
quality assessment on the rougher roads.
eVDV = 1.4 * a rms * T1/4
Formula 1 Estimated vibration dose value during exposure time T
Fracture mechanics
The science of how solid material breaks. This is often characterised by one or more cracks
spreading throughout the mass of a structure, ultimately resulting in its splitting into two or
more parts. Cracks can increase through different mechanisms, like fatigue. An increase in
fatigue occurs in structures exposed to repeated load. The increase can be very little at any
individual load. However, major cracks can form in a very short time through exposure to
vibration. The research that laid the foundation for fracture mechanics was carried out dur-
ing the Second World War. Since the 1950’s, fracture mechanics has developed into an
important element in the mechanics of materials. Most research has been conducted in the
USA and has been motivated by safety demands, primarily within the nuclear power and
aviation industries. Fracture mechanics can be used to answer the question ”how quickly
does a small crack grow through fatigue at the load spectrum to which the structure is ex-
posed?”.
Health
A condition of complete physical, psychological and social well-being, and not only the
absence of illness or disability [World Health Organisation (WHO), 1946].
9(79)](https://image.slidesharecdn.com/skakstudieengelsk-13369415317251-phpapp02-120513154534-phpapp02/85/Whole-Body-Vibrations-When-Riding-on-Rough-Roads-11-320.jpg)
![Whole-body vibration when riding on rough roads
SNRA Publ. no. 2000:31E
Horizontal curve
The curve indicating the direction of the road alignment in the horizontal plane.
International Roughness Index
The IRI value is a substitute measure for the vertical vibration that occurs in the suspen-
sion of a model (”the Golden Car”) of a quarter of a standard passenger car during a hypo-
thetical journey at the speed of 80 km/h on the road stretch studied. The value describes
the accumulated vertical displacement between the car body and the non-suspended mass
of the wheel, divided by the distance travelled. The unit of measure for the IRI is [mm/m],
which is low when the road is smooth along the wheel track5 in which the roughness pro-
file is measured. The IRI is currently the preferred unit of roughness measure used in Swe-
den and many other countries around the world that conduct objective surveys of the road
condition.
Index notation such as IRI 400, IRI 20, IRI 1 etc is used when explaining the
length of report/averaging interval, such as 400 metre, 20 metre and 1 me-
tre. Up until now, the basic report storage interval in the SNRA PMS has
been 20 metre. (As a comparison; the sampling spatial frequency used by ve-
hicle manufacturers fatigue researchers typically must be no longer than
about 1 decimetre, not to lose information about shock that causes damage).
Jerk
The first time-derivate of acceleration. Jerk is thus a measure of how fast the magnitude of
the acceleration changes.
When assessing damage potential, the relation between load and bearing ca-
pacity is studied. The “bearing capacity” of the human body depends strongly
of the state of muscular brace, comparable to the case where a small child is
learning to stand and walk. When exposed to unexpected occasional shock,
an intensive jerk may reduce the chance for the body to suddenly increase its
“bearing capacity” through instinctive brace. This implies that among differ-
ent motions with a similar peak acceleration, motions having a more inten-
sive jerk may be more serious than those with a less intensive jerk.
5 In Sweden, the IRI value is measured in the outer wheel track as seen from the centre of the road. In some countries, it is measured
from a mean profile of the outer and inner wheel tracks instead.
10(79)](https://image.slidesharecdn.com/skakstudieengelsk-13369415317251-phpapp02-120513154534-phpapp02/85/Whole-Body-Vibrations-When-Riding-on-Rough-Roads-12-320.jpg)
![Whole-body vibration when riding on rough roads
SNRA Publ. no. 2000:31E
Macrotexture
Term for those aberrations in the road surface (compared to an ideal plane) that have cha r-
acteristic wavelength and amplitude dimensions from 0.5 mm and upwards to those that
have no effect on the interaction between tyre and roadway.
Measurement error
Difference between the measurement value a nd the true value.
Measurement results
The product of the measurement value and the unit of measure. The measurement value
can have been corrected in connection with this through calibration in order to take known
systematic errors into consideration.
Measurement value
The value for the parameter compared to the unit of measure. Can be identical with the
measurement result.
Motion sickness
A physiological reaction in people induced by vibration, where the central nervous system
is incapable of co-ordinating information obtained visually, from the balance organ in the
ear and from joints and muscles. The reaction can cause drowsiness and affect perform-
ance ability. Symptoms include greater salivation, perspiration, depression, apathy, pallor,
nausea, dizziness and vomiting. Motion sickness seldom occurs in connection with vibra-
tions with a higher frequency than 0.5 Hz. When the reaction occurs in a moving vehicle, it
is usually called ”travel sickness”.
The most renowned hypothesis for a qualitative explanation for the origin of
motion sickness is called ”the sensory conflict hypothesis”[36]. A schematic dia-
gram of this hypothesis is shown in Figure 1. Several other conflict hypotheses
are discussed in Griffins ”Handbook of Human Vibrations” [11].
12(79)](https://image.slidesharecdn.com/skakstudieengelsk-13369415317251-phpapp02-120513154534-phpapp02/85/Whole-Body-Vibrations-When-Riding-on-Rough-Roads-14-320.jpg)
![Whole-body vibration when riding on rough roads
SNRA Publ. no. 2000:31E
Stimuli Receptors Central Nervous System Responses
Active Motor
control
movement Volitional
system and reflex
move-
ment
Eyes Updates internal
Internal model
model (adaption)
Semicir- neural store of
Motion cular expected signals
stimuli canals
Otoliths Leaky Neural centre Motion
and other Compa- integ- mediating signs sickness
gravi- rator & symptoms of symptom
ration
receptors motion sickness
Passive
movement Mismatch signal Threshold
Figure 1 Schematic diagram of the sensory conflict hypothesis. This figure has
been modified by Förstberg [36], originally developed by Benson (1988).
Natural frequency
The most fundamental property of an oscillating system. Natural frequency constitutes the
free oscillation frequency of a system after having been disturbed. Every real system has
several natural frequencies, and each of these has a given pattern of movement. When a
system is subjected to an external disruptive (driving) force whose frequency is equal to a
natural frequency in the system, resonance occurs and the magnitude of the vibration in-
creases. See Figure 2.
13(79)](https://image.slidesharecdn.com/skakstudieengelsk-13369415317251-phpapp02-120513154534-phpapp02/85/Whole-Body-Vibrations-When-Riding-on-Rough-Roads-15-320.jpg)
![Whole-body vibration when riding on rough roads
SNRA Publ. no. 2000:31E
Figure 2 Mechanical model of the human body specifying natural frequencies
for a few parts of the body [51]. Observe that the body lacks the female
bosom. The natural frequencies refer to vibrations in the axial direction of the body
parts (e.g. the spinal column)
14(79)](https://image.slidesharecdn.com/skakstudieengelsk-13369415317251-phpapp02-120513154534-phpapp02/85/Whole-Body-Vibrations-When-Riding-on-Rough-Roads-16-320.jpg)
![Whole-body vibration when riding on rough roads
SNRA Publ. no. 2000:31E
Root mean square, rms
The root mean square of a variable during the period studied. See Formula 2 and Figure 3.
When assessing ride quality, effects of occasional shock are often of great in-
terest. The running root mean square of the weighted acceleration (using in-
tegration time 1 s) is then often the preferred definition of vibration, since
this definition has been proven to correlate very closely with perceived an-
noyance [75]. To assess the risk of mechanical damage to the spine, the
weighted positive (compression phase) peak acceleration is the preferred defi-
nition.
t2
∫ a (t ) 2 dt
a rms =
t1
t 2 − t1
Formula 2 Root mean square for acceleration
Root sum of square, r.s.s.
A summation procedure for vectors in different directions. For the root mean
square, the square root is taken from the sum of the vectors squared root mean
squares.
Running rms
A filtering procedure that smoothens a very transient measurement series (as where occa-
sional shocks have occurred) that have a high crest factor.
Second Law of Newton
The acceleration of a particle is proportional to the force acting upon the particle and oc-
curs in the direction of that force. Normally expressed in dynamic analysis as F = m*a.
Stress
The physiological/hormonal reactions in the organs of the body that are triggered by
physical and mental ”stress factors”. Threatening or strenuous situations stimulate in-
creased secretions of adrenaline and noradrenaline. These hormones function such that
they increase the heart rate, blood pressure and circulation of blood to the skeletal muscles,
while decreasing the circulation of blood to other organs. Further, breathing is stimulated,
the trachea expand and the level of sugar and fatty acids in the blood increases. When peo-
ple are unable to control their own situation, the cortisol level also increases substantially.
Cortisol increases the amount of glucose in the blood, as well as the turnover of fats and
proteins. These and some 1400 other reactions to stress mean that the body, through all its
endeavours to adapt to the situation, is prepared to destroy itself after being subjected to an
all too extended or strenuous load.
Survey
A series of measures to determine the value of a parameter.
16(79)](https://image.slidesharecdn.com/skakstudieengelsk-13369415317251-phpapp02-120513154534-phpapp02/85/Whole-Body-Vibrations-When-Riding-on-Rough-Roads-18-320.jpg)
![Whole-body vibration when riding on rough roads
SNRA Publ. no. 2000:31E
Unit of measure
Reference value for a parameter; e.g., in the case of distance, a metre could be used as a
unit of measure.
Vibration
Oscillation in mechanical systems, where parts of the human body and human organs can
be included. (See Figure 2). This is governed by different kinds of force: mass, restoration,
calming and disruptive (driving, instigating) forces.
Vibration can be measured in terms of displacement, speed or acceleration.
The unit of measure used for acceleration is [m/s2]. Results are usually pre-
sented as peak values (mechanical spinal damage etc) or as a root-mean-square
or running root-mean-square (perceived ride quality etc). See Figure 3.
Peak value
Root mean square
Mean value
Mean value
Figure 3 Peak value, root mean square and mean value for a signal
Vibration dose value, VDV
A cumulative measure of the vibrations and shock elements to which a person was exposed
during the period under study. See Formula 3.
t2
VDV = 4 ∫ a w (t ) 4 dt
t1
Formula 3 Vibration dose value for acceleration
Wavelength
The shortest distance between two of the signal’s points with an equal phase. See Figure
10.
17(79)](https://image.slidesharecdn.com/skakstudieengelsk-13369415317251-phpapp02-120513154534-phpapp02/85/Whole-Body-Vibrations-When-Riding-on-Rough-Roads-19-320.jpg)
![Whole-body vibration when riding on rough roads
SNRA Publ. no. 2000:31E
4 Background
To most people, a roadway is merely a charcoal grey surface of infinite length. They expect
it to provide safe driving conditions, a smooth and quiet ride, minimal splash and spray
when it is raining, good visibility during poor conditions and that it will last a long time (to
avoid disturbance from road works).
A closer examination of the road reveals that it has several important characteristics, such
as surface texture. Texture is needed to provide road grip, minimise spray and mist when it
is raining, and reduce the glare from high beams at night. But the texture can cause more
noise as well as reduce the life span of both roads and tyres. As the road surface ages and is
worn down by studded tyres, heavy vehicle loads and climate, road damage begins to a p-
pear. Deformation (or road roughness), which is one type of damage, can limit both
shorten the life span of a road as well as reduce the quality of the ride. Roughness, primar-
ily longitudinal, can also be built into the road from the outset due to poor geometric de-
sign/construction.
Roughness is the source of many kinds of irritation that road users encounter; flickering
headlight reflections, deep pools of water, the dynamic forces that increase pavement stress
and damage to vehicles and cargo, and poor ride quality. Most road users are very sensitive
to ride quality, making this a prime criterion when setting road maintenance priorities [68].
Road roughness can mean reduced travel speeds. This has led many to believe that rough
roads are safer than smooth ones, since speed is generally acknowledged as dangerous.
However, after collating databases with information on accidents, road surface condition,
climate, road geometry, speed, etc at VTI (Swedish Road & Transport Research Institute),
it was concluded that ”the accident ratio increases with an increase in the roughness” and
”roughness has a major impact” [18]. A strong correlation between road roughness and the
accident ratio on the paved part of the state road network in Sweden has thus been ascer-
tained, implying that the idea of rough roads being safer is probably a serious misconcep-
tion.
However, such a statistical correlation is not clearly tantamount to the accident risk actually
being caused by roughness. For instance, it is likely that the vehicles on the roads in rural
areas, where roughness is worst, are older and less roadworthy than those found on the
smoother roads in and between the larger cities. It is therefore necessary to verify a statisti-
cal correlation through experiments that provide information about possible mechanisms
for an actual cause and effect relationship. This could include the effect of roughness
through mechanical interference on the steering and braking properties of road vehicles,
the effect on winter road maintenance and on drivers’ performance ability.
4.1 From past to present
The mechanisation of human transport on roads has taken place in a very short time. Peo-
ple were still basically travelling on the backs of animals or on foot in the 18th century,
despite the fact that the invention of the wheel 3 500 years before Christ had made the
development of animal-drawn carts possible. The reason was that roads were often almost
entirely impassable, which explains why the carts were primarily used to transport goods,
and even then only at average speeds up to about 10 km/h. This meant that travellers usu-
18(79)](https://image.slidesharecdn.com/skakstudieengelsk-13369415317251-phpapp02-120513154534-phpapp02/85/Whole-Body-Vibrations-When-Riding-on-Rough-Roads-20-320.jpg)
![Whole-body vibration when riding on rough roads
SNRA Publ. no. 2000:31E
ally experienced more discomfort from dirt than from vibrations. On the narrow streets of
Stockholm, the upper class avoided the dirt by being carried on palanquins. A tariff for this
was laid down in 1726 [58].
Through Carl Snoilsky’s classical poem on Stenbock’s courier, generations of Swedish stu-
dents have learned about how Captain Henrik Hammarberg, who was sent off by General
Magnus Stenbock from Helsingborg with a message to the king and government in Stock-
holm on February 28th 1710, rode so hard that ”a horse collapsed behind him at every
station”. Modern historians maintain, however, that the courier, who covered the journey
of 900 kilometres at an average speed of 18 km/h, probably did not ride on horseback at
all. Verification ”Folio 2282” in the 1710 treasury records (preserved in the National Ar-
chives) for Hammarberg’s travelling-expenses account clearly shows that he travelled by a
carriage drawn by a team of horses from station to station. It is believed that he suffered
from travel sickness during the journey; ”this coach is swaying so frightfully on these terri-
ble roads” [59].
The bicycle could enter the scene at the turn of this century, as a result of the soft non-
bituminous roads, which could be evened out by simple means as needed. Bicycles were
crowded further and further out to the periphery as motoring became more widespread. In
the past 130 years, mobility for people in Sweden has grown a thousand fold. See Figur 4.
Mobility trend in Sweden, 1850 - 1990
50000
45000
40000
Decade Travelled distance [m] 35000
1850 40 30000
1870 200 25000
1890 350 20000
1910 900 15000
1930 3000 10000
1960 20000 5000
1980 40000 0
1850 1870 1890 1910 1930 1950 1970 1990
Decade
Figur 4 The average daily distance travelled by vehicle by adults in Sweden
from the 1850’s to the 1990’s. Data in the tables extracted from [61], supple-
mented in the figure with data from [62].
Roads became steadily harder throughout the years, necessitating more sophisticated care
and maintenance routines. The long distances covered at the high speeds that characterise
modern road traffic, mean an exposure to vibration and shock that, in the presence of sig-
nificant road roughness, can mean people being exposed to mechanical energy that is sub-
stantially higher than at any other time in history. According to the second law of Newton,
the magnitude of this mechanical load can be estimated through measuring the acceleration
of whole-body vibration.
19(79)](https://image.slidesharecdn.com/skakstudieengelsk-13369415317251-phpapp02-120513154534-phpapp02/85/Whole-Body-Vibrations-When-Riding-on-Rough-Roads-21-320.jpg)
![Whole-body vibration when riding on rough roads
SNRA Publ. no. 2000:31E
The mental stress is more difficult to measure. At the macro level, it has been shown that
the risk for certain types of cardio-vascular disease in Sweden is more than three times
higher for commercial drivers than for the average worker. Mental stress under certain
driving conditions is considered to explain the raised level of stress hormones found in
commercial drivers, and is believed to cause the problem [69, 70].
Amongst older commercial drivers, musculo-skeletal problems and cardiovascular diseases
are the primary reasons for changing their occupation [71].
20(79)](https://image.slidesharecdn.com/skakstudieengelsk-13369415317251-phpapp02-120513154534-phpapp02/85/Whole-Body-Vibrations-When-Riding-on-Rough-Roads-22-320.jpg)
![Whole-body vibration when riding on rough roads
SNRA Publ. no. 2000:31E
4.2 Road roughness in brief
Road roughness can result from faulty basecourse adjustment (usually through insufficient
repair of crossfall variations or longwave deformations); incorrect initial construction; post-
compaction of added layers; subgrade settlement; material abrasion -- primarily by studded
tyres -- or through uneven frost heave during the spring thaw.
A general rule, based on laboratory tests, is that drained road structures can stand being
driven on by trucks six to seven times more than those without drainage before unaccept-
able deformation occurs in the unbound layers. Ditching is thus a very effective mainte-
nance measure for preventing roughness, if it is executed so that the gradient of the inner
embankment is not steeper than 1:3 (otherwise there is the risk of edge deformations due
to insufficient lateral counterstay). A drained road structure is also a prerequisite for avoid-
ing frost-related roughness in winter.
The binder stiffness affects the ability of the asphalt to distribute the load and thus the risk
of deformation in underlying layers. Temperature is a key factor for this stiffness, which
means that dark asphalt roads become rough faster than those with a light surface.
The mechanical properties of vehicles can also increase roughness. As early as in the
1930’s, a large-scale experiment showed a substantial increase in roughness on gravel roads
when the test vehicles had high-pressure tyres, while there was not even enough roughness
to measure when low-pressure tyres were used (the roadway had actually been smoothed
out). Speed and suspension were also shown to be major factors affecting roughness [56].
These conclusions could even be valid today for roads with a thin surface, like single sur-
face treatment (Y1G), which is very similar to the dust abatement measures undertaken on
the old gravel road.
8,00
7,00
6,00
5,00
IRI [mm/m]
4,00
3,00
2,00
1,00
0,00
01
01
-01
-01
-01
-01
-01
-01
-01
-01
-01
-01
1-
0-
-12
-03
-06
-09
-04
-07
-02
-05
-08
-11
-0
-1
00
00
00
00
00
00
00
00
00
00
00
00
Tid på året
Figure 5 Conceivable variation in roughness per month, on a specific road sec-
tion
21(79)](https://image.slidesharecdn.com/skakstudieengelsk-13369415317251-phpapp02-120513154534-phpapp02/85/Whole-Body-Vibrations-When-Riding-on-Rough-Roads-23-320.jpg)
![Whole-body vibration when riding on rough roads
SNRA Publ. no. 2000:31E
Road roughness varies throughout the year, which often is more noticeable than the annual
deterioration in the road condition. An estimation of what the variation might be like over
the year on a road that is not treated with salt de-icer and that is slightly frost-damaged is
shown in Figure 5. Variable weather conditions in addition to winter maintenance measures
accounts for the greater variation shown in the graph for the winter months, while the ex-
tremes in the spring are explained by the thaw. While there is a high rate of steadily increas-
ing deterioration on roads with deficient bearing capacity and/or problems related to fro-
zen ground conditions, the deterioration on well-constructed roads is minor and disappears
in time (except during the late stage when surface abrasion occurs if no preventive meas-
ures are undertaken). Roughness can be eliminated through appropriate periodic mainte-
nance. Road strengthening serves to reduce roughness immediately, while also retarding its
future speed of increase. Needless to say, this applies regardless of whether the improved
bearing capacity has meant a change in the administrative bearing capacity class of the road.
For microtexture, as well as that part of the macrotexture with wavelengths shorter than ca
25 mm, it is important that the road roughness amplitudes are neither too large nor too
small. To a certain extent, this kind of roughness produces desirable effects; like friction,
noise reduction, a certain amount of drainage, etc. Some effects are undesirable, like greater
wear and tear on tyres [2].
All roughness with wavelengths above ca 25 mm increases transport costs [2]. It is possible
to correct roughness with amplitudes under ca 15 - 30 mm and with wavelengths up to
about 10 metres simply through a new wearing course. Roughness with larger amplitudes,
or of a more longwave nature, is remedied through milling or more fill works. Frost-related
roughness normally demands highly extensive and expensive measures, such as deep drain-
age and extensive material replacement. The maintenance and repair budget (per square
metre road surface) must therefore be several times higher for roads damaged by frost than
for roads damaged by traffic.
22(79)](https://image.slidesharecdn.com/skakstudieengelsk-13369415317251-phpapp02-120513154534-phpapp02/85/Whole-Body-Vibrations-When-Riding-on-Rough-Roads-24-320.jpg)
![Whole-body vibration when riding on rough roads
SNRA Publ. no. 2000:31E
4.3 Monitoring of the road condition at the SNRA
Roads with an IRI > 5 mm/m
14%
12%
10%
Northern Region
Central Region
8%
Stockholm Region
Western Region
6% Mälardalen Region
South-Eastern Region
Skåne Region
4%
2%
0%
95 96 97 98 99
Year
Figure 6 Development of severe roughness on the paved state road network,
expressed as time series of IRI 20 > 5 mm/m per road management re-
gion. A lower percentage indicates fewer very rough stretches on the road network.
4.3.1 Road roughness measurements
The SNRA regularly measures roughness on paved state roads using high technology sur-
vey vehicles. European and National Highways are surveyed annually, and other roads at
least every third year. Up until now, the parameters that have been of greatest interest are
ruts, crossfall and roughness. The IRI value [mm/m] is the most important measure of
roughness, and is calculated from the road roughness profile measured. The IRI value can
be said to describe the vertical vibrations in the suspension of a mathematically simulated
passenger car driving at a speed of 80 km/h, and is affected primarily by roughness with
wavelengths between about 1 and 30 metres. IRI is very similar to the measures of rough-
ness used in the USA as early as the 1920’s when roughness began to be measured using
simple vehicles. These roughness measures were successfully used to stimulate competition
among civil engineers and contractors to achieve better ride quality through their being
officially published as objective comparisons of different road projects [54].
Today’s survey results are analysed and interpreted as the basis for budget discussions, set-
ting priorities, research projects, evaluating performance contracts, etc [8]. Figure 6 shows
the percentage of roads with excessive roughness (very high IRI values) in all road man-
agement regions. Signs of improvement can be seen, particularly up to 1999.
23(79)](https://image.slidesharecdn.com/skakstudieengelsk-13369415317251-phpapp02-120513154534-phpapp02/85/Whole-Body-Vibrations-When-Riding-on-Rough-Roads-25-320.jpg)
![Whole-body vibration when riding on rough roads
SNRA Publ. no. 2000:31E
However, an entirely different, negative trend was found when reviewing road users’ opin-
ions on ride quality. See Section 4.3.2. The discrepancy between the results from the road
condition and road user surveys can perhaps be attributed to the fact that people are travel-
ling more (which can increase the exposure to vibration even if the road roughness is un-
changed) and that the annual road condition surveys are only performed when there is no
ground frost, for reasons of measurement precision. Roughness on frozen roads can be
much worse than on non-frozen roads, and ground frost conditions vary substantially from
year to year. Much higher local IRI values have been measured on frost-damaged roads,
than what has been registered in the routine surveys in the summer months.
During the quality a ssurance of road condition surveys, it was observed how the vehicle
operators found it much more difficult on rough roads to follow the driving instruction
requirements. In other words, roughness has a strong adverse effect on driver performance
[private comment made by Kerstin Svartling, administrator for the SNRA’s road condition
surveys].
The significance of different types of roughness and different speeds can be studied in
Figure 7.
24(79)](https://image.slidesharecdn.com/skakstudieengelsk-13369415317251-phpapp02-120513154534-phpapp02/85/Whole-Body-Vibrations-When-Riding-on-Rough-Roads-26-320.jpg)
![Whole-body vibration when riding on rough roads
SNRA Publ. no. 2000:31E
Figure 7 Typical vertical motions at the rear axle and in the car body when driv-
ing at different speeds on different road roughness [12]
4.3.2 Road user opinion polls
The road user opinion polls conducted by the SNRA between 1995 and 1998 included 30
000 people. The questions cover new roads, care and maintenance. On the whole, the find-
ings were not too negative. The majority of the interviewees were satisfied in most respects,
with one major exception being road roughness.
The smoothest roads in Sweden are found in Skåne Region (southern Sweden). Despite
this, the percentage of commercial drivers in Skåne who are satisfied with ride quality on
the national road network is as low as 30 – 35 percent. The percentage of satisfied road
users is much lower in other parts of the country and with respect to other types of road.
25(79)](https://image.slidesharecdn.com/skakstudieengelsk-13369415317251-phpapp02-120513154534-phpapp02/85/Whole-Body-Vibrations-When-Riding-on-Rough-Roads-27-320.jpg)
![Whole-body vibration when riding on rough roads
SNRA Publ. no. 2000:31E
Dissatisfaction is greatest and growing most rapidly in the northern half of the country. For
example, it is expected that 0% (none) of the commercial truck drivers in the counties of
Västernorrland, Jämtland, Gävleborg and Dalarna (the Central Road Management Region,
being part of “northern Sweden”) will be satisfied with the ride quality on regional thor-
oughfares in the winter of 1999. See Figure 8.
SNRA Central Region
(Västernorrlands, Jämtlands, Gävleborgs och Dalarnas counties)
Marks given by commercial drivers for the ride quality on regional roads
Results 1996 Results 1997
8%
18%
82%
92%
Percentage dissatisfied
Results 1998 Percentage satisfied Prognosis 1999
0%
5%
95%
100%
Figure 8 Commercial drivers’ marks for ride quality on regional roads. Väs-
ternorrland, Jämtland, Gävleborg and Dalarna Counties [6].
At the national level, the percentage of commercial truck drivers who are satisfied with the
quality of the ride is about half that of passenger car drivers. However, even the percentage
of passenger car drivers who are satisfied in this respect is low [6][37].
Factors that are known to influence people’s sense of discomfort are shown in Figure 9.
26(79)](https://image.slidesharecdn.com/skakstudieengelsk-13369415317251-phpapp02-120513154534-phpapp02/85/Whole-Body-Vibrations-When-Riding-on-Rough-Roads-28-320.jpg)
![Whole-body vibration when riding on rough roads
SNRA Publ. no. 2000:31E
Texture Vibrations Vibration-
Roughness related discomfort
Alignment Jerky ride Vision disor-
ders
Megatexture Shock Difficulties in
Roughness handling
Noise and Sleeping disor-
Roughness Infrasound ders
Texture Visually Variance between Noisiness
Roughness
individuals
Road signs Information Speech diffi-
Road markings culties
The individual Ride quality
Rest areas Food / beverages Sweating / (sum of discomfort)
freezing
? Odours Air quality
Variance for
the individual
? Temperature Glaring
lights
? Body posture Uncomfortable
posture
? Privacy Social discom-
fort
Disruptive Other Other
road works
Figure 9 Factors associated with road management that produce discomfort in
connection with road transport. The figure has been modified on the basis of
[11]. The figure also helps us understand for example that faulty, irregular crossfall,
unsuitable texture and major road roughness cause many different kinds of discom-
fort. Road damage, along with recurrent disruptive road works, thus results in poor
ride quality.
27(79)](https://image.slidesharecdn.com/skakstudieengelsk-13369415317251-phpapp02-120513154534-phpapp02/85/Whole-Body-Vibrations-When-Riding-on-Rough-Roads-29-320.jpg)
![Whole-body vibration when riding on rough roads
SNRA Publ. no. 2000:31E
4.4 Analysis of road roughness
The deviation of the road surface from a horizontal plane can be described by the wave-
lengths and amplitudes of the roughness, see Figure 10. The very shortest roughness wave-
lengths are classed as microtexture, which is determined by the properties of the aggregate
and binder in the surface. Somewhat longer wavelengths are classed as macrotexture,
which is determined by such things as the shape of the aggregate and the particle size dis-
tribution. Longwave deviations are quite simply designated as roughness [2], often caused
by more or less extensive settlement, frost heave or ice lenses in or under the road struc-
ture in the winter.
λ A
λ/2
A
Figure 10 Wavelength (λ) and amplitude (A). Above at corrugation, below at a
pothole.
The basic relationship between travel speed (velocity) v [m/s], wavelength λ [m] and verti-
cal vibration frequency f [s-1] is shown in Formula 5. Depending on the travel speed and
type of vehicle, vehicle properties are a key factor where the wavelengths are up to 25 - 50
m. Where the wavelengths are longer (or more to the point, at lower frequencies) the
dampening property of the vehicle is insignificant [11]. The equation should therefore pro-
vide a reasonable estimation of the vibration frequencies where the roughness is of longer
wavelength. Vibrations with a frequency of 0.1 Hz are caused by roughness (unevenness)
with wavelengths of about 85 m at a travel speed of 30 km/h (8.3 m/s) and wavelengths of
about 360 m at 130 km/h (36.1 m/s). A vibration frequency of 0.5 Hz is caused by rough-
ness with wavelengths of some 15 - 20 m at a speed of 30 km/h and 70 m at 130 km/h.
λ = v/f
Formula 5 The basic relationship between roughness wavelength, travel speed
and vertical vibration frequency (one wheel, no suspension).
28(79)](https://image.slidesharecdn.com/skakstudieengelsk-13369415317251-phpapp02-120513154534-phpapp02/85/Whole-Body-Vibrations-When-Riding-on-Rough-Roads-30-320.jpg)
![Whole-body vibration when riding on rough roads
SNRA Publ. no. 2000:31E
4.5 Transmission of vibrations through the vehicle
The magnitude of the vibration transmitted to vehicle occupants through the vehicle de-
pends on the road roughness and the speed of travel, as shown clearly in Figure 7. This is
accentuated by the mechanical properties of the vehicle. For instance, those riding in
higher vehicles are exposed to a greater amount of pitch and roll than those in low vehicles
[13].
Two-axle cars, are said to have three natural frequencies for vertical vibrations: one that is
related to the car body bouncing on its suspension, one that is connected to the wheel axle
hop between the body suspension and the tyre suspension, and one that originates from
the rocking of the car seat. The car body has a natural frequency of about 1 Hz, and vibra-
tions close to this frequency are amplified by a factor of 1.5 – 3.0. The wheel axles of a car
have a natural frequency of 10 – 15 Hz, which means that at this frequency they tend to
vibrate more than what the car body and tyres together with the road surface would di-
rectly cause [13][14].
Formula 5 indicates that a vibration frequency of 1 Hz when travelling at 90 km/h is
caused by roughness with wavelengths of about 25 metres. Vibration frequencies of 10 –
15 Hz at 90 km/h seem to be caused by roughness with wavelengths of about 2 - 3 metres.
Multi-axle vehicles that are both heavy and long may have considerably different mechani-
cal behaviour than normal cars, particularly if they are towing heavy trailers. Moreover, the
properties of heavy vehicles are changed substantially by the actual weight of the payload.
Some types of heavy-duty vehicles lack suspension altogether.
The natural frequency of the roll of heavy vehicles is less than 3 Hz. Since roll motions at
frequencies under 5 Hz are not common when driving on roads with ”normal”(?) rough-
ness and at normal speeds, it is not usually considered to be of any greater significance.
[55]. This item will be under further discussion later in the report.
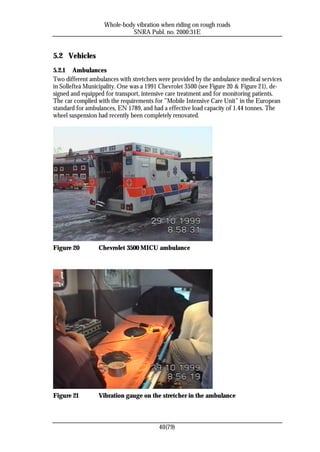
The current European trend towards fewer and more specialised hospitals is resulting in a
greater percentage6 of ambulance transports having to cover longer distances while simul-
taneously administering intensive care. To manage this, more -- and heavier -- medical
equipment is required on board. Ambulances must then have a greater load capacity than
before, which means that large vehicles (”container ambulances”) designed similarly to
trucks are needed. See Figure 11. An effective load capacity of more than a tonne is not
unusual.
In many cases it has been shown how even slight road roughness can, through vibration
and dynamic weight transfer, cause the wheel load to temporarily exceed twice the static
load and then revert just as suddenly to 0 (zero!) during the ride. See Figure 12. A feeling
for how dynamic loads can originate can be created by bouncing a little on the bathroom
scales. That the road grip varies between the wheels – and moreover is occasionally non-
existent – involves a major risk of skidding when hitting the brakes in an emergency. [3].
Dynamic loads have been proven to be a large problem when weighing vehicles in motion,
even on very smooth road stretches [48].
6Today, there already are some 850 000 ambulance transports per year in Sweden. Of these, about 200 000
are emergencies [29, 17].
29(79)](https://image.slidesharecdn.com/skakstudieengelsk-13369415317251-phpapp02-120513154534-phpapp02/85/Whole-Body-Vibrations-When-Riding-on-Rough-Roads-31-320.jpg)
![Whole-body vibration when riding on rough roads
SNRA Publ. no. 2000:31E
Figure 11 Well-equipped “Mobile Intensive Care Unit” type of ambulance. The
effective load capacity of the vehicle in the picture is 1.44 tonnes. Notice the heavy-
duty wheels, which are even mounted in pairs at the rear.
Wheel load
Wheel axle hop
Road roughness profile
Figure 12 Dynamic change in the wheel load when driving on a rough road [57].
The static wheel load is designated as ”p” in the figure. As seen here, the actual
wheel load -- which determines the road grip and thereby the risk of skidding when
braking -- varies between 0 (zero!) and twice the static load as roughness in the road
profile causes vibrations and weight transfer in the vehicle.
30(79)](https://image.slidesharecdn.com/skakstudieengelsk-13369415317251-phpapp02-120513154534-phpapp02/85/Whole-Body-Vibrations-When-Riding-on-Rough-Roads-32-320.jpg)
![Whole-body vibration when riding on rough roads
SNRA Publ. no. 2000:31E
4.6 Whole-body vibration
Describing the consequences of shaking the whole human body -- a complex, active, intel-
ligent structure -- is not a completely simple matter. The National Board of Occupational
Safety and Health has compiled the known effects of humans being over-exposed to
whole-body vibration. A few of the conclusions were: ”It can be assumed without a doubt
that the human being is negatively affected by whole-body vibration, from both a subjec-
tive and objective perspective” and ”It would obviously be desirable from everyone’s point
of view if vibrations could be totally eliminated” [51].
Needless to say, there are also vibrations that are positive. For instance, vibrations that
inform drivers about the movement of their vehicle, [11, 66], that they are driving over a
zebra crossing or that the right front wheel ha s a puncture. For safety reasons, such vibra-
tions -- ”a sense of the road” -- should not be dampened.
Like auditory stimuli, sensory impulses impart strong impressions. These should therefore
be used sparingly, since they partially block or suppress other sources of information. [57].
For instance, unlike operators of forestry machinery working out in the woods, those driv-
ing on public roads find it completely reasonable to expect the underlying surface to be
smooth enough that any vibration generated would be insignificant. In an upcoming EC
directive for limiting exposure to whole-body vibration, it is stipulated that ”the risks aris-
ing from exposure to mechanical vibration shall be eliminated at source or reduced to a
minimum [with the aim of reducing exposure to below the threshold level].”
The survey conducted by the National Board of Occupational Safety and Health on the
effects of overexposure to whole-body vibration showed that although this primarily causes
fatigue, it also gives rise to visual acuity disorders, motion sickness, dizziness,
back/abdomen/face pain, headaches and a frequent need to urinate [51].
That very extreme acceleration causes bodily injury is a factor that has set limits on the
manoeuvrability of manned fighter aircraft. Based on fracture mechanics, it is not unlikely
that even the substantially less intensive forces (but at higher frequencies) that cause more
”normal” whole-body vibrations can cause physical injury in connection with long-term
exposure.
When being subjected to vibration, human body reflexes try to protect organs that are sen-
sitive to resonance through a tightening of the muscles (this is only successful for very
short periods - seconds) [38]. Lengthy exposure to vibration therefore often results in high
muscular tonicity [15], which is dangerous to health on many accounts.
A governmental working committee on public health has estimated that the cost to society
for back problems, which is the primary reason for people reporting in sick and for early
disability retirement in Sweden, exceeds SEK 20 billion per year (1991). In its report, the
committee also ascertained that whole-body vibrations are of ”key importance” as a source
of back problems [53]. However, in the general health statistics, the concept of whole-body
vibration is lacking. ”Vibration injuries” primarily refers to hand/arm vibrations [33]. In
England a direct relationship has been found between the frequency of back problems and
the distance travelled per year [60].
31(79)](https://image.slidesharecdn.com/skakstudieengelsk-13369415317251-phpapp02-120513154534-phpapp02/85/Whole-Body-Vibrations-When-Riding-on-Rough-Roads-33-320.jpg)
![Whole-body vibration when riding on rough roads
SNRA Publ. no. 2000:31E
The findings of a recent review of epidemiologic studies conducted between 1986 and 1997
on the relationship between exposure to vibration and problems in the lumbar part of the
back provided ”clear evidence for an increased risk for LBP disorders in occupations with
exposure to WBV. Biodynamic and physiological experiments have shown that seated
WBV exposure can affect the spine by mechanical overloading and excessive muscular
fatigue, supporting the epidemiologic findings of a possible causal role of WBV in the de-
velopment of (low) back troubles”. The review also mentions that it is estimated that 4-7%
of the working population in the EU is exposed to potentially harmful whole-body vibra-
tion [74].
Surveys have shown that truck drivers are exposed to considerably greater vibrations than
most other categories of road user. The exposure often exceeds the recommendations and
limits in the International Vibration Standards [10, 7], as well as the limits proposed by the
EU.
Sensitivity to vibration differs substantially between men and women. Women (and the
foetus) are particularly sensitive during pregnancy [30].
Those who are most sensitive to vibration are injured, sick or disabled people who often
require ambulance transportation. The National Swedish Institute for Working Life has
compared the noise and vibration properties in traditional ambulances and the increasingly
more common larger MICU container ambulances. A major difference was found. The rms
for vertical vibration (0,5 – 80 Hz) at the driver’s seat in a large ambulance amounted to as
much as 1.44 m/s2. Interpretations of the findings indicate that levels above 0.5 m/s2 entail
an excessive risk for any normally healthy person sitting behind the wheel 6 hours a day.
The surveys also showed that the vibrations in an infant incubator on board are often even
greater than at the driver’s seat. On one occasion, the rms for the vertical vibration in the
incubator was ranked as a 5 (very uncomfortable) on a six-grade scale of discomfort in the
ISO 2631-1 “Evaluation of human exposure to whole-body vibration” standard. [17, 29].
According to ambulance orderlies, acute motion sickness is a common problem for staff
and patients alike.
More can be learned about the effects of whole-body vibration in the report by Prof.
Ronnie Lundström [65]. Additional information – including the effect of such loads as low
frequency noise and infrasound – can be found in other reference literature compiled in
Chapter 8 as well as from such sources as the National Board of Occupational Safety and
Health, the National Swedish Institute for Working Life’s Vibration Committee [31], Upp-
sala Academic Hospital [15] and the Swedish Road and Transport Research Institute.
4.6.1 Natural frequencies and resonance in the human body
All material bodies have a natural frequency, which to some extent can be compared to the
natural frequency of a swinging pendulum. When a body is exposed to a frequency vibra-
tion that coincides with its own natural frequency, it will vibrate strongly.
The various parts and organs of the human body have different natural frequencies. This
means that the body does not vibrate uniformly, but rather that the different parts behave
like individual, albeit interlinked, material bodies in this respect. (See Figure 2). External
vibrations with frequencies of about 6 Hz are amplified through resonance in the abdomen
by up to 200%. Certain vibrations are amplified in the spine by up to 240%. The head has a
32(79)](https://image.slidesharecdn.com/skakstudieengelsk-13369415317251-phpapp02-120513154534-phpapp02/85/Whole-Body-Vibrations-When-Riding-on-Rough-Roads-34-320.jpg)
![Whole-body vibration when riding on rough roads
SNRA Publ. no. 2000:31E
natural frequency of about 25 Hz, which means that vibrations with frequencies around
this are amplified by up to 350% [41][42]. The resonance phenomenon leads to a greater
load on the body and thereby a greater risk of injury.
4.6.2 Examples of the effect of whole-body vibration in the 0.5-80 Hz range
Shortwave road roughness produces vibrations with a frequency content that among other
things includes the 0.5 - 80 Hz band.
According to the ISO 2631-1 standard, vibrations with frequencies between 0.5 - 80 Hz
could probably cause a greater risk of injury to the vertebrae in the lumbar region and the
nerves connected to these segments. Exaggerated mechanical strain can be a factor in the
deterioration of the lumbar segments. Vibrations are reported as affecting the body
through causing deformation of the spine (spondylosis deformans), damaging the cartilage
between the vertebrae (osteochondrosis intervertebralis), and by producing chronic pro-
gressive change in the cartilage and bone tissue (arthrosis deformans). Exposure to whole-
body vibration can also exacerbate certain endogenous pathological disorders of the spine.
It is not considered unlikely that the digestive system, the urinary and sexual organs and the
female reproductive organs are affected. Health impairment caused by whole-body vibra-
tion normally only occurs after several years of exposure [10]. Spontaneous abortion is an
exception.
4.6.3 Examples of the effect of extremely low frequency whole-body vibrations
Longwave road roughness produces low frequency vibrations. Vibrations with greater am-
plitudes within the 0.1 – 0.63 Hz frequency band have a particularly strong effect on peo-
ple.
According to the ISO 2631-3 standard, these vibrations cause various degrees of motion
sickness, ”travel sickness”, even after only short exposure. Motion sickness can affect peo-
ple for hours, and even up to days after an arduous trip. It has been observed that motion
sickness lowers performance ability and reduces alertness.
A survey conducted amongst 300 students revealed that about 58% had felt nauseous dur-
ing car rides. Some 33% could remember actually having vomited during car trips before
the age of 12 [11].
A nationwide questionnaire revealed that motion sickness is a frequent working environ-
ment problem amongst ambulance orderlies. 23% replied that they easily felt nauseous
during the ride. [27]. Orderlies in Sollefteå Municipality reported having observed palpable
travel sickness symptoms in patients (in the worst case vomiting, uncontrollable bowel
movements, etc) in 20-25% of the most acute (high speed) transport situations. In the care
unit of the vehicle, it is impossible to watch the horizon.
Vehicle manufacturers are aware that the suspension properties affect the risk of passen-
gers developing motion sickness. A sports car type of suspension is recommended for
people who easily get car sick. It cannot be ruled out that ”comfort suspension” -- by
American standards -- can mean that the high frequency vibrations caused by road surface
damage are converted to an exceptionally high degree into that very type of low frequency
vertical vibration that is known to cause motion sickness. It is also known that rotation
vibrations are a factor in motion sickness. Perhaps even the differences in roll-stability be-
33(79)](https://image.slidesharecdn.com/skakstudieengelsk-13369415317251-phpapp02-120513154534-phpapp02/85/Whole-Body-Vibrations-When-Riding-on-Rough-Roads-35-320.jpg)
![Whole-body vibration when riding on rough roads
SNRA Publ. no. 2000:31E
tween different vehicles has a major impact? Added to the ”motion sickness vibrations”
created by the ride are the low frequency vibrations that ensue from the billowing align-
ment that roads originally built for horse drawn carriages often have.
4.6.4 Origin of whole-body vibration
According to the Academy of Engineering Sciences (IVA) road roughness is a much
greater cause of vibration in road vehicles than in-vehicle factors (wheel imbalance, drive-
line, etc.). IVA has also ascertained that vibrations have a major impact on the steering and
braking properties of the vehicle, and on the working environment, ride quality, health and
possibly even performance ability of vehicle occupants [19].
Whole-body vibrations originate from two different types of force. A random and sudden
force designated as shock. When the wheel hits a bump or sinks into a pothole, shock oc-
curs. If this shock is strong enough, passengers without a safety belt can be thrown from
their seat. They could also be hit by a loose-flying object. Shock can also cause severe spi-
nal injury [32], such as in several Scandinavian cases due to riding in buses over traffic
calming road humps. Less sudden displacements and forces occur during a normal ride on
more or less rough roads. See Figure 13 - Figure 15. These are the most common motion
induced forces that we experience during a normal day [42]. The second law of Newton
can be used to calculate the dynamic forces that vibrations transfer to human organs.
Certain types of vibration are known to cause car sickness. These include extremely low
frequency vertical vibrations (0.1 – 0.63 Hz) and roll (often in combination with lateral
displacement). The low frequency vertical vibrations are caused by exceedingly longwave
roughness (up to 350 m), but can also occur when a vehicle with worn or poorly designed
wheel suspension transforms high frequency vibrations to low frequencies. Roll occurs
when there is an unfavourable variation in the gradient between the wheel tracks (crossfall);
this often is caused by roadway deformations and all too sharp curves in the alignment.
The limits for whole-body vibration in the ISO 2631-3 Standard can be converted into
standard specifications for the road roughness profile. See Figure 16. On roads where there
is substantial roll (caused for example by sharp curves or deformed edges) the acceptable
longwave road roughness must be reduced by 25%.
Major vertical
motion
Figure 13 Origin of vertical vibrations on roads where the roughness wavelength
coincides with the distance between the vehicle axles. Adapted from [66]
34(79)](https://image.slidesharecdn.com/skakstudieengelsk-13369415317251-phpapp02-120513154534-phpapp02/85/Whole-Body-Vibrations-When-Riding-on-Rough-Roads-36-320.jpg)
![Whole-body vibration when riding on rough roads
SNRA Publ. no. 2000:31E
Major pitch and thus
major longitudinal
vibration
Little vertical
movement
Figure 14 Vibrations in the direction of travel occur when the wavelength of
the road roughness does not coincide with the distance between the vehicle axles.
Adapted from [66].
Major roll and thus
substantial lateral vibration
Figure 15 Origin of lateral vibrations on a road with deformed edges
35(79)](https://image.slidesharecdn.com/skakstudieengelsk-13369415317251-phpapp02-120513154534-phpapp02/85/Whole-Body-Vibrations-When-Riding-on-Rough-Roads-37-320.jpg)
![Whole-body vibration when riding on rough roads
SNRA Publ. no. 2000:31E
2.00
1.80
1.60
1.40
1.20
1.00
0.80
0.60
0.40
0.20
0.00
153 122 95 76 61 49 38 31 24
Length of the hollow or ridge
(i.e., half the roughness wavelength), [m]
Figure 16 Limits for longwave roughness at a speed of 110 km/h, set with respect
to the criterion for decreased performance ability. The values are derived
from the vibration limits in the ISO 2631-3 standard. The corresponding limits with
respect to the discomfort criterion are considerably stricter. The limits assume no
surface defects at all (aggregate stripping, potholes, etc) or damage that cause rota-
tion vibration (unevenness at culverts, edge deformation, etc).
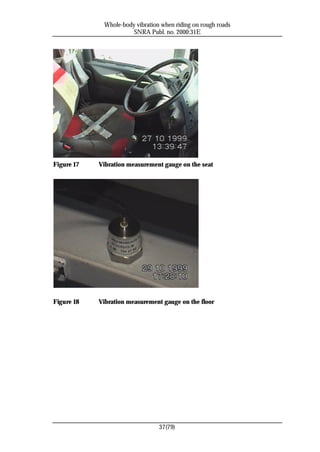
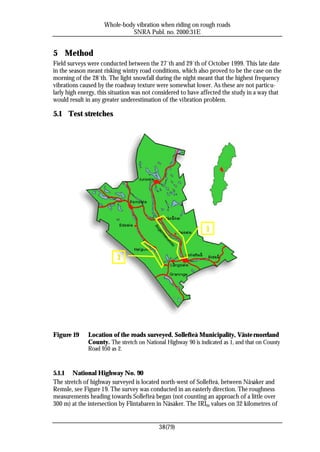
4.6.5 Measurement of whole-body vibration
The measurement of whole-body vibration must comply with ISO 2631 “Evaluation of
human exposure to whole-body vibration” (1997). The equipment consists of acceleration
sensors, arranged as shown in Figure 17 and Figure 18.
The reaction time for the sense of motion has been found to be 0.24 – 0.80 s, with a mean
value of 0.72 seconds [57]. This is one of the reasons why comfort-related measurements
are normally done through integration over 1-second intervals. A vehicle travels 20 m in a
second, at the speed of 72 km/h. This means that vibration data measured in compliance
with ISO 2631 at rural highway speeds on sub-stretches are fairly comparable in length to
road roughness data in the SNRA road surface condition database, which after sampling at
the mm-level was ultimately averaged over 20 m intervals.
36(79)](https://image.slidesharecdn.com/skakstudieengelsk-13369415317251-phpapp02-120513154534-phpapp02/85/Whole-Body-Vibrations-When-Riding-on-Rough-Roads-38-320.jpg)
![Whole-body vibration when riding on rough roads
SNRA Publ. no. 2000:31E
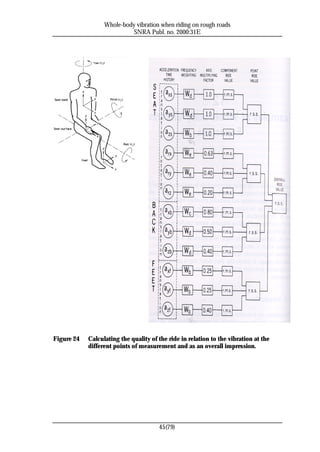
5.3 Measurement and analysis of whole-body vibrations
The measurements and analysis were conducted by Kjell Ahlin, Licentiate in Engineering
of Ingemansson Technology AB and are detailed in a report [64]. The analysis in principle
is shown in Figure 23 and Figure 24.
5.3.1 Variables
• Vertical and horizontal whole-body vibration, and both roll and yaw rotations ob-
tained through synchronised measurement on the floor and at the driver and pas-
senger seats. Frequency range 0.5 - 80 Hz in compliance with ISO 2631-1 (revised
1997).
• Vertical measurements at a frequency range of 0.1 - 0.63 Hz in compliance with
ISO 2631-3 (1985).
The plans contained two methods (redundancy) for registering real travel speed and current
position along the road to enable collation with existing road surface condition data. One
involved a mounted measuring wheel with a pulse transducer, and the other GPS. Ar-
rangements had been made to borrow the measuring wheel from the Swedish Armed
Forces. Unfortunately, it arrived too late and could not be used. The GPS receiver broke
due to severe shocks during the first run. A video film was taped simultaneously. This film,
with its time indicator, was later used as an aid during the data collation.
Figure 23 Flow chart for measurement and analysis of whole-body vibrations
44(79)](https://image.slidesharecdn.com/skakstudieengelsk-13369415317251-phpapp02-120513154534-phpapp02/85/Whole-Body-Vibrations-When-Riding-on-Rough-Roads-46-320.jpg)
![Whole-body vibration when riding on rough roads
SNRA Publ. no. 2000:31E
5.4 Expert analysis of the effect of vibration on the human body
An expert analysis of the effect on the human body of the vibrations measured was con-
ducted at the National Institute for Working Life. The findings are presented in a separate
report [65]. See also chapter 7.
5.5 Collation between the vibration data and the data from the road
condition surveys
The aim was to develop a correlation model for the translation vibrations as a function of
IRI, based on values measured on National Highway 90.
Since the real speed varied somewhat during the runs, the analysis was initiated by dis-
criminating individual measurement values (both IRI values and vibration values) to keep
the distance synchronisation of the measurement series from ”getting out of hand”. The
analysis was then based on the mean values on 100 m long stretches. After having studied
descriptive statistics for data in a computer environment (histogram, distribution, etc.), it
was found suitable to classify the material according to IRI100 values. Classes 0 < IRI100 < 3
mm/m, 3 < IRI100 < 5 mm/m, and IRI100 > 5 mm/m were chosen for the Mercedes ambu-
lance driving at low speed. In all the other cases, classes 0 < IRI100 < 3 mm/m and IRI100 >
3 mm/m were chosen. This was followed by a regression analysis, whereby a linear regres-
sion model was found to give the best results. The results are presented in Chapter 6.
5.5.1 Effect of emergency action, ”the devil’s choice”, on National Highway 90
The road condition data that was collated with the vibration data was collected during the
summer of 1999. In the autumn of 1999 spot emergency actions was taken to reduce
roughness on the stretch at hand. See Figure 25. This meant correcting steep deformations
(amplitude ca 50 – 300 mm) with crushed gravel, which was then provisionally covered
with a bitumen mix.
46(79)](https://image.slidesharecdn.com/skakstudieengelsk-13369415317251-phpapp02-120513154534-phpapp02/85/Whole-Body-Vibrations-When-Riding-on-Rough-Roads-48-320.jpg)
![Whole-body vibration when riding on rough roads
SNRA Publ. no. 2000:31E
Figure 25 Emergency repair on National Highway 90 between Skarped and
Näsåker
Vehicular roll motions drastically reduces where spot actions had been taken, particularly
when the repair was close to the edge of the road. This also facilitates effective road main-
tenance during the winter ahead, of course very positive with a view to road safety. How-
ever, spot repair often means a heterogeneous road texture, which leads to split friction
between the wheels, especially when the moisture on the road begins to freeze. In connec-
tion with moisture/freezing, even colour differences are a significant factor, as this affects
the absorption of solar heat.
Split friction considerably increases the risk of skidding. For cars, there is a greater risk of
skidding when braking sharply on bare roads than on winter roads. This is due to fact that
the load on the rear axle is lightened through vehicle pitch in the first case, reducing the
road grip of the rear wheels. On the other hand, steering control is lost faster on winter
road surfaces than on bare roads. It becomes difficult to avoid rear wheel skid in situations
where the rear wheels have less road grip than the front wheels when braking [3].
Hence, split friction means a much greater risk of skidding when having to brake sharply,
or it can cause the ”jack-knife” phenomenon for a truck with a semi-trailer, making it im-
possible for the driver to maintain control of the vehicle. For this reason, spot repairs
should be done so that the texture is the same as on the surrounding surface. It is advisable
that the repair cover the entire lane width. There is always somewhat of a height discrep-
ancy on the road surface at all temporary patching. This can significantly reduce the dy-
namic contact between the tyres and the roadway, which is an obvious safety hazard.
Action similar to that shown in Figure 25 can be described as the ”devil’s choice”, the least
bad alternative where maintenance budgets are all too constricted.
47(79)](https://image.slidesharecdn.com/skakstudieengelsk-13369415317251-phpapp02-120513154534-phpapp02/85/Whole-Body-Vibrations-When-Riding-on-Rough-Roads-49-320.jpg)

![Whole-body vibration when riding on rough roads
SNRA Publ. no. 2000:31E
6 Results
When first driving in a large, comfortable 1999 car model on the ”rough” test stretch of
Highway 90, those taking part in the vibration survey wondered why the Swedish National
Road Administration had not chosen a road in poorer condition. During the subsequent
runs inside the trucks, the same people commented that ”this is not much different than
driving through the forest in an army tank”.
During the survey, they occasionally found it hard to speak because of the vibrations.
While riding in the care unit of the ambulance, members of both the survey team and the
”patient” experienced clear signs of motion sickness -- perspiration, pallor, nausea and diz-
ziness -- when there was little opportunity to keep their eyes on the horizon. Before start-
ing, and at the end of each run, they had to get out of the ambulance for some fresh air.
They also found eating difficult on their lunch break.
Both road authority employees and the survey team had back pain for about ten days after
the intensive round of test driving.
A full account of the measurements and analysis results is contained in a separate report
[64].
The expert analysis of the impact of the vibrations on the human body, conducted at the
National Institute for Working Life, is presented in a separate report [65]. A summary of
the conclusions is compiled here in Chapter 7.
The following are extracts from the SNRA’s current data on the road surface condition and
the results from collating this data with the vibrations measured inside vehicles.
49(79)](https://image.slidesharecdn.com/skakstudieengelsk-13369415317251-phpapp02-120513154534-phpapp02/85/Whole-Body-Vibrations-When-Riding-on-Rough-Roads-51-320.jpg)
![Whole-body vibration when riding on rough roads
SNRA Publ. no. 2000:31E
6.1 Road surface condition as per the SNRA’s ”PMS” database
6.1.1 Roughness expressed as International Roughness Index
Rv 90: Fördelning av mätsträckornas ojämnheter (IRI-värde)
60
50
Jämn: Skarped - Remsle
Ojämn: Näsåker - Skarped
40
Antal observationer
30
20
10
0
0 1 2 3 4 5 6 7 8 9 10 11 12 13 14 15
IRI-värde [mm/m]
Figure 26 National Highway 90: IRI20 distribution. Values from the smooth
stretch in blue, values from the rough stretch in pink.
Mätsträckor på Rv 90
Sträckornas ojämnhet uttryckt i måttet IRI [mm/m]
8,00
7,00
6,00
5,00
Medelvärde IRI
Stdavv IRI
4,00 5 percentil IRI
95 percentil IRI
3,00
2,00
1,00
0,00
Jämn: Skarped - Remsle Ojämn: Näsåker - Skarped
Figure 27 National Highway 90: statistical properties of the distribution of the
IRI20 values. Smooth stretch to the left, rough to the right.
50(79)](https://image.slidesharecdn.com/skakstudieengelsk-13369415317251-phpapp02-120513154534-phpapp02/85/Whole-Body-Vibrations-When-Riding-on-Rough-Roads-52-320.jpg)
![Whole-body vibration when riding on rough roads
SNRA Publ. no. 2000:31E
Rv 90, jämn del
15
10
Ojämnhet IRI
5
0
67000 67397 67797 68197 68597 68997 69397 69797 70197 70597 70997 71397
Sektion
Figure 28 IRI20 values, extract from the smooth stretch of National Highway 90.
Even here there are a couple of substretches that clearly have a sharp effect on vehi-
cle motion and ride quality.
Rv 90, ojämn del
15
10
Ojämnhet IRI [mm/m]
5
0
92003 92403 92803 93203 93763 94163 94563 94963 95363 95763 96163 96563 96963
Sektion [m]
Figure 29 IRI20 values, extract from the rough stretch of National Highway 90.
Where the IRI values are as high as they are here, one must drive extremely slowly to
avoid uncomfortable vibrations. However, commercial drivers especially must keep
to a time schedule, which often dictates the speed, and the only variable is the cab
vibration.
51(79)](https://image.slidesharecdn.com/skakstudieengelsk-13369415317251-phpapp02-120513154534-phpapp02/85/Whole-Body-Vibrations-When-Riding-on-Rough-Roads-53-320.jpg)
![Whole-body vibration when riding on rough roads
SNRA Publ. no. 2000:31E
6.1.2 Crossfall
Rv 90
10
8
6
4
2
Tvärfall
0
0
7
7
7
7
7
7
7
7
7
7
7
7
7
7
7
7
7
7
7
7
7
7
7
7
7
7
7
7
7
7
7
7
7
00
41
69
83
11
13
27
55
97
25
39
53
67
81
95
09
23
37
51
65
79
93
07
21
35
49
63
77
91
05
19
33
47
61
67
67
67
67
68
67
67
67
67
68
68
68
68
68
68
69
69
69
69
69
69
69
70
70
70
70
70
70
70
71
71
71
71
71
-2
-4
-6
-8
-10
Sektion
Figure 30 Crossfall, extract from the smooth stretch of National Highway 90. The
red lines show maximum permissible crossfall [%] in curves when constructing a
new road (target value, excluding tolerance margins).
Rv 90
10
8
6
4
2
Tvärfall
0
82791 83191 83591 83991 84391 84791 85191 85591 85991 86391 86791 87191 87591
-2
-4
-6
-8
-10
Sektion
Figure 31 Crossfall, extract from the rough stretch of National Highway 90. The
red lines show maximum permissible crossfall [%] in curves when constructing a
new road. Notice the substantial, abrupt changes in the crossfall, which causes ma-
jor roll motions when driving at a normal travel speed.
52(79)](https://image.slidesharecdn.com/skakstudieengelsk-13369415317251-phpapp02-120513154534-phpapp02/85/Whole-Body-Vibrations-When-Riding-on-Rough-Roads-54-320.jpg)
![Whole-body vibration when riding on rough roads
SNRA Publ. no. 2000:31E
6.1.3 Lane cross-sections
Rv 90: tvärsektion bildad över 20 m i östgående körfält
Delsträcka med jämn vägbana
och där låga vibrationsnivåer uppmätts
35
25
15
5
Nivå [mm]
0 500 1000 1500 2000 2500 3000
-5
-15
-25
-35
Sidoläge (mm)
Figure 32 Lane cross-section, smooth stretch of National Highway 90. Exaggerated
vertical scale.
Rv 90: tvärsektioner bildade över 20 m i östgående körfält
Delsträcka med ojämn vägbana
och där mycket höga vibrationsnivåer uppmätts
35
25
15
5
Nivå [mm]
0 500 1000 1500 2000 2500 3000
-5
-15
-25
-35
Sidoläge (mm)
Figure 33 Lane cross-sections, rough stretch of National Highway 90. Exaggerated
vertical scale.
53(79)](https://image.slidesharecdn.com/skakstudieengelsk-13369415317251-phpapp02-120513154534-phpapp02/85/Whole-Body-Vibrations-When-Riding-on-Rough-Roads-55-320.jpg)
![Whole-body vibration when riding on rough roads
SNRA Publ. no. 2000:31E
6.1.4 Seasonal variation in road roughness, County Road 950
Figure 34 shows that there can be a vast difference in roughness between winter and sum-
mer. VTI conducted the winter survey within the framework of the SNRA Central Re-
gion’s BÄRUND project (bearing capacity survey).
Ojämnheter (20 m), Y 950
14
12
Den tjälrelaterade ojämnhets-
ökningen är här ca 450 %
10
IRI IRI sommar 96
[m
m/ 8 IRI vinter 98
m] RUD, åtgärd 20 m
RUD, åtgärd 400 m
6 Mål e. rekonstr.
4
2
0
28 68 108 148 188 228 268 308 348 388 428 468 508 548 588 628 668 706 756 796 836 876 916 956 996 1036
Sektion [m]
Figure 34 Variation in road roughness IRI between summer and winter. The
summer survey is shown by the dark green dotted line, and the winter survey by the
blue dotted line. The horizontal green line shows the target level after reconstruc-
tion, the red and orange lines show the SNRA’s recommended specifications for
maintenance and operations (RUD) [24 ]. Seasonal differences up to 450% can be
seen.
54(79)](https://image.slidesharecdn.com/skakstudieengelsk-13369415317251-phpapp02-120513154534-phpapp02/85/Whole-Body-Vibrations-When-Riding-on-Rough-Roads-56-320.jpg)
![Whole-body vibration when riding on rough roads
SNRA Publ. no. 2000:31E
6.2 Cab acceleration model as a function of road roughness (IRI)
Figure 35 shows a typical example of a derived model for the relation between truck cab
vertical vibration acceleration (that is frequency weighted etc as specified in ISO 2631-1),
and road roughness measured as IRI value.
There is a greater variance in cab vibration acceleration at road roughness levels above 3
mm/m. This is probably due to the fact that the IRI is attuned to reflect the resonance
frequencies of cars rather than trucks and that the acceleration of the vibration in the cab,
unlike the IRI, is frequency weighted (see Figure 39). It could also be due to the emergency
road repair undertaken in the period between the road roughness survey and the cab vibra-
tion survey and to the fact that vehicles changed their lateral position on the carriageway to
avoid major visible roughness (even to the extent of driving on the wrong side of the road).
Even a ny minor changes in speed would have some effect.
Truck with trailer (75 km/h)
2,0
1,6
Dz [m/s ]
2
1,2
0,8
Measured
0,4 Regression Fit
0,0
0 1 2 3 4 5 6 7 8 9 10
IRI [mm/m]
Figure 35 Regression analysis (prior to the division into IRI classes) for vertical
translational vibrations at the seat in the truck
Figure 36 presents the resulting relationships, which can be used to calculate the mean
value over 3 – 5 seconds of the (x, y, z)-vector translational vibrations with a frequency of
0.5 – 80 Hz in the cab (at the truck driver’s seat and on the stretcher in the ambulance),
given that one knows the IRI100-values.
55(79)](https://image.slidesharecdn.com/skakstudieengelsk-13369415317251-phpapp02-120513154534-phpapp02/85/Whole-Body-Vibrations-When-Riding-on-Rough-Roads-57-320.jpg)
![Whole-body vibration when riding on rough roads
SNRA Publ. no. 2000:31E
Trucks and ambulances
Model for predicting translational vibrations
from International Roughness Index
2.5
2.0
1.5
1.0
0.5
0.0
0 1 2 3 4 5 6 7 8
IRI [mm/m], average during 100m
MICU ambulance, 120 km/h Emergency ambulance, 90 km/h
New Truck + Trailer, unloaded, 75 km/h Old Truck + Trailer, unloaded, 75 km/h
"The Golden Car" (only z-direction) A little uncomfortable
Fairly uncomfortable Uncomfortable
Very uncomfortable Extremely uncomfortable
Figure 36 Model for (x, y, z)-vector translational vibrations as a function of road
roughness
Formulae 6 and 7 can be used to mathematically describe a model for translational (x, y, z)-
vector vibrations in trucks (with a trailer) in normal condition and travelling at a speed
around 75 km/h. A similar relationship for a large ambulance travelling at a speed of about
120 km/h can be described by Formulae 8 and 9. The best degree of correlation is ob-
tained through using Formulae 6 and 8. Formula 10 is used to calculate the sensitivity of
the IRI model, restricted to vertical (z) motion only.
RMS ( atranslation ) = 0.18 + 0.30 * IRI 100
Formula 6 Translational vibrations in a truck with a trailer at an IRI100 of 0 – 3
mm/m
RMS ( atranslation ) = 0.35 + 0.22 * IRI 100
Formula 7 Translational vibrations in a truck with a trailer at an IRI100 of > 3
mm/m
RMS ( atranslation ) = 0.04 + 0.33 * IRI 100
Formula 8 Translational vibrations in a large ambulance at an IRI100 of 0 – 3
mm/m
56(79)](https://image.slidesharecdn.com/skakstudieengelsk-13369415317251-phpapp02-120513154534-phpapp02/85/Whole-Body-Vibrations-When-Riding-on-Rough-Roads-58-320.jpg)

![Whole-body vibration when riding on rough roads
SNRA Publ. no. 2000:31E
7 Discussion
An expert analysis of the effect of exposure to whole-body vibration was conducted by
Professor Ronnie Lundström of the National Institute for Working Life. The following is
an account of the discussion in the analysis:
”The findings from this pre-study clearly show that drivers and passengers/patients
travelling in logging trucks/ambulances on the rough stretches of National High-
way 90 were exposed to an unacceptably high vibration load in connection with
several of the driving conditions measured. In many cases, the loads reached levels
that bring a potential or probable health hazard, judging from the guidelines speci-
fied in ISO standard 2631-1. The vibration registrations also showed the frequent
occurrence of shock and rotational vibration, both in the vertical and horizontal
direction during the ride. The development of vibration-related injury symptoms
amongst logging truck drivers, such as lumbago and ischias, must therefore be re-
garded as highly probable under these driving conditions, particularly through re-
peated exposure day after day, year after year. Shock, roll and pitch can also result
in body motion that can impair driving performance and consequently the ability of
the driver to maintain full control of the vehicle. This in turn can jeopardise road
safety. The analysis of the vibration load in ambulances shows that the ride on the
rough stretch of National Highway 90 entails a potential, and in some cases even a
probable health hazard based on ISO 2631-1. This interpretation applies to healthy
individuals. It is unclear how this load should be related to the effect on patients in
need of medical care. There are good grounds to assume that they are more vulner-
able than healthy people. In any event, the vibration load could cause them addi-
tional harm.”
A summary of Professor Lundström’s conclusions is contained in section 7.4.1. A complete
account of the analysis is given in a separate report [65].
58(79)](https://image.slidesharecdn.com/skakstudieengelsk-13369415317251-phpapp02-120513154534-phpapp02/85/Whole-Body-Vibrations-When-Riding-on-Rough-Roads-60-320.jpg)
![Whole-body vibration when riding on rough roads
SNRA Publ. no. 2000:31E
7.1 Road stretches where the roughness presents a health hazard
To set a limit for an acceptable level of road roughness is not a trivial matter. It is known
that people are more disturbed when exposed to high levels of several stress factors in
combination (e.g. vibration, noise and infrasound) than to one at a time. In other words, a
combination of disturbances has an amplifying effect. This cannot be disregarded, as apart
from causing vibrations, road roughness is a primary source of high frequency sound (>
500 Hz), low frequency noise (20 – 500 Hz) and infrasound (< 20 Hz) [72].
Let’s take a closer look at a specific example: When heavy vehicles drove over a sharp edge
in the road surface that was 25 mm high, the noise level registered at the side of the road 7
metres away increased by as much as 23 dB(A). The same study showed that driving in a
hollow with an amplitude of 40 mm over a wavelength of 2.4 m resulted in an increase in
the noise level with as much as 29 dB(A), with peak values for total noise up to 106 dB(A).
The main source of noise did not come from the contact between tyre and carriageway,
which has been the focus of research up until now. It was a much more mundane problem:
rattling vehicle parts [4]. Unfortunately, the study did not mention the increase in noise
inside the cab.
In the general assessment amongst road authority representatives concerning what levels of
roughness are acceptable, the major focus up until now has been on how they themselves
experience road stretches with varying degrees of roughness. This approach is, however,
highly questionable, since healthy men under short exposure in relatively new comfortable
car models (a category in which almost all Swedish road authority employees on business
trips can be placed) ought to belong to the least sensitive group of road user. Focus should
instead be on road users who are more vulnerable than the average, and on exposure that
applies to commercial drivers over an extended period of time.
One conclusion that can be drawn from the differences shown in the graphs in Figure 36 is
that the effect of road roughness on the vibration level in the cab is about 2 - 3 times
higher in a truck than in a normal car.
An important fact to keep in mind is that the phenomenon of resonance means that two
roads with the same IRI value, but different wavelengths, cause entirely different distur-
bances at speeds other than the reference speed of 80 km/h. In practice, this is of key im-
portance as illustrated by the following examples:
1. Figure 37 shows that the IRI value, which is calculated at a reference speed of 80
km/h, is more than twice as sensitive to roughness with a wavelength of 2 m than
when the wavelength is 1 metre. In Figure 38 we can see that if we let the “Golden
Car” (the car model used to calculate the IRI value) simulate a ride at a speed of 40
km/h, roughness with a wavelength of 1 m causes acceleration of the cab that is more
than twice as high as the resulting acceleration when the wavelength is 2 metres. In
practise, this means that it is relatively senseless to evaluate road roughness driving
one’s own car at a low speed along the road in question, and expect to achieve an a s-
sessment in tune with the IRI values measured by the roughness profilometer vehicles.
2. Consider a carriageway that is completely smooth, except for one irregularity where the
wavelength is 2 m and the amplitude 10 mm. Figure 38 shows a momentary vertical cab
acceleration of 10*0.23/0.5 = 4.6 m/s2 at the reference speed of 80 km/h. If the speed
is reduced to 50 km/h the vibration is reduced to 10*0.13/0.5 = 2.6 m/s2. If the speed
59(79)](https://image.slidesharecdn.com/skakstudieengelsk-13369415317251-phpapp02-120513154534-phpapp02/85/Whole-Body-Vibrations-When-Riding-on-Rough-Roads-61-320.jpg)
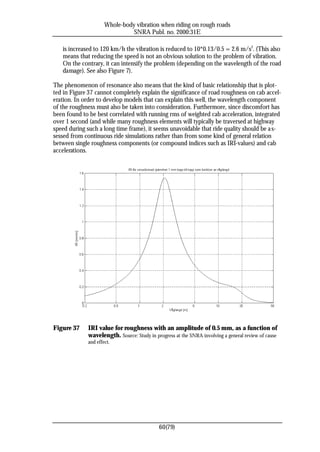
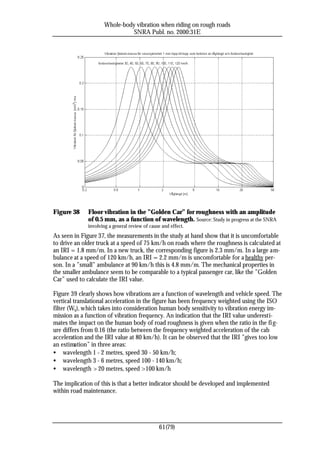
![Whole-body vibration when riding on rough roads
SNRA Publ. no. 2000:31E
IRI values are not enough to indicate the risk of motion sickness and as such should not be
used for this purpose. Rather, this risk should be assessed through direct vibration meas-
urements, 0.1 – 0.5 Hz, or through studying undulations measured on the carriageway.
IRI is, however, preferable to indicators that have been frequency weighted according to
the ISO 2631 standard for human exposure to vibrations when assessing the risk of vehicle
damage, dynamic pavement load etc. But also for this kind of assessments, other indicators
may be even better than IRI.
In light of the above, it is recommended that roughness above the level of IRI20 = 3
mm/m should, in practice, be regarded as entirely unacceptable in road maintenance man-
agement in Sweden. In other words 3 mm/m in average over 20 meter (corresponding to
an accumulated vertical suspension displacement of 6.0 cm during each second of a drive at
72 km/h or 20 m/s highway speed) should be seen as a provisional disgrace limit. Beyond
this, an eventual reduction of this limit should be discussed -- and first and foremost --
supplementary indicators of disturbances related to vibration be implemented. At present, a
lower IRI disgrace limit is not, however, of interest, since it is seen in Figure 40 that a limit
of IRI20 = 3 mm/m means that the condition on about 1/3 of the state roads is unaccept-
able. Considering the budget-/financing need, this presents such a crisis that it is of little
interest to discuss the grey zone below an IRI20 = 3 mm/m within the foreseeable future.
Figure 39 Relationship between the frequency weighted vertical cab acceleration
and IRI in the ”Golden Car”. Source: Study in progress at the SNRA involving a
general review of cause and effect.
Assuming that the initial defects after surfacing works can be kept below IRI20 = 0.6
mm/m, once the contractors have learned how to make best use of modern road mainte-
nance engineering methods [63], and that the average increase in roughness is 0.1
62(79)](https://image.slidesharecdn.com/skakstudieengelsk-13369415317251-phpapp02-120513154534-phpapp02/85/Whole-Body-Vibrations-When-Riding-on-Rough-Roads-64-320.jpg)
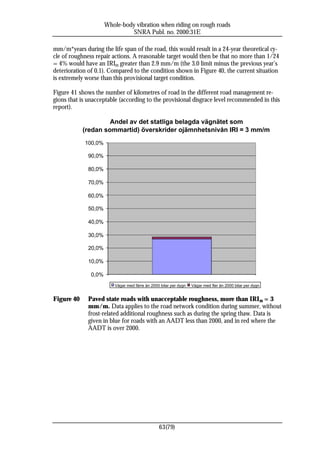
![Whole-body vibration when riding on rough roads
SNRA Publ. no. 2000:31E
Längd [km] av statliga belagda vägnätet som överstiger
ojämnhetsnivån IRI = 3 mm/m
5000
4000
3000
2000
1000
0
M
No
M
St
Sy
Vä
Sk
itt
äla
oc
dö
ån
st
rr
kh
rd
st
e
olm
ale
n
Figure 41 Total length [km] of road stretches with roughness over IRI20 = 3
mm/m in the summer per Swedish road management region
7.2 Variations in the road crossfall are particularly hazardous
According to a current proposed revision7 of ISO 2631 [10], the natural frequency of a
typical human spine on the X-Y axis is about 2.1 Hz. It is therefore extremely important
that humans are not exposed to strong vibrations at frequencies around 2.1 Hz in or across
the direction of travel.
As seen in section 4.5, heavy vehicles start to sway on their own if they are exposed to roll
at frequencies under 3 Hz. Roll with frequencies under 5 Hz do not occur when travelling
on ”normal” roads and at normal speeds. Therefore, in practice, vehicle manufacturers do
not focus much attention on the problem of roll resonance. According to a leading truck
manufacturer, there is a theoretical possibility, by designing the vehicle with an extremely
low roll stability. However, this would mean very poor cornering stiffness, and thus a major
tendency to capsize in connection with lateral manoeuvres, which is unacceptable from a
road safety perspective and therefore impossible to implement in practice.
The mechanical impact of vibrations, distributed over the vibration frequencies, for a truck
in good condition with a loaded/unloaded trailer is shown in Figure 42 and Figure 43.
When the truck is driven unloaded, a peak can be seen in the Y-direction (across the direc-
tion of travel) just in the 1.5 – 2.5 Hz range, i.e. exactly around the natural frequency of the
lumbar region of the back. Where the truck is loaded, the effect in this frequency range is
less. See the red circle in each figure.
The conclusion is that the crossfall variations on badly deformed Swedish roads means that
these are no longer satisfactory surfaces on which to drive normal heavy vehicles.
7Translation comment: the proposal has been adopted as a draft upcoming part of the 2631 standard, enti tled ISO/DIS 2631-5 ”Me-
chanical vibration and shock - Evaluation of human exposure to whole-body vibration – Method for evaluation of vibration contain-
ing multiple shocks”.
64(79)](https://image.slidesharecdn.com/skakstudieengelsk-13369415317251-phpapp02-120513154534-phpapp02/85/Whole-Body-Vibrations-When-Riding-on-Rough-Roads-66-320.jpg)
![Whole-body vibration when riding on rough roads
SNRA Publ. no. 2000:31E
Figure 42 Power spectral density at the driver’s seat in an unloaded truck (in
good condition) [64]
65(79)](https://image.slidesharecdn.com/skakstudieengelsk-13369415317251-phpapp02-120513154534-phpapp02/85/Whole-Body-Vibrations-When-Riding-on-Rough-Roads-67-320.jpg)
![Whole-body vibration when riding on rough roads
SNRA Publ. no. 2000:31E
Figure 43 Power spectral density at the driver’s seat in a loaded lorry (in good
condition) [64]
66(79)](https://image.slidesharecdn.com/skakstudieengelsk-13369415317251-phpapp02-120513154534-phpapp02/85/Whole-Body-Vibrations-When-Riding-on-Rough-Roads-68-320.jpg)
![Whole-body vibration when riding on rough roads
SNRA Publ. no. 2000:31E
7.3 Methods to reduce whole-body vibration in connection with road
transport
Section 26 of the Swedish Road Act [21] stipulates that the road manager must ensure
roads are kept “at a satisfactory standard for transport and communication” through main-
tenance and repair. It could also be of interest to discuss other ways of reducing vibration
than through more road maintenance and repair (and greater focus on roughness reduction
measures, particular using state of the art CAD/CAM technique [63]).
7.3.1 Changed travel speeds
Needless to say, no vibrations are generated from road roughness when the vehicle is
standing still. IRI, the road roughness indicator, is calculated at a simulated speed of 80
km/h. It would therefore be reasonable to think that road roughness (a road with high IRI
values) could be compensated through slowing down8 and thereby improve the ride quality.
However, when speed data was correlated with roughness data at VTI, it was found that
drivers showed very little tendency to slow down on rough roads.
Figure 37 shows that the vibrations in the vehicle and its suspension are not actually a func-
tion of the travel speed itself, but only of the wavelength (which determines the frequency
of the vibrations) and amplitude (determines the vibration effect at a given frequency) of
the roughness. However, the frequency that occurs when driving over a specific irregularity
depends on the travel speed. Thus, speed can have an indirect effect on the vibration level,
depending on the type of road roughness. The faster one drives, the more the longer wave-
lengths will be able to affect the movement of the vehicle body and suspension.
The roughness found on roads has all kinds of different wavelengths. Since the amplitude
generally is greater for longwave roughness, the vibration energy in most cases will increase
as speed increases. This is not, however, self-evident, but actually is due to the over-
representation of large amplitudes in the longwave road roughness. With modern tech-
niques, these can now be efficiently measured and remedied at road repairs. See [63]. The
resonance phenomenon means that it can be better to actually increase the speed in certain
cases - particularly on roads with shortwave roughness. See section 7.1.
A speed reduction model would be a helpful tool in road management to be able to take
the effects of existing roughness into consideration. However, such a model would have to
consider the mechanical properties of the vehicle in addition to both the amplitude and
wavelength of the road roughness. This kind of speed model is shown in Figure 44 for
vehicles like the ”Golden Car”, which is used to calculate the IRI value, in other words, a
typical passenger car. The model is based on the physical relationship between vertical vi-
bration and the IRI value at different effect density spectra for road roughness, while a p-
plying restrictions for the vibration level. The model is based on the assumption that the
graph in the effect density spectra for road roughness can be described by a gradient coef-
ficient. See ISO 8608 [5].
Figure 44 shows that when travelling by car at parking speed on a road with predominantly
shortwave road roughness, a sense of discomfort starts at an IRI = 2.5 mm/m. If instead
8Translation comment: In a recent paper ”International Roughness Index, IRI, and ISO 2631 Vibration Evaluation” by Kjell Ahlin &
Johan Granlund, it has been analytically proved that speed must be reduced to levels below 20 – 40 km/h to bring substantial ride quality
improvement. Some of the analysis done when preparing the paper work can be seen in Figure 44.
67(79)](https://image.slidesharecdn.com/skakstudieengelsk-13369415317251-phpapp02-120513154534-phpapp02/85/Whole-Body-Vibrations-When-Riding-on-Rough-Roads-69-320.jpg)
![Whole-body vibration when riding on rough roads
SNRA Publ. no. 2000:31E
the road has predominantly longwave roughness, an IRI up to 10 mm/m can be tolerated.
If the speed is increased to 140 km/h, the longwave roughness cannot exceed an IRI above
1.6 mm/m. However, at the same speed, shortwave roughness with an IRI = 2 mm/m can
be tolerated without discomfort.
The conclusion is that even longwave roughness must be eliminated in an efficient road
transport system.
Högsta komfortabla hastighet i "The Golden Car"
Olika samband vid olika lutning för grafen i PSD-diagrammet för vägojämnhetsprofilen
140
120
Hastighet [km/tim]
100
-2,5 (0,63)
-2,0 (0,63)
80
-1,5 (0,63)
-2,5 (0,315)
60
-2,0 (0,315)
-1,5 (0,315)
40
20
0
0 1 2 3 4 5 6 7 8 9 10
IRI-värde [mm/m]
Figure 44 Vertical vibration-related speed model. The steepest lines refer to roads with a
large predominance of shortwave roughness, and the flattest to roads with predominantly
longwave roughness. Vibration limits of 0.315 and 0.63 m/s2 were used in the figure. Source:
Study in progress at the SNRA involving a general review of cause and effect.
At the time of writing, the speed limit on National Highway 90 between Näsåker and
Skarped is 90 km/h. Figure 44 shows that cars should not be driven at a higher average
speed than 65 - 80 km/h, with the roughness that occurs there, and not faster than about
20 km/h (if that) on the stretches where the roughness is greatest. Heavy trucks are about 2
- 3 times more sensitive than cars to increased road roughness. Speed reductions would
increase transport times drastically -- and thus transport costs -- for the private sector. As
an example of the significance of transport costs in national economy, mention can be
made of how the forestry industry has already declared that the loading and transport of
raw products accounts for as much as 20% of their refinement value.
As significant roughness does not exist everywhere along a road, the method of reducing
exposure to vibration through changes in speed means that the driving rhythm will be
more affected than the average speed. An irregular driving pattern is both dangerous in
traffic (encourages reckless overtaking, heavy vehicles have to brake more than cars at
rough spots) and is more harmful to the environment.
68(79)](https://image.slidesharecdn.com/skakstudieengelsk-13369415317251-phpapp02-120513154534-phpapp02/85/Whole-Body-Vibrations-When-Riding-on-Rough-Roads-70-320.jpg)
![Whole-body vibration when riding on rough roads
SNRA Publ. no. 2000:31E
7.3.1.1 Low-frequency (motion sickness) vibrations
Formula 5 shows that at speeds under 30 km/h, roughness where the wavelength is greater
than 10 m (which is the longest wavelength within which we know from experience that a
thin new wearing course layer alone can noticeably reduce roughness) will cause such low
frequency motion that the vibration frequencies will be less than 0.1 Hz. As far as we
know, such low frequency vibrations have no effect on humans. The question is, however,
whether road users will accept driving as slowly as 30 km/h, particularly in long-distance
emergency ambulance transport.
7.3.2 Changes in vehicles
Developing vehicles that could dampen extremely low frequency (0.1 – 0.63 Hz) random
vibrations does not seem realistic. In practice, it is even very difficult to dampen vibrations
with frequencies below around 5 Hz. The fact is that a very soft suspension design is nec-
essary for the natural vibration range to be low enough.
Transport needs are not constant, thus changes develop over time. This also means that
unsuitable vehicles (vis-à-vis vibration) are being increasingly used for certain transports;
e.g., there is a growing demand for more medical intensive care and monitoring equipment
in ambulances, which means a greater load and that ambulances are starting to resemble
truck & bus constructions more and more.
In trucks, some of the vibrations transferred through the seat and back rest can be damp-
ened to a certain extent by replacing older seats with new, modern ones fitted with im-
proved vibration isolators. Reducing vibrations at the floor may bring a change to a spring-
mounted cab. This, however, can suppress vibrations that are positive in the sense that they
inform the driver about the movement of the vehicle (thus erasing “road feeling”). Chang-
ing to a spring-mounted cab could also possibly increase the low frequency vibrations (in-
cluding side-to-side vibrations on roads with damages that include much cross slope vari-
ance), through the cab suspension’s own transformation of high-frequency vibrations. This
can intensify travel sickness. Both of these side effects are negative from a road safety
viewpoint. Perhaps it would be of more merit to install a Central Tyre Inflation (CTI) sys-
tem to regulate tyre pressure during travel. This permits easy reduction of the tyre pressure
when the vehicle is being driven with a light load or without any load at all, which means
that the vibrations are not propagated as easily up via the wheel axles and onward into the
cab. At the time of writing, this system not being favoured in the preliminary European
norm 1032 on vibration emission values in vehicles [73]. The present issue focuses on the
difference between vibrations in wheel axles and the seats, not on the difference between
the roughness profile of the road and the vibrations higher up. This plays down the signifi-
cance of the wheels.
If the road manager were to provide statistics on the wavelength/amplitude characteristics
along different parts of the road network (through PSD diagrams as per ISO 8608 [5]), or
even better; complete roughness profiles, vehicle manufacturers would be able to custom-
ise the mechanical properties to the road roughness encountered by the customer and the
speeds at which s/he intends to drive. Considering the extreme segmentation of the vehicle
market that this would mean, the price for the relatively limited improvement that could be
achieved in this way would probably be very high.
69(79)](https://image.slidesharecdn.com/skakstudieengelsk-13369415317251-phpapp02-120513154534-phpapp02/85/Whole-Body-Vibrations-When-Riding-on-Rough-Roads-71-320.jpg)
![Whole-body vibration when riding on rough roads
SNRA Publ. no. 2000:31E
7.3.3 Road maintenance
It ought to be an obvious goal that the alignment and roughness on all roads (during the
entire year) would be such that driving at normal speeds in vehicles that comply with EU
mechanical directives and that have passed vehicle inspection would not cause motion
sickness or expose vehicle occupants to vibrations that are uncomfortable, or even injuri-
ous. As far as the discomfort limit is concerned, 0.315 m/s2 has been recommended for
cars in the project entitled ”Ergonomic vehicle classification” [35].
In order to prevent motion sickness, the road roughness index must be acceptable for all
wavelengths up to 350 metres [63] and the horizontal curvature must meet the require-
ments of motor vehicle traffic. This entails a major need for up-grading/re-construction on
roads that originated as cow paths.
During the past ten years or so, the SNRA has collaborated with different suppliers to co-
develop a CAD/CAM geometric pavement model to optimise “mill and fill” road mainte-
nance in the method specifications entitled ”Procedures at road repairs” [63]. Through
surveying the road geometry, planning the best action to take and using plant and equip-
ment as directed, all road roughness known to have a negative impact on people and vehi-
cles can be minimised within budget allowances. On roads with poor bearing capacity or
frost damage, a new simple bituminous surface is not cost effective. What is then needed is
reconstruction and frost-proofing in spots or along complete road stretches.
70(79)](https://image.slidesharecdn.com/skakstudieengelsk-13369415317251-phpapp02-120513154534-phpapp02/85/Whole-Body-Vibrations-When-Riding-on-Rough-Roads-72-320.jpg)
![Whole-body vibration when riding on rough roads
SNRA Publ. no. 2000:31E
7.3.4 Does the choice of road maintenance strategy matter?
Tillståndsutveckling vid två olika underhållstrategier
3,5
3
2,5
Ojämnhet IRI [mm/m]
2
1,5
1
0,5
0
0 1 2 3 4 5 6 7 8 9 10 11 12 13 14 15 16 17 18 19 20 21 22 23 24 25 26 27 28 29 30 31 32 33 34 35 36 37 38 39 40
Tid [år]
Figure 45 Roughness development over years in connection with two different
strategies of road maintenance and repair.
Figure 45 shows, in principle, the surface condition deterioration caused by traffic load and
climate over the years in connection with two different maintenance strategies. Road
roughness steadily increases from the ideal (green line). The road is repaired when it
reaches the intervention level (red line). The one strategy means undertaking few, but dura-
ble measures (black graph). The other strategy entails several weak measures (orange
graph). A simple mathematical analysis shows a considerably higher dose of disturbance
where many, meagre measures are undertaken. Moreover, this entails much greater distur-
bance from frequent road works.
71(79)](https://image.slidesharecdn.com/skakstudieengelsk-13369415317251-phpapp02-120513154534-phpapp02/85/Whole-Body-Vibrations-When-Riding-on-Rough-Roads-73-320.jpg)
![Whole-body vibration when riding on rough roads
SNRA Publ. no. 2000:31E
7.4 Conclusions
7.4.1 Evaluation of impact on humans of vibrations related to road roughness
The following is a summary of the conclusions drawn by Prof. Ronnie Lundström of the
National Institute for Working Life, subsequent to having analysed the vibrations measured
in this study:
– road roughness has a decisive impact on the vibration load to which the vehicle
occupant is exposed in all respects,
– when travelling on the old part of National Highway 90 in both the logging
trucks and the ambulances, drivers, passengers and patients were exposed to an
unacceptably high vibration load,
– when travelling on the old part of National Highway 90 and County Road 950
• the vibration load is compatible with potential, and sometimes even a probable
health hazard,
• the vibration load is compatible with a considerably higher degree of discomfort
compared to the newer and smoother part of National Highway 90,
• the vibration load is compatible with a greater risk of reduced performance ability,
• the occupants run a higher risk of developing symptoms of travel sickness than
when travelling on the newer and smoother part of National Highway 90,
– when transporting patients in a state of health that demands keeping the body
completely still, for example in the case of brain, spinal and neck injuries, the
ride on the old part of National Highway 90 and County Road 950 generates un-
acceptably high vibration levels,
– the vibrations registered on the old part of National Highway 90 and County
Road 950 have a clear element of shock and rotational motion at levels high
enough that they probably exacerbate the risk of injury, discomfort and motion
sickness.
7.4.2 Assessment of the need to take action on the road network, etc
• A reduction in speed of between 30 - 50 km/h in the ambulance resulted in a reduction
of discomfort by 0 (zero!) ISO class on the rough test stretch of National Highway 90
and by one (1) ISO class on the smooth part [65].
• Changing from a badly run down truck to a new one resulted in a reduction of discom-
fort of one (1) ISO class on both test stretches of National Highway 90 [65].
• Changing from a lurching intensive care ambulance to a comfortable emergency ambu-
lance resulted in a reduction of discomfort of one (1) ISO class on both test stretches
of National Highway 90 [65].
• In all the trucks and ambulances, driving at a given speed on a test stretch with a
“smooth” carriageway, compared to driving on a ”rough” one resulted in a reduction
of discomfort of 2 – 3 (!) ISO classes on both test stretches on National Highway 90
[65].
• The mechanical properties of the smaller ambulance are comparable to a normal car
(see Figure 36). The fact that driving a car 4 hours a day on a carriageway where the
roughness is equal to the rough stretches on National Highway 90 means ”potential
health risk” [65] is alarming considering the effect on travelling salesmen, taxi drivers,
etc.
72(79)](https://image.slidesharecdn.com/skakstudieengelsk-13369415317251-phpapp02-120513154534-phpapp02/85/Whole-Body-Vibrations-When-Riding-on-Rough-Roads-74-320.jpg)
![Whole-body vibration when riding on rough roads
SNRA Publ. no. 2000:31E
• Increased road roughness affects the vibration levels in the cab of a truck about 2-3
times more than in a car.
• A considerable amount of the vibration problem is caused by relatively longwave /
extremely longwave road roughness and by uneven crossfall. This type of road damage
is not shown particularly well by the IRI, which means that objective knowledge about
this kind of deterioration is lacking in the SNRA PMS database. Longwave road rough-
ness is considered primarily to be caused by settlement. In certain types of soil, this
kind of steady damage can continue up to 100 years after the road was first built or
most recently strengthened. This in combination can explain why drivers feel that the
quality of the ride has deteriorated despite the fact that the IRI statistics remains rela-
tively stable.
• The problem is greatest during late winter / spring, due to frost heave variance in and
under the road structure.
• Badly damaged stretches must be completely re-constructed.
• Exceptionally sharp curves and steep undulations should be remedied.
• Moderately damaged stretches can be repaired, based on ergonomic principles, through
the use of the best state of the art technology as in the SNRA’s ”Procedures at road
works”, the so-called “mill and fill” CAD-design [63].
• A provisional ”disgrace limit” for road roughness is an IRI20 = 3 mm/m, correspond-
ing to 6.0 cm accumulated suspension stroke per second during a 72 km/h passenger
car ride. The 3 mm/m limit is based on human considerations (risk of injury, reduced
performance ability, etc) rather than on potential vehicle damage, etc.
• Even in the summer, about one-third of the state road network is in a completely una c-
ceptable condition (IRI20 > 3 mm/m).
• A special plan of action for repairing the road network will involve extensive amounts
of transported road materials. As far as possible, materials from borrow pits should be
transported and stored close to road projects during winter, when the roads are frozen
and the bearing capacity is good in order to prevent further damage to the roads.
• Stretches within each road class where the condition is worse than the disgrace level
can only be prioritised according to “worst first”. Otherwise, the disgrace limit princi-
ple can be ignored.
• One possible alternative on low traffic volume roads is to reconstruct them as gravel
roads, which can then be graded regularly.
• For now, the ambition is that the IRI20 after remedial works should be less than 1.00
mm/m during unfrozen ground conditions and 1.40 mm/m when the ground is fro-
zen. With the exception of the first 100 m on the traffic lane in the direction of travel --
where movement in the body of the vehicle can be caused by damage ahead of the re-
pair -- an IRI20 higher than 1.8 mm/m should fail inspection, and the contractor should
be required to take the necessary action to rectify this without any additional remunera-
tion. This would, however, be under the condition that the road authority had specified
that the design should take into consideration all roughness that affects the IRI during
each respective season.
• In connection with surveys for drawing up design documents for ergonomically correct
road maintenance, or when inspecting contract works, etc, the road roughness must be
measured with profilometers that can handle wavelengths up to at least 70 m. Also, to
be completely able to prevent the risk of motion sickness, it is necessary to be able to
measure wavelengths up to some 350 m. Instruments that are unable to meet the envi-
ronmentally related needs of road users -- traditional recording coaches, straightedges,
yardsticks, visual inspection, etc. -- are completely out of the question for the purposes
73(79)](https://image.slidesharecdn.com/skakstudieengelsk-13369415317251-phpapp02-120513154534-phpapp02/85/Whole-Body-Vibrations-When-Riding-on-Rough-Roads-75-320.jpg)
![Whole-body vibration when riding on rough roads
SNRA Publ. no. 2000:31E
mentioned above. See also the Environmental Code, Instructions on Load Ergonomics
published by the National Board of Occupational Safety and Health, Instructions on
the design of installations, etc.
7.4.3 Need for further research and development
• Ensure that any problems (technical, contract, organisation, etc.) that would prevent
the full application of the SNRA’s ”Procedures at road repairs” [63] CAD/CAM-
technology are eliminated immediately.
• Refined limits for road roughness and texture that put human health at risk should be
further examined in consultation with the National Institute for Working Life based on
the criteria for the combined exposure to vibrations, noise and infrasound for truck
drivers driving at legal speeds, and for particularly vulnerable people during emergency
transport in ambulances (defined as driving about 25% faster than the posted speed).
• Motion sickness is reported much more frequently by medical orderlies and patients in
ambulances than by those travelling in cars. A unique motion sickness constant, K m,
see formula 7 in [65], should therefore be determined for these particular categories of
road user.
• Develop different filters9 for the profilometers that replace the IRI value when assess-
ing the risk of discomfort, injury and motion sickness. The filters should be used on
vehicle models like ”The Golden Car”, but should ultimately process the vibrations in
compliance with the Wk and Wf filters in ISO 2631. The assessment of vehicle damage
costs, etc should, however, continue to be based on the IRI value (or other unit of
measure for suspension vibration that is not filtered with respect to human sensitivity
to frequency).
• Develop specifications for ergonomically correct geometric design for road mainte-
nance purposes. New construction specifications are not completely applicable at the
maintenance stage. Examples of questions that need to be answered (see also the fore-
going paragraph): ”What roughness can be accepted in different wavelength bands in
the longitudinal direction of the road?”, ”How much can the nominal crossfall be a l-
lowed to vary along the road?”, ”When is a curve so sharp that it must be straightened
out through re-construction?”, ”What nominal crossfall is to apply in existing curves,
when these are considerably sharper than what is allowed in the specifications for new
construction?”.
The possibilities and problems associated with vibration measurements are presented in a
technical report [64]. Any vehicle used for collecting measurement data should be equipped
with a distance meter (like the KUAB road logger, Coralba Digitrip or similar) that can be
connected to a computer when registering data that is to be correlated with the road sur-
face condition data stored in the SNRA’s road database. This reduces the work spent on
correlating data by at least 90%.
9 Translation comment: This is done in the recently developed software Ride Quality Meter ®
74(79)](https://image.slidesharecdn.com/skakstudieengelsk-13369415317251-phpapp02-120513154534-phpapp02/85/Whole-Body-Vibrations-When-Riding-on-Rough-Roads-76-320.jpg)
![Whole-body vibration when riding on rough roads
SNRA Publ. no. 2000:31E
8 Reference list
[1] Nationalencyklopedin.
[2] Sandberg, U. (1998). Influence of Road Surface Texture on Traffic Characteristics Re-
lated to Environment, Economy and Safety. Väg- och transportforskningsinstitutet, Notat
53A-1997
[3] Strandberg, L. (1996). Olycksrisker och bromskraftfördelning i personbilar. Väg- och
transportforskningsinstitutet, Meddelande 768-1996
[4] Harris, G.J. & Nelson, P.M. (1999). Control of body noise from commercial vehicles.
TRL Journal of Research 1999, vol 2, no 1
[5] Mechanical vibration - Road surface profiles - Reporting of measured data. (1995). In-
ternationell standard, ISO 8608:1995
[6] Trafikantbetyg. Vägverket. Årliga rapporter under perioden 1995-98 från IFS AB till
trafikantavdelningen.
[7] Vibration och stöt - Vägledning för bedömning av helkroppsvibrationers inverkan på
människan – Del 3: Inverkan på människan av vertikala helkroppsvibrationer i z-
riktningen inom frekvensområdet 0.1 – 0.63 Hz. (1985). Svensk och internationell stan-
dard, SS-ISO 2361/3
[8] Granlund, J. (1996). Funktionsmätning på väg – med Laser RST mätbilar. ISSN 0349-
6023. Luleå Tekniska Högskola.
[9] Tekniska NomenklaturCentralen. http://www.tnc.se
[10] Vibration och stöt - Vägledning för bedömning av helkroppsvibrationers inverkan på
människan – Del 1: Allmänna krav. (1998). Svensk och internationell standard, SS-ISO
2361/1
[11] Griffin, M.J. (1990). Handbook of Human Vibration. Human Factors Research Unit,
University of Southampton.
[12] Gillespie, T.D. & Sayers, M.W. (1983). Guidelines for the Conduct and Calibration of
Road roughness Measurements. Supplementary report to the World Bank, Washington
D.C.
[13] Karamihas, S.M. & Sayers, M.W. (1997). The Little Book of Profiling. University of
Michigan. http://www.umtri.umich.edu/erd/roughness/litbook.html
[14] Magnusson, G. (1993). Metoder och instrument för mätning av egenskaper som är
viktiga för vägytans funktion. Väg- och transportforskningsinstitutet, Opublicerat manu-
skript
75(79)](https://image.slidesharecdn.com/skakstudieengelsk-13369415317251-phpapp02-120513154534-phpapp02/85/Whole-Body-Vibrations-When-Riding-on-Rough-Roads-77-320.jpg)
![Whole-body vibration when riding on rough roads
SNRA Publ. no. 2000:31E
[15] Friis, L. (1998). Vibrationsskador. Akademiska sjukhuset, Arbets- och miljömedicin
www.occmed.uu.se
[16] Vägtrafikteknisk nomenklatur – Begreppsdefinitioner och termer. (1978). Transport-
ForskningsKommissionen, rapport 1978:2
[17] Lindberg, L. (1999). Buller och vibrationer i spädbarnskuvös vid transport i ambu-
lansbil. Arbetslivsinstitutet.
[18] Sjölinder, K., et al (1997). Vägytans inverkan på trafiksäkerheten. Väg- och transport-
forskningsinstitutet, Notat 67-1997
[19] Vibrationer. (1984). Ingenjörsvetenskapsakademien, rapport 256
[20] Terminology Relating to Vehicle-Pavement Systems. American Society of Testing and
Materials, ASTM E867 – 97. http://www.astm.org/
[21] Väglagen. http://www.notisum.se/
[22] Avåkningar på löpande band. (1999). Västerbottens Folkblad 3 mars 1999
[23] Yrkeschaufförer rasar mot spårig riksväg 90. (1999). Nya Norrland 5 mars 1999
[24] Regler för underhåll och drift. (1990). Vägverket, publ 1990:51
[27] Leding, L. (1999). Arbetsmiljö- och säkerhetsenkät, riktad till rikets samtliga sjukhus
med barnavdelning.
[29] Lindberg, L. (1999). Buller och vibrationer i ambulansbilar under transport på
landsväg. Arbetslivsinstitutet, rapport 1999:15
[30] Bylund, S.H. (1998). Skador och besvär av vibrationer – en jämförelse mellan kvin-
nor och män Arbete och hälsa, vetenskaplig skriftserie. 1998:26. http://www.niwl.se/ah/
[31] Vibrationer. (1999). Arbetslivsinstitutets yrkesmedicinska enhet, Vibrationsgruppen.
http://umetech.niwl.se/Swedish/Vibrationer.html
[32] Dupuis H, Zerlett G. (1986). The effects of whole-body vibration. Springer Verlag.
[33] Arbetsorsakade besvär 1997. (1998). Arbetarskyddsstyrelsen, Am43 SM 9701.
http://www.arbsky.se/isa/publ/besvar97.pdf
[34] Nationalencyklopedins ordbok.
[35] Hellsten, M. & Hopen, A-G. (1994). Komfortklassning av personbilar. Mikael Hells-
ten AB, Falkenberg.
76(79)](https://image.slidesharecdn.com/skakstudieengelsk-13369415317251-phpapp02-120513154534-phpapp02/85/Whole-Body-Vibrations-When-Riding-on-Rough-Roads-78-320.jpg)
![Whole-body vibration when riding on rough roads
SNRA Publ. no. 2000:31E
[36] Förstberg, J. (1998). Varför kan man bli åksjuk när man åker tåg? Väg- och trans-
portforskningsinstitutet, Särtryck 296-1998
[37] Årsredovisning 1998. (1999). Vägverket, Publ. 1999:33. http://www.vv.se/
[38] Arnberg, P.W. & Åström, G. (1979). Vägojämnheters inverkan på bilförares presta-
tion och trötthet. Statens väg- och trafikinstitut, Rapport 181-1979
[40] Meriam, J.L. & Kraige, L.G. (1987). Engineering Mechanics, vol. 2, Dynamics. John
Wiley & Sons, New York.
[41] Automobile Ride, Handling, and Suspension Design. (1996). Robert Q Riley Enter-
prises. http://www.rqriley.com/suspensn.html
[42] Evaluation of vibration. (1999). Ergotech company.
http://www.ergotech.co.za/vib_wbv.htm
[48] Weigh-In-Motion of Road Vehicles. (1999). European Commission, Directorate Gen-
eral Transport. COST Action 323. http://www.cordis.lu/cost-transport/src/cost-323.htm
[51] Helkroppsvibrationer: Stötar och icke-harmoniska vibrationer. Förekomst samt effek-
ter på människan. (1986). Arbetarskyddsstyrelsen, Slutrapport ASF 78-1550
[52] Arbetarskyddsstyrelsens föreskrifter om belastningsergonomi. (1998). Arbetarskydds-
styrelsen, AFS 1998:1 http://www.arbsky.se/afs/1998_01.pdf
[53] Ont i ryggen. (1991). Statens beredning för medicinsk utvärdering. http://www.sbu.se/
[54] Dana, H.J. (1933). The Dana Automatic Recording Roughometer for Measuring
Highway Roughness. Highway Research Board, Proceeding
[55] Cebon, D. (1999). Handbook of Vehicle-Road Interaction. University of Cambridge,
England.
[56] Dana, H.J. (1930). Formation of Washboards in Gravel Highways. Highway Research
Board, Proceeding
[57] Nilsson, L-E. et al. (1989). Trafikledsteknik, del 1: Vägar, gator, trafik & miljö.
Institutionen för vägbyggnad, Chalmers Tekniska Högskola.
[58] Sylwan, O. (1937). Lyx och komfort. Svenska Humanistiska Förbundet.
[59] Widding, L. et al. (1996). Svenska äventyr, 1710 - 1780.
[60] Buckle, P. et al. (1980). Factors influencing occupational back pains in Bedfordshire.
Spine 5.
[61] Tengström, E. (1991). Bilismen – i kris? Rabén & Sjögren.
77(79)](https://image.slidesharecdn.com/skakstudieengelsk-13369415317251-phpapp02-120513154534-phpapp02/85/Whole-Body-Vibrations-When-Riding-on-Rough-Roads-79-320.jpg)
![Whole-body vibration when riding on rough roads
SNRA Publ. no. 2000:31E
[62] Nationell plan för vägtransportsystemet 1998 - 2007. (1998). Vägverket, förslag
[63] Vägbanemodell för datorstödd utformning av underhållsbeläggningar. (1999). Väg-
verket, publ 1999:100 http://www.vv.se
[64] Ahlin, K. (2000). Helkroppsvibrationer vid färd på ojämna vägar. Ingemansson
Technology AB, Mät- och Analysrapport S-13542-r-A http://www.ingemansson.com
[65] Lundström, R. (2000). Helkroppsvibrationer vid färd på ojämna vägar - en förstudie.
Arbetslivsinstitutet, tekniska enheten, uppdragsrapport 2000:1. http://umetech.niwl.se/
[66] Gillespie, T.D. et al. (1982). Truck Cab Vibrations and Highway Safety. Highway
Safety Research Institute, University of Michigan. FHWA report RD-82/093
[67] Life-Cycle Cost Analysis in Pavement Design. US Department of Transportation,
Federal Highway Administration. Publication No. FHWA-SA-98-079
http://www.fhwa.dot.gov
[68] Hegmon, R. R. (1993). A close look at Road Surfaces. Public Roads.
http://www.tfhrc.gov/pubrds/summer93/p93su4.htm
[69] Hedberg, G.E., et al. (1991). Mortality in circulatory diseases, especially ischemic heart
disease, among Swedish professional drivers. J Human Ergol., 1991;20:1-5
[70] Hedberg, G.E., et al. (1993). Risk indicators of ischemic heart disease among male
professional drivers in Sweden. Scand. J Work Environ Health, 1993;19:326-33
[71] Hedberg, G.E. & Langendoen, S.M. (1989). Factors Influencing the turnover of Swed-
ish Professional Drivers. Scand. J Soc Med, 1989;17:231-237
[72] Landström, U. & Löfstedt, P. (1987). Buller, vibrationer och vakenhet under last-
bilskörning. Arbete och hälsa, 1987:41
[73] Mechanical vibration - Testing of mobile machinery in order to determine the vibra-
tion emission value. (2000). Preliminär Europanorm, prEN 1032
[74] Bovenzi, M. & Hulshof, C.T.J. (1999). An updated review of epidemiologic studies on
the relationship between exposure to whole-body vibration and low back pain (1986-1997).
Int Arch Occup Environ Health (1999) 72:351-365
[75] Spång, K. (1997). Assessment of whole-body vibration containing single event shocks.
Noise Control Eng. J., 45(1), 1997, pp 19-25.
78(79)](https://image.slidesharecdn.com/skakstudieengelsk-13369415317251-phpapp02-120513154534-phpapp02/85/Whole-Body-Vibrations-When-Riding-on-Rough-Roads-80-320.jpg)


This study investigates the impact of whole-body vibrations from road roughness on drivers' health and safety, specifically on stretches of national highway 90 and county road 950. Results indicate that road roughness significantly contributes to vibration levels, with findings linking high exposure to vibrations to health issues in commercial drivers, particularly in regions with poor road conditions. The study emphasizes the need for further research and improvements in road maintenance to alleviate vibration effects on road users.