A new method for testing pavement condition combines laser/inertial profilometry of unloaded pavement with vibration measurements in a full loaded heavy truck at highway speed. Three types of results are obtained.
1: Truck wheel, frame and cab vibration, as well as driver seat vibration to be compared with exposure guidelines in ISO 2631-1 and limits in directive 2002/44/EC.
2: Three-dimensional road surface geometry data for simulation of ride and calculation of roughness indices.
3: Locations of potential pavement "soft spots". The latter is possible since large pavement deflection variance under the heavy truck cause a quite different vehicle vibration pattern than the pattern excited from the measured unloaded road surface profile.
A tentative accuracy experiment has been done at 4 sites. Recorded seat vibration levels were very high, thus exceeding the EU Action Value in all test runs. The soft spot indications show reasonable repeatability, as well as reproducibility between different driving speeds and between spring time and autumn. Trueness is the most difficult accuracy feature to estimate, since no ideal reference method is at hand neither for variance of local deflection under truck wheel, nor for global deflection under the entire truck. By comparison with FWD, coring and ground penetrating radar results, trueness seems promising. During the tests, a virtual tyre footprint sensor was used for road profiling. Evaluation showed it to bring a large improvement to profiling accuracy. The new high speed measurement method brings excellent opportunities for further research on the entire chain pavement-truck-ride quality interaction.
Paper published at BCRA´05 in Trondheim, Norway.
Vibration measurement and spectral analysis of chassis frame mounted structur...Dr.Vikas Deulgaonkar
Chassis mounted structure is a base component for shelters or containers mounted on heavy transport vehicles. When the vehicle is driven in rough terrains or during off-road transportation this structure has a significant role in protecting the sophisticated cargo and intelligent tracking systems placed inside the shelters. During off-road transportation or warhead conditions the vehicle is subjected to large unevenness in load due to road or soil irregularities in rough terrains, which causes vibrations to be induced in the vehicle. As the nature of vibrations induced in vehicle during travel on off-road or cross-country terrains is random and unpredictable, there is a concern to analyse the vibration response of chassis and chassis mounted structures is needed. Present work deals with vibration measurement and spectral analysis of a chassis mounted structure designed for off-road and commercial transport vehicles. The road profile on which the vibration measurement has been carried out includes paved road and cross-country terrain segments. The vibration measurement has been carried at three different vehicle speeds. Signal analysis procedure for the acquired test data is discussed. The chassis mounted structure under concern is intended to hold two shelters or containers. From the vibration measurement at critical locations, g-(RMS) and g-(peak) values for paved and cross-country roads have been found out. Power spectral density values have also been found on chassis and structure for the same transport situations. Major inferences include the evaluation of minimum and maximum g-values (peak & RMS) on chassis and chassis mounted structure. Power spectral density graphs are constructed from which the dominant frequency for both road profiles is found out
The document discusses different approaches to flexible pavement design, including empirical, mechanistic, and mechanistic-empirical approaches. It provides details on each approach, such as the empirical approach using the 1993 AASHTO Guide equation relating pavement characteristics to performance, and the mechanistic approach modeling the pavement as layers and calculating stress/strain. The mechanistic-empirical approach combines both, using mechanics to calculate stresses/strains and empirical data to define failure criteria. Road tests like the AASHO and Maryland tests helped develop the empirical relationships used in design methods.
The document discusses the design of a flexible pavement for a proposed 25 km expressway from Bandar A to Bandar B. It provides information on the differences between flexible and rigid pavements. It then outlines the traffic data and estimated traffic loads for the expressway of 3.9 million ESALs over 10 years. Resilient modulus values are provided for the pavement layers. Using the AASHTO design method and chart, structural numbers are calculated for three subgrade resilient modulus scenarios. The pavement thicknesses are then determined, with the asphalt layer being 5.5 inches, base layer 8 inches, and subgrade layer 10 inches.
Strain characteristicts in a unique platform integrated with truck chassis un...Dr.Vikas Deulgaonkar
Present work deals with the process of determination of strain in a structural member under intense load for a typical Indian truck. Characteristics of mechanical strain at various locations on the structure are assessed. Strain gauge selection along with process of locating significant positions for strain measurement on the structure is described. Experimental process is employed for strain measurement. From the experimentation carried on the structure, the results reveal that the tri-axial stresses are dominant over bi-axial and uni-axial stresses at critical points on the structure. Contemporary data acquisition systems are utilized to acquire the strain signals. Computer simulation is carried out to have perception of the behavior of the structure under consideration. Static and Dynamic strain measurement is carried out at constant speeds on various tracks. As there are no assumptions involved in measurement like theoretical modeling and analysis, the experimental method provides the actual strain/stress values at the selected locations. Locations have been selected at cross-members where they are supported at the longitudinal members. As the stresses at these locations are not unidirectional, rosettes have been used to acquire strain in three directions. Linear strain gauges used at locations on longitudinal members.
06-Traffic Characterization ( Highway and Airport Engineering Dr. Sherif El-B...Hossam Shafiq I
This document discusses traffic characterization and loadings for pavement design. It covers topics like vehicle characteristics, axle configurations, traffic composition, sources of traffic data, load equivalency factors, truck factors, and how to calculate estimated 18-kip equivalent single-axle loads (ESALs) using traffic data. The goal is to account for the full spectrum of traffic loads that pavement will experience over its design life when determining appropriate pavement thickness.
This document summarizes the evolution of road design from ancient times to modern practices. It describes ancient stone-paved roads from 5000 years ago. It then covers the design of Roman roads, including their layered structures and materials. Road design continued to evolve in the 17th-18th centuries with designers like Tresaguet and Telford introducing compacted stone layers and sloping shoulders. Macadam further refined the use of compacted broken stone. The document outlines the development of modern pavement design methodology and performance models, including concepts like mechanistic-empirical design, Superpave, and perpetual pavements. It concludes by describing various pavement performance tests and equipment.
This document provides an overview of the IRC method for designing flexible pavements according to IRC: 37-2012. It discusses the key considerations and calculations involved, including design traffic, subgrade properties like CBR and resilient modulus, material properties, and traffic data collection. The goal is to design a flexible pavement for a new four-lane divided national highway using the IRC guidelines and given traffic and material property data.
Heavy duty pavements are pavements subjected to the extremely heavy wheel loads associated with freight handling vehicles in industrial facilities, such as container terminals and warehouses. Heavy duty pavement need to handle many types of freight handling vehicles, such as forklifts, straddle carriers, gantry cranes and side loaders. Heavy duty pavement often deals with slow moving or even static traffic load with ultra high load magnitude. Furthermore, the load wandering for heavy duty pavement such as contain port or warehouse is more significant than normal highway or urban road pavement. The goal of pavement design is to determine the number, material composition and thickness of the different layers within a pavement structure required to accommodate a given loading regime.
Experimental investigation of inmitiable platform on heavy vehicle chassis ij...Dr.Vikas Deulgaonkar
This research paper deals with the experimental investigation of a unique platform structure by evaluation of strain through experimental technique. Strain characteristics at critical locations on the structure are evaluated for dynamic load. Strain gauge categorization for experimentation of the platform structure is described. Different nature of stresses at significant locations is evaluated with the aid of linear and rosette gauges. Present-day data acquisition systems are utilized for acquiring the strain values. Static and dynamic strain values are evaluated for constant speeds on cross-country track.
The experimentation reveals exact strain values, as there are no assumptions for measurement. Cross-country road characteristics are exactly simulated for this measurement process. The optimum vehicle speed is maintained for the entire measurement process. Tri-axial values of strains are calculated using rosette reduction technique. Linear strain values are evaluated on longitudinal members of the platform structure. Values of strain acquired different locations reveal the critical areas of the structure for possible design modifications
Pavement materials and design in western australia by geoffrey cocksEngineers Australia
This document provides an overview of pavement design methods and considerations for different types of pavements including airports, container terminals, mines, public roads, and temporary haul roads. It discusses design approaches such as empirical and mechanistic methods. It also covers topics like vehicle loads, materials selection, and comparisons of different design standards. The key points are that pavement design must account for unique factors like wheel loads, tire pressures, and traffic patterns for different facility types, and that design methods have evolved over time but still have limitations.
Track alignment refers to the direction and position of a railway track. It includes horizontal and vertical elements. An ideal alignment considers factors like purpose of the track, feasibility, economy, safety, and aesthetics. Several surveys are conducted to determine the optimal route, including reconnaissance, preliminary, and location surveys. Proper gradient design is also important for safe and smooth train operation. Gradients must consider factors like locomotive performance, train loads, and terrain. The ruling gradient is the maximum design grade, while helper gradients require extra locomotives for steep sections. Momentum gradients can be steeper using kinetic energy from descending sections.
Mechanics of strain propogation in members of a platform structure devised fo...Dr.Vikas Deulgaonkar
This research paper deals with the mechanics of mechanical strain and its propagation in a steel structure through experimental analysis of a distinctive platform integrated with vehicle chassis. Dynamic values of strain components are evaluated on all constituents of the platform structure at various critical locations. Strain gauge classification for experimentation of the platform structure is described. Different nature of stresses at significant locations is evaluated with the aid of linear and rosette gauges.
Present-day data acquisition systems are utilized for acquiring the strain values. Static and dynamic strain values are evaluated for constant speeds on cross-country track.The experimentation reveals exact strain values, as there are no assumptions for measurement. Cross-country road characteristics are exactly simulated for this measurement process.
The optimum vehicle speed is maintained for the entire measurement process. Tri-axial values of strains are calculated using rosette reduction technique. Linear strain values are evaluated on longitudinal members of the platform structure. Values of strain acquired different locations reveal the critical areas of the structure for possible design modifications.
The document provides information on pavement design, including different types of pavement structures and methods for designing asphalt and rigid pavements. It discusses asphalt pavement design using the AASHTO 1993 method, which involves determining the structural number required based on factors like traffic loading, material properties, and desired service life. It also outlines the rigid pavement design method, touching on considerations like soil properties, material selection, thickness design, drainage, and reinforcement.
Railway Engineering-Curves and superelevationMani Vel
This document discusses curves and superelevation on railways. It defines horizontal and vertical curves, and explains that superelevation involves raising the outer rail on a curve to provide a comfortable ride. Superelevation counters the effects of lateral forces when negotiating a curve. The key points are:
- Superelevation is the difference in height between the inner and outer rails and helps distribute load on both rails.
- Equilibrium speed is when the centrifugal force is balanced by the cant (superelevation), providing no unbalanced radial acceleration.
- Maximum permissible speed considers factors like radius, cant, cant deficiency/excess, and transition length.
- Examples are provided to calculate supere
Road accidents are caused by a combination of factors related to road conditions, driver behavior, and vehicle characteristics. Poor road conditions such as roughness, rutting, cracking, and low skid resistance are contributing factors in a significant percentage of accidents. Maintaining adequate road quality through measures such as resurfacing and realignment can reduce accidents by 25-60%. Proper maintenance and repair of road defects can lower accident rates and safety costs. Monitoring road measurements like IRI and PSI that indicate roughness and conducting friction testing helps identify high-risk locations and control skid resistance.
This document discusses the deterioration of bituminous roads over time due to factors like traffic loading, climate conditions, and lack of maintenance. It describes different base types, surface treatments, and distresses like cracking, rutting, and roughness that can occur. Models are presented for predicting how conditions like roughness will progress based on factors such as age, strength, and surface distresses. The effects of different maintenance activities are also addressed, as well as frameworks for scheduling routine and responsive interventions.
This document discusses pavement thickness design according to the New York State Department of Transportation guidelines. It provides an overview of flexible and rigid pavement design, including the factors considered such as traffic loading, material properties, and design methods. The key design methods covered are the ESAL-based method for projects over 1.5km in length, and the conventional method using thickness tables for shorter projects. An example calculation is provided to illustrate the ESAL method for determining equivalent single axle loads and selecting pavement thicknesses.
DESIGN OF RIGID PAVEMENT AND ITS COST-BENEFIT ANALYSIS BY USAGE OF VITRIFIED ...IAEME Publication
A country can achieve sustainable and rapid growth in all fields by improving its connectivity and transit systems. Connectivity of people to resources by improved transit mechanism results in improved living standards. Apart from other means, the major part of connectivity of any country is through road systems. Well designed and maintained pavements provide better and long lasting service. In India, all the major road systems are designed as flexible pavements only, because of their ease of construction and less time it takes to be opened to traffic operations. The major problem with flexible pavements is their design life and high maintenance costs. Also, globally reducing petrol reserves, which are used for bitumen and asphalt production are also increasing the need for alternatives. To tackle these problems, rigid pavements can be constructed. Although the cost of construction of rigid pavements is high, its long life, high load carrying capabilities and low maintenance cost will balance the initial cost aspect. Recently, many studies are being conducted on different pozzolanic admixtures which can be used as partial replacement of cement in rigid pavements, thereby reducing its cost and enhancing properties of the mix. Here, an attempt is made to reduce the construction cost of rigid pavements by incorporating Vitrified Polish Waste (VPW) as partial cement replacement in proportions of 5% for M40 grade concrete. Further, to enhance flexural properties of pavement, Recron fibre is added to optimum VPW in increments of 0.1%, then after C.C pavement is designed for two lane two way national highway and cost benefit analysis is performed.
Determining equivalent single wheel load.(ESWL) Imran Nawaz
This document discusses methods for determining equivalent single wheel loads (ESWL) and equivalent single axle loads (ESAL) for pavement design. ESWL is defined as the load from a single tire that causes the same stresses/strains as a multi-wheel load. Methods include equal stress, LCN, and FAA approaches. ESAL quantifies the effect of varying axle loads as a number of standard single axle loads. Factors like thickness and subgrade reaction are considered. Cars have minimal impact compared to trucks and buses.
Minor Project on design and analysis of flexible pavement with cement treated...PrashannaKumar2
This document is a minor project report submitted in partial fulfillment of a Bachelor of Technology degree in Civil Engineering. It discusses the design and analysis of a flexible pavement with a cement treated base course. The report was prepared by three students and submitted in October 2019 under the guidance of an associate professor. It includes the design of the flexible pavement sections based on IRC37 guidelines and analysis of the pavement layers under different traffic loads.
Whole-Body Vibrations When Riding on Rough RoadsJohan Granlund
The overall aim of this study was to ascertain the seriousness of the problem of whole-body vibration when driving on roads; ”Is the road roughness such that it entails a health hazard and/or a road safety hazard through its impact on drivers?”. Other objectives were to estimate the scope of the problem during non-frozen ground conditions, to examine the problems and potential related to measurement techniques and to point out the necessity of further research in this field.
The measurement data was collected when driving on 37 kilometres of National Highway No. 90 (Hw 90) and 21 kilometres of County Road 950 (Lv 950) in Västernorrland County. The road condition on the test stretches covered the entire range from very smooth (IRI20 = 0.43 mm/m) to very rough (IRI20 = 22.78 mm/m). Whole-body vibration was measured in compliance with the ISO 2631-1 (1997) standard “Evaluation of human exposure to whole-body vibration”. This was done on stretchers with patients in different types of ambulance and at different speeds, and on the floor and driver and passenger seats for seated occupants in some different truck configurations.
There are three main sources of vibration: road roughness, vehicle properties and driver behaviour (including choice of speed). The interpretation of the results supports the opinion that within reasonable variations in these factors, road roughness plays a considerably greater part than the other two. High-energy, multi-directional vibrations at many natural body part frequencies were found at the seats in trucks. This is serious due to the risk of resonance, meaning a greater reproduction of vibration in the parts of the body afflicted than at the surface from which the vibrations are transferred. Further, the study substantiates findings from earlier studies; i.e., that the high frequency of occupational diseases among commercial drivers, especially in the locomotor systems, is related to rough roads. This relationship is probably strongest in geographic areas where the road roughness level is high on a large percentage of the roads. Where the roughness was greatest, peak values were registered on ambulance stretchers that considerably exceed the level that completely healthy people are assumed to experience as ”extremely uncomfortable” by international standards.
During a 15-minute ride on a stretch of National Highway 90, the vibration level in one type of ambulance was high enough to pose a potential health hazard had a healthy person been exposed to it for as little as 10 minutes a day. It was shown that the vibration on the ambulance stretchers was as great as at the drivers’ seat in wheel loaders loading blasted rock, bulldozers clearing way in forests for new road construction, etc. Vibration problems are even greater in the spring due to seasonal frost damage related additional roughness.
Skid resistance of road surfaces is an important safety parameter. Decreasing skid resistance correlates with increasing number of accidents.
Skid resistance is one of the substantial factors which ensure safe travelling on automobile roads. Because of poor road safety situation, old vehicle fleet and many vehicles that are driven with old or outworn tyres there is a need to improve safety situation. Road pavements with high and long-lasting skid resistance could be a solution.
Developing pavements with high skid resistance it is essential to develop harmoniously from tyre and road contact noise and rolling resistance point of view. All these characteristics are important and related with road surface texture.
This apparatus measures the skid resistance between a rubber slider (mounted on the end of a pendulum arm) and the test surface. This provides highway engineers with a routine method of checking the resistance of wet and dry surfaces to slipping and skidding, both in the lab and on site.
The British Pendulum Skid Resistance Tester is an impact type pendulum used to measure the energy loss when a rubber slider edge is propelled over a test surface. The values measured represent the frictional properties and are expressed as BPN (British Pendulum Number).
This document provides an overview of pavement design methods and the 1993 AASHTO Guide for pavement design of both flexible and rigid pavements. It summarizes:
- The objectives and inputs considered in pavement design
- The empirical and mechanistic-empirical approaches used in the AASHTO Guide
- The key equations, parameters, and design process for both flexible and rigid pavement structures
It describes how the AASHTO Guide is based on predicting the decrease in serviceability over time under traffic loading using reliability concepts. The design process involves calculating the structural number for flexible pavements or slab thickness for rigid pavements based on traffic, materials properties, and reliability factors.
Design Considerations for AASHTO Flexible pavement designImran Nawaz
The document discusses the key factors considered in AASHTO flexible pavement design: pavement performance, traffic, roadbed soils, materials of construction, environment, drainage, and reliability. Pavement performance is measured by present serviceability index (PSI) on a scale of 0 to 5. Traffic is considered in terms of estimated single axle loads (ESALs). Roadbed soils are characterized by properties like CBR, R-value, and resilient modulus (Mr). Materials are assigned structural numbers (SN) based on properties. Drainage and environment affect Mr. Reliability ensures the design survives the design life with a given level of probability. The design process involves determining layer SNs from properties then thickness to achieve a
This review article summarizes research on factors that control skid resistance at the tire-pavement interface. It discusses key parameters such as surface texture, tire tread, temperature, and loading conditions. Pavement macrotexture, characterized by mean texture depth, is identified as the most important factor for skid resistance. Microtexture and factors that reduce surface asperities like traffic polishing also significantly impact skid resistance over time. The article provides an overview of different methods to measure skid resistance and texture in both laboratory and field settings.
Hvtt13 granlund et al lowered crash risk with banked curves designed for heav...Johan Granlund
Outer-curves are banked into superelevation in order to reduce the crash risk due to high demand for side friction between tyres and road. Road design codes use analysis of cornering forces acting on a point-mass model of a vehicle, where the Centre-of-Gravity (CoG) is assumed to be located at the tyre footprint. This may be relevant for low passenger cars. The scope here was to investigate the need for superelevation for heavy goods vehicles (HGV) with high CoG. The study used a vehicle model including both vertical and lateral position of CoG, as well as road split friction under left/right wheels. The results showed that superelevation demand increases with height and lateral displacement of CoG, and peaks when the curve is more slippery under outer wheels than under inner wheels. A conclusion was that the traditional point-mass “car model” can underestimate the superelevation needed for safe HGV operations. The paper recommends some improvements in road design codes for new curves, as well as some actions to improve safety in existing curves.
Road bumps reduce vehicle speeds on residential streets and other densely populated areas, thus improving safety and comfort for pedestrians and bicyclists. Unfortunately, the effects on health and safety for drivers and passengers passing these obstacles are rarely considered by road agencies, consultants and contractors. Many current bumps induces harmful whole-body vibration and shock when passing, even at legal speeds. Injuries can be immediate, e.g. fracture of vertebrae, or long term, e.g. low back pain. Bus drivers in many cities pass up to 40.000 bumps per year. The bumps will also cause additional longitudinal and vertical stress to the vehicle. A literature review shows that previous research on the subject of road bumps has been severely misinterpreted. As a result, bumps are in many countries today designed to cause a high maximum vertical acceleration (shock) level. To cause shocks on purpose, is in obvious conflict with ergonomic knowledge such as in directive 2002/44/EC. In a project described in this paper, a “shock-free” speed hump has been designed using vibration engineering. The new hump cause uncomfortable vibration at high driving speeds, but only a minimum of shock occur when passing. In 2003 the first hump ramps of this design were casted in Portland Cement Concrete, available from www.gunnarprefab.se
This document discusses optimizing haul road design for resource development projects in Northern Canada. It focuses on the interactions between ultra-heavy dump trucks and haul roads as a single transportation system. Stiffer road pavements can reduce rolling resistance and fuel consumption for trucks by decreasing deflection. The Critical Strain Method is advocated for more sophisticated pavement design over traditional CBR methods to model strains from heavy truck loads. A full-scale experiment is proposed to verify predicted displacements, stresses, and strains from this design method for ultra-heavy loading.
International Journal of Engineering Research and Applications (IJERA) is an open access online peer reviewed international journal that publishes research and review articles in the fields of Computer Science, Neural Networks, Electrical Engineering, Software Engineering, Information Technology, Mechanical Engineering, Chemical Engineering, Plastic Engineering, Food Technology, Textile Engineering, Nano Technology & science, Power Electronics, Electronics & Communication Engineering, Computational mathematics, Image processing, Civil Engineering, Structural Engineering, Environmental Engineering, VLSI Testing & Low Power VLSI Design etc.
Vehicle and human vibration due to road condition - ROADEX IVJohan Granlund
This present ROADEX IV follow-up report describes results from demonstration projects in Scotland, Finland, Norway and Sweden over the period 2010 to 2012, where the case study from the Beaver Road 331 in ROADEX III has been reproduced. This document also reports on a study of the influence of road maintenance standard on truck ride vibration and vehicle internal noise, with special focus on winter road condition. Furthermore it reports on a study on vibration isolation from road to truck driver’s seat, by use of a Tyre Pressure Control System (TPCS). All measurements were carried out in the period 2010 - 2012.
A high repeatability between similar truck round trips was confirmed when using the ROADEX method to assess truck drivers’ daily vibration exposure A(8). Results from measurements of truck ride quality during the demonstrations included:
* Unacceptably high levels of driver´s daily vibration dose A(8) were recorded in all of the ROADEX Partner areas (the Norwegian E6-measurements were lower than the others but still at about the EU Action Value).
* Significant compression stress in the truck drivers spine were recorded at severe road damages, such as sharp frost heaves, settlements at bridges and culverts, improper
road/bridge joints and uneven transversal joints at both old and new asphalt repairs.
* In all Partner areas, intense truck roll vibration and lateral buffeting was recorded. This confirmed a special health and safety problem in the EU Northern Periphery (NP) cold
climates.
* The pavement condition parameter RBCSV (a “truck roll vibration indicator”) was further validated in addition to the previous ROADEX III study in Sweden. At sites with very high RBCSV, there is a risk that cargo latches might break due to high lateral acceleration.
* Winter conditions in the NP can result in significant corrugations in thick ice covering nonsalted roads, and extremely uneven frost heaves. The project results show that these conditions can make the ride vibration and noise much worse than during summer conditions.
* The use of a Tyre Pressure Control System (TPCS) has previously been shown to reduce ride vibration. The present study used a more detailed analysis to quantify the TPCS vibration isolating effect. Results from Scotland and Sweden show that TPCS was very efficient in isolating “shake” vibration from short wave road roughness (megatexture < 0.5 m) such as potholes and corrugated ice surfaces.
* Vehicle body “bounce” vibration with lower frequencies (1 – 3 Hz) were not isolated by the TPCS. Such low frequency bounce vibration can only be reduced by pavement maintenance.
* High side friction demand due to improperly banked horizontal curves was found to be a contributing factor behind many loss-of-control crashes, including rollovers.
* Several curves with tragic crash records were found to be improperly banked despite being newly resurfaced.
1) The document discusses various testing items that are important during the development of a new gearbox for a European car manufacturer. It describes problems encountered related to pitting, shifting behavior, and chattering noise.
2) Solutions explored include changing tooth surface design and production processes to address pitting, optimizing spring loads to achieve desired shift forces, and reducing selecting forces on the shift tower to minimize vibrations.
3) Vehicle tests were used to validate design changes, and results showed improvements to shifting characteristics, elimination of pitting issues, and reduction of chattering noise within acceptable limits.
This document provides guidelines for using Fleet Productivity Optimization (FPO) software to analyze haul road cycle data from trucks. It discusses collecting representative data using TPMS or data loggers over complete haul cycles. Guidelines are provided for setting logging intervals and ensuring typical payload and cycle. Key features of the haul road are recorded including corners, grades, and rough sections. Composite pressure limits and indices for haul road condition, payload distribution, and overall mine severity are introduced to identify improvement opportunities.
CAD CAM pavement maintenance actions -An efficient method to reduce human who...Johan Granlund
The main source to ride vibration in vehicles is road roughness. Many professional drivers are exposed to human whole-body vibration (WBV) exceeding the limit for acceptable occupational exposure. Much vibration is at low frequencies, coinciding with resonance frequencies in road vehicle chassis, cab and seat suspension systems. Such vibration is at highway speed caused by very long wave road unevenness; from 5 m up to more than 40 m. Efficient repair of such road damages is not achieved by traditional resurfacing, but is possible with modern CAD/CAM mill and fill actions before paving the new wearing course.
Investigating Heavy Vehicle Rollover Crashes and the Influence of Road DesignJohan Granlund
Paper presented at the International Heavy Vehicle Transport Technology HVTT14 Symposia in Rotorua, New Zealand, in Nov 2016.
The HVTT conferences are organized by the International Forum for Road Transport Technology, IFRTT.
1) A study examined how increased bogie rotational resistance affects wheel and rail wear on curved sections of track used by QR National coal wagons.
2) Simulations showed that in a 304.5m radius curve, higher bogie rotational resistance caused increased wheelset angles of attack, leading to more lateral creepage on the gauge face and reduced lubrication effectiveness.
3) An alternative "curvature overrun" track transition design was proposed, aiming to reduce bogie warp and thus improve contact mechanics through the curve by providing temporary higher curvature in the transition section.
STUDY & DESIGN OF FIRE DETECTING & FIRE EXTINGUISHING ROBOTIJARIIE JOURNAL
This document discusses the design of a fire detecting and extinguishing robot. It begins with an introduction to the need for such robots in hazardous firefighting situations. It then discusses various drive mechanisms that could be used, including wheel, track, Mecanum and holonomic drives. Design considerations for each are evaluated in a decision matrix. Wheel vs track designs are also compared. The document then covers motor selection based on the robot's weight, incline and acceleration needs. Finally, it discusses how IR sensors could be used to detect fires based on detecting reflected light intensity.
This document discusses suspension systems for vehicles. It begins by defining suspension systems and their dual purposes of contributing to vehicle handling/safety while providing passenger comfort. It then describes some of the key design conflicts around suspension geometry. Specifically, it discusses how cornering forces can cause the contact patch to deform in undesirable ways. It provides examples of different suspension geometries and how they affect camber angle and contact patch deformation during turns and over bumps. The document outlines the objectives of reducing passenger discomfort, improving safety, and reducing slip during corners. It concludes by describing various properties of suspension systems that are important to consider in the design process such as spring rate, wheel rate, weight transfer, travel, damping, and more.
عرض تقديمي لتصميم طريق وكيفية ابعاد الطريقssuser09e10f
This document discusses road-vehicle performance and its impact on highway engineering and design. It covers the following key points:
- Vehicle capabilities like acceleration/braking and human factors like reaction time form the basis of roadway design guidelines.
- Tractive effort and resistance are opposing forces that determine vehicle performance. The three major sources of resistance are aerodynamic, rolling, and grade.
- Aerodynamic resistance increases with speed squared and power required increases with speed cubed. Rolling resistance depends on factors like tire and surface properties. Grade resistance depends on road slope.
- Maximum tractive effort is limited by the coefficient of road adhesion and weight transfer during acceleration or braking. Braking performance is important
Methods for reducing the wear of wheeled pairs.pptxSymbatTorebekova
This document discusses methods for reducing wear of wheeled pairs of rolling stock. It identifies main factors that influence rail and wheel wear, including spring suspension imperfections and asymmetry of wheel pairs. It also summarizes various methods used, such as surface reinforcement, profile optimization, tribomechanical materials, and lubrication of wheel combs and rails. The document outlines the development of a production complex to test new tribomechanical materials using laboratory simulations and analytical models.
Finite element development and early experimental validations for a three dim...Salvatore Scalera
The main objective of this research activity is to create a simplified FE model of this kind of vehicle useful to simulate collisions against road safety barriers in a wide range of impact conditions.
This presentation is divided into 4 parts.
In the first, data related with run-off-the-road in Italy will be discussed. In the same section, a small review of the European standard on the containment capacity level of road safety barriers will be performed. At last, it will be shown how numerical analysis of vehicles collisions against safety barriers has become a convenient methodology that supports and integrates crash test full scale.
In the second part, the finite element model of the three dimensional virtual model of a bus will be presented and some parts and joints which influence the behavior during a collision will be described in detail.
In the third section, the procedure for the validation of the FE model will be described. To evaluate the general behaviour of the finite element model of the bus, two different impacts were simulated, (i) against a concrete wall and (ii) against an H2-type barrier. The effectiveness of the adopted strategy will be plainly demonstrated.
According with the results obtained simulating the two tests described above and with the good agreement attained between full-scale and simulated outputs, an evaluation of the model will be offered in the last part of this work.
Analysis of vibration characteristics of transport utility vehicle by finite ...Dr.Vikas Deulgaonkar
This document summarizes a study that analyzed the vibration characteristics of a transport utility vehicle using finite element analysis. A computer model of the vehicle was created using surface modeling. The model was then meshed and modal analysis was performed to determine the natural frequencies and mode shapes under different loading conditions. The results identified the first six natural frequencies between 5.5-9.4 Hz and showed maximum deflections occurring in the front, mid, and rear portions of the vehicle for each mode of vibration. The study provides valuable information about the vehicle's dynamic behavior to enhance passenger comfort and safety.
Safer Curves On Multiple Lane Roads GranlundJohan Granlund
Many road users have crashed at high speed in sharp curves during slippery road conditions. To reduce the skid risk following high lateral forces, outercurves are banked into superelevation. Road designers are guided by design codes into what superelevation values to select among, given a reference speed and curve radius. Curve design codes are based on analysis of cornering forces acting on AASHO’s point-mass model of a vehicle. While the design codes typically yield curves with acceptable safety level, there is a systematic problem with skid accidents on multiple lane curves. This paper discusses a causal factor and recommends changes in curve design codes as well as actions to improve safety in existing unsafe curves. Current road design practise approximates the vehicle travelled path (and thus lateral force) by the road curvature, which is reasonable on small roads. On multiple lane roads however, many drivers are changing lane also in sharp curves since no oncoming traffic is present. When shifting lane quickly, the vehicle experience a transient “curve radius” much sharper than indicated by the road curve radius. This can yield higher lateral force than the road design code have considered. Then the superelevation may be insufficient - when the road is slippery - to outbalance the cornering force. As a rule by thumb, sharp curves on multiple lane roads with high speed traffic should have maximum allowed cross slope in order to increase stability.
Study on Hard Shifting of Gears in Transmission Box Assembly and Analysis of ...IRJET Journal
This document summarizes a study on hard shifting of gears and abnormal noise from the transmission box of four-wheeler vehicles under varying loads and speeds. The study found that hard shifting and a "kat-kat" noise were caused by worn synchronizer rings in the transmission. Replacing the synchronizer rings resolved the issues. Improper driving techniques like shifting gears at inappropriate times can accelerate wear and lead to transmission problems. Maintaining vehicles properly and avoiding water contact with the gear box can extend the life of the transmission components.
Team PYREX built a planetary rover called Animus for the 2014 Robo-Ops competition. Animus features a rocker-bogie suspension system with six-wheel drive and four-wheel steering for navigating varied terrain. It is remotely operated via 4G internet connection. Components were selected through analytical and rapid prototyping methods. Key features include a rectangular aluminum chassis, fiberglass rocker-bogie legs, 3D printed tread wheels, 13 servos, 6 motors, sensors, and a lithium battery power supply. The team's goal was to complete objectives while establishing experience for future competitions.
This document summarizes a technical paper about designing and tuning air suspensions for tractors. It discusses the challenges of achieving a balance between ride comfort and handling for tractor-trailer combinations, given their mass distribution and the influence of the trailer on dynamics. The paper presents the development of a new primary air suspension system for a Volkswagen tractor to improve comfort, protect fragile loads, and allow for different trailer configurations while maintaining other vehicle characteristics. A mixed suspension using springs in front and air bags in the rear was selected based on its benefits and ability to meet design goals. The tuning process and methods used to evaluate and optimize the suspension are also described.
Similar to Measuring pavement deflection variance at highway speeds (20)
A new method for testing pavement condition combines laser/inertial profilometry of unloaded pavement with vibration measurements in a full loaded heavy truck at highway speed. Three types of results are obtained.
1: Truck wheel, frame and cab vibration, as well as driver seat vibration to be compared with exposure guidelines in ISO 2631-1 and limits in directive 2002/44/EC.
2: Three-dimensional road surface geometry data for simulation of ride and calculation of roughness indices.
3: Locations of potential pavement "soft spots". The latter is possible since large pavement deflection variance under the heavy truck cause a quite different vehicle vibration pattern than the pattern excited from the measured unloaded road surface profile.
A tentative accuracy experiment has been done. Recorded seat vibration levels were very high, thus exceeding the EU Action Value in all test runs. The soft spot indications show reasonable repeatability, as well as reproducibility between different driving speeds and between spring time and autumn. Trueness is the most difficult accuracy feature to estimate, since no ideal reference method is at hand neither for variance of local deflection under truck wheel, nor for global deflection under the entire truck. By comparison with FWD, coring and ground penetrating radar results, trueness seems promising. During the tests, a virtual tyre footprint sensor was used for road profiling. Evaluation showed it to bring a large improvement to profiling accuracy. The new high speed measurement method brings excellent opportunities for further research on the entire chain pavement-truck-ride quality interaction.
Accurate Measurement of Runway Pavement GeometriesJohan Granlund
Paper presented at the Airfield Ad-hoc Working Group Meeting, arranged as a satellite conference during the 23rd PIARC World Road Congress held in Paris, France, 2007.
TRAFFIC CALMING AT MOBILE ROADWORK ZONES: USE OF VEHICLE-MOUNTED RADAR TO EV...Johan Granlund
This document summarizes a study that evaluated the use of variable message signs (VMS) mounted on slow-moving road marking vehicles to reduce speeds of passing vehicles. The study found that without the VMS activated, average speeds and top speeds of passing vehicles were very high, posing an unacceptable safety risk. However, when the VMS displaying the maximum recommended speed was activated, average speeds dropped by 22 km/h on wide roads and the mean speed of the ten fastest vehicles dropped by 16 km/h. The percentage of vehicles driving at extremely high hazardous speeds over 70 km/h dropped dramatically from 62% to 12%, an 81% reduction. As a result, Swedish legislation is being reviewed to allow the use of this type
TRAFFIC CALMING AT STATIONARY SHORT-TERM ROADWORK ZONESJohan Granlund
High speeds near roadwork zones endanger workers and drivers. The Swedish Road Administration sought ideas to improve safety. Over 130 proposals were submitted, and testing was done on traffic calming and control methods for short-term and median barrier repair work zones. The methods reduced speeds and drivers generally approved of the convoy traffic management for median barrier repairs, which also showed maximum controlled traffic volumes before delays increased.
Bildspel från föredrag inom Vecturas ledarutveckling.
Målet var att föra fram organisationen mot ännu bättre resultat.
Innehåll:
• Ledarskapsteorin ”Utvecklande Ledarskap”.
• Att leda i framtidens samhälle.
• Tre ledarstilar i korthet.
• Att skapa positiva känslor.
• Utvecklande beteenden.
Geometrisk vägbeläggningsprojektering inför mötesfri landsvägJohan Granlund
Geometrisk projektering och datorstödd maskinstyrning vid underhåll eller ombyggnad av vägbanans beläggning skapar en rad nyttor:
* Förbättrad färdkvalitet för trafikanterna.
* Minskad risk för trafikolyckor.
* Minskad risk under ambulanstransporter (ca 1500 avlidna/år).
* Minskad förbrukning av vägsalt.
* Bättre produktionsplanering och ekonomistyrning för vägprojekt.
* Minskade kostnader för framtida underhåll av vägbana och vägräcken.
Uppsats från Vägverkets konferens om mötesfria vägar med växelvis omkörningsfält och mittbarriär, så kallade 2+1 vägar.
Vägnära häckar, buskar, träd och annan växtlighet i BäsnaJohan Granlund
Information om vägföreningens respektive fastighetsägares ansvar:
Säker och framkomlig trafik på bostadsgator kräver fri sikt. Varje år skadas människor i onödan för att sikten skyms. Du som har en häck, träd, mur eller staket mot en gata måste se till att sikten är fri. Några enkla åtgärder före och under sommaren kan rädda liv.
Kan jämnhetsstandarden hos det svenska vägnätet förorsaka fordonsskador och o...Johan Granlund
Johans kommentarer till rubricerat VTI Notat 21-1998:
I VTI notat 21-1998 dras slutsatsen att ”det svenska vägnätet är av så god jämnhetsstandard att av bristande jämnhet förorsakat fordonsslitage och / eller skador bör vara av tämligen marginell betydelse, sett i relation till de totala fordonskostnaderna”. Slutsatsen baseras på studier utförda utan hänsyn till andra brottmekanismer än utmattning, utan inverkan av kallt klimat, utifrån påkänningsmätningar i fordon som avviker stort från vanliga svenska lastbilsekipage (totalviktsskillnader på ca 2200 % mellan mätningens sportbil och en vanlig, lagligt lastad, svensk 4-axlad tung släpvagn), samt utan hänsyn till att Vägverkets rutinmässiga vägytemätningar, vilka avser mindre än en femtedel av det svenska vägnätet, har bruksvillkoret ”otjälad vägbana”. Nämnda bruksvillkor medför en snedvriden bild av ens det statliga belagda vägnätets tillstånd sett över hela året. Enligt här redovisad översiktlig verksamhetsuppföljning hos svenska aktörer inom transportnäringen, medför vägojämnheter på svenska vägar sannolikt mycket stora merkostnader för slitage och skador. I vissa fall medför vägojämnheterna att speditörer vägrar utföra transporter, vilket utgör ett hot mot näringsliv i glesbygd och ytterst mot landets tillväxt. Merkostnaderna för skador och slitage kan sannolikt motsvara en betydande andel av annuiteten av kostnaderna för ett vanligt underhållsprojekt. Transportörernas merkostnader härrör från skador som fjäderstocksbrott, axelbrott, rambrott (!) och liknande, samt från slitage av däck, bromsbelägg, draganordningar mm, samt indirekta kostnader. Fortsatt forskning förefaller ha hög nyttopotential och bör inriktas på monetär kvantifiering av merkostnader för tung trafik pga tjälrelaterade ojämnheter, trumslag och kanthäng. Refererad slutsats i VTI notat 21-1998 framstår som felaktigt underbyggd, och notatet i helhet som starkt vilseledande.
Bildspel från redovisning av hastighetsmätning med radar på länsvägen förbi skolan i Bäsna by (Gagnefs kommun, Dalarnas län), med dess dagis, förskoleklass samt lågstadium klass 1 - 3.
Hastighetsmätning utförd år 2006.
Bildspel från mitt föredrag vid Load Up North i Umeå, 2019.
Exempel på allvarliga fel och brister i Trafikverkets däckrapport:
• Ingen hänsyn till risk för livsfarliga vältolyckor.
• Vägslitage beräknat för irrelevanta lastfall 50 á 60 kN på standard 385 mm breddäck, dvs olaglig överlast.
• Ingen hänsyn till minskad dynamisk vägbelastning.
• Missat att högkapacitetsfordon ger sänkt axellast på alla vägar, inkl. BK4, och radikalt minskat vägslitage i synnerhet på de 4300 km svagaste vägarna (BK2 & BK3).
• Däckrapporten saknar uppdelning av hur kostnad för vägunderhåll påverkas av trafiklast respektive klimat, byggfel mm. Enligt Vägverket (2000) vållas inte mer än 1/4
av kostnaden av trafiklast.
• Helt orealistiskt överdriven uppskattning av vägunderhållskostnad från trafik.
Ansvarsfull hänsyn inkluderar att se möjligheter, snarare än överdriva problem.
Samhället vinner på att låta åkaren välja däckkonfiguration.
Polisen saknar lagrum att bötfälla åkare som kör med enkelmontage på väg där TRV kräver dubbelmontage.
Minska vältrisken vid körning med hög tyngdpunkt, VETA GranlundJohan Granlund
Bildspel från föredrag vid Mittia Skogstransportmässa 2019.
Innehåll:
Fokus på de livsfarliga vältolyckorna.
Video om förebyggande av vältolyckor.
TYA handbok om körning med hög tyngdpunkt.
Haveriutredning av svenskt timmerekipage vid E6 Svinesundparken.
Vägens utformning; i flera fall farliga brister t o m i vägreglerna!
Vägens bärighet; ofta svag vägkant vid vältolyckor med lastbil.
Vägens säkerhetszon.
Bristande vägkvalitet är miljöboven - inte dubbdäckenJohan Granlund
Artikel i Nordsverige om trafikant- och miljönyttor med stålhård porfyr i asfaltslitlager och till dammfri halkstopp. Vid tillverkning av asfalt blandas grus och sand i olika fraktioner med bindemedlet bitumen. Till slitlager på högtrafikerade vägar används sedan länge hård specialsten i asfaltgrusets grövsta fraktion, medan en utbredd praxis är att fingruset och sanden är av ortens svaga bergmaterial. De mindre kornen tål därmed inte slitage från dubbade vinterdäck, medan de grövre kornen tål dubbslitage. Detta gör att redan efter kort tids trafikering så får asfaltens yta i hjulspåren mycket 'rå' textur, medan spårslitaget hålls i schack av det hårda grova grusets stentoppar. Dubbarnas slitage av fingruset ger luftburna partiklar som kan påverka hälsan. Den råa vägytan ger ohälsosamt trafikbuller både i fordon och till vägnära miljöer, samt ökat rullmotstånd och därmed ökad förbrukning av drivmedel (energi) och mer avgasutsläpp så som av växthusgasen koldioxid samt toxiska kväveoxider. Genom att istället i ALLA ballastfraktioner ersätta ortens svaga berg med stålhård porfyr så minskas slitaget av vägytans textur, så att luftkvaliteten hålls uppe.
Tätortsluftens kvalitet hålls också bättre genom att halkbekämpa med halkstopp av stålhård porfyr istället för med vintersand av ortens mjuka gråberg.
Optimalt däckval; dubbel- eller enkelmontage?Johan Granlund
Bildspel från föredrag vid Sveriges Åkeriföretags konferens 'Effektivare transporter' 2019.
Sammanfattning av åkerinäringens granskning av Trafikverkets däckrapport 'Konsekvenser av olika däckskonfigurationer för tunga fordons inverkan på vägnätet'.
Bildspel från föredrag vid Sveriges Åkeriföretags konferens 'Effektivare Transporter' 2019.
Sammanfattning av uppdragsrapport 'Förkortad väglivslängd; orsaker och kostnader', framtagen för den svenska åkerinäringen.
Bildspel från föredrag vid PRO Dalarnas trafiksäkerhetsdag 2019. Den mest typiska dödsolyckan sker i farligt tvär eller nypande, feldoserad kurva på lågtrafikerad länsväg med 50 - 80 km/tim hastighetsgräns och med smala körfält, smal vägren samt brant vägslänt. För att effektivt minska antalet svåra trafikolyckor behövs ökning av drift och underhåll på länsvägarna.
Fallstudie av beläggningsunderhåll på enskilt vägnät, Strategi och taktiskt g...Johan Granlund
Bildspel från föredrag vid förbundsstämma 2019 i Riksförbundet Enskilda Vägar. Bäsna Vägars Samfällighet har beslutat om vision och strategi för beläggningsunderhållet. Föredraget visar hur vägåtgärderna har taktiskt genomförts under sex år; dåliga och goda erfarenheter, samt visar framtiden för vägunderhållet på byns enskilda vägnät.
Reduced Pavement Service Life - Causes and Costs, HVTT15 slidesJohan Granlund
The document summarizes an inquiry conducted by the Swedish haulage industry in response to a government inquiry on road wear costs and taxation. The industry's inquiry found that: 1) 75% of pavement repair costs are due to non-traffic factors while 25% are due to traffic, 2) using a 4th power law, the road repair cost per ton-kilometer was calculated for 11 types of HGVs with two-axle lorries and EU semitrailer rigs found to cause the highest costs, and 3) 74-tonne high capacity vehicles cause the lowest road repair costs. After this finding, the government cancelled its proposed fee for road wear which was found to be 8 times higher than actual costs
Reduced Pavement Service Life - Causes and Costs, HVTT15 paperJohan Granlund
- A study was conducted to analyze the causes and costs of reduced pavement service life in Sweden due to increasing vehicle weight limits.
- Non-traffic related factors like winter tires, road salt, construction errors, and lack of maintenance account for about 75% of reduced pavement life.
- Traffic-related pavement damage costs were estimated to be 0.091 billion euros annually based on vehicle traffic data and damage models.
- The analysis calculated pavement damage costs for 11 vehicle combinations and found costs varied widely, with higher weights not necessarily causing more damage per ton carried depending on axle configuration.
- The study concluded that proposed road wear fees were too high and not reflective of actual costs, and the government withdrew their proposal
Lysbilde fra mitt inlegg 'Trafikksikker fremkommelighet' ved Vegsikringskonferansen 2018 i Lillehammer, arransjert av Trafikksikkerhetsforeningen:
* Antall drepte i vegtrafikk øker nå i Sverige; mine teorier om hvorfor.
* Typiske kjennetegn av ulykkessted.
* Sverige vil stoppe vinterfarlige EU-semitrailers med kort trekkvogn.
* «Vinterdekk» på tungbil: Bedre krav enn M+S må innføres.
* Skråkant på veidekke og oppgrusing av skulder sparer liv. Nå införer Sverige skråkant, mens Norge tappet kravet sitt.
* Erfaringer fra trafikkulykker => Bedre normaler & veiadministrasjon.
Building Production Ready Search Pipelines with Spark and MilvusZilliz
Spark is the widely used ETL tool for processing, indexing and ingesting data to serving stack for search. Milvus is the production-ready open-source vector database. In this talk we will show how to use Spark to process unstructured data to extract vector representations, and push the vectors to Milvus vector database for search serving.
AI 101: An Introduction to the Basics and Impact of Artificial IntelligenceIndexBug
Imagine a world where machines not only perform tasks but also learn, adapt, and make decisions. This is the promise of Artificial Intelligence (AI), a technology that's not just enhancing our lives but revolutionizing entire industries.
Programming Foundation Models with DSPy - Meetup SlidesZilliz
Prompting language models is hard, while programming language models is easy. In this talk, I will discuss the state-of-the-art framework DSPy for programming foundation models with its powerful optimizers and runtime constraint system.
HCL Notes and Domino License Cost Reduction in the World of DLAUpanagenda
Webinar Recording: https://www.panagenda.com/webinars/hcl-notes-and-domino-license-cost-reduction-in-the-world-of-dlau/
The introduction of DLAU and the CCB & CCX licensing model caused quite a stir in the HCL community. As a Notes and Domino customer, you may have faced challenges with unexpected user counts and license costs. You probably have questions on how this new licensing approach works and how to benefit from it. Most importantly, you likely have budget constraints and want to save money where possible. Don’t worry, we can help with all of this!
We’ll show you how to fix common misconfigurations that cause higher-than-expected user counts, and how to identify accounts which you can deactivate to save money. There are also frequent patterns that can cause unnecessary cost, like using a person document instead of a mail-in for shared mailboxes. We’ll provide examples and solutions for those as well. And naturally we’ll explain the new licensing model.
Join HCL Ambassador Marc Thomas in this webinar with a special guest appearance from Franz Walder. It will give you the tools and know-how to stay on top of what is going on with Domino licensing. You will be able lower your cost through an optimized configuration and keep it low going forward.
These topics will be covered
- Reducing license cost by finding and fixing misconfigurations and superfluous accounts
- How do CCB and CCX licenses really work?
- Understanding the DLAU tool and how to best utilize it
- Tips for common problem areas, like team mailboxes, functional/test users, etc
- Practical examples and best practices to implement right away
Unlock the Future of Search with MongoDB Atlas_ Vector Search Unleashed.pdfMalak Abu Hammad
Discover how MongoDB Atlas and vector search technology can revolutionize your application's search capabilities. This comprehensive presentation covers:
* What is Vector Search?
* Importance and benefits of vector search
* Practical use cases across various industries
* Step-by-step implementation guide
* Live demos with code snippets
* Enhancing LLM capabilities with vector search
* Best practices and optimization strategies
Perfect for developers, AI enthusiasts, and tech leaders. Learn how to leverage MongoDB Atlas to deliver highly relevant, context-aware search results, transforming your data retrieval process. Stay ahead in tech innovation and maximize the potential of your applications.
#MongoDB #VectorSearch #AI #SemanticSearch #TechInnovation #DataScience #LLM #MachineLearning #SearchTechnology
GraphRAG for Life Science to increase LLM accuracyTomaz Bratanic
GraphRAG for life science domain, where you retriever information from biomedical knowledge graphs using LLMs to increase the accuracy and performance of generated answers
Digital Marketing Trends in 2024 | Guide for Staying AheadWask
https://www.wask.co/ebooks/digital-marketing-trends-in-2024
Feeling lost in the digital marketing whirlwind of 2024? Technology is changing, consumer habits are evolving, and staying ahead of the curve feels like a never-ending pursuit. This e-book is your compass. Dive into actionable insights to handle the complexities of modern marketing. From hyper-personalization to the power of user-generated content, learn how to build long-term relationships with your audience and unlock the secrets to success in the ever-shifting digital landscape.
Introduction of Cybersecurity with OSS at Code Europe 2024Hiroshi SHIBATA
I develop the Ruby programming language, RubyGems, and Bundler, which are package managers for Ruby. Today, I will introduce how to enhance the security of your application using open-source software (OSS) examples from Ruby and RubyGems.
The first topic is CVE (Common Vulnerabilities and Exposures). I have published CVEs many times. But what exactly is a CVE? I'll provide a basic understanding of CVEs and explain how to detect and handle vulnerabilities in OSS.
Next, let's discuss package managers. Package managers play a critical role in the OSS ecosystem. I'll explain how to manage library dependencies in your application.
I'll share insights into how the Ruby and RubyGems core team works to keep our ecosystem safe. By the end of this talk, you'll have a better understanding of how to safeguard your code.
TrustArc Webinar - 2024 Global Privacy SurveyTrustArc
How does your privacy program stack up against your peers? What challenges are privacy teams tackling and prioritizing in 2024?
In the fifth annual Global Privacy Benchmarks Survey, we asked over 1,800 global privacy professionals and business executives to share their perspectives on the current state of privacy inside and outside of their organizations. This year’s report focused on emerging areas of importance for privacy and compliance professionals, including considerations and implications of Artificial Intelligence (AI) technologies, building brand trust, and different approaches for achieving higher privacy competence scores.
See how organizational priorities and strategic approaches to data security and privacy are evolving around the globe.
This webinar will review:
- The top 10 privacy insights from the fifth annual Global Privacy Benchmarks Survey
- The top challenges for privacy leaders, practitioners, and organizations in 2024
- Key themes to consider in developing and maintaining your privacy program
Ocean lotus Threat actors project by John Sitima 2024 (1).pptxSitimaJohn
Ocean Lotus cyber threat actors represent a sophisticated, persistent, and politically motivated group that poses a significant risk to organizations and individuals in the Southeast Asian region. Their continuous evolution and adaptability underscore the need for robust cybersecurity measures and international cooperation to identify and mitigate the threats posed by such advanced persistent threat groups.
Main news related to the CCS TSI 2023 (2023/1695)Jakub Marek
An English 🇬🇧 translation of a presentation to the speech I gave about the main changes brought by CCS TSI 2023 at the biggest Czech conference on Communications and signalling systems on Railways, which was held in Clarion Hotel Olomouc from 7th to 9th November 2023 (konferenceszt.cz). Attended by around 500 participants and 200 on-line followers.
The original Czech 🇨🇿 version of the presentation can be found here: https://www.slideshare.net/slideshow/hlavni-novinky-souvisejici-s-ccs-tsi-2023-2023-1695/269688092 .
The videorecording (in Czech) from the presentation is available here: https://youtu.be/WzjJWm4IyPk?si=SImb06tuXGb30BEH .
Skybuffer SAM4U tool for SAP license adoptionTatiana Kojar
Manage and optimize your license adoption and consumption with SAM4U, an SAP free customer software asset management tool.
SAM4U, an SAP complimentary software asset management tool for customers, delivers a detailed and well-structured overview of license inventory and usage with a user-friendly interface. We offer a hosted, cost-effective, and performance-optimized SAM4U setup in the Skybuffer Cloud environment. You retain ownership of the system and data, while we manage the ABAP 7.58 infrastructure, ensuring fixed Total Cost of Ownership (TCO) and exceptional services through the SAP Fiori interface.
For the full video of this presentation, please visit: https://www.edge-ai-vision.com/2024/06/building-and-scaling-ai-applications-with-the-nx-ai-manager-a-presentation-from-network-optix/
Robin van Emden, Senior Director of Data Science at Network Optix, presents the “Building and Scaling AI Applications with the Nx AI Manager,” tutorial at the May 2024 Embedded Vision Summit.
In this presentation, van Emden covers the basics of scaling edge AI solutions using the Nx tool kit. He emphasizes the process of developing AI models and deploying them globally. He also showcases the conversion of AI models and the creation of effective edge AI pipelines, with a focus on pre-processing, model conversion, selecting the appropriate inference engine for the target hardware and post-processing.
van Emden shows how Nx can simplify the developer’s life and facilitate a rapid transition from concept to production-ready applications.He provides valuable insights into developing scalable and efficient edge AI solutions, with a strong focus on practical implementation.
OpenID AuthZEN Interop Read Out - AuthorizationDavid Brossard
During Identiverse 2024 and EIC 2024, members of the OpenID AuthZEN WG got together and demoed their authorization endpoints conforming to the AuthZEN API
Taking AI to the Next Level in Manufacturing.pdfssuserfac0301
Read Taking AI to the Next Level in Manufacturing to gain insights on AI adoption in the manufacturing industry, such as:
1. How quickly AI is being implemented in manufacturing.
2. Which barriers stand in the way of AI adoption.
3. How data quality and governance form the backbone of AI.
4. Organizational processes and structures that may inhibit effective AI adoption.
6. Ideas and approaches to help build your organization's AI strategy.
Measuring pavement deflection variance at highway speeds
1. Measuring Pavement Deflection Variance at Highway Speeds
J. Granlund, C. Lenngren & F. Lindström
Road and Traffic Business Area, Consulting Services, Swedish Road Administration
B. Mårtensson
Road Engineering, Society and Traffic, Swedish Road Administration
ABSTRACT: A new method for testing pavement condition combines laser/inertial
profilometry of unloaded pavement with vibration measurements in a full loaded heavy truck
at highway speed. Three types of results are obtained. 1: Truck wheel, frame and cab
vibration, as well as driver seat vibration to be compared with exposure guidelines in ISO
2631-1 and limits in directive 2002/44/EC. 2: Three-dimensional road surface geometry data
for simulation of ride and calculation of roughness indices. 3: Locations of potential pavement
"soft spots". The latter is possible since large pavement deflection variance under the heavy
truck cause a quite different vehicle vibration pattern than the pattern excited from the
measured unloaded road surface profile. A tentative accuracy experiment has been done at 4
sites. Recorded seat vibration levels were very high, thus exceeding the EU Action Value in
all test runs. The soft spot indications show reasonable repeatability, as well as reproducibility
between different driving speeds and between spring time and autumn. Trueness is the most
difficult accuracy feature to estimate, since no ideal reference method is at hand neither for
variance of local deflection under truck wheel, nor for global deflection under the entire truck.
By comparison with FWD, coring and ground penetrating radar results, trueness seems
promising. During the tests, a virtual tyre footprint sensor was used for road profiling.
Evaluation showed it to bring a large improvement to profiling accuracy. The new high speed
measurement method brings excellent opportunities for further research on the entire chain
pavement-truck-ride quality interaction.
KEY WORDS: Ride, soft spots, truck, vibration.
1 PAVEMENT DEFLECTION VARIANCE AND HEAVY VEHICLE RIDE
In-vehicle vibration has a negative effect on vehicle driver and passenger health, as well as on
traffic safety. European limits for the maximum exposure of professional drivers to vibration
are set in directive 2002/44/EC, and these limits are adopted in each EU member state
national laws before 6 July 2005.
Forsén (1999) showed that heavy vehicle cab vibration are primarily influenced by road
condition and velocity, secondary by vehicle properties such as sprung / unsprung masses,
stiffness, damping et c.
Heavy vehicles perceive not only the static surface roughness, but also a dynamic
roughness component when the road has “soft spots”. Pavement deflection is typically less
than two millimetres under a moving heavy vehicle. This magnitude is comparable with road
wearing course texture. The texture however, is smoothened by the tyre’s “enveloping effect”.
2. 2
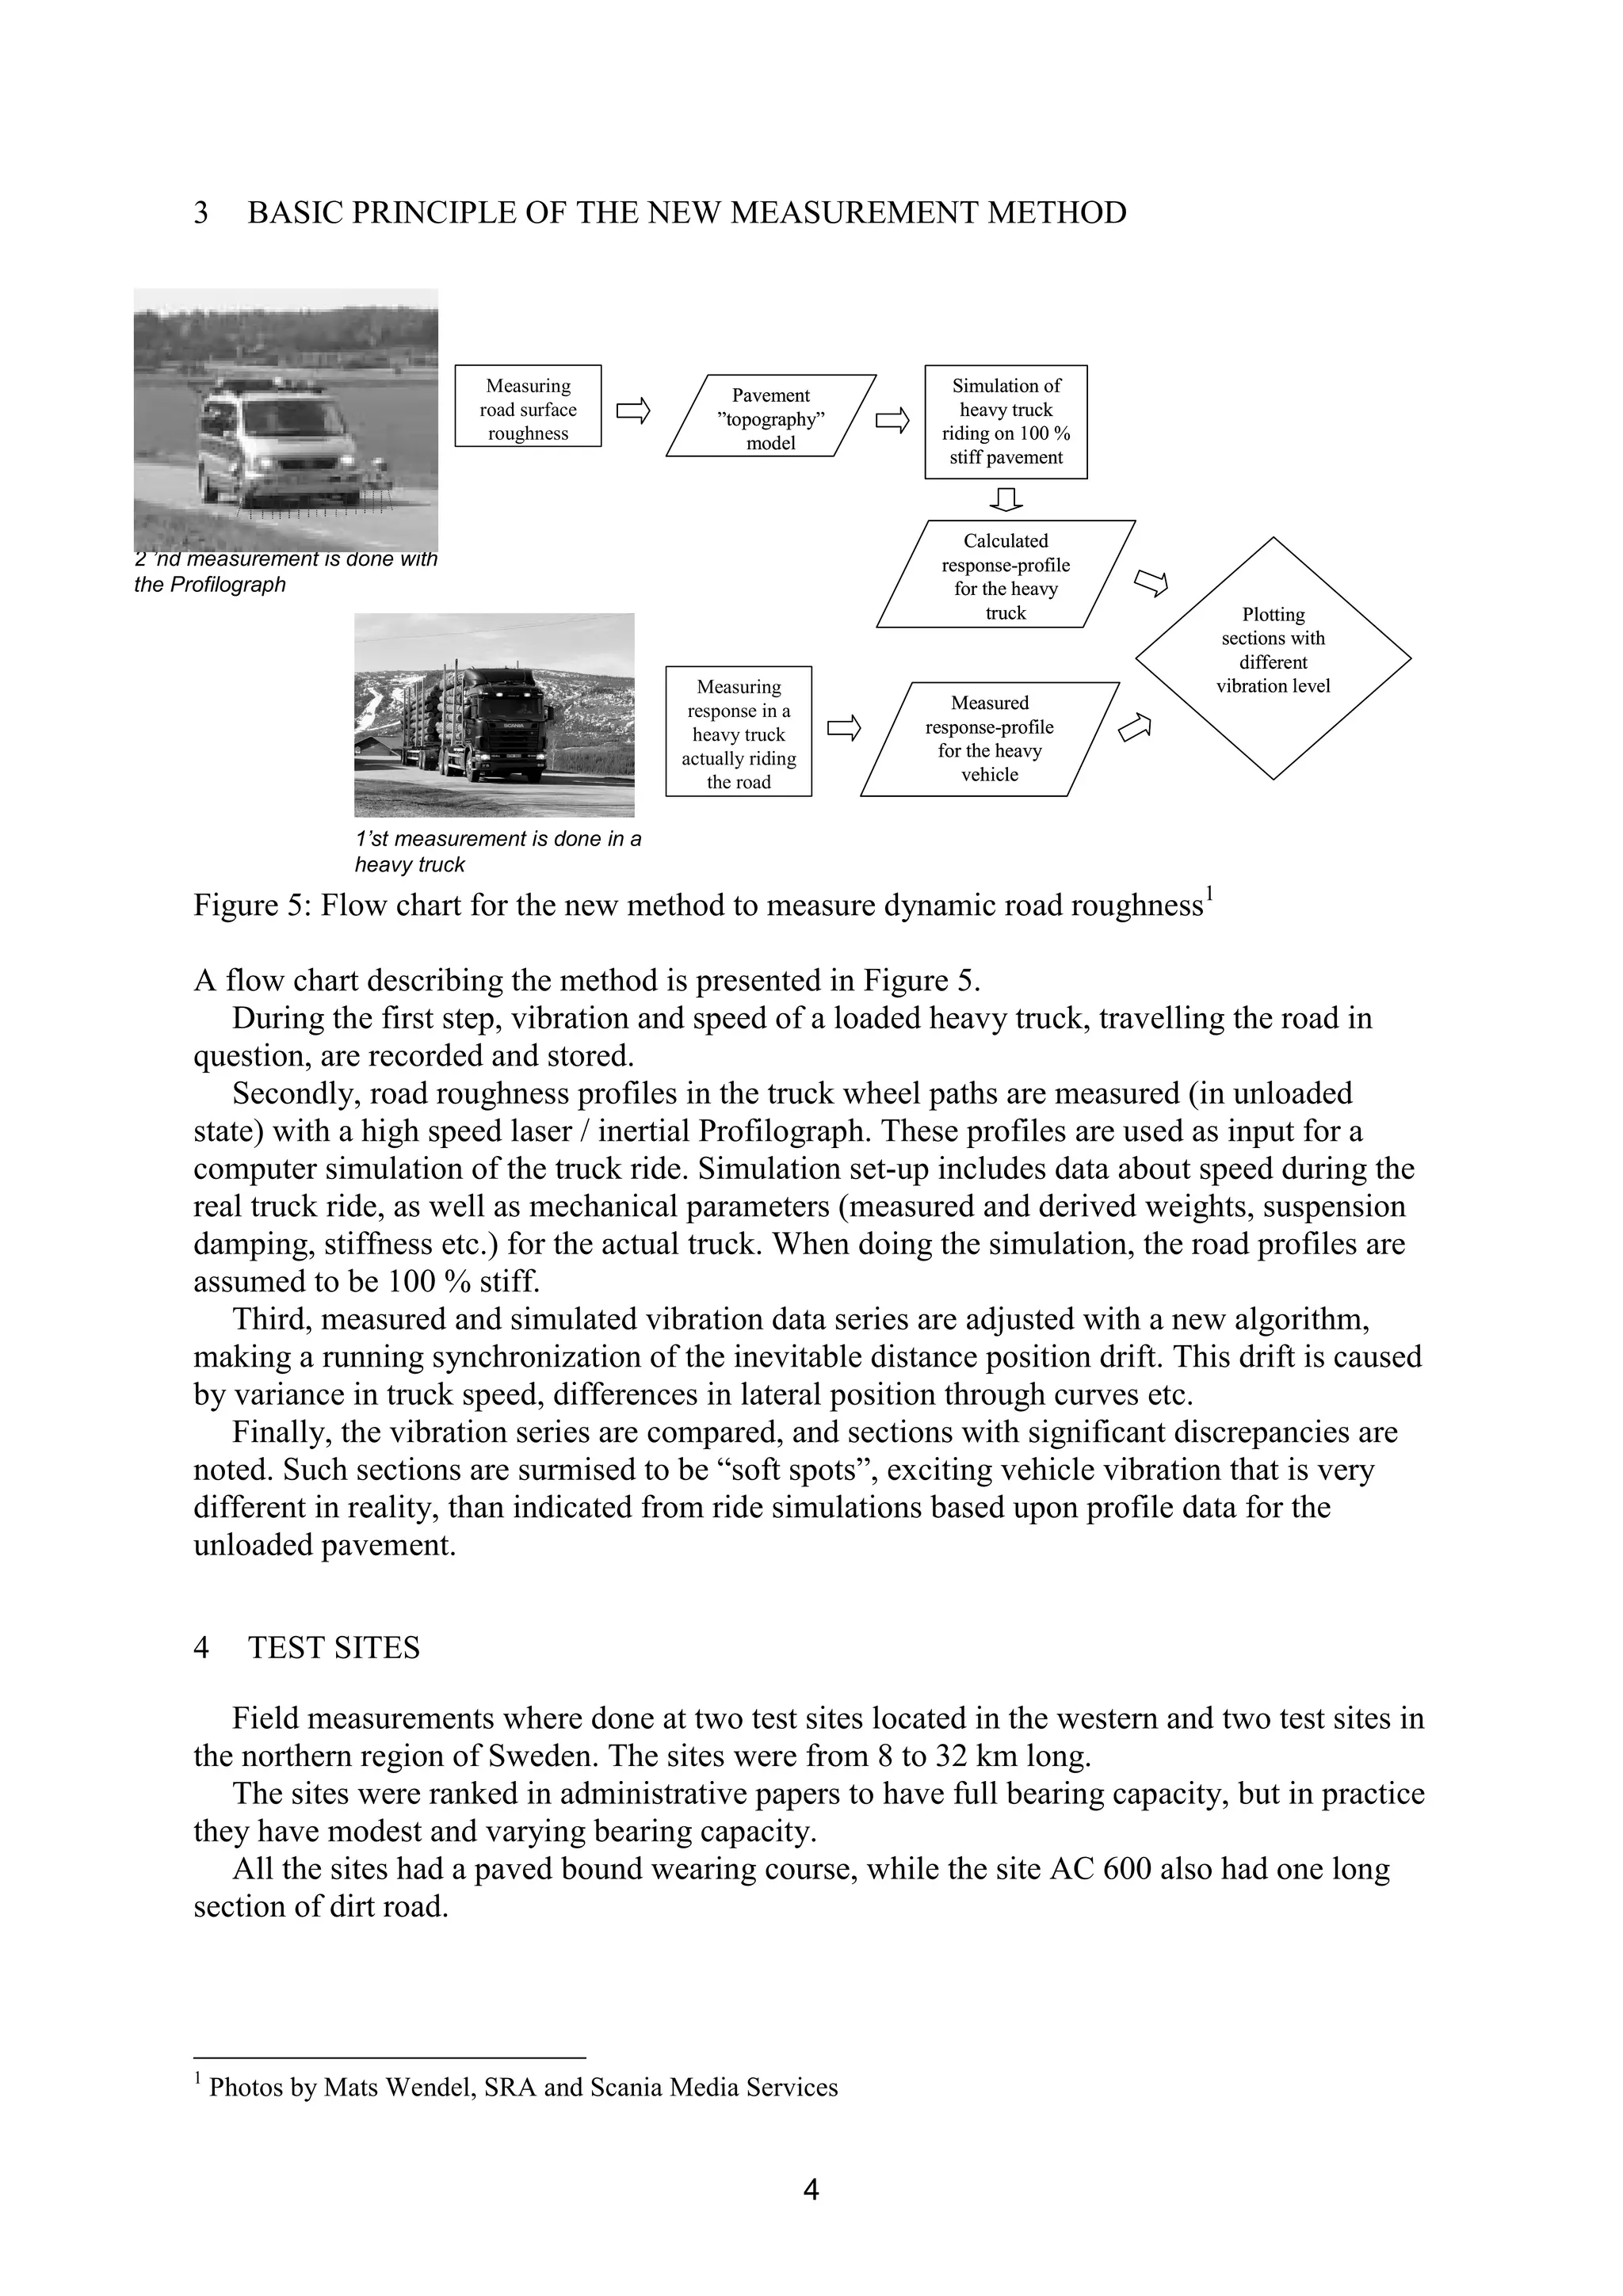
The mentioned two mm is smaller than typical road roughness amplitudes. So, when
comparing to static profile heights, ride quality impact of deflections seems neglectable. But
is this really true?
The ISO 2631-1 (1997) standard for evaluation of human exposure to vibration tells that
ride comfort is associated with vehicle cab motion in terms of vibration acceleration and
vibration velocity, rather than vibration displacement. This makes sense; otherwise a stiff
sports car would be considered more comfortable than a soft luxury car when riding on
bumpy roads.
As seen in Figure 1, the time domain vehicle vertical vibration acceleration is associated
with space domain excitation from road roughness profile slope variance, rather than
roughness profile height. Of course speed and suspension properties contribute due to
attenuation or amplification, but the basic excitation follows the relations given in Figure 1.
Figure 1: Relating road roughness to vehicle vertical vibration during ride1
So, even if pavement deflection under heavy vehicles with few exceptions would not be
larger than about one or two millimetres, significant vehicle vibration acceleration may occur
if the deflection profile varies rapidly in terms of large slope variance.
Ahlin, et al. (2000) made an unexpected observation when comparing road roughness with
ride vibration in ambulances and heavy trucks. As can be seen in Figure 2, when surface
roughness drops to zero, significant seat vibration remains in heavy trucks while stretcher
vibration drops to almost zero in ambulance cars. In the trucks, the threshold of the weighted
vibration acceleration was as high as 0.2 m/s2
rms. This value is to be compared with the
Action Value of 0.5 m/s2
rms over 8 hours, stated in directive 2002/44/EC. Clearly, other
factors than road surface roughness can bring as much as 0.2 / 0.5 = 40 % of the allowed truck
seat vibration.
Some possible causal factors behind the 0.2 m/s2
threshold truck vibration in Figure 2 are
wind load, excentric tyre stiffness, heterogeneous tyre/rim geometry, combustion pulses from
the powerful truck engine and unbalance in the power train. However, the hypothesis in this
study states that the 0.2 m/s2
rms threshold partially relates to pavement deflection profile
slope variance (dynamic roughness; soft spots).
1
Photo from SRA publication 2000:31E
Roughness geometry Vertical motions during ride
Level, depth, height [mm]
Slope from hollow to ridge [mm/m]
Slope variance [mm/m2]
Displacement, height [mm]
Vibration velocity [mm/s]
Vibration acceleration [mm/s2], [m/s2]
3. 3
Figure 2: Relation between surface roughness and ride quality domain vibration.
Soft spots and other dynamic roughness under heavy vehicles are expected where:
• the pavement bearing capacity is poor,
• subgrade stiffness changes drastically from soft soil to solid rock et c,
• blocks have due to frost activities moved up to just beneath the asphalt course,
• spring thaw bring large pore water pressures inside the pavement, thereby reducing the
inter-particle friction and effective stress,
• the asphalt bound top layers are severely cracked.
2 OBJECTIVES
The paper objective is to present results from a tentative accuracy experiment with the new
pavement condition measurement method.
One objective in the accuracy experiment was to test the hypothesis that previously
observed threshold truck cab vibration partially relate to pavement deflection profile slope
variance (dynamic roughness; soft spots).
If the patented soft spot measurement method turns out to have enough trueness and
precision, the only equipment needed would be a heavy truck with full payload, instrumented
with a laser/inertial profilometry system.
A major risk factor for the development of the new measurement method is that the
profiling method, or the vehicle simulation models, might not be accurate enough. That would
affect correlation quality significantly. If this would be the case, such a finding would
pinpoint an urgent need for better profiling practices and/or vehicle simulation models also in
order to perform traditional road surface condition assessment. Thus, regardless the risk of not
succeeding with the new method, this research will give input to improved pavement
management in total.
Trucks and ambulances
Model for predicting translational vibrations
from International Roughness Index
0.0
0.5
1.0
1.5
2.0
2.5
0 1 2 3 4 5 6 7 8
IRI [mm/m], average during 100m
MICU ambulance, 120 km/h Emergency ambulance, 90 km/h
New Truck + Trailer, unloaded, 75 km/h Old Truck + Trailer, unloaded, 75 km/h
"The Golden Car" (only z-direction) A little uncomfortable
Fairly uncomfortable Uncomfortable
Very uncomfortable Extremely uncomfortable
4. 4
3 BASIC PRINCIPLE OF THE NEW MEASUREMENT METHOD
Figure 5: Flow chart for the new method to measure dynamic road roughness1
A flow chart describing the method is presented in Figure 5.
During the first step, vibration and speed of a loaded heavy truck, travelling the road in
question, are recorded and stored.
Secondly, road roughness profiles in the truck wheel paths are measured (in unloaded
state) with a high speed laser / inertial Profilograph. These profiles are used as input for a
computer simulation of the truck ride. Simulation set-up includes data about speed during the
real truck ride, as well as mechanical parameters (measured and derived weights, suspension
damping, stiffness etc.) for the actual truck. When doing the simulation, the road profiles are
assumed to be 100 % stiff.
Third, measured and simulated vibration data series are adjusted with a new algorithm,
making a running synchronization of the inevitable distance position drift. This drift is caused
by variance in truck speed, differences in lateral position through curves etc.
Finally, the vibration series are compared, and sections with significant discrepancies are
noted. Such sections are surmised to be “soft spots”, exciting vehicle vibration that is very
different in reality, than indicated from ride simulations based upon profile data for the
unloaded pavement.
4 TEST SITES
Field measurements where done at two test sites located in the western and two test sites in
the northern region of Sweden. The sites were from 8 to 32 km long.
The sites were ranked in administrative papers to have full bearing capacity, but in practice
they have modest and varying bearing capacity.
All the sites had a paved bound wearing course, while the site AC 600 also had one long
section of dirt road.
1
Photos by Mats Wendel, SRA and Scania Media Services
Measuring
road surface
roughness
Pavement
”topography”
model
Pavement
”topography”
model
Calculated
response-profile
for the heavy
truck
Calculated
response-profile
for the heavy
truck
Measuring
response in a
heavy truck
actually riding
the road
Measured
response-profile
for the heavy
vehicle
Measured
response-profile
for the heavy
vehicle
Plotting
sections with
different
vibration level
Plotting
sections with
different
vibration level
Simulation of
heavy truck
riding on 100 %
stiff pavement
Simulation of
heavy truck
riding on 100 %
stiff pavement
2 ’nd measurement is done with
the Profilograph
1’st measurement is done in a
heavy truck
5. 5
5 INSTRUMENTS AND METHODS
5.1 Truck vibration
Actual vibration was measured in a loaded heavy truck, while travelling the test sections.
Vibration was recorded in a (x, y, z) system, where x is longitudinal, y transversal and z
vertical direction. The speed and travelled distance were measured with an odometer,
connected to the vibration recording computer.
Vibration measurements were done at:
• front axle, right side wheel (z) and left side wheel (z),
• cab floor, right side (z) and left side (z),
• driver’s seat (x, y, z),
• frame, rear end right side (z) and left side (z)
• frame, front end right side (z) and left side (z)
The measurement plan included runs at 30, 50 and 70 km/h. The 70 km/h runs were
cancelled at two of the sites, due to safety reasons associated with riding these poor roads.
5.2 Road roughness profilometry
Lane 3-D roughness mapping was done with SRA CS’s laser/inertial GE Profilograph P16
seen in Figure 5.
5.3 Reference pavement condition testing
Pavement and subgrade material thickness were mapped with ground penetrating radar
(GPR). Material thickness and classification were done using core samples and road
laboratory testing. Falling Weight Deflectometer (FWD) testing was done in accordance with
the SRA (1998, 2000) standard methods 112 & 114.
6 ANALYSIS OF FIELD DATA FROM TEST SITES
6.1 Hazardous heavy vehicle seat vibration
At several occasions it turned out that it was impossible to safely drive the heavy truck faster
than 30 km/h, due to the truck response to the very severely damaged pavement.
Also at the low speed of 30 km/h, the truck driver was occasionally exposed to “extremely
uncomfortable” vibration at the two northern region test sites, see Figure 6. At all 4 test sites,
the EU Action Value 0.5 m/s2
were exceeded already when driving at 30 km/h. This means
that after 6 July 2005, it will be illegal to have an employed driver to spend the full working
days driving a truck at speeds of 30 km/h or more, on roads in this poor condition without
taking technical or organisational provisions to minimise vibration exposure.
On average, test site BD 374 had lower International Roughness Index (IRI) than test site
O 1996. Still, BD 374 gave much higher seat vibration average level, and almost twice as
high transient “shock”. Average IRI surface roughness values are obviously poor descriptions
of truck ride quality and health risk at the 8 to 32 km long test sections.
6. 6
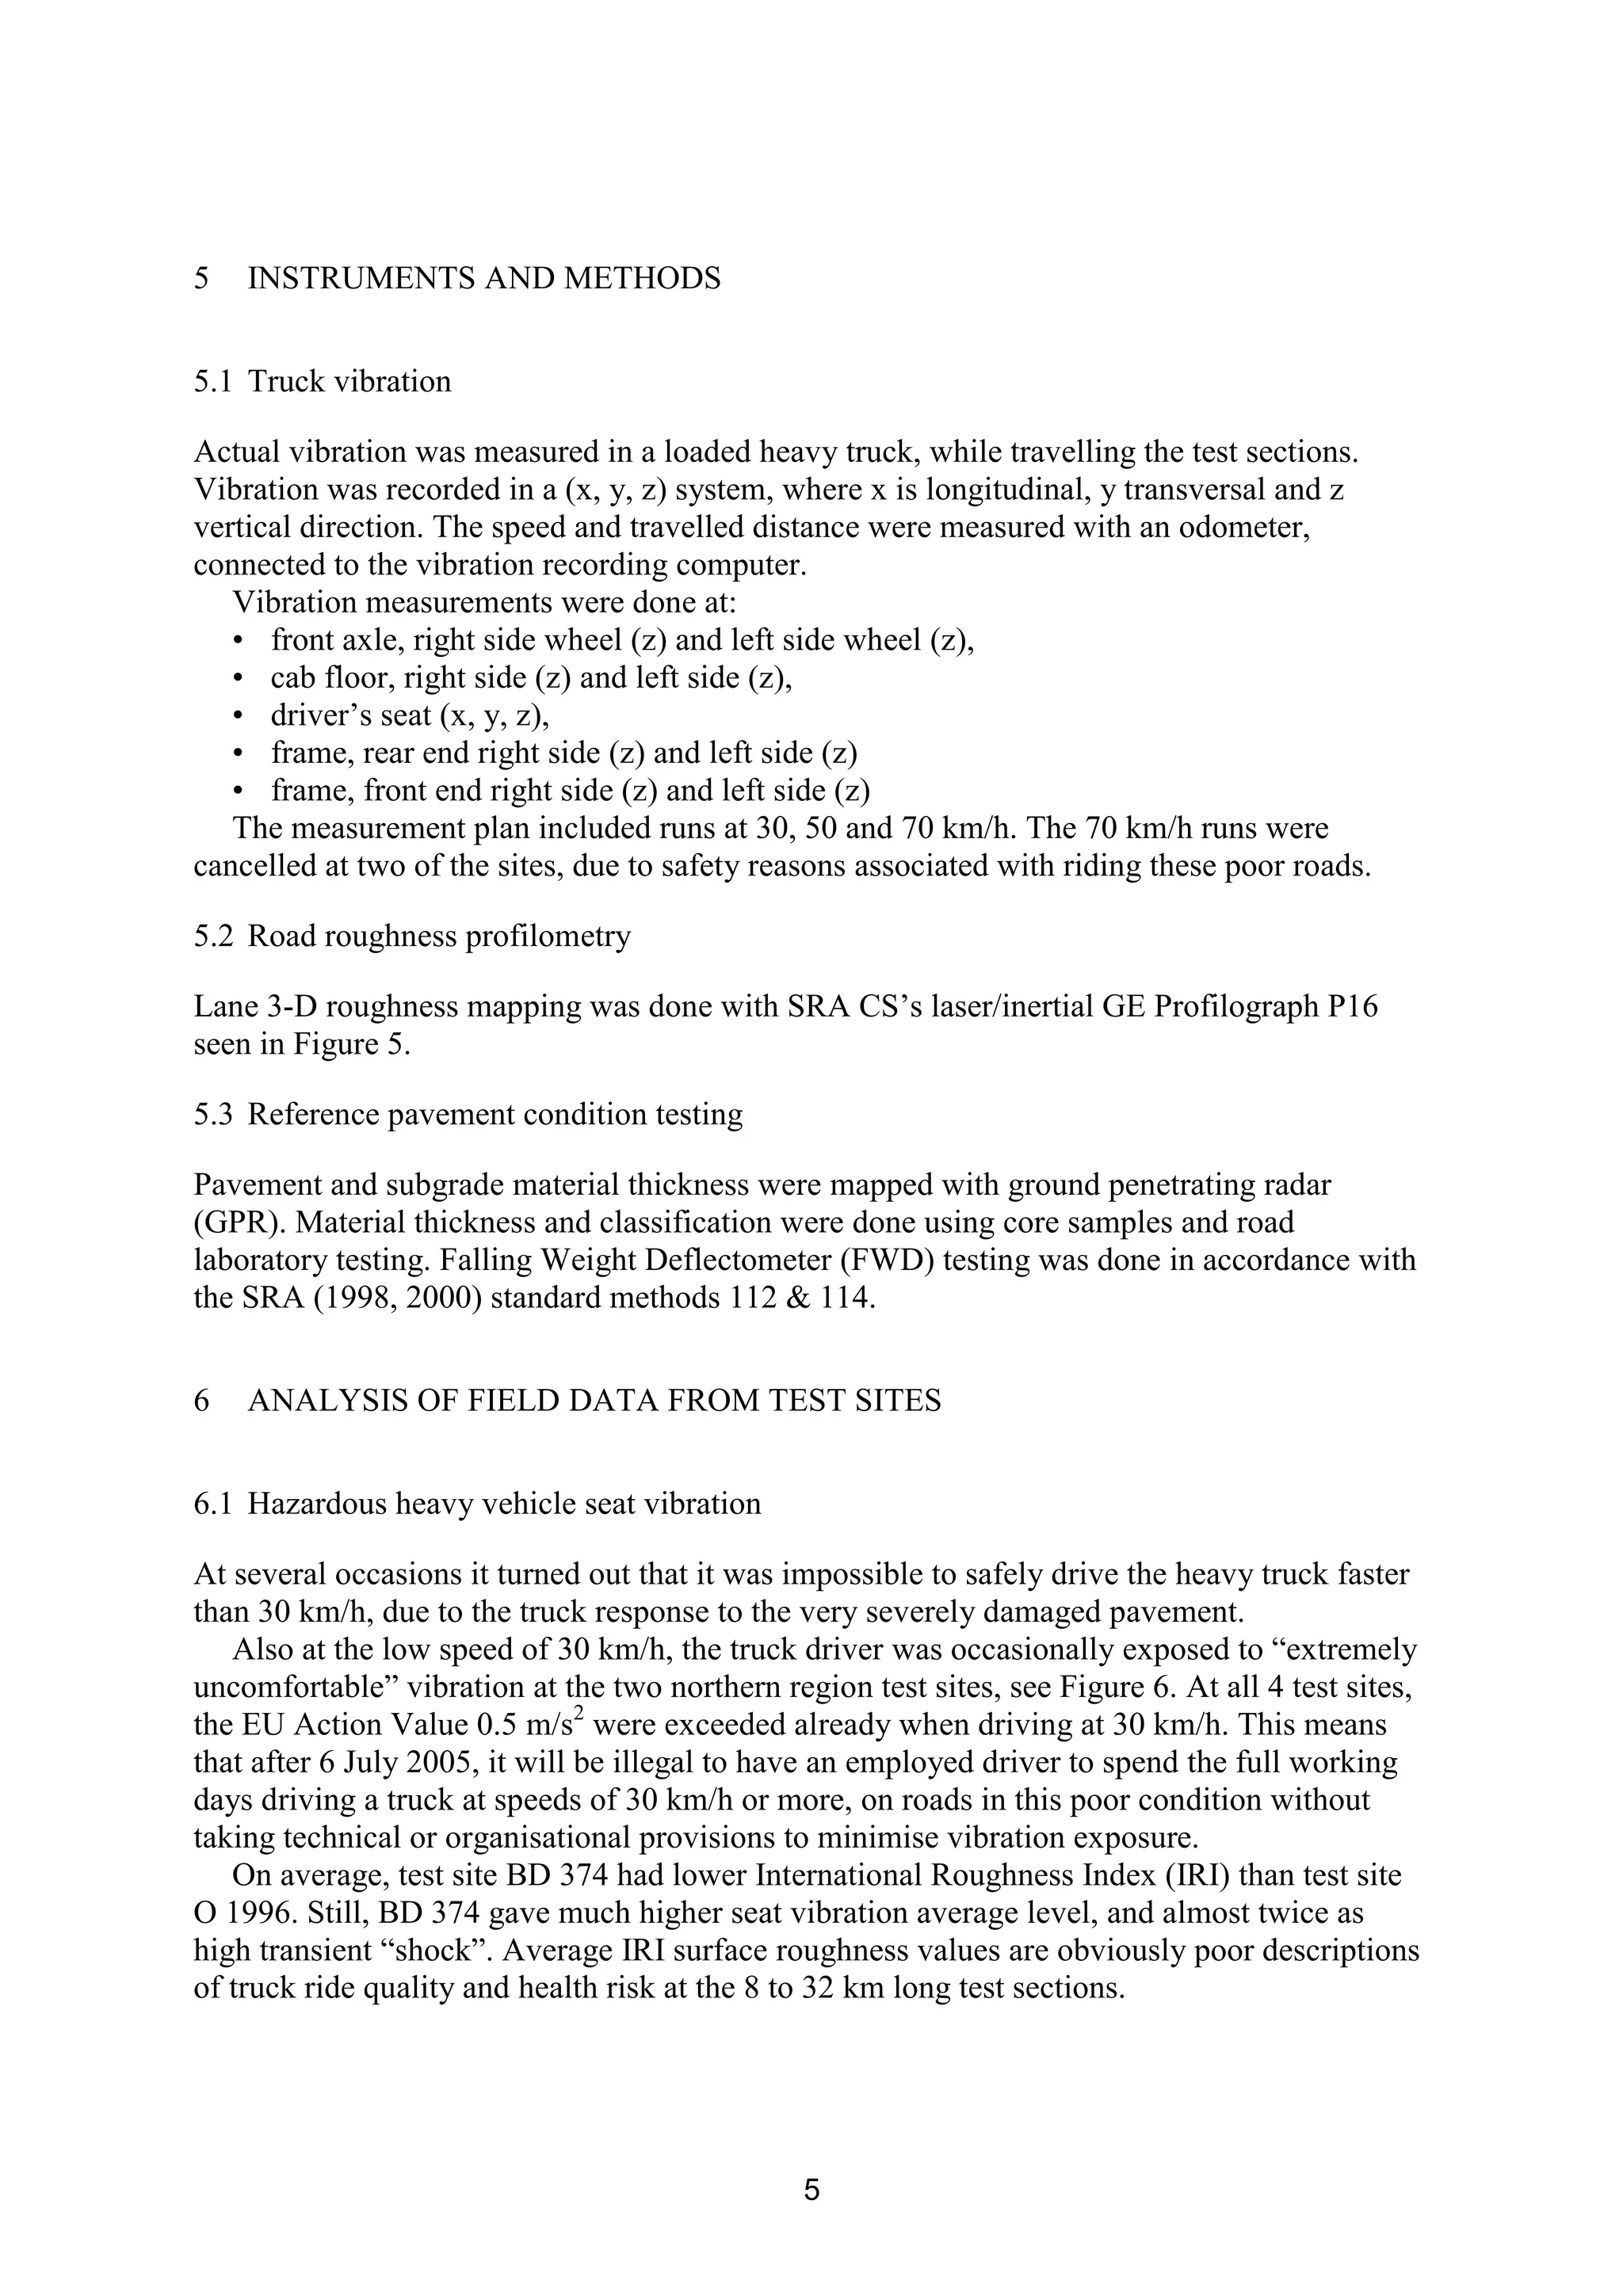
Figure 6: Site average surface roughness (IRI) and vibration level on truck driver’s seat
6.2 Comparison of measured and simulated truck vibration
In order to minimize influence on the comparison from other vibration sources than from the
road, the receiving point should be as close to the road as possible. The first receiver is the
tyre footprint, but its vibration is very difficult to measure. A more reasonable receiving point
can be found at the unsprung mass rigid parts. It is reasonable that its vibration should be very
little affected by wind load, engine combustion pulses, power train unbalance etc. Thus, the
unsprung mass (the strut) was selected as reference receiving point, where measured and
simulated vibration becomes compared.
The simulation was made with a quarter vehicle model. The truck parameters were
determined by applying the least-square method on the difference between measured and
modelled transmissibility, i.e. the quotient between Power Spectral Density (PSD) for truck
wheel vibration and PSD for road profile. Details are given in Ahlin et al (2004).
Laser/inertial profilometers typically record 1 mm wide profiles. Such a narrow profile
does not give ideal fit with 3 - 4 dm wide truck tyre footprint perceived roughness. To
overcome this problem, a virtual tyre footprint profile sensor was used in this project. The
accuracy of the profile, as evaluated in terms of vehicle perceived roughness, was improved
with about 10 to 15 % compared to a normal profilometer recorded profile, see Ahlin et al
(2004).
At first glance, simulated and real vibration showed very poor likeness. As expected, this
was due to the small but unavoidable differences in position of the data series. These
differences originate from speed variation in the real truck, and from different lateral
positioning through horizontal curves etc.
The positioning problem was solved by using a tailored algorithm for “Dynamic Space
Warping”. The warping makes it possible to adjust the two vibration series extremely
carefully to each other, not to loose correlation in position with more than a number of
decimetres.
0.73
0.56
0.85
0.74
2.31
2.24
1.70
1.14
4.34
4.13
5.50
3.95
0
0.5
1
1.5
2
2.5
O 2183 O 1996 AC 600 BD 374
Test site
RMSofweightedvibration
acceleration[m/s2
]
0
1
2
3
4
5
6
IRI[mm/m]
Average level Max level (over 1 s) IRI average value
Seat vibration @ 30 km/h
IRI = 3,95 mm/m was much worse than IRI = 4,13 mm/m
2002/44/EC:
Action Value A(8)
= 0,5 m/s2
2002/44/EC:
Action Value A(8)
= 0,5 m/s2
ISO 2631-1(1997):
”Extremely
uncomfortable” = 2 m/s2
ISO 2631-1(1997):
”Extremely
uncomfortable” = 2 m/s2
7. 7
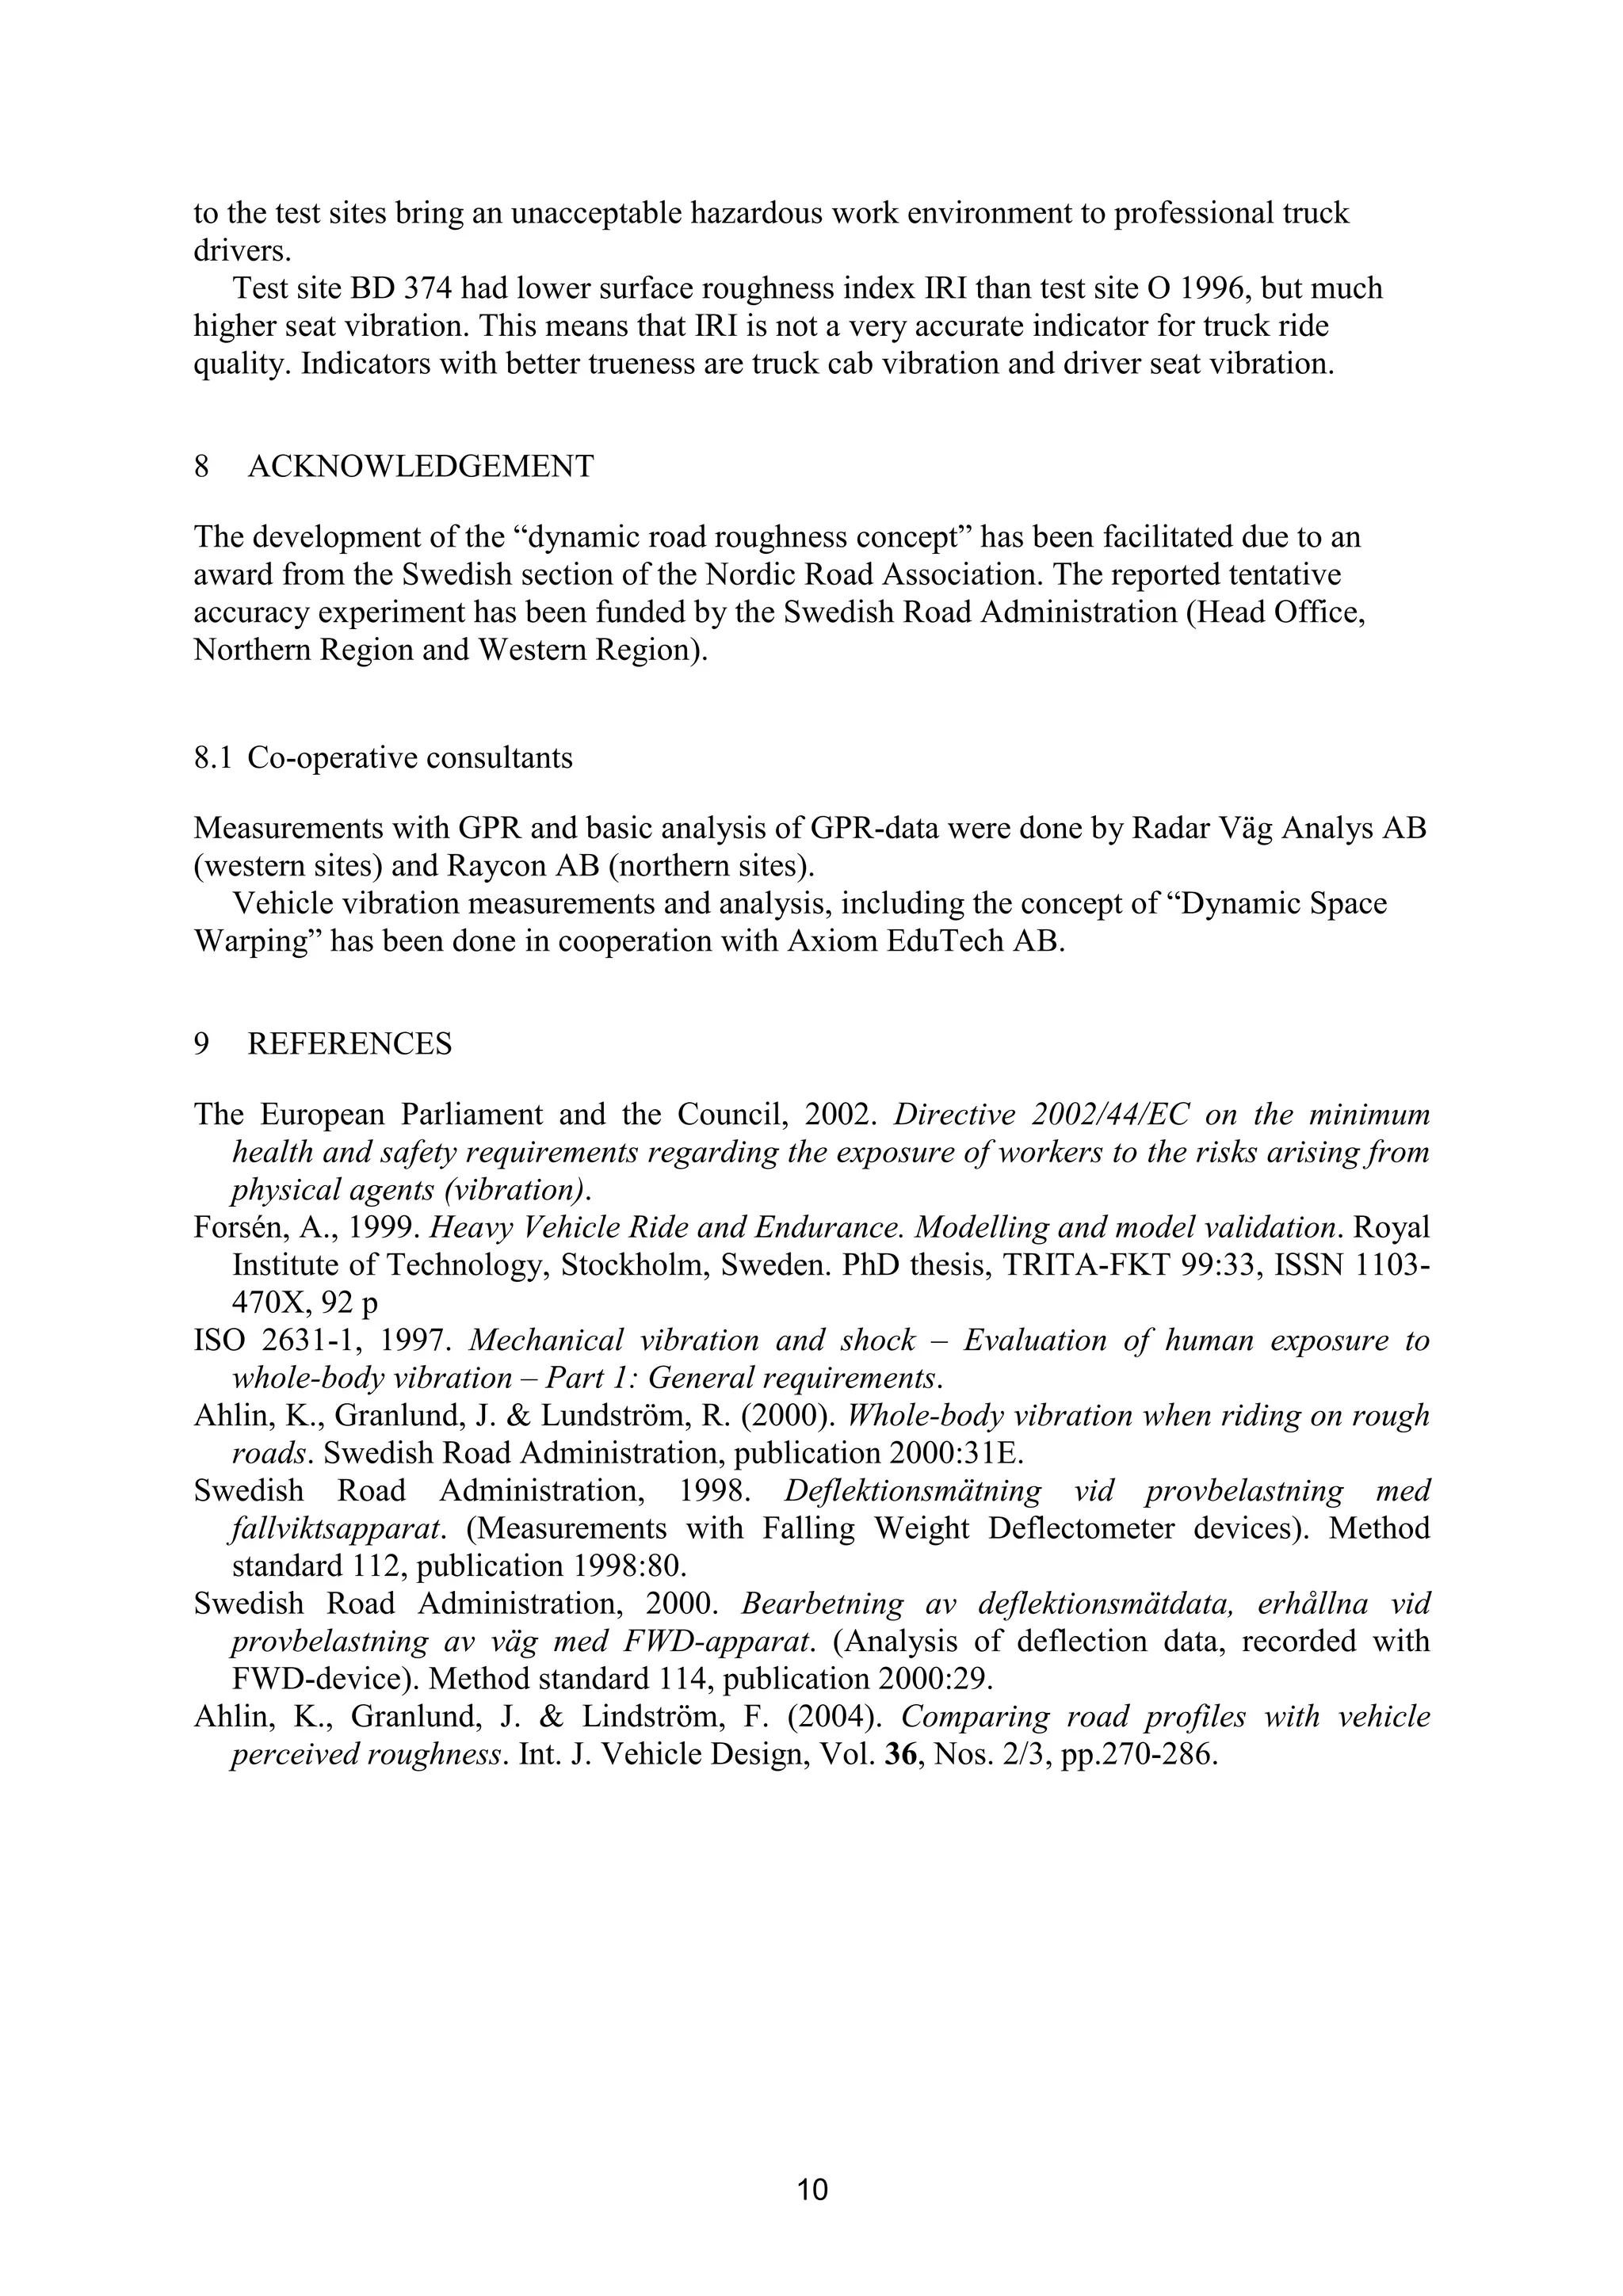
Examples of resulting likeness between the two wheel-vibration series are shown in Figure
7. The graphs show reasonable overall likeness, while some sections show significant lower
likeness. Such sections potentially have large pavement deflection variance.
O 2183, Dals Ed - Nössemark. 3 runs at 30 km/h
0%
10%
20%
30%
40%
50%
60%
70%
80%
90%
100%
200 400 600 800 1000 1200 1400 1600 1800 2000
Distance [m]
Simulatedandmeasuredwheelvibrationlikeness
Run 1
Run 2
Run 3
Figure 7: Repeatability results for three truck runs, test site O 2183
Where the warping has worked as intended, accuracy is as described from the examples
below. However, at some sections, the warping has gone “out of the track”. The algorithm has
been continuously improved during the project, but it is not perfected yet. Thus, an upcoming
development work is perfecting the warping algorithm.
The method repeatability is reasonable; the 3 runs in top of Figure 7 show 4.2 % average
standard deviation.
Reproducibility over time is reasonable as well; spring and autumn runs at site BD 374
showed 4.8 % average standard deviation. Certain deviation is due to the thaw process,
whereas likeness is lower during the spring time. Thus, the method may be useful for
detection of spring thaw related pavement problems?
Reproducibility between different speeds also seems reasonable; four 5 km long runs at 30
and 50 km/h recorded at test site AC 600 show 3.7 % average standard deviation. At different
speeds, the interaction between pavement structure (resonances with soil layers
eigenfrequencies and so on), surface and vehicle dynamics become different. This explains
deviations and must be recognized when drafting the final test method. This knowledge could
perhaps become utilized to measure pavement dynamic properties in more detail, by
comparing results from runs at different driving speeds.
6.3 Comparison of potential soft spots with ground penetrating radar (GPR) results
The truck wheel vibration likeness varied between 3 and 40 % for section 4700 to 5000 m at
test site AC 600. By georadargram, the pavement layers were revealed as thin and having
large thickness variance. Between 4760 and 4840 m, the pavement layers show poor integrity
at depths below 0.2 m, likely due to frost fatigue.
8. 8
Similar agreements were found at many, but not all, identified potential soft spots. Also
when comparing GPR results with FWD testing, the agreement on sections with structural
problems was not totally uniform. This confirms the complex nature of pavement engineering,
and different pavement test methods should be seen as valuable complements to each other
and to the engineer’s visual inspection, when making a pavement condition assessment.
6.4 Comparison of potential soft spots with core samples
Core sampling was not done intensively enough to support any stronger conclusions. At site
AC 600, 15 cores were taken. Average total pavement thickness was 35 cm. Average wheel
vibration likeness was 70 % among sections where coring showed 35 cm or thicker pavement.
The likeness was only 50 % among sections with less than 35 cm thickness. This indicates
that pavement deflection variance is likely to be larger at sections with thinner pavement
thickness, which makes sense.
6.5 Comparison of potential soft spots with results from FWD evaluation
The FWD analysis was done in accordance with the SRA evaluation standard method 114
(2000).
During the spring thaw period FWD-test, large deflections and deflection variance were
observed in the data recorded. FWD centre deflections of up to over 4 mm was observed at
dirt road sections, and over 2 mm at paved sections. Centre deflections varied up to 3.6 mm
between adjacent samples at dirt road sections, and up to 1.5 mm at paved sections.
Potential soft spots are identified by lower-than-usual likeness between simulated and
measured wheel vibration.
Examples of agreement between potential soft spots and FWD results are showed in Figure
8 and Figure 9. As seen in Figure 8, wheel vibration likeness shows reasonable fit with
calculated subgrade E-module. Bearing Capacity Index is defined in SRA method 114. In
Figure 9, this index shows a reasonable fit with wheel vibration likeness.
AC 600, Östra Strömåker
10
100
1000
7250 7450 7650 7850 8050 8250
Distance [m]
LogEu[MPa]
0%
10%
20%
30%
40%
50%
60%
70%
80%
90%
100%
Truckwheelvibrationlikeness
Eu min, springtime Wheel vibration likeness
Figure 8: Subgrade stiffness versus soft spot identifications
9. 9
BD 374, Norr Storfors
1
10
2100 2200 2300 2400 2500 2600 2700 2800 2900 3000
Distance [m]
BearingCapacityIndex
asperVVMB114(Log-scale)
0%
10%
20%
30%
40%
50%
60%
70%
80%
90%
100%
Truckwheelvibrationlikeness
Springtime Index Autumn Index Wheel vibration likeness
Figure 9: Bearing capacity index versus soft spot identifications
7 CONCLUSIONS
Results from the accuracy experiment do not support a rejection of the hypothesis; previously
observed threshold truck cab vibration is partially related to pavement deflection profile slope
variance (dynamic roughness; soft spots). Thus, the new and patented method shows a
potential for measuring pavement deflection variance at highway speed with existing profiling
equipment.
The most studied test site, BD 374, yielded an average likeness of 85.3 % between real and
calculated heavy vehicle vibration. At some sections, the collated vibration data show very
poor likeness. Such sections are presumed to have high pavement deflection variance.
The likeness increased much when using road profile data collected with a virtual tyre
footprint profile sensor instead of a single laser sensor, see Ahlin et al (2004).
Repeated truck runs show reasonable precision in likeness between simulated and
measured wheel vibration.
Reproduced runs at spring time and autumn also show reasonable likeness precision, with a
bias where spring time likeness is significant lower at certain sections. Those sections are
presumed to have spring thaw related problems. Reproduced runs at different speeds also
show reasonable precision.
Comparison with results from traditional pavement condition tests (FWD, GPR and coring)
show promising trueness. Soft spot indications have been correlated reasonably well with
subgrade stiffness as well as with Bearing Capacity Index.
The next step to come is perfecting the warping algorithm, used for dynamic space domain
adjustment of simulated and measured vibration series. After that, a standard method should
be formalized, and its performance evaluated in a new accuracy experiment.
Truck driver’s vibration exposure already at 30 km/h exceeded the new EU Action Value
at all test runs. At the roughest (northern region) sites, the ride occasionally became
“extremely uncomfortable” already at 30 km/h. This shows that roads with condition similar
10. 10
to the test sites bring an unacceptable hazardous work environment to professional truck
drivers.
Test site BD 374 had lower surface roughness index IRI than test site O 1996, but much
higher seat vibration. This means that IRI is not a very accurate indicator for truck ride
quality. Indicators with better trueness are truck cab vibration and driver seat vibration.
8 ACKNOWLEDGEMENT
The development of the “dynamic road roughness concept” has been facilitated due to an
award from the Swedish section of the Nordic Road Association. The reported tentative
accuracy experiment has been funded by the Swedish Road Administration (Head Office,
Northern Region and Western Region).
8.1 Co-operative consultants
Measurements with GPR and basic analysis of GPR-data were done by Radar Väg Analys AB
(western sites) and Raycon AB (northern sites).
Vehicle vibration measurements and analysis, including the concept of “Dynamic Space
Warping” has been done in cooperation with Axiom EduTech AB.
9 REFERENCES
The European Parliament and the Council, 2002. Directive 2002/44/EC on the minimum
health and safety requirements regarding the exposure of workers to the risks arising from
physical agents (vibration).
Forsén, A., 1999. Heavy Vehicle Ride and Endurance. Modelling and model validation. Royal
Institute of Technology, Stockholm, Sweden. PhD thesis, TRITA-FKT 99:33, ISSN 1103-
470X, 92 p
ISO 2631-1, 1997. Mechanical vibration and shock – Evaluation of human exposure to
whole-body vibration – Part 1: General requirements.
Ahlin, K., Granlund, J. & Lundström, R. (2000). Whole-body vibration when riding on rough
roads. Swedish Road Administration, publication 2000:31E.
Swedish Road Administration, 1998. Deflektionsmätning vid provbelastning med
fallviktsapparat. (Measurements with Falling Weight Deflectometer devices). Method
standard 112, publication 1998:80.
Swedish Road Administration, 2000. Bearbetning av deflektionsmätdata, erhållna vid
provbelastning av väg med FWD-apparat. (Analysis of deflection data, recorded with
FWD-device). Method standard 114, publication 2000:29.
Ahlin, K., Granlund, J. & Lindström, F. (2004). Comparing road profiles with vehicle
perceived roughness. Int. J. Vehicle Design, Vol. 36, Nos. 2/3, pp.270-286.