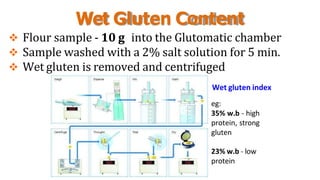
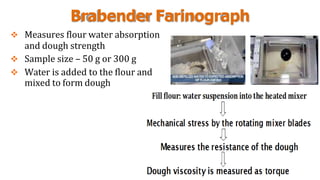
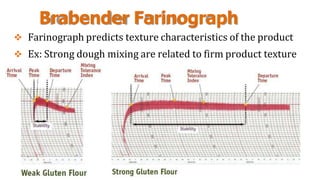
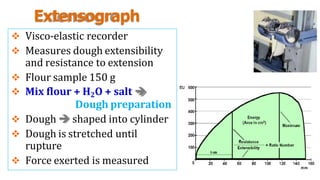
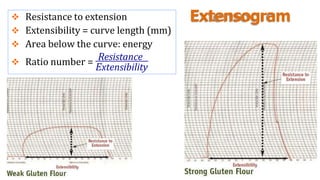
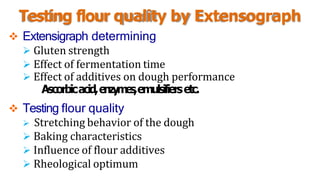
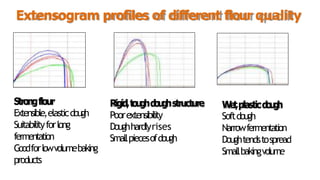
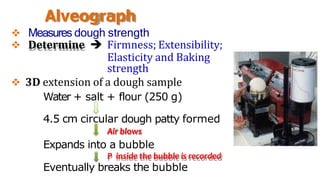
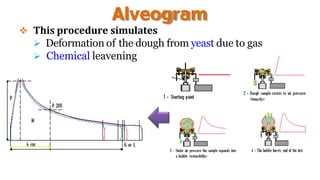
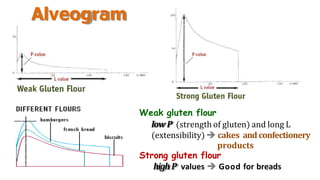
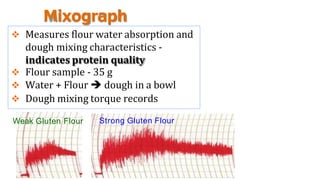
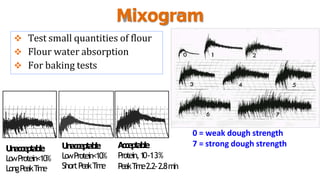
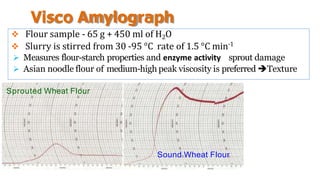
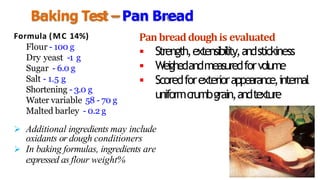
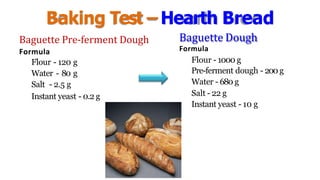
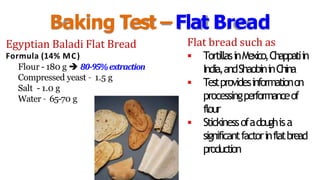
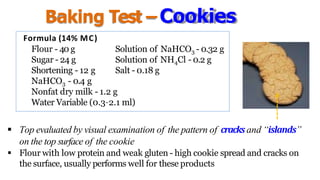
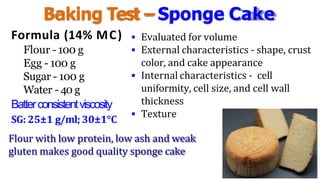
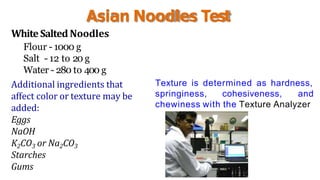
WHEAT FLOUR
TESTING METHODS
Prof. Dr.rer.agr. BDR Prasantha
Dept. of Food Science & Technology
Faculty of Agriculture
University of Peradeniya
Moisture Content
 A small sample of flour 2–3 g
 The sample is heated in an air
oven
 at 130 o
C for 1 h
OR
 at 100 oC for 5 h
 MC of 12-14%isideal for
storage
Other Moisture tests
 Electrical conductivity methods
 MW
 NIR techniques
Ash Content
 A sample of flour 3–5 g
 The sample is heated at
585 °C in an ash oven
 Ash content indicates milling
performance
 Ash in flour can affect color
Protein Content
 Sample of flour 0.15–0.20 g
 Use Combustion Nitrogen
Analyses (CNA)
 Drop the sample into 952 °C
 Amount of N released convert
to the protein content
Higher protein content requires more H2O
and longer mixing time to achieve optimum
dough consistency
Falling Number
Sample of 7 g + 25 ml water in glass falling number tube
Stirrer and shaken to form a slurry
Gelatinize the starch in a 100 oC hot water bath
Time taken to drop the stirrer through the paste as FN
F
N=Stand(s)+Stirring(s)+Fallingt
i
m
e
F
N= 5s +55s +240s=300
Falling Number Cont …
 FN - index of enzyme activity in a seconds
 Measures the effects of sprout damage
 High FN > 300 s - minimal enzyme activity and High
quality wheat flour  good for bread
Low FN < 250 s - substantial enzyme activity
High enzyme activity  high sugar and little starch
High falling number  enzymes can be added to the flour
Low falling number  enzymes cannot be removed from
the flour and it is unusable sprout damage
Color
 Typical white flour
 L* value +92.5 whiteness
 a* value –2.4 green
 b* value +6.9 yellow
Bright white color flour is
more desirable for many
products
Single Wheat Kernel Characterization
 Sample wheat kernels 12–16 g
 Remove broken kernels, weed seeds, and foreign material
 kernel weight and diameter, MC and kernel hardness
Laboratory Flour
Milling
 Determines flour yield
 Makes flour for other tests
Particle Size Distribution
 Use series of standard sieves
 Particles classified into size ranges
 Particles of size < mesh openings
60
50
40
30
20
10
0
>200 200-150 150-100 100-40 <40
Range of particle size(µm)
Sample
retain
(%)
M
e
a
nparticlesizeofB
g360
M
e
a
n particlesizeofAt405
Damaged Starch
 Microscopic study of damage SG - red coloration
with Congo Red, Hessian Bordeaux staining or
Iodine absorption by DSG
 UV-VIS spectrophotometry at 600 nm  amount of
maltose released
Wet Gluten Content
 Flour sample - 10 g into the Glutomatic chamber
 Sample washed with a 2% salt solution for 5 min.
 Wet gluten is removed and centrifuged
Wet gluten index
eg:
35% w.b - high
protein, strong
gluten
23% w.b - low
protein
Brabender Farinograph
 Measures flour water absorption
and dough strength
 Sample size – 50 g or 300 g
 Water is added to the flour and
mixed to form dough
Brabender Farinograph
 Farinograph predicts texture characteristics of the product
 Ex: Strong dough mixing are related to firm product texture
Application of Farinograph
 Measure the water absorption of flours
 Determine the wheat suitability of flour
 Development time
 Dough stability
 Degree of softening
 Verify flour blends
 Other application
eg: chocolate, chewing gum, fish, etc.
Extensograph
 Visco-elastic recorder
 Measures dough extensibility
and resistance to extension
 Flour sample 150 g
 Mix flour + H2O + salt 
Dough preparation
 Dough  shaped into cylinder
 Dough is stretched until
rupture
 Force exerted is measured
Extensogram
 Resistance to extension
 Extensibility = curve length (mm)
 Area below the curve: energy
 Ratio number = Resistance
Extensibility
Testing flour quality by Extensograph
 Extensigraph determining
 Gluten strength
 Effect of fermentation time
 Effect of additives on dough performance
Ascorbicacid,enzym
es
,emulsifiersetc.
 Testing flour quality
 Stretching behavior of the dough
 Baking characteristics
 Influence of flour additives
 Rheological optimum
Extensogram profiles of different flour quality
Strongflour
Extensible,elasticdough
Suitabilityforlong
fermentation
Goodforlowvolumebaking
products
Rigid,t
o
u
g
hd
o
u
g
hstructure
Poorextensibility
Doughhardlyrises
Smallpiecesofdough
W
e
t
,plasticd
o
u
g
h
Softdough
Narrowfermentation
Doughtendstospread
Smallbakingvolume
Alveograph
 Measures dough strength
 Determine  Firmness; Extensibility;
Elasticity and Baking
strength
 3D extension of a dough sample
Water + salt + flour (250 g)
4.5 cm circular dough patty formed
Air blows
Expands into a bubble
P inside the bubble is recorded
Eventually breaks the bubble
Alveogram
 This procedure simulates
 Deformation of the dough from yeast due to gas
 Chemical leavening
Alveogram
Weak gluten flour
lowP (strength of gluten) and long L
(extensibility)  cakes andconfectionery
products
Strong gluten flour
highP values  Good for breads
Mixograph
 Measures flour water absorption and
dough mixing characteristics -
indicates protein quality
 Flour sample - 35 g
 Water + Flour  dough in a bowl
 Dough mixing torque records
Weak Gluten Flour Strong Gluten Flour
Mixogram
 Test small quantities of flour
 Flour water absorption
 For baking tests
0 = weak dough strength
7 = strong dough strength
Unacceptable
LowProtein<10%
LongPeakT
i
m
e
Unacceptable
LowProtein<10%
ShortPeakT
i
m
e
Acceptable
Protein,1
0-13%
PeakT
i
m
e2.2-2.8m
i
n
Visco Amylograph
 Flour sample - 65 g + 450 ml of H2O
 Slurry is stirred from 30 -95 °C rate of 1.5 °C min-1
 Measures flour-starch properties and enzyme activity sprout damage
 Asian noodle flour of medium-high peak viscosity is preferred Texture
Sprouted Wheat Flour
Sound Wheat Flour
Baking Test –Pan Bread
Formula (MC 14%)
Flour - 100 g
Dry yeast -1 g
Sugar - 6.0 g
Salt - 1.5 g
Shortening - 3.0 g
Water variable 58 - 70 g
Malted barley - 0.2 g
 Additional ingredients may include
oxidants or dough conditioners
 In baking formulas, ingredients are
expressed as flour weight%
Panbreaddoughis evaluated
 Strength,extensibility,andstickiness
 Weighedandmeasuredforvolume
 Scoredforexteriorappearance,internal
uniformcrumbgrain,andtexture
Baking Test –Hearth Bread
Baguette Pre-ferment Dough
Formula
Flour - 120 g
Water - 80 g
Salt - 2.5 g
Instant yeast - 0.2 g
Baguette Dough
Formula
Flour - 1000 g
Pre-ferment dough - 200 g
Water - 680 g
Salt - 22 g
Instant yeast - 10 g
Baking Test –Flat Bread
Egyptian Baladi Flat Bread
Formula (14% MC)
Flour - 180 g  80-95%extraction
Compressed yeast – 1.5 g
Salt - 1.0 g
Water – 65-70 g
Flat bread such as
 TortillasinMexico,Chappatiin
India,andShaobininChina
 Testprovidesinformationon
processingperformanceof
flour
 Stickinessofadoughisa
significantfactorinflatbread
production
Baking Test –Cookies
Formula (14% MC)
Flour - 40 g
Sugar - 24 g
Shortening - 12 g
Solution of NaHCO3 - 0.32 g
Solution of NH4Cl - 0.2 g
Salt - 0.18 g
NaHCO3 - 0.4 g
Nonfat dry milk - 1.2 g
Water Variable (0.3–2.1 ml)
 Top evaluated by visual examination of the pattern of cracks and “islands”
on the top surface of the cookie
 Flour with low protein and weak gluten - high cookie spread and cracks on
the surface, usually performs well for these products
Baking Test –Sponge Cake
Formula (14% MC)
Flour - 100 g
Egg - 100 g
Sugar - 100 g
Water - 40 g
Batterconsistentviscosity
SG: 25±1 g/ml; 30±1°C
 Evaluated for volume
 External characteristics - shape, crust
color, and cake appearance
 Internal characteristics - cell
uniformity, cell size, and cell wall
thickness
 Texture
Flour with low protein, low ash and weak
gluten makes good quality sponge cake
Asian Noodles Test
WhiteSalted Noodles
Flour - 1000 g
Salt - 12 to 20 g
Water - 280 to 400 g
Additional ingredients that
affect color or texture may be
added:
Eggs
NaOH
K2CO3 or Na2CO3
Starches
Gums
Texture is determined as hardness,
springiness, cohesiveness, and
chewiness with the Texture Analyzer

WHEAT.pptx

  • 1.
    WHEAT FLOUR TESTING METHODS Prof.Dr.rer.agr. BDR Prasantha Dept. of Food Science & Technology Faculty of Agriculture University of Peradeniya
  • 2.
    Moisture Content  Asmall sample of flour 2–3 g  The sample is heated in an air oven  at 130 o C for 1 h OR  at 100 oC for 5 h  MC of 12-14%isideal for storage
  • 3.
    Other Moisture tests Electrical conductivity methods  MW  NIR techniques
  • 4.
    Ash Content  Asample of flour 3–5 g  The sample is heated at 585 °C in an ash oven  Ash content indicates milling performance  Ash in flour can affect color
  • 5.
    Protein Content  Sampleof flour 0.15–0.20 g  Use Combustion Nitrogen Analyses (CNA)  Drop the sample into 952 °C  Amount of N released convert to the protein content Higher protein content requires more H2O and longer mixing time to achieve optimum dough consistency
  • 6.
    Falling Number Sample of7 g + 25 ml water in glass falling number tube Stirrer and shaken to form a slurry Gelatinize the starch in a 100 oC hot water bath Time taken to drop the stirrer through the paste as FN F N=Stand(s)+Stirring(s)+Fallingt i m e F N= 5s +55s +240s=300
  • 7.
    Falling Number Cont…  FN - index of enzyme activity in a seconds  Measures the effects of sprout damage  High FN > 300 s - minimal enzyme activity and High quality wheat flour  good for bread Low FN < 250 s - substantial enzyme activity High enzyme activity  high sugar and little starch High falling number  enzymes can be added to the flour Low falling number  enzymes cannot be removed from the flour and it is unusable sprout damage
  • 8.
    Color  Typical whiteflour  L* value +92.5 whiteness  a* value –2.4 green  b* value +6.9 yellow Bright white color flour is more desirable for many products
  • 9.
    Single Wheat KernelCharacterization  Sample wheat kernels 12–16 g  Remove broken kernels, weed seeds, and foreign material  kernel weight and diameter, MC and kernel hardness
  • 10.
    Laboratory Flour Milling  Determinesflour yield  Makes flour for other tests
  • 11.
    Particle Size Distribution Use series of standard sieves  Particles classified into size ranges  Particles of size < mesh openings 60 50 40 30 20 10 0 >200 200-150 150-100 100-40 <40 Range of particle size(µm) Sample retain (%) M e a nparticlesizeofB g360 M e a n particlesizeofAt405
  • 12.
    Damaged Starch  Microscopicstudy of damage SG - red coloration with Congo Red, Hessian Bordeaux staining or Iodine absorption by DSG  UV-VIS spectrophotometry at 600 nm  amount of maltose released
  • 13.
    Wet Gluten Content Flour sample - 10 g into the Glutomatic chamber  Sample washed with a 2% salt solution for 5 min.  Wet gluten is removed and centrifuged Wet gluten index eg: 35% w.b - high protein, strong gluten 23% w.b - low protein
  • 14.
    Brabender Farinograph  Measuresflour water absorption and dough strength  Sample size – 50 g or 300 g  Water is added to the flour and mixed to form dough
  • 15.
    Brabender Farinograph  Farinographpredicts texture characteristics of the product  Ex: Strong dough mixing are related to firm product texture
  • 16.
    Application of Farinograph Measure the water absorption of flours  Determine the wheat suitability of flour  Development time  Dough stability  Degree of softening  Verify flour blends  Other application eg: chocolate, chewing gum, fish, etc.
  • 17.
    Extensograph  Visco-elastic recorder Measures dough extensibility and resistance to extension  Flour sample 150 g  Mix flour + H2O + salt  Dough preparation  Dough  shaped into cylinder  Dough is stretched until rupture  Force exerted is measured
  • 18.
    Extensogram  Resistance toextension  Extensibility = curve length (mm)  Area below the curve: energy  Ratio number = Resistance Extensibility
  • 19.
    Testing flour qualityby Extensograph  Extensigraph determining  Gluten strength  Effect of fermentation time  Effect of additives on dough performance Ascorbicacid,enzym es ,emulsifiersetc.  Testing flour quality  Stretching behavior of the dough  Baking characteristics  Influence of flour additives  Rheological optimum
  • 20.
    Extensogram profiles ofdifferent flour quality Strongflour Extensible,elasticdough Suitabilityforlong fermentation Goodforlowvolumebaking products Rigid,t o u g hd o u g hstructure Poorextensibility Doughhardlyrises Smallpiecesofdough W e t ,plasticd o u g h Softdough Narrowfermentation Doughtendstospread Smallbakingvolume
  • 21.
    Alveograph  Measures doughstrength  Determine  Firmness; Extensibility; Elasticity and Baking strength  3D extension of a dough sample Water + salt + flour (250 g) 4.5 cm circular dough patty formed Air blows Expands into a bubble P inside the bubble is recorded Eventually breaks the bubble
  • 22.
    Alveogram  This proceduresimulates  Deformation of the dough from yeast due to gas  Chemical leavening
  • 23.
    Alveogram Weak gluten flour lowP(strength of gluten) and long L (extensibility)  cakes andconfectionery products Strong gluten flour highP values  Good for breads
  • 24.
    Mixograph  Measures flourwater absorption and dough mixing characteristics - indicates protein quality  Flour sample - 35 g  Water + Flour  dough in a bowl  Dough mixing torque records Weak Gluten Flour Strong Gluten Flour
  • 25.
    Mixogram  Test smallquantities of flour  Flour water absorption  For baking tests 0 = weak dough strength 7 = strong dough strength Unacceptable LowProtein<10% LongPeakT i m e Unacceptable LowProtein<10% ShortPeakT i m e Acceptable Protein,1 0-13% PeakT i m e2.2-2.8m i n
  • 26.
    Visco Amylograph  Floursample - 65 g + 450 ml of H2O  Slurry is stirred from 30 -95 °C rate of 1.5 °C min-1  Measures flour-starch properties and enzyme activity sprout damage  Asian noodle flour of medium-high peak viscosity is preferred Texture Sprouted Wheat Flour Sound Wheat Flour
  • 27.
    Baking Test –PanBread Formula (MC 14%) Flour - 100 g Dry yeast -1 g Sugar - 6.0 g Salt - 1.5 g Shortening - 3.0 g Water variable 58 - 70 g Malted barley - 0.2 g  Additional ingredients may include oxidants or dough conditioners  In baking formulas, ingredients are expressed as flour weight% Panbreaddoughis evaluated  Strength,extensibility,andstickiness  Weighedandmeasuredforvolume  Scoredforexteriorappearance,internal uniformcrumbgrain,andtexture
  • 28.
    Baking Test –HearthBread Baguette Pre-ferment Dough Formula Flour - 120 g Water - 80 g Salt - 2.5 g Instant yeast - 0.2 g Baguette Dough Formula Flour - 1000 g Pre-ferment dough - 200 g Water - 680 g Salt - 22 g Instant yeast - 10 g
  • 29.
    Baking Test –FlatBread Egyptian Baladi Flat Bread Formula (14% MC) Flour - 180 g  80-95%extraction Compressed yeast – 1.5 g Salt - 1.0 g Water – 65-70 g Flat bread such as  TortillasinMexico,Chappatiin India,andShaobininChina  Testprovidesinformationon processingperformanceof flour  Stickinessofadoughisa significantfactorinflatbread production
  • 30.
    Baking Test –Cookies Formula(14% MC) Flour - 40 g Sugar - 24 g Shortening - 12 g Solution of NaHCO3 - 0.32 g Solution of NH4Cl - 0.2 g Salt - 0.18 g NaHCO3 - 0.4 g Nonfat dry milk - 1.2 g Water Variable (0.3–2.1 ml)  Top evaluated by visual examination of the pattern of cracks and “islands” on the top surface of the cookie  Flour with low protein and weak gluten - high cookie spread and cracks on the surface, usually performs well for these products
  • 31.
    Baking Test –SpongeCake Formula (14% MC) Flour - 100 g Egg - 100 g Sugar - 100 g Water - 40 g Batterconsistentviscosity SG: 25±1 g/ml; 30±1°C  Evaluated for volume  External characteristics - shape, crust color, and cake appearance  Internal characteristics - cell uniformity, cell size, and cell wall thickness  Texture Flour with low protein, low ash and weak gluten makes good quality sponge cake
  • 32.
    Asian Noodles Test WhiteSaltedNoodles Flour - 1000 g Salt - 12 to 20 g Water - 280 to 400 g Additional ingredients that affect color or texture may be added: Eggs NaOH K2CO3 or Na2CO3 Starches Gums Texture is determined as hardness, springiness, cohesiveness, and chewiness with the Texture Analyzer