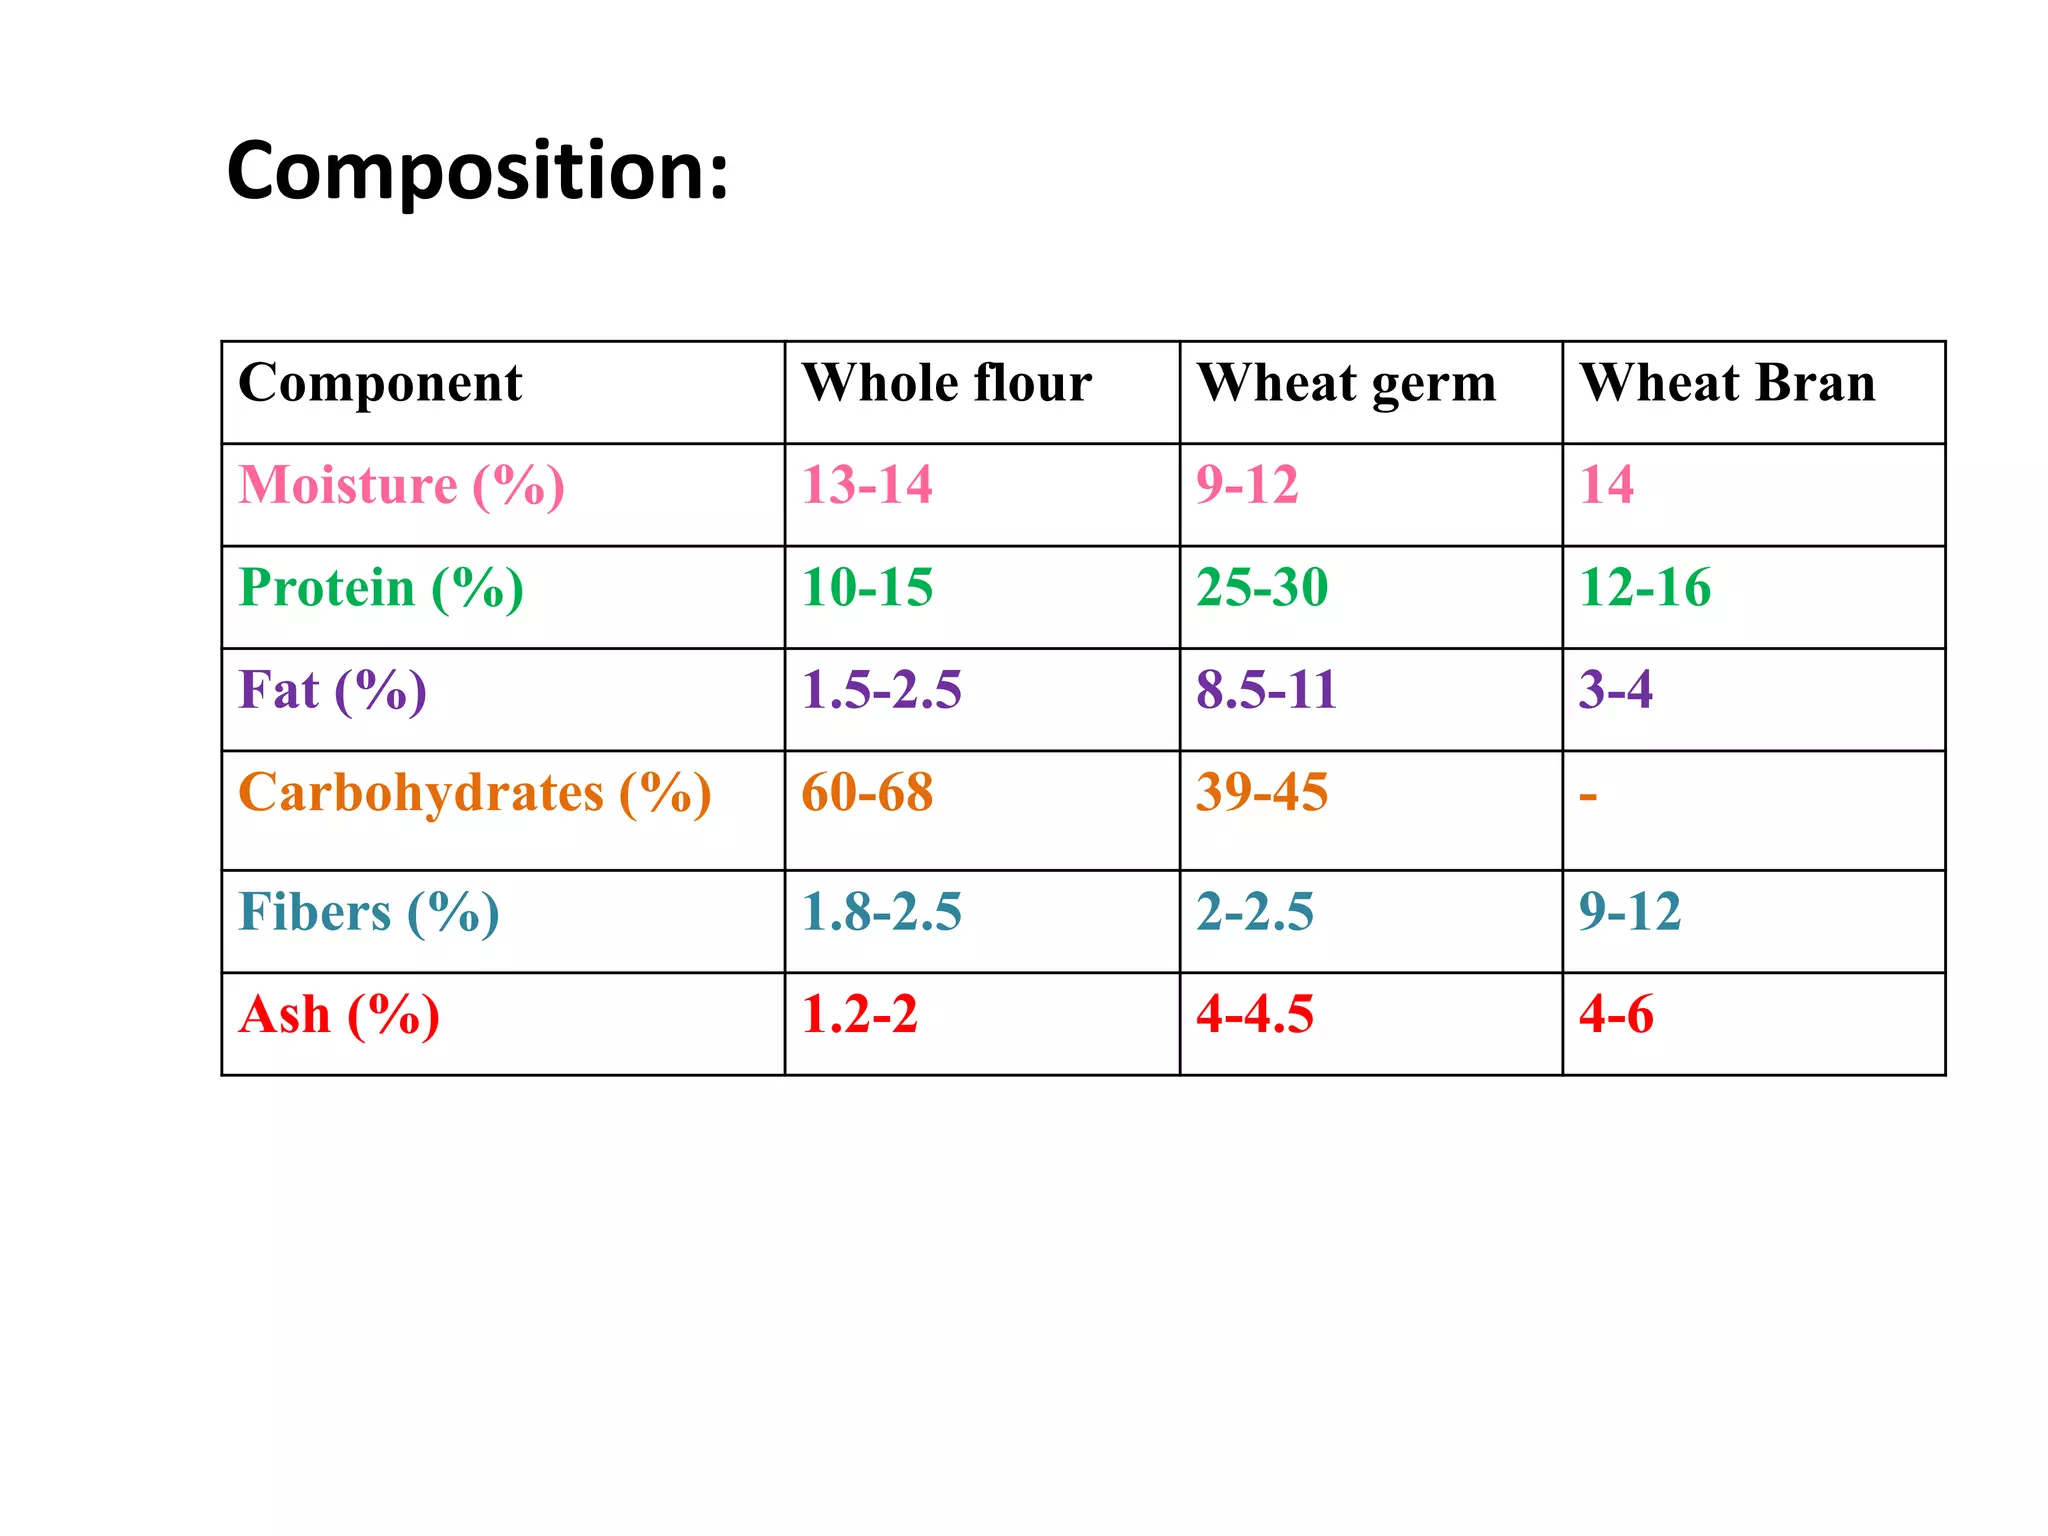
The kernel is the seed from which the wheat plant grows. Each
tiny seed contains three distinct parts that are separated
during the milling process to produce flour.
Endosperm: about 83% of the kernel weight and the source of
white flour. The endosperm contains the greatest share of
protein, carbohydrates, and iron as well as the major B-vitamins,
such as riboflavin, niacin, and thiamine. It is also a source of
soluble fiber.
Bran: about 14% of the kernel weight. Bran is included in
whole wheat flour and can also be bought separately. The
bran contains a small amount of protein, trace minerals,
and dietary fiber (primarily insoluble)
Germ: about 2.5% of the kernel weight. The germ is the
embryo or sprouting section of the seed. It is often
separated from flour because the fat content (10%) limits
shelf life. The germ contains minimal quantities of high
quality protein and a greater share of B-complex vitamins
and trace minerals.
Bran
Endosperm
Germ
Kernal
Component Whole flour Wheat germ Wheat Bran
Moisture (%) 13-14 9-12 14
Protein (%) 10-15 25-30 12-16
Fat (%) 1.5-2.5 8.5-11 3-4
Carbohydrates (%) 60-68 39-45 -
Fibers (%) 1.8-2.5 2-2.5 9-12
Ash (%) 1.2-2 4-4.5 4-6
Composition:
The quality control laboratory is an important part of the flour milling
industry.
The objectives of the quality control laboratory at a flour mill are:
 to monitor uniformity throughout the mill run;
 ensure uniformity between flour lots or shipments;
 ensure that the flour meets the customer’s specifications
 verify that the flour has desirable characteristics for a product
It is important to use appropriate standard methods and procedures in
the flour quality testing laboratory.
Commonly used standard methods used in the food industry that are
most applicable to a milling quality control laboratory are published by
• American Association of Cereal Chemists International (AACCI) and
• International Association for Cereal Science and Technology (ICC)
• Federal grain inspection service (FGIS)
Flour tests:
Moisture contents: (13-14%)
Method:
1. A small sample of flour or ground wheat (2–3 grams) is
weighed and placed in a moisture dish.
2. The sample is heated at 130oC in an air oven for 1 hour.
3. The sample is cooled to room temperature and the residue is
weighed.
1. Moisture content is determined by heating a flour or ground
wheat sample in an air oven and comparing the weight of the
sample before and after heating.
2. The amount of weight loss is the moisture content.
3. Moisture content results are expressed as a percentage. An
example of a wheat moisture content is 12%.
Result:
Why is this important?
 Determining moisture content is an essential first step in analyzing wheat or flour
quality since this data is used for other tests.
 Flour millers adjust the moisture in wheat to a standard level before milling. Moisture
content of 14% is commonly used as a conversion factor for other tests in which
 Moisture is also an indicator of grain storability. Wheat or flour with high moisture
content (over 14.5%) attracts mold, bacteria, and insects, all of which cause deterioration
during storage.
 Wheat or flour with low moisture content is more stable during storage.
 Moisture content can be an indicator of profitability in milling.
Wheat with too low moisture, however, may require special equipment or processes
before milling to reach the standard moisture level.
 Other methods of determining moisture content are used in the industry.
 For example, Federal Grain Inspection Service (FGIS) uses the GAC 2100 to measure
moisture content of whole wheat kernels (moisture meter).
Ash contents:
Method:
1. A sample of flour or ground wheat (3–5 grams) is weighed and
placed in an ash cup.
2. The sample is heated at 585°C in an ash oven until its weight is
stable (usually overnight).
3. The residue is cooled to room temperature and then weighed.
1. Ash content is determined by high temperature incineration
in an electric muffle furnace.
2. When a sample is incinerated in an ash oven, the high
temperature drives out the moisture and burns away all the
organic materials (starch, protein, and oil), leaving only the
ash. The residue (ash) is composed of the non-combustible,
inorganic minerals that are concentrated in the bran layer.
3. Ash content results for wheat or flour ash are expressed as a
percentage of the initial sample weight; for example, wheat
ash of 1.58% or flour ash of 0.52%.
Result:
Why is this important?
The ash content in wheat and flour has significance for milling.
Since ash is primarily concentrated in the bran, ash content in flour is an
indication of the yield that can be expected during milling.
Ash content also indicates milling performance by indirectly revealing the
amount of bran contamination in flour.
Ash in flour can affect color, imparting a darker color to finished products.
Some specialty products requiring particularly white flour call for low ash
content while other products, such as whole wheat flour, have a high ash
content.
 Ash contents also used to measure the grade of flour.
High price----------less ash
Low price-----------more ash
Protein contents:
Method:
1. A sample of flour or ground wheat (0.15–0.20 grams) is
weighed and placed into a combustion nitrogen analyzer (CAN)
protein analyzer.
2. This process is fully automated and begins by dropping the
sample into a hot oven where it is burned at 952°C.
3. The amount of nitrogen gas released during burning is
measured and a formula is applied to convert this measurement
to protein content in the sample.
1. Protein content is determined through high temperature
combustion in a protein analyzer. Since protein is the major
wheat compound that contains nitrogen, the protein content
can be determined by measuring the amount of nitrogen
released during burning.
2. Protein content results are expressed as a percentage of the
total sample weight; for example, 10% protein content.
Result:
Why is this important?
Protein content is a key specification for wheat and flour purchasers since it is
related to many processing properties, such as water absorption and gluten
strength.
Protein content can also be related to finished product attributes, such as
texture and appearance.
Low protein content is desired for crisp or tender products, such as snacks or
cakes.
High protein content is desired for products with chewy texture, such as pan
bread.
Combustion Nitrogen Analysis (CNA) is often used to develop calibrations for
other protein methods, such as Near Infrared Transmittance (NIRT) or Near
Infrared Reflectance (NIRR).
Nitrogen analyzer:
What is Falling number (Hagberg number)?
The Falling Number (FN) is a hot paste viscometer that is used to measure the alpha
amylase activity of wheat and flour.
One use of the FN is to determine whether the wheat experienced any pre-harvest
sprouting. This is especially important in areas that received excessive rain at harvest
time.
Once grain reaches maturity, sprouting can occur when the moisture and temperature
are right. If these conditions happen at harvest, the kernels can sprout in the field. When
sprouting occurs, enzymes in the kernel become active; amylases break down the starch
(glucose+ maltose), lipases break down the oil and proteases break down the proteins.

The enzymes can become active and influence the functionality of the wheat even
before the sprout is visible on the kernel. The impact of sprouting depends on the
activity of the enzymes and the degree of breakdown to the components of the kernel.
FN values of 150 seconds or less are an indication that the flour has excessively high
amylase activity and is unfit for use in most baking applications.
Falling number:
Method:
1. A 7-gram sample of ground wheat or flour is weighed and
combined with 25 ml of distilled water in a glass falling number
tube with a stirrer and shaken to form a slurry.
2. As the slurry is heated in a boiling water bath at 100oC and
stirred constantly, the starch gelatinizes and forms a thick paste.
3. The time it takes the stirrer to drop through the paste is
recorded as the falling number value.
1. The falling number instrument analyzes viscosity by measuring the
resistance of a flour and water paste to a falling stirrer.
2. Falling number results are recorded as an index of enzyme activity
in a wheat or flour sample and the results are expressed in time as
seconds.
3. A high falling number (for example, above 300 seconds) indicates
minimal enzyme activity and sound quality wheat or flour.
4. A low falling number (for example, below 250 seconds) indicates
substantial enzyme activity and sprout-damaged wheat or flour.
Result:
Why is this important?
The level of enzyme activity measured by the Falling Number Test affects
product quality. Yeast in bread dough, for example, requires sugars to develop
properly and therefore needs some level of enzyme activity in the dough.
Too much enzyme activity, however, means that too much sugar and too little
starch are present. Since starch provides the supporting structure of bread, too
much activity results in sticky dough during processing and poor texture in the
finished product.
If the falling number is too high, enzymes can be added to the flour in various
ways to compensate.
If the falling number is too low, enzymes cannot be removed from the flour or
wheat, which results in a serious problem that makes the flour unusable.
Falling number above 300 wheat quality is good.
Farinograph:
The farinograph is a recording dough mixer which has gained wider acceptance
in flour testing laboratories throughout the world than any other experimental
dough testing instrument.
The farinograph provides information about the mixing properties of flour
including
1. water absorption
2. mixing time
3. strength of the dough.
In the test, the resistance of the dough against the pins (consistency) during
mixing is measured and reported in arbitrary Brabender Units (BU) or
Farinograph Units (FU).
The vertical (Y) range of the chart is 0 to 1000 BU with each horizontal line
indicating 20 BU.
The horizontal (X) axis of the chart is time where each vertical line indicates a
30 second increment.
Farinograph:
Method:
1. A flour sample of 50 or 300 grams on a 14% moisture basis is weighed
and placed into the corresponding farinograph mixing bowl.
2. Water from a burette is added to the flour and mixed to form a
dough.
3. As the dough is mixed, the farinograph records a curve on graph
paper.
4. The amount of water added (absorption) affects the position of the
curve on the graph paper. Less water increases dough consistency
and moves the curve upward.
5. The curve is centered on the 500-Brabender Unit (BU) line ±20 BU by
adding the appropriate amount of water and is run until the curve
leaves the 500-BU line.
1. The farinograph determines dough and gluten properties of a flour
sample by measuring the resistance of a dough against the mixing
action of paddles (blades).
2. Farinograph results include absorption, arrival time, stability time,
peak time, departure time, and mixing tolerance index.
Result:
The Farinograph Test measures and records the resistance of a dough to mixing with
paddles.
Absorption is the amount of water required to center the farinograph curve on the 500-
Brabender Unit (BU) line. This relates to the amount of water needed for a flour to be
optimally processed into end products.
Absorption is expressed as a percentage.
Peak Time indicates dough development time, beginning the moment water is added
until the dough reaches maximum consistency. This gives an indication of optimum mixing
time under standardized conditions.
Peak time is expressed in minutes.
Arrival Time is the time when the top of the curve touches the 500-BU line. This indicates
the rate of flour hydration (the rate at which the water is taken up by the flour). Arrival
time is expressed in minutes.
Departure Time is the time when the top of the curve leaves the 500-BU line This
indicates the time when the dough is beginning to break down and is an indication of
dough consistency during processing. Departure time is expressed in minutes.
Stability Time is the difference in time between arrival time and departure time. This
indicates the time the dough maintains maximum consistency and is a good indication of
dough strength. Stability time is expressed in minutes
Mixing Tolerance Index (MTI) is the difference in BU value at the top of the curve at peak
time and the value at the top of the curve 5 minutes after the peak. This indicates the
degree of softening during mixing. Mixing tolerance index is expressed in minutes
Carbohydrate analysis:
About 100g of whole grain wheat flour contains 72g of carbohydrates.
The major carbohydrate found in the endosperm or flour portion of the kernel is the
starch. It is 90% of the total carb contents in wheat.
Other carbohydrate material includes free sugars, glucofructans and hemicelluoses
(pentosans). In the outer layer of the wheat kernel (bran), the starch present is normally a
contaminant from the endosperm.
Whole wheat is high in fiber but refined wheat contained almost none.
The fiber content of whole grain wheat is 12-15% of the dry weight. As they are
concentrated in the bran, fibers are removed during the milling process and largely absent
from refined flour.
The main fiber in wheat bran is arabinoxylan (70%) which is a type of hemicellulose.
The rest is made up of cellulose.
Starch contains two major
carbohydrate components, both
high-molecular weight polymers.
The amylose component is
considered to be a linear polymer
composed of glucopyranose units
linked through α-D-(l → 4)
glycosidic linkages although there is
now evidence to indicate that it is
not completely linear. The second
component, amylopectin, is a
branched polymer, making it one of
the largest found in nature.
Flour starch of bread wheat usually consists of about 25% amylose and
75% amylopectin.
Determination of Starch:
The only reliable method for determination of total starch is Enzymatic method that is based on
complete conversion of the starch into D-glucose by purified enzymes specific for starch and
determination of the D glucose released by an enzyme specific for it.
GOPOD (glucose oxidaseperoxidase) method
Carrez treatment:
1. Potassium hexacyanoferrate
2. Zinc sulphate
3. Sodium hydrooxide
Potential Problems:
Starch-hydrolyzing enzymes (amylases) must be purified to
eliminate any other enzymic activity that would release D-
glucose e.g. cellulases, invertase or sucrase, β-glucanase). This
contamination would give false high values.
Catalase, which would destroy the hydrogen peroxide on
which the enzymic determination of D-glucose depends. This
contamination would give false low values.

Wheat analysis

  • 1.
    The kernel isthe seed from which the wheat plant grows. Each tiny seed contains three distinct parts that are separated during the milling process to produce flour. Endosperm: about 83% of the kernel weight and the source of white flour. The endosperm contains the greatest share of protein, carbohydrates, and iron as well as the major B-vitamins, such as riboflavin, niacin, and thiamine. It is also a source of soluble fiber. Bran: about 14% of the kernel weight. Bran is included in whole wheat flour and can also be bought separately. The bran contains a small amount of protein, trace minerals, and dietary fiber (primarily insoluble) Germ: about 2.5% of the kernel weight. The germ is the embryo or sprouting section of the seed. It is often separated from flour because the fat content (10%) limits shelf life. The germ contains minimal quantities of high quality protein and a greater share of B-complex vitamins and trace minerals. Bran Endosperm Germ Kernal
  • 2.
    Component Whole flourWheat germ Wheat Bran Moisture (%) 13-14 9-12 14 Protein (%) 10-15 25-30 12-16 Fat (%) 1.5-2.5 8.5-11 3-4 Carbohydrates (%) 60-68 39-45 - Fibers (%) 1.8-2.5 2-2.5 9-12 Ash (%) 1.2-2 4-4.5 4-6 Composition:
  • 3.
    The quality controllaboratory is an important part of the flour milling industry. The objectives of the quality control laboratory at a flour mill are:  to monitor uniformity throughout the mill run;  ensure uniformity between flour lots or shipments;  ensure that the flour meets the customer’s specifications  verify that the flour has desirable characteristics for a product It is important to use appropriate standard methods and procedures in the flour quality testing laboratory. Commonly used standard methods used in the food industry that are most applicable to a milling quality control laboratory are published by • American Association of Cereal Chemists International (AACCI) and • International Association for Cereal Science and Technology (ICC) • Federal grain inspection service (FGIS) Flour tests:
  • 4.
    Moisture contents: (13-14%) Method: 1.A small sample of flour or ground wheat (2–3 grams) is weighed and placed in a moisture dish. 2. The sample is heated at 130oC in an air oven for 1 hour. 3. The sample is cooled to room temperature and the residue is weighed. 1. Moisture content is determined by heating a flour or ground wheat sample in an air oven and comparing the weight of the sample before and after heating. 2. The amount of weight loss is the moisture content. 3. Moisture content results are expressed as a percentage. An example of a wheat moisture content is 12%. Result:
  • 5.
    Why is thisimportant?  Determining moisture content is an essential first step in analyzing wheat or flour quality since this data is used for other tests.  Flour millers adjust the moisture in wheat to a standard level before milling. Moisture content of 14% is commonly used as a conversion factor for other tests in which  Moisture is also an indicator of grain storability. Wheat or flour with high moisture content (over 14.5%) attracts mold, bacteria, and insects, all of which cause deterioration during storage.  Wheat or flour with low moisture content is more stable during storage.  Moisture content can be an indicator of profitability in milling. Wheat with too low moisture, however, may require special equipment or processes before milling to reach the standard moisture level.  Other methods of determining moisture content are used in the industry.  For example, Federal Grain Inspection Service (FGIS) uses the GAC 2100 to measure moisture content of whole wheat kernels (moisture meter).
  • 6.
    Ash contents: Method: 1. Asample of flour or ground wheat (3–5 grams) is weighed and placed in an ash cup. 2. The sample is heated at 585°C in an ash oven until its weight is stable (usually overnight). 3. The residue is cooled to room temperature and then weighed. 1. Ash content is determined by high temperature incineration in an electric muffle furnace. 2. When a sample is incinerated in an ash oven, the high temperature drives out the moisture and burns away all the organic materials (starch, protein, and oil), leaving only the ash. The residue (ash) is composed of the non-combustible, inorganic minerals that are concentrated in the bran layer. 3. Ash content results for wheat or flour ash are expressed as a percentage of the initial sample weight; for example, wheat ash of 1.58% or flour ash of 0.52%. Result:
  • 7.
    Why is thisimportant? The ash content in wheat and flour has significance for milling. Since ash is primarily concentrated in the bran, ash content in flour is an indication of the yield that can be expected during milling. Ash content also indicates milling performance by indirectly revealing the amount of bran contamination in flour. Ash in flour can affect color, imparting a darker color to finished products. Some specialty products requiring particularly white flour call for low ash content while other products, such as whole wheat flour, have a high ash content.  Ash contents also used to measure the grade of flour. High price----------less ash Low price-----------more ash
  • 8.
    Protein contents: Method: 1. Asample of flour or ground wheat (0.15–0.20 grams) is weighed and placed into a combustion nitrogen analyzer (CAN) protein analyzer. 2. This process is fully automated and begins by dropping the sample into a hot oven where it is burned at 952°C. 3. The amount of nitrogen gas released during burning is measured and a formula is applied to convert this measurement to protein content in the sample. 1. Protein content is determined through high temperature combustion in a protein analyzer. Since protein is the major wheat compound that contains nitrogen, the protein content can be determined by measuring the amount of nitrogen released during burning. 2. Protein content results are expressed as a percentage of the total sample weight; for example, 10% protein content. Result:
  • 9.
    Why is thisimportant? Protein content is a key specification for wheat and flour purchasers since it is related to many processing properties, such as water absorption and gluten strength. Protein content can also be related to finished product attributes, such as texture and appearance. Low protein content is desired for crisp or tender products, such as snacks or cakes. High protein content is desired for products with chewy texture, such as pan bread. Combustion Nitrogen Analysis (CNA) is often used to develop calibrations for other protein methods, such as Near Infrared Transmittance (NIRT) or Near Infrared Reflectance (NIRR).
  • 10.
  • 11.
    What is Fallingnumber (Hagberg number)? The Falling Number (FN) is a hot paste viscometer that is used to measure the alpha amylase activity of wheat and flour. One use of the FN is to determine whether the wheat experienced any pre-harvest sprouting. This is especially important in areas that received excessive rain at harvest time. Once grain reaches maturity, sprouting can occur when the moisture and temperature are right. If these conditions happen at harvest, the kernels can sprout in the field. When sprouting occurs, enzymes in the kernel become active; amylases break down the starch (glucose+ maltose), lipases break down the oil and proteases break down the proteins.  The enzymes can become active and influence the functionality of the wheat even before the sprout is visible on the kernel. The impact of sprouting depends on the activity of the enzymes and the degree of breakdown to the components of the kernel. FN values of 150 seconds or less are an indication that the flour has excessively high amylase activity and is unfit for use in most baking applications.
  • 12.
    Falling number: Method: 1. A7-gram sample of ground wheat or flour is weighed and combined with 25 ml of distilled water in a glass falling number tube with a stirrer and shaken to form a slurry. 2. As the slurry is heated in a boiling water bath at 100oC and stirred constantly, the starch gelatinizes and forms a thick paste. 3. The time it takes the stirrer to drop through the paste is recorded as the falling number value. 1. The falling number instrument analyzes viscosity by measuring the resistance of a flour and water paste to a falling stirrer. 2. Falling number results are recorded as an index of enzyme activity in a wheat or flour sample and the results are expressed in time as seconds. 3. A high falling number (for example, above 300 seconds) indicates minimal enzyme activity and sound quality wheat or flour. 4. A low falling number (for example, below 250 seconds) indicates substantial enzyme activity and sprout-damaged wheat or flour. Result:
  • 13.
    Why is thisimportant? The level of enzyme activity measured by the Falling Number Test affects product quality. Yeast in bread dough, for example, requires sugars to develop properly and therefore needs some level of enzyme activity in the dough. Too much enzyme activity, however, means that too much sugar and too little starch are present. Since starch provides the supporting structure of bread, too much activity results in sticky dough during processing and poor texture in the finished product. If the falling number is too high, enzymes can be added to the flour in various ways to compensate. If the falling number is too low, enzymes cannot be removed from the flour or wheat, which results in a serious problem that makes the flour unusable. Falling number above 300 wheat quality is good.
  • 14.
    Farinograph: The farinograph isa recording dough mixer which has gained wider acceptance in flour testing laboratories throughout the world than any other experimental dough testing instrument. The farinograph provides information about the mixing properties of flour including 1. water absorption 2. mixing time 3. strength of the dough. In the test, the resistance of the dough against the pins (consistency) during mixing is measured and reported in arbitrary Brabender Units (BU) or Farinograph Units (FU). The vertical (Y) range of the chart is 0 to 1000 BU with each horizontal line indicating 20 BU. The horizontal (X) axis of the chart is time where each vertical line indicates a 30 second increment.
  • 15.
    Farinograph: Method: 1. A floursample of 50 or 300 grams on a 14% moisture basis is weighed and placed into the corresponding farinograph mixing bowl. 2. Water from a burette is added to the flour and mixed to form a dough. 3. As the dough is mixed, the farinograph records a curve on graph paper. 4. The amount of water added (absorption) affects the position of the curve on the graph paper. Less water increases dough consistency and moves the curve upward. 5. The curve is centered on the 500-Brabender Unit (BU) line ±20 BU by adding the appropriate amount of water and is run until the curve leaves the 500-BU line. 1. The farinograph determines dough and gluten properties of a flour sample by measuring the resistance of a dough against the mixing action of paddles (blades). 2. Farinograph results include absorption, arrival time, stability time, peak time, departure time, and mixing tolerance index. Result:
  • 18.
    The Farinograph Testmeasures and records the resistance of a dough to mixing with paddles. Absorption is the amount of water required to center the farinograph curve on the 500- Brabender Unit (BU) line. This relates to the amount of water needed for a flour to be optimally processed into end products. Absorption is expressed as a percentage. Peak Time indicates dough development time, beginning the moment water is added until the dough reaches maximum consistency. This gives an indication of optimum mixing time under standardized conditions. Peak time is expressed in minutes. Arrival Time is the time when the top of the curve touches the 500-BU line. This indicates the rate of flour hydration (the rate at which the water is taken up by the flour). Arrival time is expressed in minutes. Departure Time is the time when the top of the curve leaves the 500-BU line This indicates the time when the dough is beginning to break down and is an indication of dough consistency during processing. Departure time is expressed in minutes. Stability Time is the difference in time between arrival time and departure time. This indicates the time the dough maintains maximum consistency and is a good indication of dough strength. Stability time is expressed in minutes Mixing Tolerance Index (MTI) is the difference in BU value at the top of the curve at peak time and the value at the top of the curve 5 minutes after the peak. This indicates the degree of softening during mixing. Mixing tolerance index is expressed in minutes
  • 19.
    Carbohydrate analysis: About 100gof whole grain wheat flour contains 72g of carbohydrates. The major carbohydrate found in the endosperm or flour portion of the kernel is the starch. It is 90% of the total carb contents in wheat. Other carbohydrate material includes free sugars, glucofructans and hemicelluoses (pentosans). In the outer layer of the wheat kernel (bran), the starch present is normally a contaminant from the endosperm. Whole wheat is high in fiber but refined wheat contained almost none. The fiber content of whole grain wheat is 12-15% of the dry weight. As they are concentrated in the bran, fibers are removed during the milling process and largely absent from refined flour. The main fiber in wheat bran is arabinoxylan (70%) which is a type of hemicellulose. The rest is made up of cellulose.
  • 20.
    Starch contains twomajor carbohydrate components, both high-molecular weight polymers. The amylose component is considered to be a linear polymer composed of glucopyranose units linked through α-D-(l → 4) glycosidic linkages although there is now evidence to indicate that it is not completely linear. The second component, amylopectin, is a branched polymer, making it one of the largest found in nature. Flour starch of bread wheat usually consists of about 25% amylose and 75% amylopectin.
  • 21.
    Determination of Starch: Theonly reliable method for determination of total starch is Enzymatic method that is based on complete conversion of the starch into D-glucose by purified enzymes specific for starch and determination of the D glucose released by an enzyme specific for it. GOPOD (glucose oxidaseperoxidase) method Carrez treatment: 1. Potassium hexacyanoferrate 2. Zinc sulphate 3. Sodium hydrooxide
  • 22.
    Potential Problems: Starch-hydrolyzing enzymes(amylases) must be purified to eliminate any other enzymic activity that would release D- glucose e.g. cellulases, invertase or sucrase, β-glucanase). This contamination would give false high values. Catalase, which would destroy the hydrogen peroxide on which the enzymic determination of D-glucose depends. This contamination would give false low values.