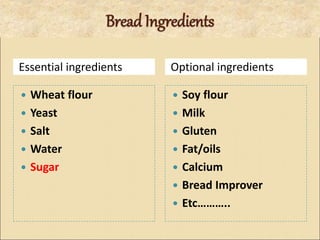
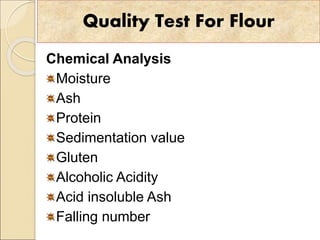
2. Construct a formula that will produce a bread from 5 kg dough
Quality of
ingredient
Critical
control
points
Formulation
Flour- 100%
Water- 60% (variable)
Yeast (Compressed)-
3%
Salt- 2%
Sugar- 0 to 5%
Temperature
Time
Humidity
3. If the temperature
of the bakery is
26°C, the
temperature of
the flour is 26°C
and the
temperature of
the tap water is
15°C.
Room Temperature
Ingredient
temperature
Water temperature
Friction factor
How you maintained the dough
temperature ????????
4. QUESTION ????
If 40 kg of water required for a
given mix and the temp. of tap
water is 20 degree Celsius, while
the calculated water temp. is
10degree Celsius, what is the wt of
ice and water required?
10. Quality Test For Flour
Chemical Analysis
Moisture
Ash
Protein
Sedimentation value
Gluten
Alcoholic Acidity
Acid insoluble Ash
Falling number
11. Flour Colour
VERY IMPORTANT- INFLUENCES
CRUMB COLOUR OF BREAD
REQUIRED-BRIGHT,CREAMY
WHITE COLOUR WITH MINIMUM
BRAN CONTAMINATION.
FACTORS-BRAN PARTICLES
TEST-PEKAR TEST,COLOUR
12. GRANULARITY
REFERS TO PARTICLE SIZE
AFFECTS PERCEIVED
BRIGHTNESS OF FLOUR
RATE OF HYDRATION
REQUIRED SIZE-SHOULD PASS
THRO’ 180 MICRON SIEVE
WITHOUT ANY RESIDUE.
13. MOISTURE CONTENT
Affects keeping quality of flour.
Economic implication-higher moisture
means loss to bread manufacturer.
Influenced by conditioning moisture,
storage conditions and packaging
material.
Required moisture content -13 to 14
14. WATER ABSORPTION POWER-
WAP
Is the quantity of water added to get dough
of desired consistency, expressed as
percentage of flour weight.
Higher wap means increased product yield
and better bread quality.
Influenced by-protein, damaged starch and
pentosan contents.
Desired wap-67 to 72 % in white bread
production, at plant level.
15. TOTAL ASH CONTENT
Indicates quantity of mineral matter
present in flour.
Higher ash content means higher bran
contamination and low grade flour.
Higher ash content will weaken dough
and yield bread with poor crumb
colour and volume.
Required ash content –approx.
0.5% on dry weight basis.
16. ACID INSOLUBLE ASH
Indicates quantity of silica
matter present in flour – sand
contamination.
Improper cleaning of wheat
before milling leads higher
acid insoluble ash.
Required value-not to exceed
0.05% on dry weight basis
17. ALCOHOLIC ACIDITY
Represents the amount of free fatty
acids, amino acids and acid salts
present in flour
Indicates the extent the deterioration
the flour has undergone during
storage.
Higher value means more
deterioration during storage.
18. Protein/Gluten
Gluten is a unique type of protein
present in wheat flour.
Formation of gluten network is
responsible for gas retention
properties of bread dough.
Gluten quality and quantity are vital
parameters in bread production.
Influences mixing time, wap,
fermentation tolerance, loaf volume
and crumb quality.
19. SEDIMENTATION VALUE
Indicates gluten quality and quantity.
Measured in terms of volume of
sediment formed when the flour
suspension is treated with lactic acid.
Higher the volume of sediment better
the gluten quality and quantity.
The required sedimentation value is
30 to 40ml.
20. DAMAGED STARCH
Starch is the principal carbohydrate
present in wheat flour.(About 67%)
Some amount of starch damage takes
place during wheat milling.
Provide substrate for enzymes to act
and produce fermentable
carbohydrates .
These fermentable carbohydrates are
required for yeast to produce gas
during fermentation.
21. FALLING NUMBER
A viscometric method for
determination of alpha amylase
activity.
Measured as time in seconds for a
plunger to stir and fall thro’ a fixed
distance in a flour paste being
liquefied by enzyme action.
Higher value means lower enayme
activity and vice versa.
Required value is 175 to 275
22. DOUGH RHEOLOGICAL
PROPERTIES
Rheology-study of deformation and flow
properties
Main instruments used- farinograph and
extensograph
Farinograph- can be used to make
observations on W.A.P,dough development
time, dough strength and mixing tolerance.
Extensograph-can be used to stretch the
dough until it breaks and study the
extensibility and resistance to extension.
23. FARINOGRAPH
Farinograph is a recording dough
mixer. It measures and records the
resistance offered by dough against
mixing blades operating at a constant
speed and temperature.
Parameters obtained from the resulting
curve relate to the amount of water
required to reach a desired peak
consistency.
24.
25. Procedure:
1
• The weighed quantity (2g to 300g) of flour (14% moisture basis) is
placed in the Farinograph bowl.
2
• The instrument is turned on, and water is added from a burette.
• As the flour hydrates and the dough develops, the resistance on
the mixing blades increases, and the pen on the chart recorder or
the curve on the computer screen rises.
3
• The mixing curve obtained generally rises to a maximum and then
slowly falls from that peak consistency point.
29. EXTENSOGRAPH
The extensograph measures the
extensibility and resistance to
extension of fully mixed,flour-water
dough.
It measures the resistance to
stretching offered by a molded piece of
dough.
The force required to stretch the
dough is automatically plotted against
the distance it stretches to give
30. Procedure
1
• Prepare dough in farinograph using 150g or 300 g of flour on 14% moisture
basis, water and 6g salt dissolved in a part of water at 30° C.
• Mix for 1 min. then allow the dough to rest for 5 min in the covered mixing bowl.
Again mix for 2 more minutes.
2
• Weigh 150 g dough and give it 20 revolutions in extensograph rounder
• Roll it into a cylindrical piece in a shaping unit.
3
• Each dough cylinder is clamped in a cradle and allowed to rest for 45 min in a
compartment maintained at 30°C.Then, it is loaded on to extensograph and
stretched
• After the test the same dough is reshaped as before, allowed resting for 45 min
and stretched again. Generally three stretching curves are obtained by repeating
the same procedure.
31. Area under the extensograph curve
with dough strength
Area under the curve (cm2) Dough Strength
80 Weak
80-120 Medium strong
120-200 Strong
>200 Extra strong
34. Role of flour in bread
Main Purpose:
Builds the structure: holding and expanding with
leavening gases because Ability to form Gluten.
Other effect:
Holds the other ingredient together
Affects the shelf life quality
35. Flour Specification
For
Different Bakery Products
Parameters Bread Biscuit Cake
Moisture (%) 13-14 13-14 13
Protein 11-12 9 8
Gluten 8 7 7.5
Total Ash 0.5 0.5 0.5
Alcoholic Acidity 0.1 0.1 0.1
Water Absorption 60 55 -
37. Role of Water
During Processing of bakery product
Water helps in formation of gluten.
Medium for yeast fermentation.
Water helps in dissolving other ingredients enabling the
formation of smooth & uniform dough.
Water is used for controlling the dough temperature.
During baking:
Medium for heat transfer
Gelatinization of Starch
Formation of the Porus Structure
Crust Formation
Surface Browning
39. SUGAR & SALT
SUGAR
Acts as Yeast food.
Contributes to the color of crust.
Sweetens the product and
provides flavor /aroma.
SALT
Provides taste & flavor to the
Bread
Toughens the Gluten
Controls the fermentation.
Controls the Yeast action and
acid-forming Bacteria.
In combination with sugar,
improves the Crust color &
Bloom.
Helps in retention of moisture in
the loaf..
Improves shelf-life
40. Effects of Insufficient
Salt
Soft & unstable dough.
Quicker fermentation.
Poor crumb & crust
colour.
Open texture & volume
problems.
Less flavor development.
Lesser shelf-life.
Effects of Excess Salt :
Firm & Stable dough.
Slow fermentation and
Final proof.
More crust color.
Firm crumb.
Moist & whiter crumb.
41. Effect of Sugar & Salt on Bread
Characteristics
ON VOLUME ON CRUST COLOURSoftware
2
5
10
0
2
4
1480
1662.5
1845
2027.5
2210
volume
A: sugar
B: salt
Design-Expert® Software
Colour
X1 = A: sugar
X2 = B: salt
2
5
10
0
2
40.9
1.675
2.45
3.225
4
Colour
A: sugar
B: salt
Color:1To4:LightertoDarkest
42. Effect of Sugar & Salt on Quality
of Bread
ON FLAVOR ON TASTE
® Software
2
5
10
0
2
41
1.85
2.7
3.55
4.4
flavour
A: sugar
B: salt
Flavor/Taste: 1 To 4: most acceptable to least acceptable
Design-Expert® Software
taste
X1 = A: sugar
X2 = B: salt
2
5
10
0
2
4
1
1.875
2.75
3.625
4.5
taste
A: sugar
B: salt
44. Types
Mechanical
Biological
Chemical
Mechanically air is introduced
through
Creaming fat and sugar together.
Sifting flour.
Beating batter.
Whipping egg whites.
Biologically leavening is
introduced through
Yeast
&
Bacteria
Yeast is a microscopic, unicellular plant named “fungi” and
the species is Saccharomyces cerevisae.
Structure of yeast
Action of yeast: Fermentation
Process by which yeast acts on fermentable sugars and
changes them into carbon dioxide gas and alcohol.
Reaction in chemical terms:
C6H12O6 → 2CO2 + 2C2H5OH + Energy
Simple sugar carbon dioxide alcohol
Theoptimumyeastactivityisata
temperatureof26-32C&R.Hof80%.
45. Function of Yeast
Main purpose :
Leavening in breads/rolls.
Other Effects:
Heat release. (Temp. increases).
Acids produce. (pH drops).
Development of flavor
Dough mellowed
46. Yeast Activity: Factors Affecting
Water availability
Temperature:
Oil/fat: slows down the fermenting action as Oil /
Fat forms a protective layer between Yeast and
the yeast food.
pH: slows the fermenting action of yeast. Ideal pH
range is 4.5 - 4.8.
Amount and Types of yeast
47. Yeast’s sensitivity to temperature
34°F (1°C) -
Inactive (storage temperature)
60° to 70°F (15° to 20°C) - Slow action
70° to 90°F (20° to 32°C) - Best growth (fermentation and
proofing temp. for bread
dough)
Above 100°F (38°C) - Reaction slows
140°F (60°C) - Yeast is killed
48. Forms Of Yeast:
Compressed yeast: also called fresh yeast.
It is moist and perishable and is preferred by
professional bakers.
Active dry yeast: is a dry, granular form of yeast.
It must be rehydrated in 4 times its weight of warm
water [about 110°F (43°C)] before use.
Instant active dry yeast: is also a dry granular form of
yeast, but it does not have to be dissolved in water
before use.
Note: Dry yeast are good choice for longer term storage.
50. Active Dry Yeast Instant Dry Yeast
Storage Temperature Room Temperature Room Temperature
Storage Life 12 Months depends on the
packaging.
12 month
% Water 6 - 8 % 4 - 6 %
Preparation before use
Rehydrated with water 40 to
43°C for about 10 to 15
minutes.
At temperatures above 43°C will
damage the yeast and result
longer proof time.
Does not have to be rehydrated.
It can be added directly with the
other dry ingredients
Conversion Factor
0.4 – 0.5
i.e. 1kg of fresh yeast = 0.4 -0.5 kg
AD yeast
0.33 – 0.4
i.e. 1 kg of compressed yeast = 0.33
to 0.4 kg of instant dry yeast.
54. PURPOSES OF DOUGH MIXING
Uniform incorporation of ingredient
Hydrate all dry materials completely
Develop the gluten for proper handling
quality and gas retention
The incorporation of air bubbles within
the dough to provide the gas bubble
nuclei for the carbon dioxide which will
be generated by yeast fermentation and
oxygen for oxidation and yeast activity.
55. Stages of mixing
1. Initial stages: The main action is the
incorporation of the dough ingredients.
At this point, the dough is “slack” and
rather cold, wet and sticky to the touch.
2. Pick-up Stage: with continued mixing,
the dough enters the second stage
during which the gluten structure
begins to form. The dough is getting
warmer, smoother and drier.
56. Clean-up Phase: is the most definite
check point in the mixing process. Here
the developing dough becomes drier and
more elastic, and begins to form into a
more cohesive mixer arms.
The point at which the dough clears away
from the back of the mixer bowl
constitutes the end of the “clean-up”
period. The colour will also change from
yellowish to more white.
57. Over-mixing stages
“Let down” stage : As mixing is continued through the
development stage, the dough; loses its elastic character
and becomes increasingly soft, smooth and highly
extensible, and assumes a silky appearance. Its coherence
diminishes and the dough begins to be pulled into long,
rubbery strands by the mixer bars.
Break down stage: Dough mixed beyond the “let-down”
stage disintegrates completely. They become slack and
runny, losing all their elasticity and dough is beginning to
liquefy.
58. CHEMICAL CHANGES HAPPENING DURING
FORMATION OF THE DOUGH
When water is introduced in the mix, it will start all the
chemical reactions naturally happening in a dough system.
The two main ones are fermentation activity and enzyme
activity.
Another important chemical change happening during
mixing time is the oxidation of the dough.
◦ This reaction is due to the air naturally incorporated in
the dough during mixing. The air contains oxygen, which
will have some effects in the dough.
59. Conti…
To a certain point, the effect of the oxygen will be positive.
The oxygen will chemically react with the molecules of
protein to form better gluten bonds.
This will naturally reinforce the gluten structure and the
tolerance of the dough.
Too much oxygen (long mixing time), will negatively affect
some flour components called carotenoid pigments
(responsible for the creamy color of the flour and some
aroma production).
60. Dough Mixers
Mixers are the most useful, versatile pieces
of equipment you can invest in, and come
with many innovative features that make
them a vital asset to your bakery shop.
Dough Mixers are generally divided into
four categories:
Horizontal Mixers
High intensity Mixers
Spiral Mixers
62. Dough Hook:
It is used for mixing most bread, roll
and pizza dough which requires folding
and stretching action for best
development.
These agitators are suitable for use on
all yeast raised dough and should be
operated in first, second or third speed.
63. Flat Beater
A flat beater provides a wide, flat
surface that is perfect for mixing up
batter for cakes and brownies, and
also firm to hard cookie dough. You
can also use it for making icing and
even mashed potatoes.
It is a multi-purpose agitator and use
first speed for starting most operation,
medium speed for finishing.
64. Wire Whip
The wire whip is made of wire strands
arranged in an oval shape. Its primary
use is for mixing light items like
custards, puddings, and whipped
cream.
It is designed for maximum blending of
air into light products.
The wire whip is most commonly used
in third and fourth speed.
65. Bowl Scraper
A bowl scraper continuously scrapes
the sides of the mixing bowl as the
agitator turns. This makes it a great
way to minimize ingredient waste and
reduce the need for manual bowl
scraping.
66. Heat and Energy during Mixing
The amount of specific mechanical
energy absorbed by the dough(j/kg) was
calculated as:
E=C*N*t/M
Where C is the torque. N is the angular
velocity, t is the mixing time and M is the
weight of the mixed dough.
67. Conti…….
The amount of heat absorbed by the
dough during mixing can be determined
by the following equation:
Qh = Mdough * Cp,dough *(T2-T1)
T2 = temperature of the dough at the
beginning and
T1 = temperature of the dough at the end of
68. Examples:
1. If an agitator is rotating with angular
velocity of 2400 rpm and 30N-m
torque. Calculate the specific energy
absorbed by 30 kg of dough in 10
minutes. And also calculate the total
energy absorbed by the dough.
2. Calculate the final temperature of the
dough after mixing if 34 kg of dough
having initial temperature 28 degree C
and specific heat 1.9 kcal/kg absorb 60
70. Factors affecting dough
fermentation
Amount and Type of yeast
Dough temperature
Room Temperature
Humidity
Fermentation time
Amount of salt
Amount and type of sugar
pH of the dough
Consistency of the dough
71. Fermentation Rate Vs. %age of
Sugar
0
20
40
60
80
100
120
0.00% 5.00% 10.00% 15.00% 20.00%
FermentationRate
Percentage of Sugar
72. Effect of Fermentation time on pH
of bread
4.9
5
5.1
5.2
5.3
5.4
5.5
5.6
0 15 30 45 60 75 90 120 150
pH
Proof Time (min.)
73. Effect of temper. on Volume
0
500
1,000
1,500
2,000
2,500
3,000
3,500
4,000
4,500
0 15 30 45 60 75 90 120 150
Volumeperpoundofbread(ml)
Proof time (min.)
74. Effect of Proof time on pH of bread
4.9
5
5.1
5.2
5.3
5.4
5.5
5.6
0 15 30 45 60 75 90 120 150
PH
Proof Time (min.)
75. Effect of Proof time on loss in baking
of bread
0
10
20
30
40
50
60
70
80
90
100
0 15 30 45 60 75 90 120 150
LossinBaking(g)
Proof time(min.)
76. Fermentation Rate Vs. %age of
Salt
0
20
40
60
80
100
120
140
0.00% 1.00% 2.00% 3.00% 4.00% 5.00%
FermentationRate
Percentage of Salt
77. effect of dough temp. on fermentation:
Dough temperature is the basic means by which the baker
controls fermentation in the bakery.
It has been estimated that a 1°C rise in dough temperature
will accelerate yeast activity by about 10 % i.e. 10 % more
gas is produced in the same amount of time.
As a dough ferments heat is generated, raising the dough
temperature and accelerating the yeast activity.
This temperature increase can be monitored and indicates
the progress of fermentation.
At the end of a standard fermentation time higher
temperatures than expected may indicate an excess of
fermentation has been accomplished.
78. effect of doughconsistancyon fermentation rate:
Trial N° 1 2 3 4 5
% Of Water 40 % 44 % 48 % 52 % 56 %
Fermentation
Rate
77 86 94 100 103
• A dough which is made stiff (low water content) will take
longer to ferment.
• Likewise, a dough which is made slack (higher ingredient
water content) will ferment much faster.
This is due to the concentration of soluble solids in the
free water of the dough. For example, as the ingredient
water increases, causing the dough to become softer, the
soluble solids are diluted causing a decrease in osmotic
pressure on the yeast and thereby increasing its activity.
79. The Most important aspect
FERMENTATION
Time Temperature
Why is this important?
Why not just increase
the heat and let it go
faster to save time?
“Yeast will double its rate of
fermentation for every 17 degree
F increase in heat, up to the
killing point.”
Flavor
• Flavor comes from long
regimented bulk ferments.
•If you speed things along,
you lose flavor and texture.
• If you slow things down you
can let enzymes do too much
work on the dough and lose
flavor and texture.
80. Effect of fermentation on final
product
Increase in volume
To develop a light and airy texture in
the bread
To change the protein structure of the
bread to prevent a chewy texture
Development of flavor
Better shelf life of bread
81. CHANGES DURING FERMENTATION
Production of CO2
Increase in temperature
Changes in the consistency of dough.
The dough becomes soft, elastic as
well as extensible.
Reduction in pH
Dough rheology
82. Different Steps of Bread Making in
Baking Process
The natural enzymes present in the dough die at different temperatures during baking. One important enzyme, alpha
amylase, continues to break starch into sugars until the temperature reaches 75°C.
The loaf is not completely baked until an internal temperature of 98°C is reached. Steam is produced because the loaf surface reaches 100°C+ and as the moisture is driven
off, the crust heats up and eventually reaches the same temperature as the oven. Sugars and other products, some formed by breakdown of proteins, blend to form the
attractive colour of the crust, through “browning” reactions which occur very quickly above 160°C.
Stabilization of the crumb begins as the starch granules swell at about 60°C, and in the presence of water are released
from the gluten. The outer wall of the starch granule cell bursts and the starch inside forms a thick gel-like paste that
helps form the structure of the dough.
From 74°C upwards the gluten strands surrounding the individual gas cells are transformed into the semi rigid structure associated with bread crumb strength
Carbon dioxide produced by the yeast is present in solution in the dough. As the dough temperature rises to 40°C, this
carbon dioxide turns into a gas, and moves into existing gas cells to expand them.
As the temperature rises the rate of fermentation increases, and so does the production of gas cells, until the dough reaches the temperature at which yeast dies
(approximately 46°C). The extra sugars produced between 46–75°C are then available to sweeten the breadcrumb and produce the attractive brown crust colour.
83. Temperature and its effect in baking
temperature phenomena
30°C
Because of the rising temperature, gasses present in the dough expand
45 - 50°C yeast dies
50 - 60°C Intensive enzymatic activity,starch starts to gelatinise
60 - 80°C
End of the gelatinisation of starch
Enzymatic activity ceases because of the denaturation of the enzymes
crumb starts to form,interaction between gluten and starch
100°C Water starts to boil,formation of water vapour first signs of crust formation
110 - 120°C Formation of pale yellow dextrins in the crust
130 - 140°C Formation of brownish dextrins in the crust
140 - 150°C Start of caramelisation process
150 - 200°C Formation of the "crustiness" of the bread and aromatic compounds
> 200°C Carbonisation of the crust ,formation of a porous black mass
85. Oven Temperature and its
Control
If the oven is very hot, the coagulation
of protein, (forming of crust) on their
outer surface will take place very soon.
This crust formation will block the easy
transmission of heat inside the bread.
As a result when gas expands in the
inner portion and crust being non
stretchable, there will be an
exaggerated break in the bread. The
crust color will be took dark and the
bread may not be baked properly from
86. Conti…
Conversely, if the oven is too cold,
coagulation of protein will be delayed and
yeast will remain active for longer period,
which will result in excessive volume of
bread. Due to lack of temperature, bread
will be required to be baked for longer
duration, resulting in evaporation of more
than necessary amount of moisture.
Resultant product will be crumbly and will
stale faster.
87. Humidity in the Oven
When there is sufficient humidity in the
oven , expansion of bread will be even,
enabling the bread to acquire proper
volume.
Lack of humidity in oven will cause faster
evaporation of moisture from external
surface of bread. As a result, there will be
faster formation of crust which will
eventually result in small volume loaf. There
will be uneven expansion and poor shape.
If bread is baked in excessive humidity, the