Download as PDF, PPTX


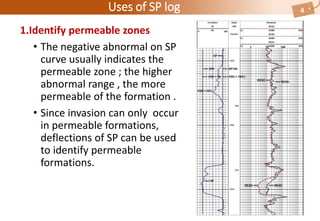
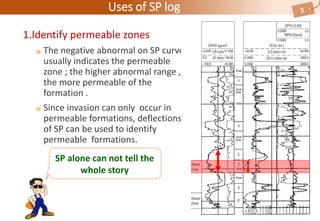
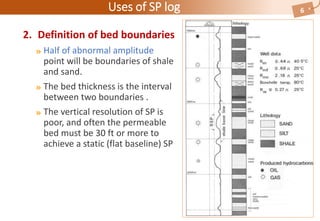
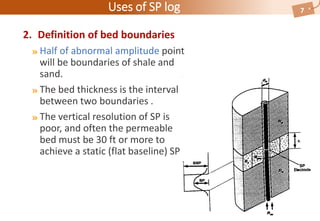
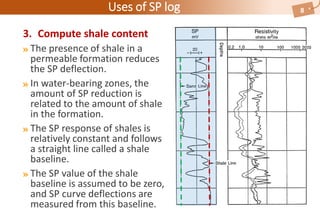
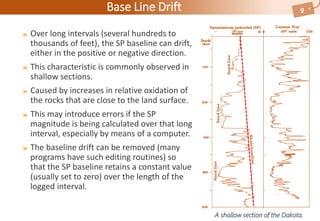
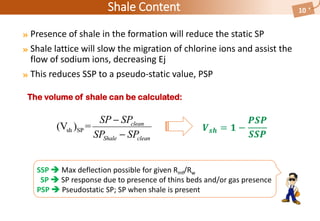
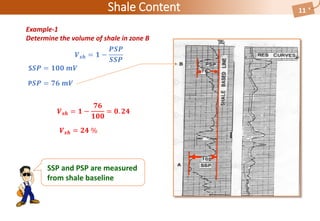
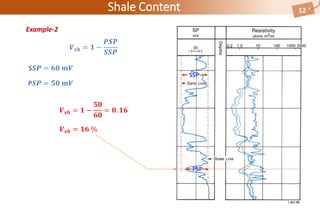
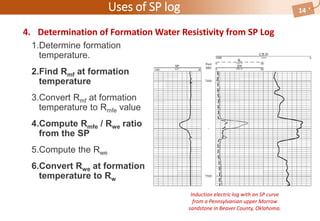
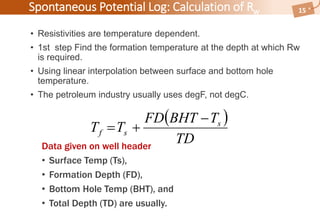
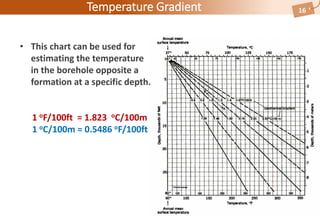
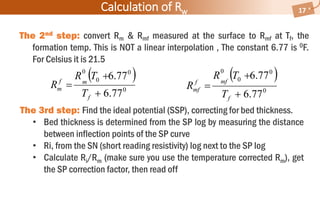
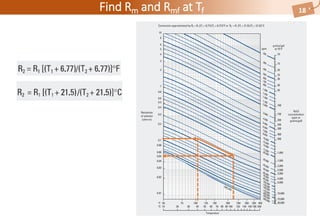
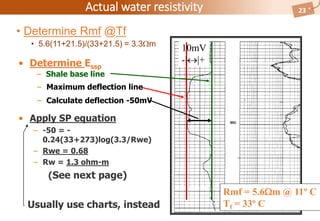
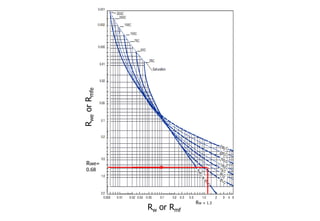
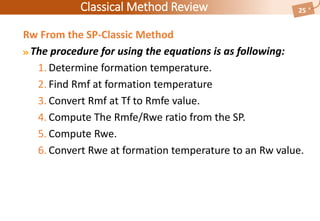
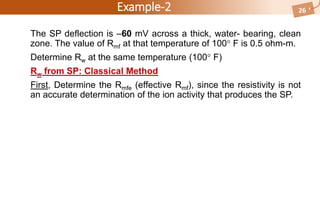
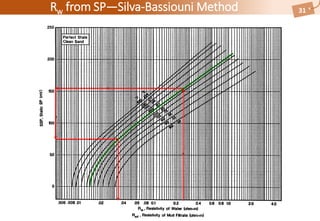
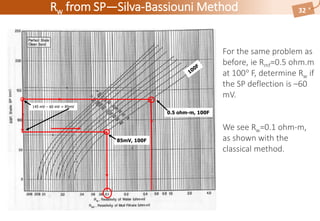
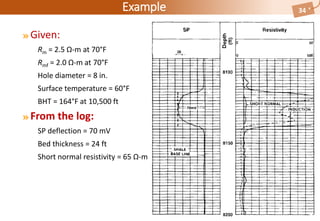


The document discusses the spontaneous potential (SP) well log. It describes how the SP log can be used to identify permeable zones, define bed boundaries, and compute shale content. It provides examples of calculating shale volume from the SP response. The document also discusses determining formation water resistivity from the SP log using both the classical method and the Silva-Bassiouni method. Additional topics covered include factors affecting the SP response, passive log correlation, zonation, and limitations of the SP log.


![Well logging in_7_ [ SP-log]_052629.pptx](https://cdn.slidesharecdn.com/ss_thumbnails/welllogging7sp-log052629-241002191233-0cab3bab-thumbnail.jpg?width=640&height=640&fit=bounds)

![Well Log Interpretation and Petrophysical Analisis in [Autosaved]](https://cdn.slidesharecdn.com/ss_thumbnails/a24a638f-02ab-4332-9396-89ba2cdd02b4-161128031018-thumbnail.jpg?width=640&height=640&fit=bounds)


