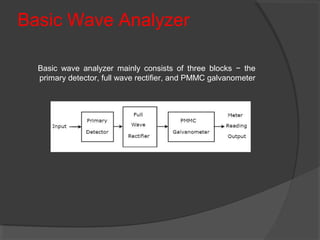
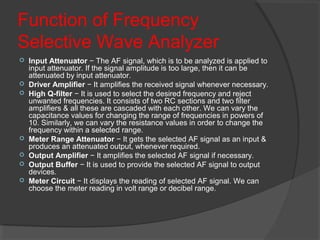
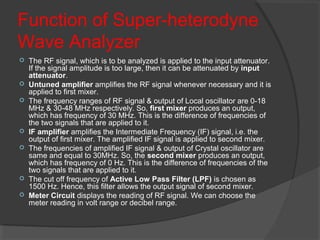
Done by,
Priyanga KR
Assistant Professor
Dept. of ECE
Introduction
 A wave analyzer is an instrument
designed to measure relative amplitudes
of single frequency components in a
complex waveform. Basically, a
wave instrument acts as a frequency
selective voltmeter which is tuned to the
frequency of one signal while rejecting
all other signal components.
Basic Wave Analyzer
Basic wave analyzer mainly consists of three blocks − the
primary detector, full wave rectifier, and PMMC galvanometer
Basic Wave Analyzer
 Primary Detector − It consists of an LC
circuit. We can adjust the values of
inductor, L and capacitor, C in such a way
that it allows only the desired harmonic
frequency component that is to be
measured.
 Full Wave Rectifier − It converts the AC
input into a DC output.
 PMMC Galvanometer − It shows the peak
value of the signal, which is obtained at the
output of Full wave rectifier.
circuit diagram of basic wave
analyzer
This basic wave analyzer can be used for analyzing each and
every harmonic frequency component of a periodic signal
Types
 Frequency Selective Wave Analyzer
 Heterodyne wave analyzer
Frequency Selective Wave
Analyzer
The wave analyzer, used for analyzing the signals are of
AF range is called frequency selective wave analyzer
Function of Frequency
Selective Wave Analyzer
 Input Attenuator − The AF signal, which is to be analyzed is applied to
input attenuator. If the signal amplitude is too large, then it can be
attenuated by input attenuator.
 Driver Amplifier − It amplifies the received signal whenever necessary.
 High Q-filter − It is used to select the desired frequency and reject
unwanted frequencies. It consists of two RC sections and two filter
amplifiers & all these are cascaded with each other. We can vary the
capacitance values for changing the range of frequencies in powers of
10. Similarly, we can vary the resistance values in order to change the
frequency within a selected range.
 Meter Range Attenuator − It gets the selected AF signal as an input &
produces an attenuated output, whenever required.
 Output Amplifier − It amplifies the selected AF signal if necessary.
 Output Buffer − It is used to provide the selected AF signal to output
devices.
 Meter Circuit − It displays the reading of selected AF signal. We can
choose the meter reading in volt range or decibel range.
Super heterodyne Wave Analyzer
The wave analyzer, used to analyze the signals of
RF range is called superheterodyne wave analyzer
Function of Super-heterodyne
Wave Analyzer
 The RF signal, which is to be analyzed is applied to the input attenuator.
If the signal amplitude is too large, then it can be attenuated by input
attenuator.
 Untuned amplifier amplifies the RF signal whenever necessary and it is
applied to first mixer.
 The frequency ranges of RF signal & output of Local oscillator are 0-18
MHz & 30-48 MHz respectively. So, first mixer produces an output,
which has frequency of 30 MHz. This is the difference of frequencies of
the two signals that are applied to it.
 IF amplifier amplifies the Intermediate Frequency (IF) signal, i.e. the
output of first mixer. The amplified IF signal is applied to second mixer.
 The frequencies of amplified IF signal & output of Crystal oscillator are
same and equal to 30MHz. So, the second mixer produces an output,
which has frequency of 0 Hz. This is the difference of frequencies of the
two signals that are applied to it.
 The cut off frequency of Active Low Pass Filter (LPF) is chosen as
1500 Hz. Hence, this filter allows the output signal of second mixer.
 Meter Circuit displays the reading of RF signal. We can choose the
meter reading in volt range or decibel range.
Applications of Wave Analyzers
Wave analyzers have very important
applications in the following fields
 Electrical Measurements
 Sound measurements
 Vibration measurements
DISTORTION
ANALYZERS
 The extent to which the output waveform
of an-
amplifier differs from the waveform
at the input is a measure of the
distortion intro-duced by the inherent
nonlinear characteristics of active
devices such as bipolar or field-effect
transistors or by passive circuit
components. The amount of distortion
can be measured with a distortion
analyzer.
DISTORTION
ANALYZERS
 When an amplifier is not operating in a
linear fashion, the output signal will be
distorted. Distortion caused by nonlinear
operation is called amplitude distortion or
harmonic distortion. It can be shown
mathematically that an amplitude-distorted
sine wave is made up of pure sine-wave
components including the fundamental
frequency f of the input signal and
harmonic multiples of the fundamental
frequency, 2f, 3f, 4f . . . , and so on.
DISTORTION ANALYZERS
 When harmonics are present in
considerable amount, their presence can
be ob-served with an oscilloscope. The
waveform displayed will either have
unequal positive and negative peak values
or will exhibit a change in shape. In either
case, the oscilloscope will provide a
qualitative check of harmonic distortion.
However. the distortion must be fairly
severe (around 10%) to be noted by an
untrained observer.
DISTORTION
ANALYZERS
 In addition, most testing situations
require a better quantitative measure of
harmonic distortion. Harmonic distortion
can be quantitatively measured very
accurately with a harmonic distortion
analyzer, which is generally referred to
simply as a distortion analyzer.
DISTORTION
ANALYZERS
 A block diagram for a fundamental-
suppression harmonic analyzer is shown
in Fig. 1. When the instrument is used.
switch S, is set to the "set level"
position, the band pass filter is adjusted
to the fundamental frequency and the
attenuator network is adjusted to obtain
a full-scale voltmeter reading.
Fig. 1 Block diagram of a distortion analyzer.
DISTORTION
ANALYZERS
 Switch S, is then set to the "distortion"
position, the rejection f:1ter is turned to
the fundamental frequency, and the
attenuator is adjusted for a maximum
reading on the voltmeter.
DISTORTION
ANALYZERS
DISTORTION ANALYZERS
 The total harmonic distortion (THD). which
is frequently expressed as a percentage,
is defined as the ratio of the rms value of
all the harmonics to the rms value of the
fundamental, or
lfundamenta
harmonics
THD
2
)(Σ
=
DISTORTION
ANALYZERS
 This defining equation is somewhat
inconvenient from the standpoint of
measurement. An alternative working
equation expresses total harmonic
distortion as the ratio of the rms value of
all the harmonics to the rms value of the
total signal including distortion. That is,
22
2
)()(
)(
harmonicslfunsamenta
harmonics
THD
Σ+
Σ
=
Harmonic Distortion analyzers
 Fig2a is a harmonic distortion analyzer
used to measure THD.The signal source
has very low distortion and this can be
checked by reading its output distortion
by connecting directly in to the analyzer
 The signal from the source is fed in to
the amplifier under test.This generayes
harmonics and the original fundamental
frequency.The fundamental frequency is
removed by the notch filter
Harmonic Distortion analyzers
 The switch SW is first placed in position
1 and the total content of fundamental
and harmonics is measured.
 Then the switch is moved to position 2
to measure just the harmonics . The
value of THD is
THD= EH/ET*100
Harmonic Distortion analyzers
 Fig.2b shows an alternative
arrangement, where the values of Et
and Eh are read simultaneously and
their ratio calculated and displayed as
THD on the indicator.
 For good accuracy the notch filter must
have excellent rejection and high pass
characteristics
Thank you

Wave analyzers done by Priyanga KR

  • 1.
    Done by, Priyanga KR AssistantProfessor Dept. of ECE
  • 2.
    Introduction  A waveanalyzer is an instrument designed to measure relative amplitudes of single frequency components in a complex waveform. Basically, a wave instrument acts as a frequency selective voltmeter which is tuned to the frequency of one signal while rejecting all other signal components.
  • 3.
    Basic Wave Analyzer Basicwave analyzer mainly consists of three blocks − the primary detector, full wave rectifier, and PMMC galvanometer
  • 4.
    Basic Wave Analyzer Primary Detector − It consists of an LC circuit. We can adjust the values of inductor, L and capacitor, C in such a way that it allows only the desired harmonic frequency component that is to be measured.  Full Wave Rectifier − It converts the AC input into a DC output.  PMMC Galvanometer − It shows the peak value of the signal, which is obtained at the output of Full wave rectifier.
  • 5.
    circuit diagram ofbasic wave analyzer This basic wave analyzer can be used for analyzing each and every harmonic frequency component of a periodic signal
  • 6.
    Types  Frequency SelectiveWave Analyzer  Heterodyne wave analyzer
  • 7.
    Frequency Selective Wave Analyzer Thewave analyzer, used for analyzing the signals are of AF range is called frequency selective wave analyzer
  • 8.
    Function of Frequency SelectiveWave Analyzer  Input Attenuator − The AF signal, which is to be analyzed is applied to input attenuator. If the signal amplitude is too large, then it can be attenuated by input attenuator.  Driver Amplifier − It amplifies the received signal whenever necessary.  High Q-filter − It is used to select the desired frequency and reject unwanted frequencies. It consists of two RC sections and two filter amplifiers & all these are cascaded with each other. We can vary the capacitance values for changing the range of frequencies in powers of 10. Similarly, we can vary the resistance values in order to change the frequency within a selected range.  Meter Range Attenuator − It gets the selected AF signal as an input & produces an attenuated output, whenever required.  Output Amplifier − It amplifies the selected AF signal if necessary.  Output Buffer − It is used to provide the selected AF signal to output devices.  Meter Circuit − It displays the reading of selected AF signal. We can choose the meter reading in volt range or decibel range.
  • 9.
    Super heterodyne WaveAnalyzer The wave analyzer, used to analyze the signals of RF range is called superheterodyne wave analyzer
  • 10.
    Function of Super-heterodyne WaveAnalyzer  The RF signal, which is to be analyzed is applied to the input attenuator. If the signal amplitude is too large, then it can be attenuated by input attenuator.  Untuned amplifier amplifies the RF signal whenever necessary and it is applied to first mixer.  The frequency ranges of RF signal & output of Local oscillator are 0-18 MHz & 30-48 MHz respectively. So, first mixer produces an output, which has frequency of 30 MHz. This is the difference of frequencies of the two signals that are applied to it.  IF amplifier amplifies the Intermediate Frequency (IF) signal, i.e. the output of first mixer. The amplified IF signal is applied to second mixer.  The frequencies of amplified IF signal & output of Crystal oscillator are same and equal to 30MHz. So, the second mixer produces an output, which has frequency of 0 Hz. This is the difference of frequencies of the two signals that are applied to it.  The cut off frequency of Active Low Pass Filter (LPF) is chosen as 1500 Hz. Hence, this filter allows the output signal of second mixer.  Meter Circuit displays the reading of RF signal. We can choose the meter reading in volt range or decibel range.
  • 11.
    Applications of WaveAnalyzers Wave analyzers have very important applications in the following fields  Electrical Measurements  Sound measurements  Vibration measurements
  • 12.
    DISTORTION ANALYZERS  The extentto which the output waveform of an- amplifier differs from the waveform at the input is a measure of the distortion intro-duced by the inherent nonlinear characteristics of active devices such as bipolar or field-effect transistors or by passive circuit components. The amount of distortion can be measured with a distortion analyzer.
  • 13.
    DISTORTION ANALYZERS  When anamplifier is not operating in a linear fashion, the output signal will be distorted. Distortion caused by nonlinear operation is called amplitude distortion or harmonic distortion. It can be shown mathematically that an amplitude-distorted sine wave is made up of pure sine-wave components including the fundamental frequency f of the input signal and harmonic multiples of the fundamental frequency, 2f, 3f, 4f . . . , and so on.
  • 14.
    DISTORTION ANALYZERS  Whenharmonics are present in considerable amount, their presence can be ob-served with an oscilloscope. The waveform displayed will either have unequal positive and negative peak values or will exhibit a change in shape. In either case, the oscilloscope will provide a qualitative check of harmonic distortion. However. the distortion must be fairly severe (around 10%) to be noted by an untrained observer.
  • 15.
    DISTORTION ANALYZERS  In addition,most testing situations require a better quantitative measure of harmonic distortion. Harmonic distortion can be quantitatively measured very accurately with a harmonic distortion analyzer, which is generally referred to simply as a distortion analyzer.
  • 16.
    DISTORTION ANALYZERS  A blockdiagram for a fundamental- suppression harmonic analyzer is shown in Fig. 1. When the instrument is used. switch S, is set to the "set level" position, the band pass filter is adjusted to the fundamental frequency and the attenuator network is adjusted to obtain a full-scale voltmeter reading. Fig. 1 Block diagram of a distortion analyzer.
  • 17.
    DISTORTION ANALYZERS  Switch S,is then set to the "distortion" position, the rejection f:1ter is turned to the fundamental frequency, and the attenuator is adjusted for a maximum reading on the voltmeter.
  • 18.
  • 19.
    DISTORTION ANALYZERS  Thetotal harmonic distortion (THD). which is frequently expressed as a percentage, is defined as the ratio of the rms value of all the harmonics to the rms value of the fundamental, or lfundamenta harmonics THD 2 )(Σ =
  • 20.
    DISTORTION ANALYZERS  This definingequation is somewhat inconvenient from the standpoint of measurement. An alternative working equation expresses total harmonic distortion as the ratio of the rms value of all the harmonics to the rms value of the total signal including distortion. That is, 22 2 )()( )( harmonicslfunsamenta harmonics THD Σ+ Σ =
  • 21.
  • 22.
    Harmonic Distortion analyzers Fig2a is a harmonic distortion analyzer used to measure THD.The signal source has very low distortion and this can be checked by reading its output distortion by connecting directly in to the analyzer  The signal from the source is fed in to the amplifier under test.This generayes harmonics and the original fundamental frequency.The fundamental frequency is removed by the notch filter
  • 23.
    Harmonic Distortion analyzers The switch SW is first placed in position 1 and the total content of fundamental and harmonics is measured.  Then the switch is moved to position 2 to measure just the harmonics . The value of THD is THD= EH/ET*100
  • 24.
    Harmonic Distortion analyzers Fig.2b shows an alternative arrangement, where the values of Et and Eh are read simultaneously and their ratio calculated and displayed as THD on the indicator.  For good accuracy the notch filter must have excellent rejection and high pass characteristics
  • 25.