The document discusses the components and operation of a spectrum analyzer. It describes:
- Major blocks of a spectrum analyzer including the RF input, mixer, IF gain, IF filter, detector, video filter, local oscillator, sweep generator, and display.
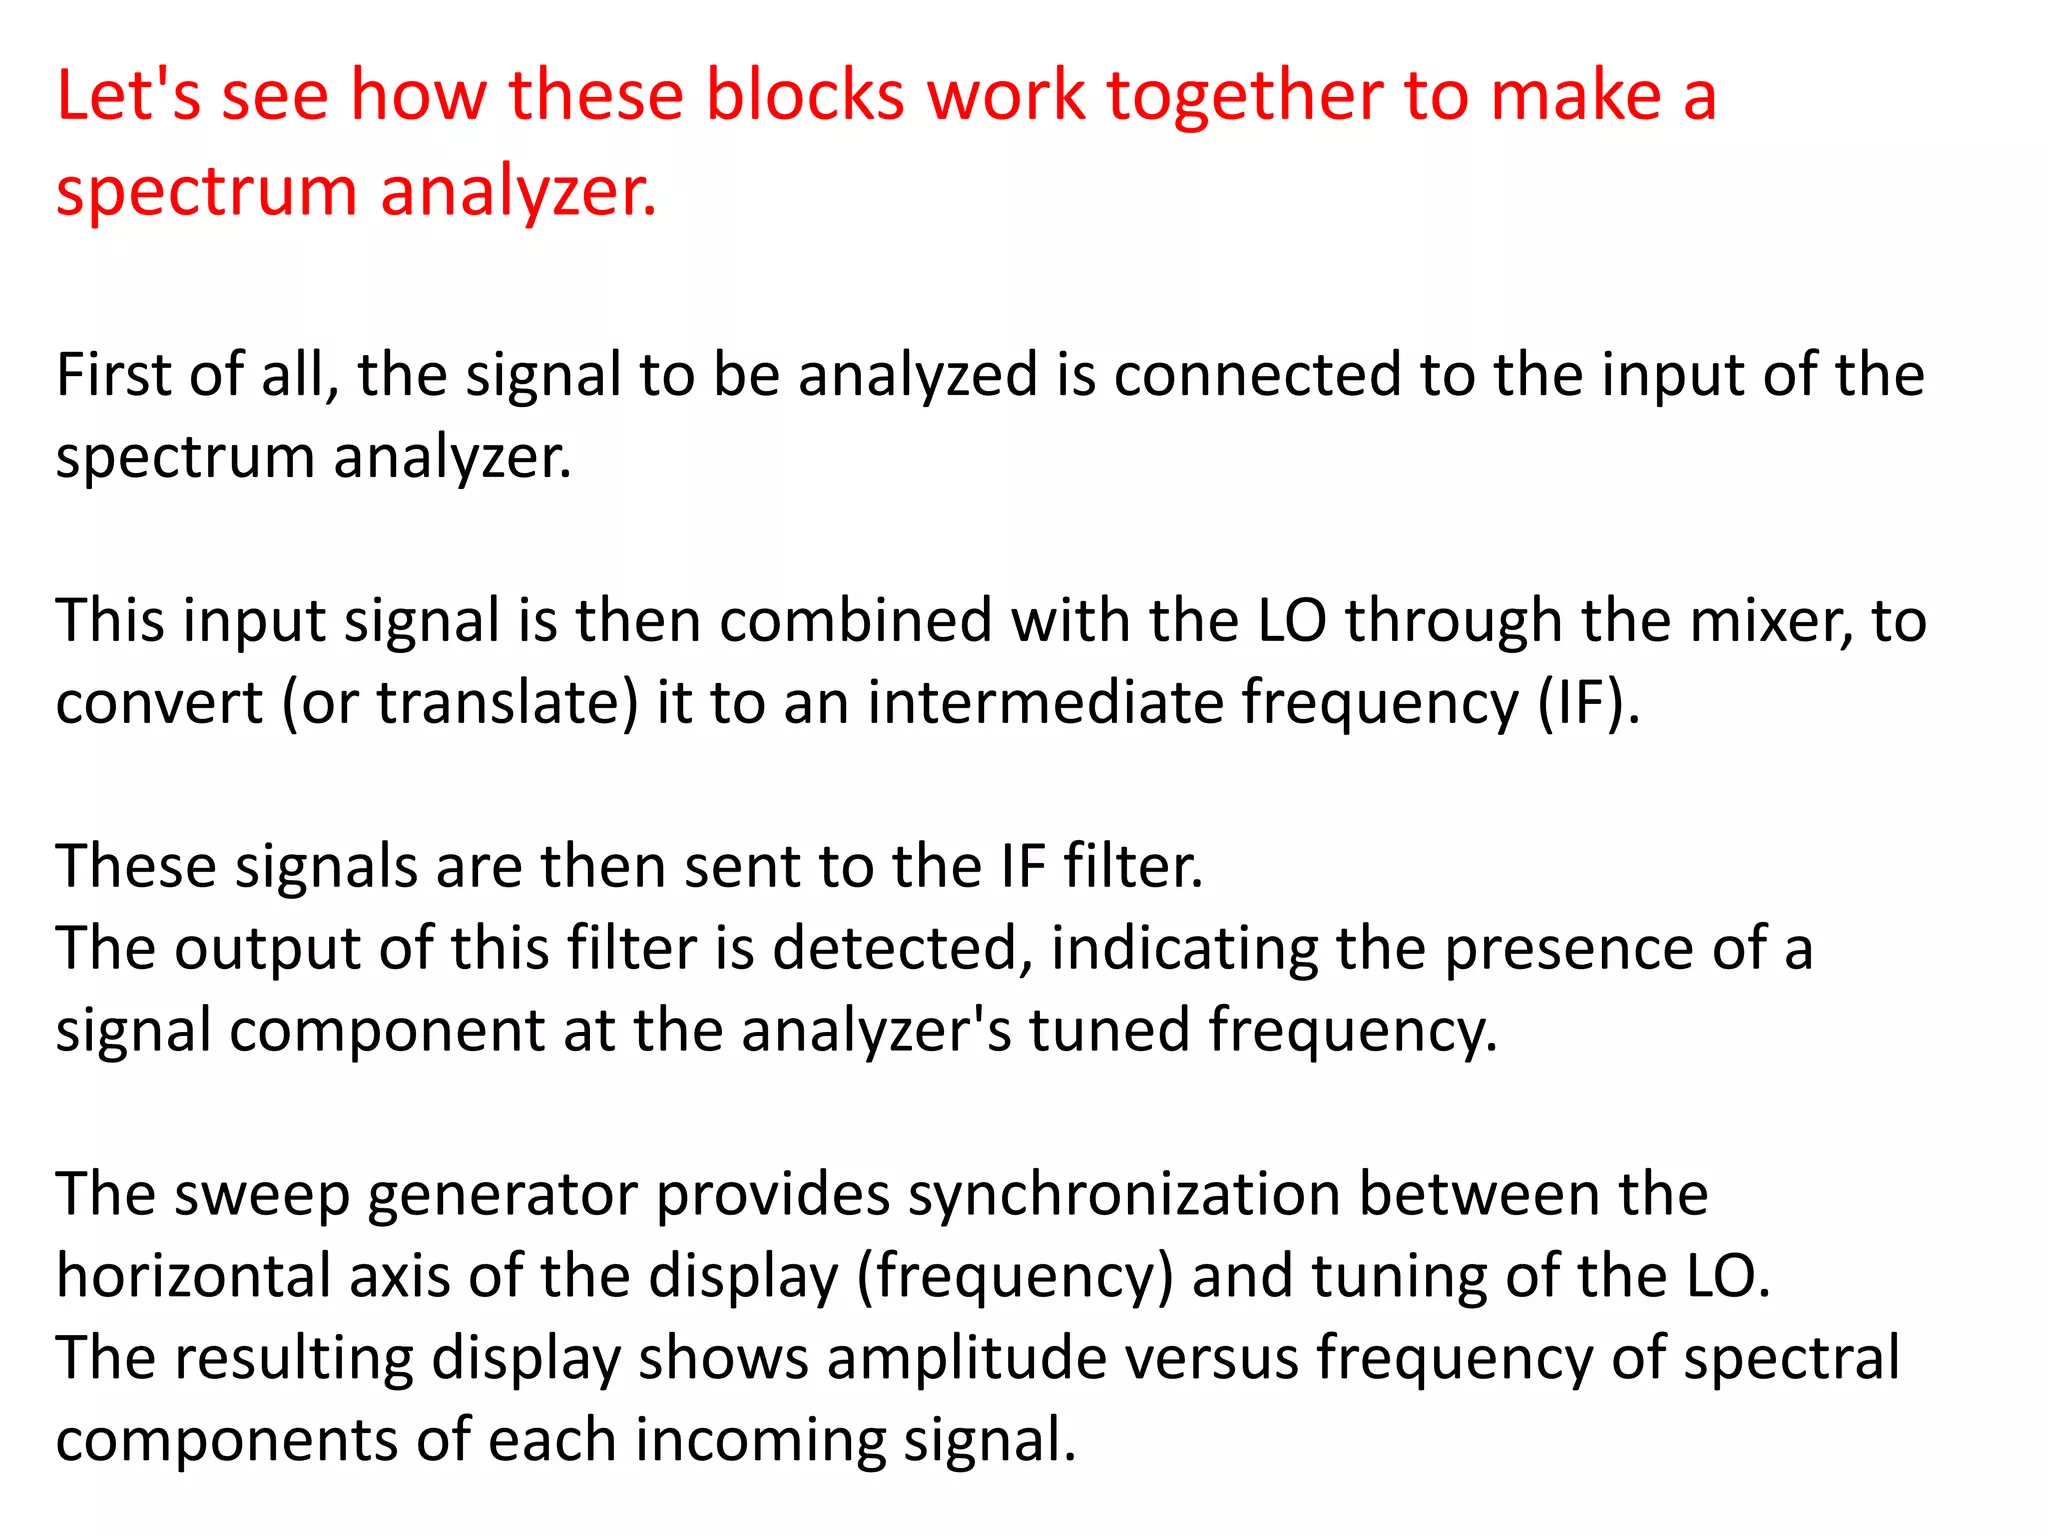
- How these blocks work together to convert an input signal to different frequencies, select specific frequencies using filters, detect the signals, and display the results on screen.
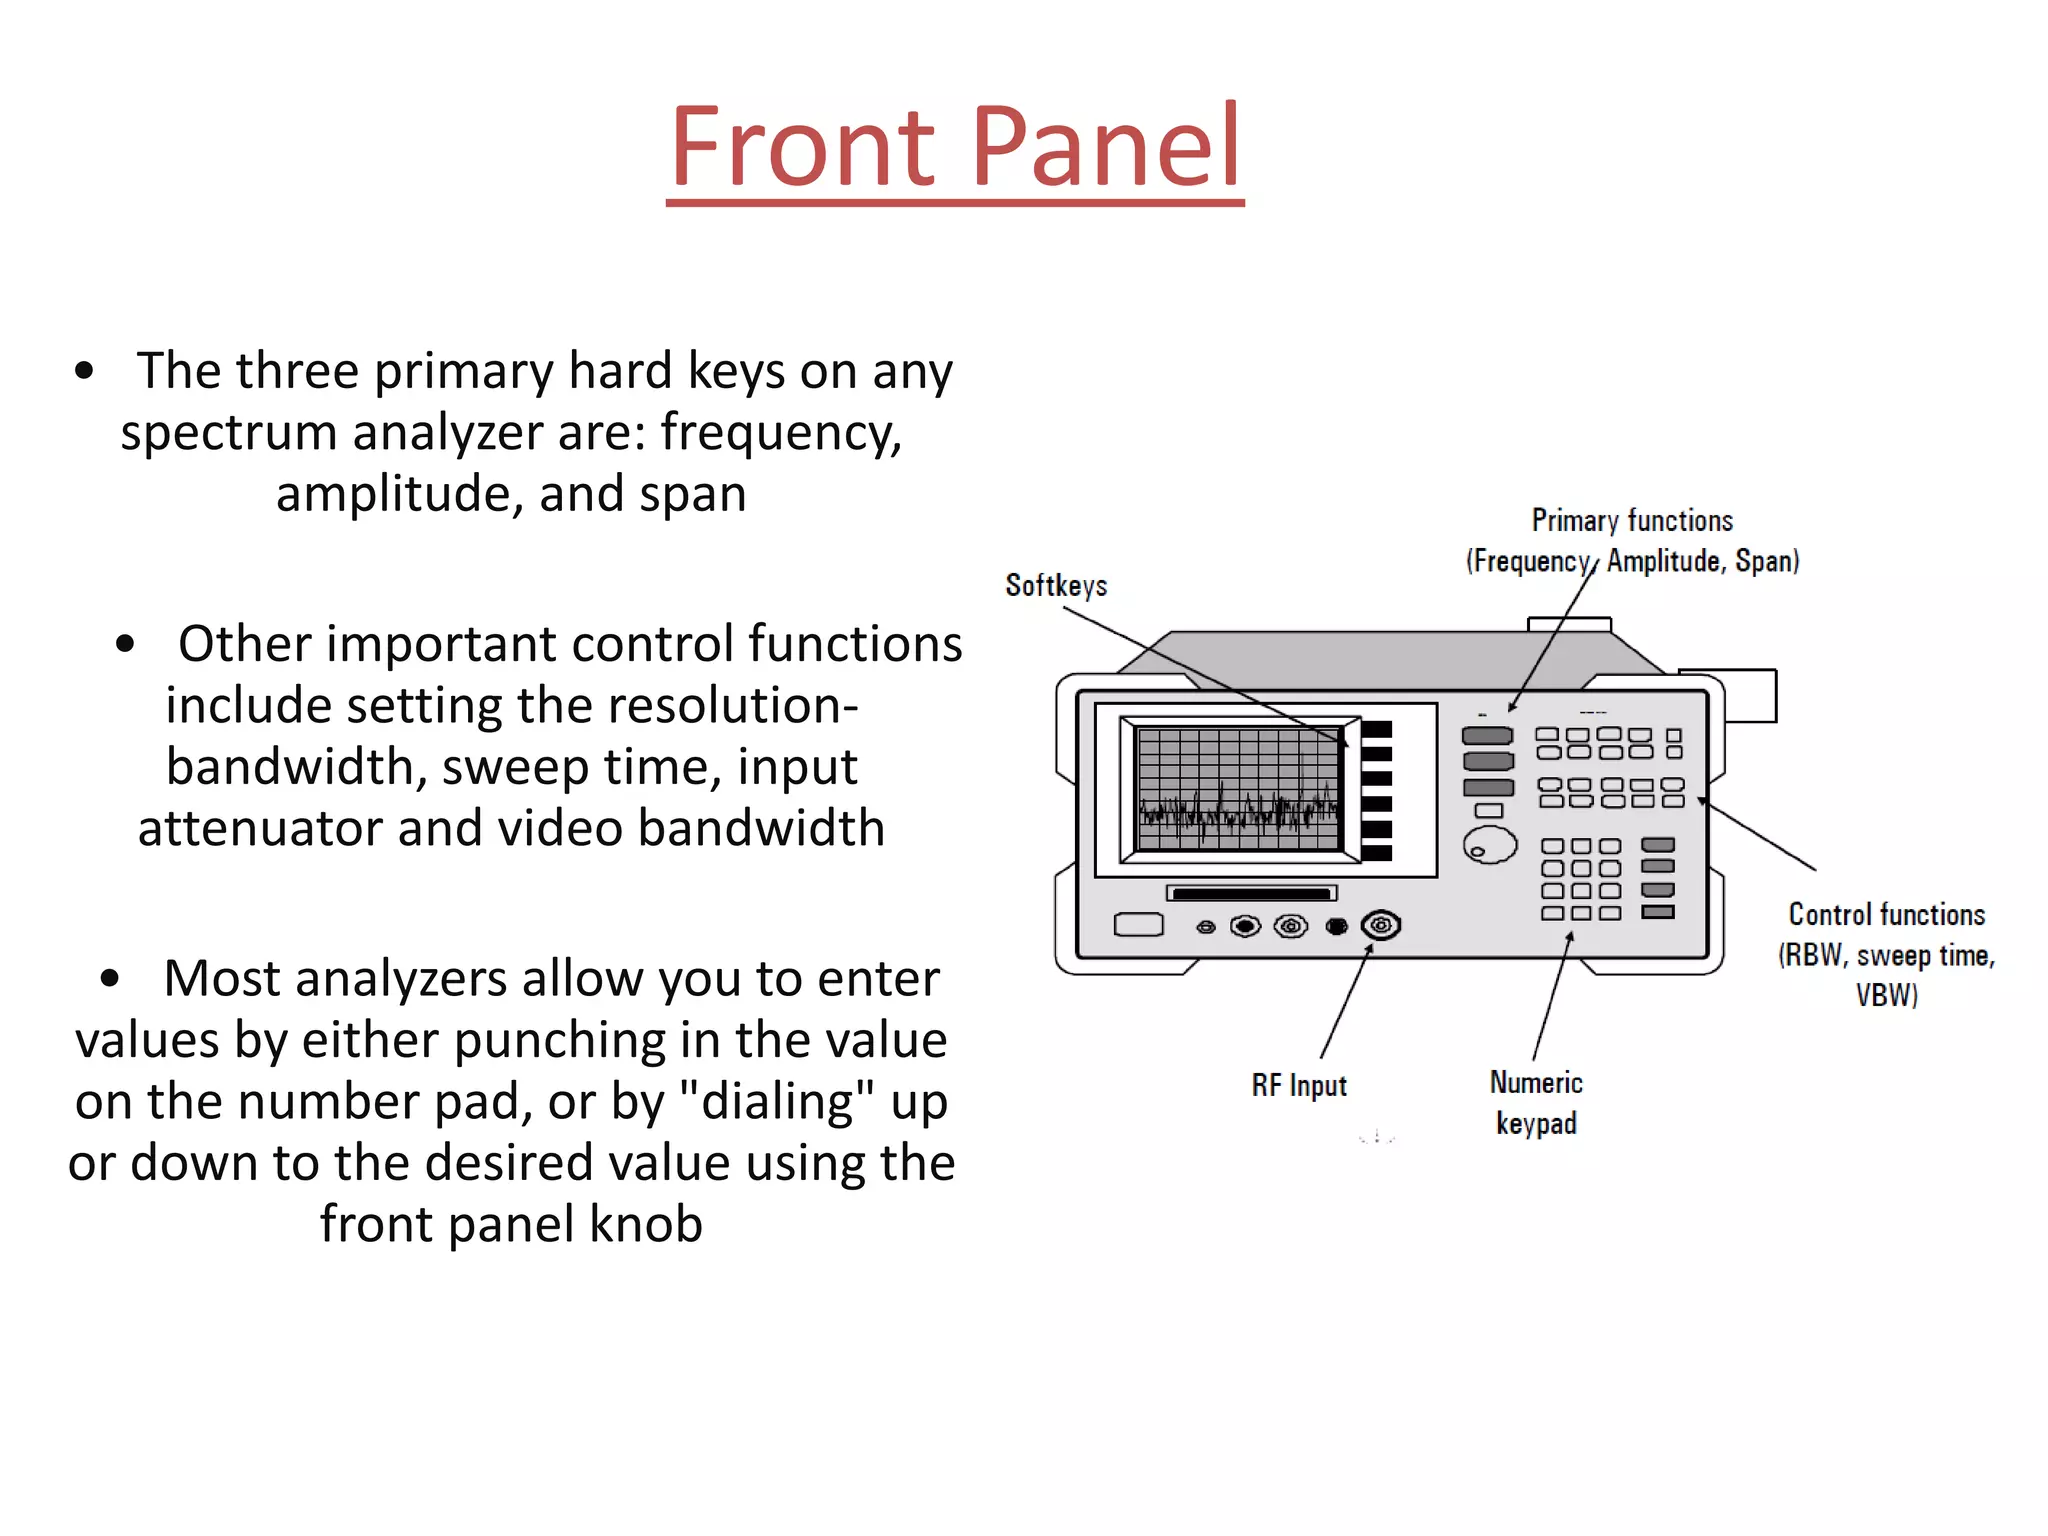
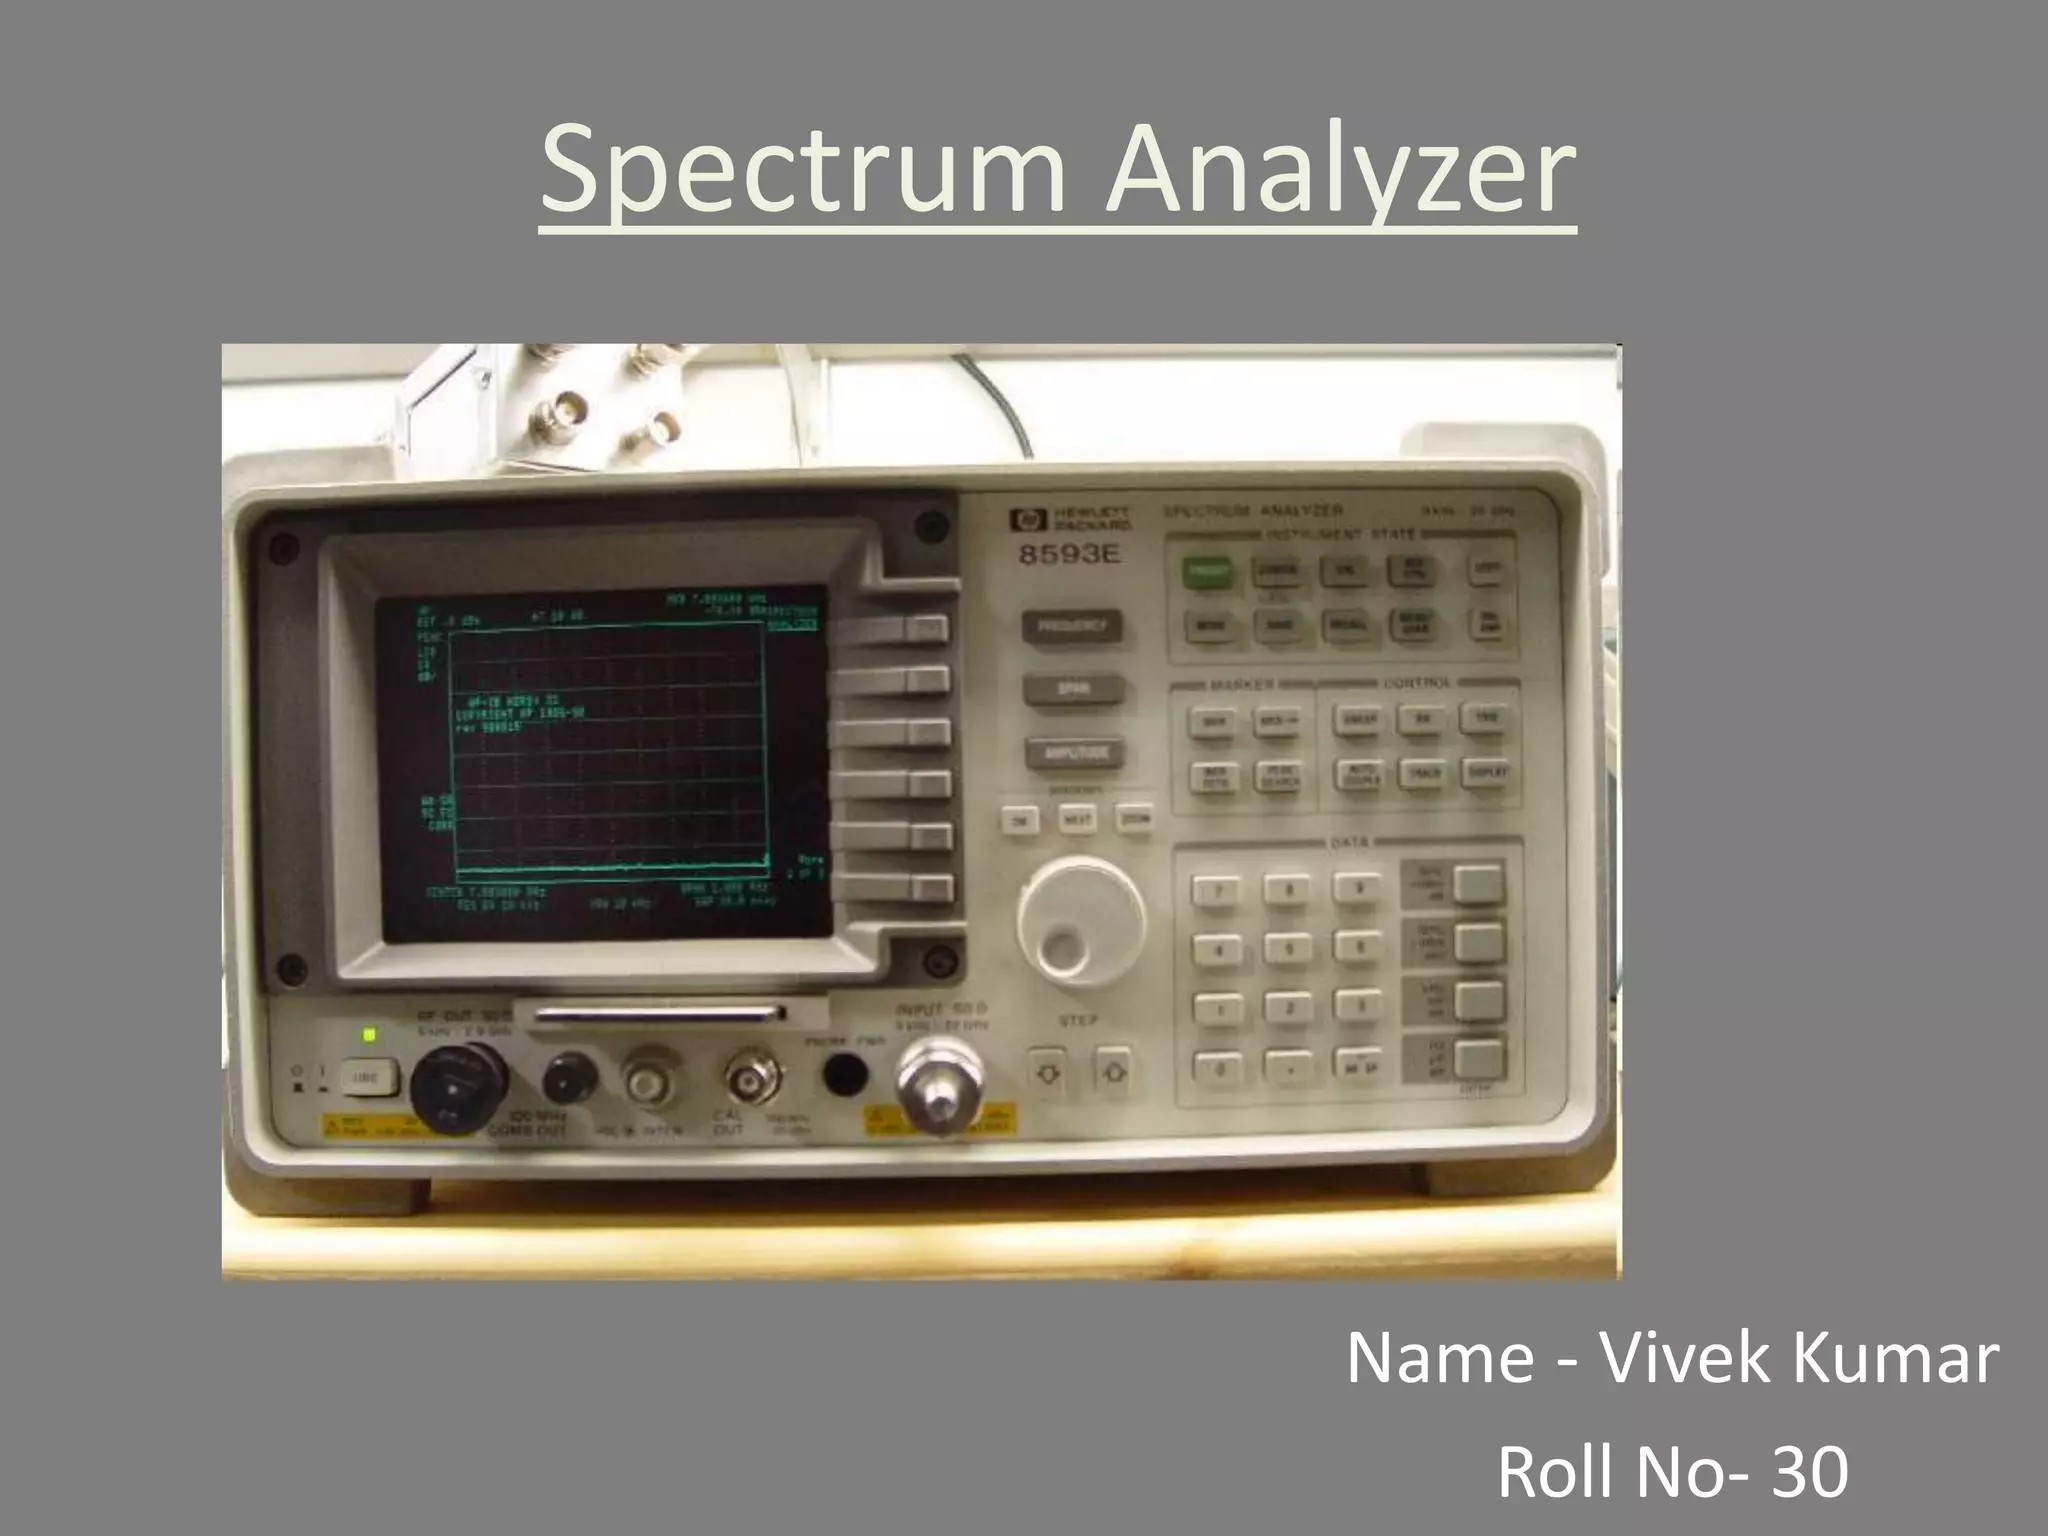
- Functions of the front panel including setting frequency, amplitude, resolution bandwidth, sweep time, and input attenuation.
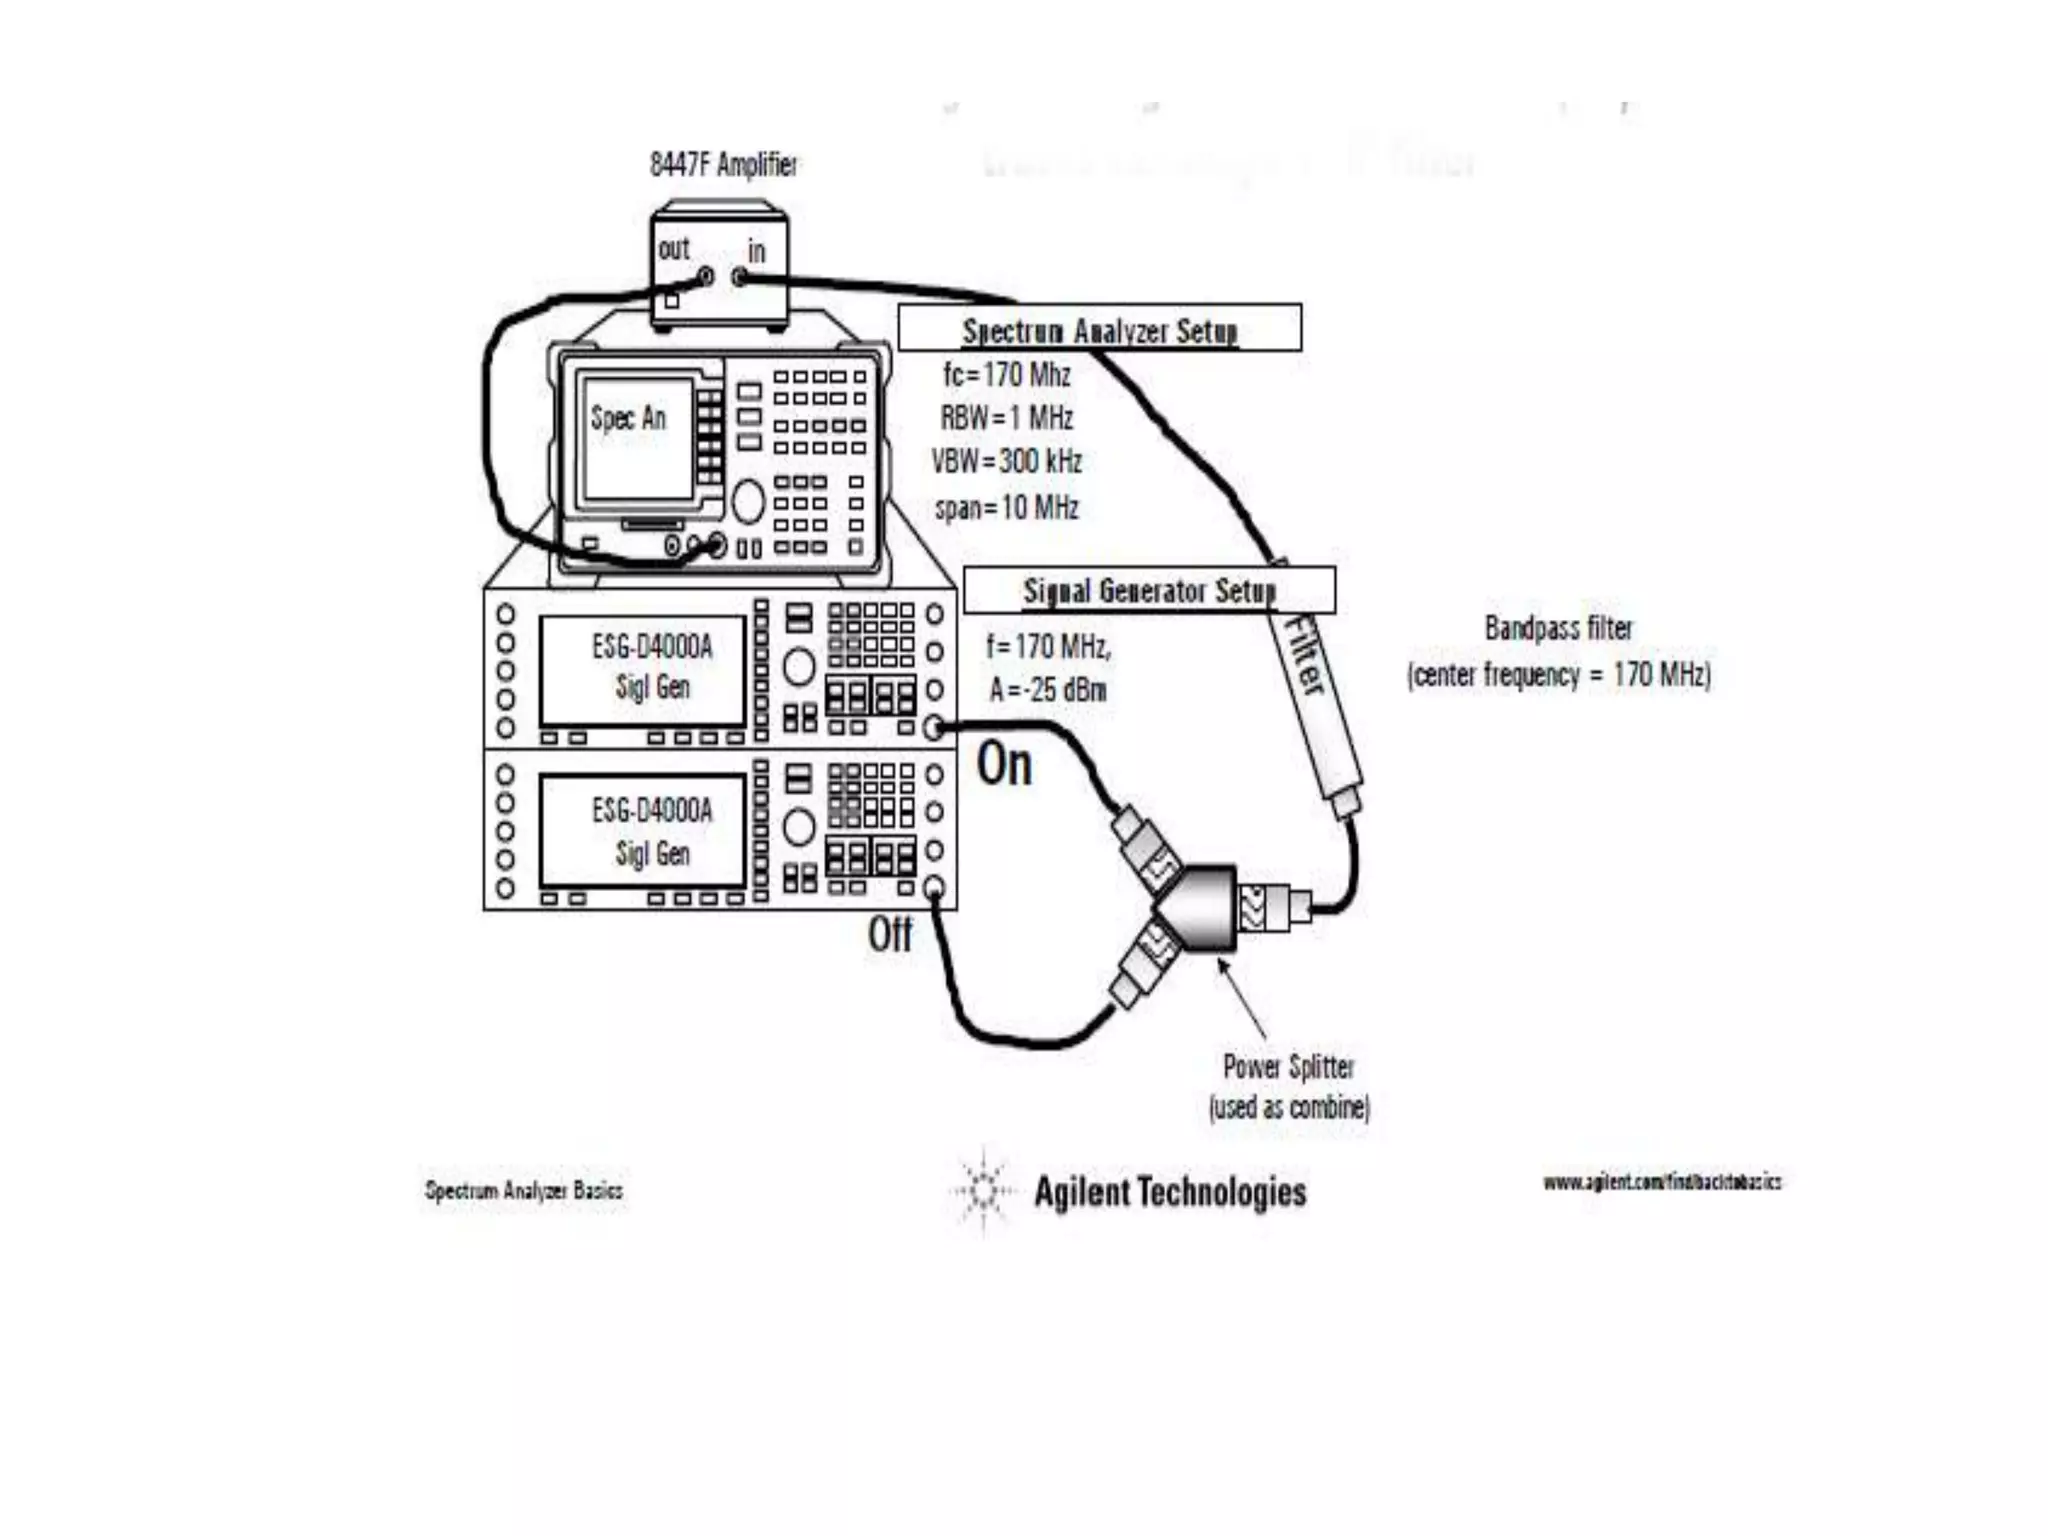
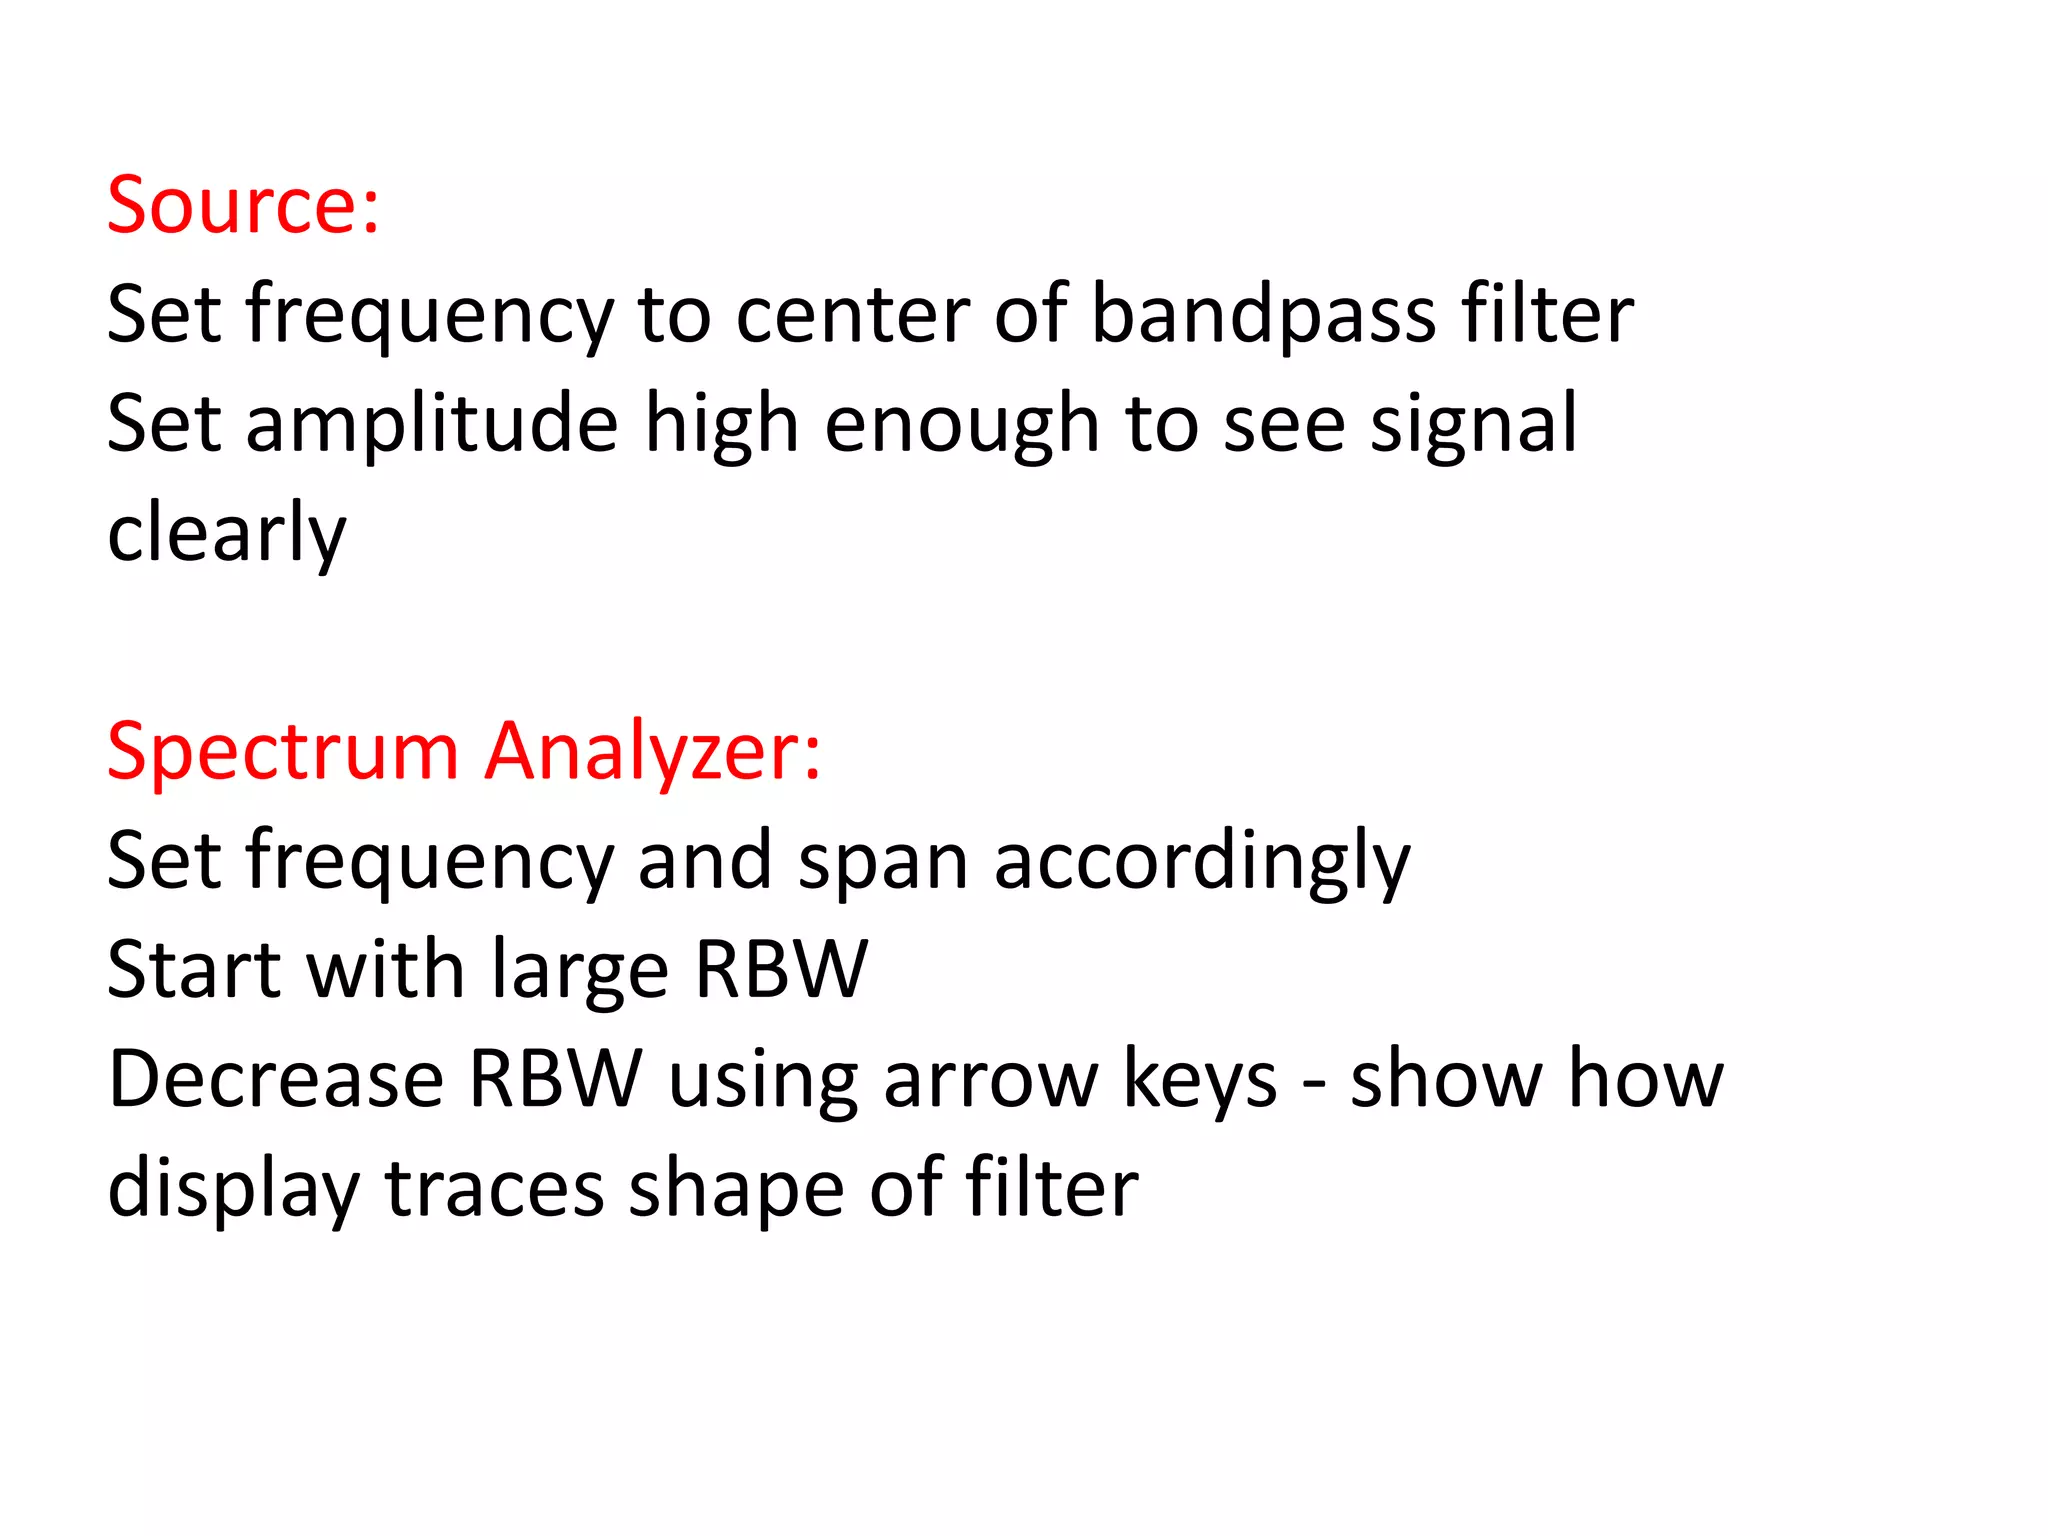
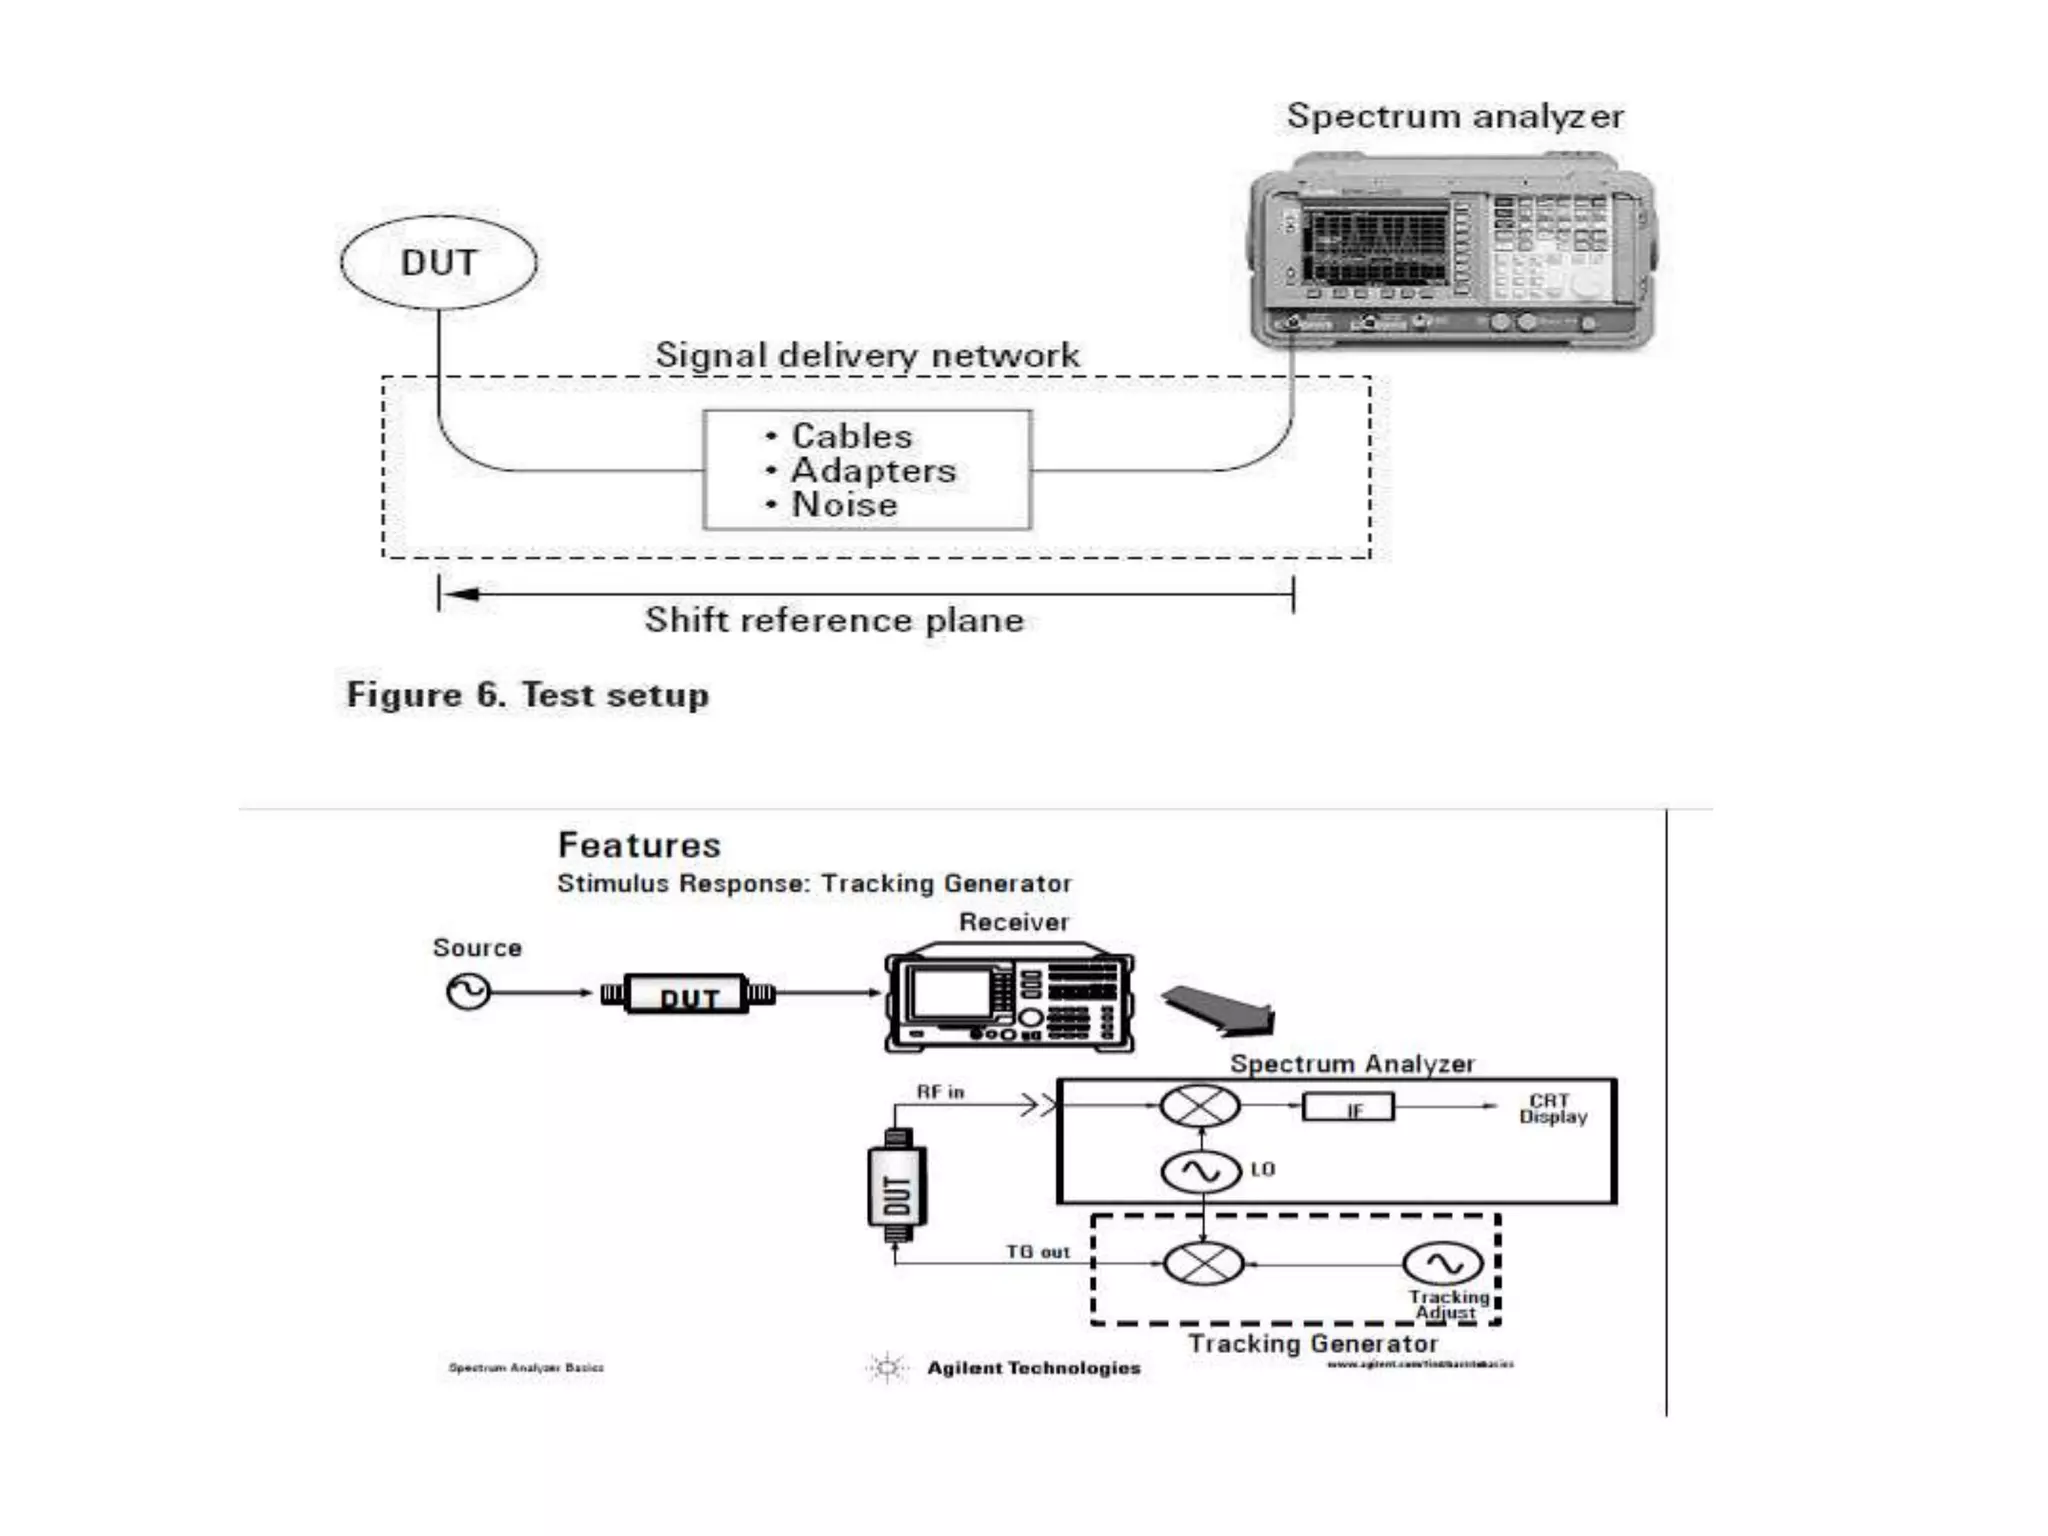
- How spectrum analyzers can be used to analyze signals and characterize devices under test by adjusting settings like frequency and resolution bandwidth.


![Major blocks in a spectrum analyzer are:
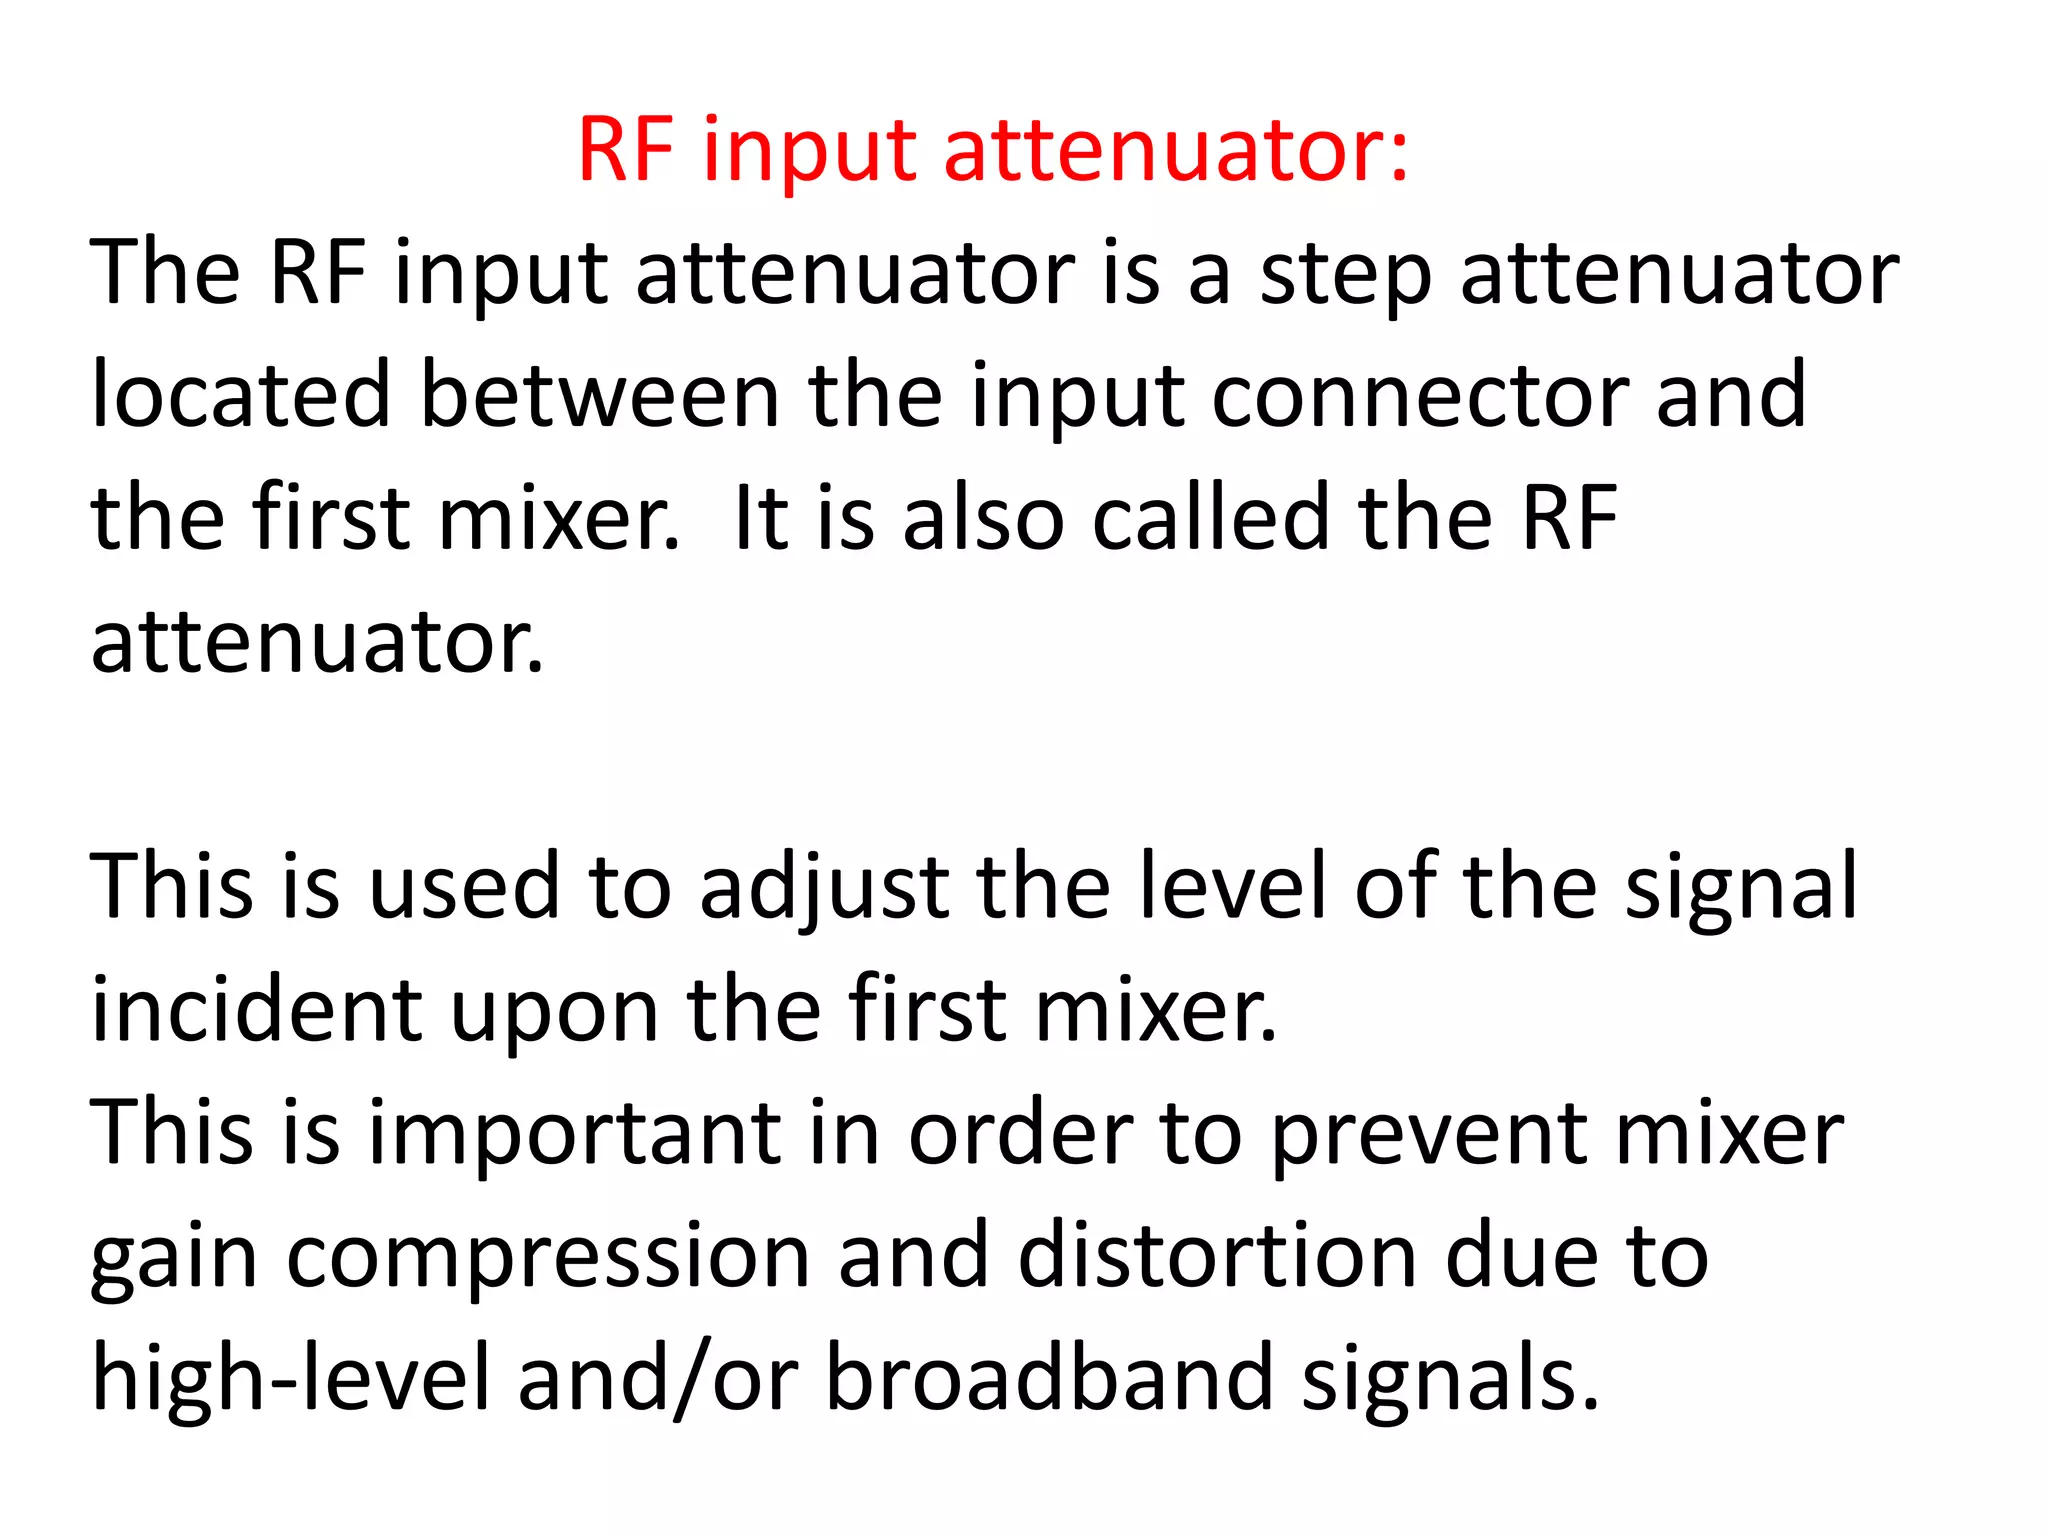
1] RF input attenuator,
2] Mixer,
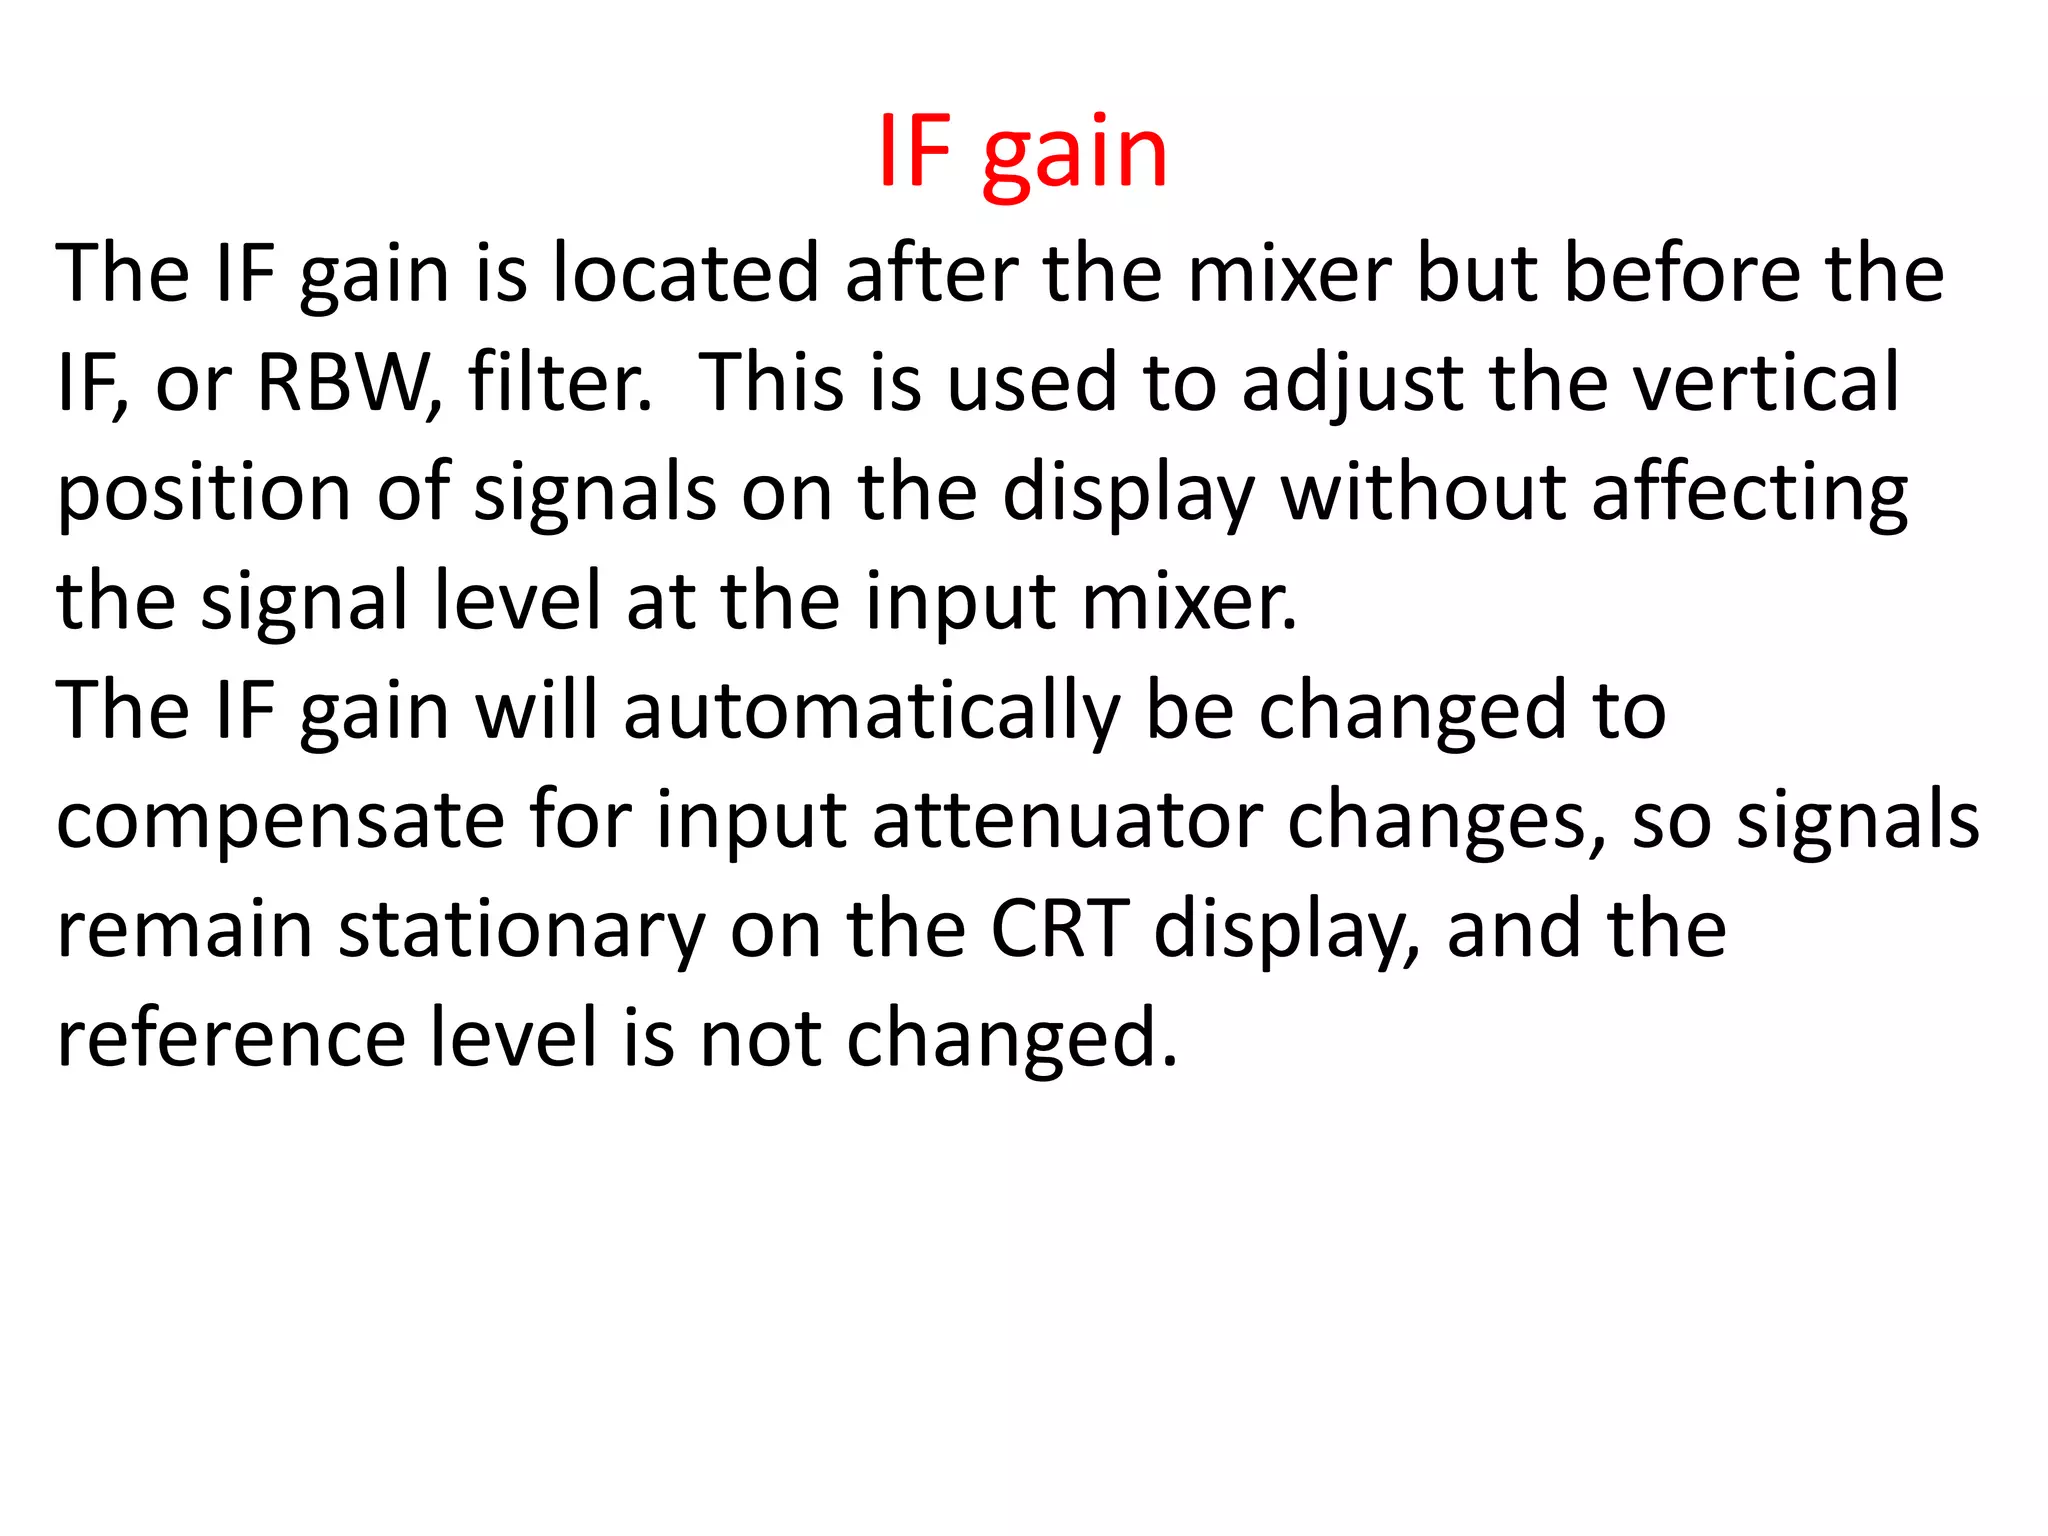
3] IF (Intermediate Frequency) gain,
4] IF filter,
5] Detector,
6] Video filter,
7] Local oscillator,
8] Sweep generator,
9] CRT display.](https://image.slidesharecdn.com/ppt-210409065904/75/spectrum-analyzer-6-2048.jpg)