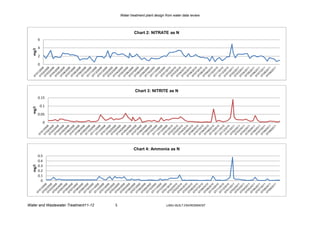
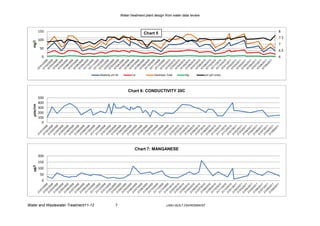
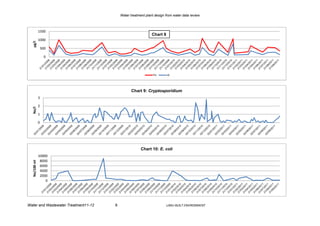
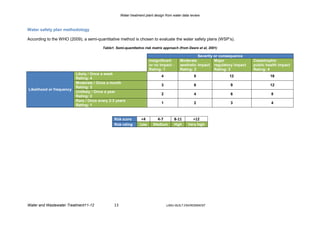
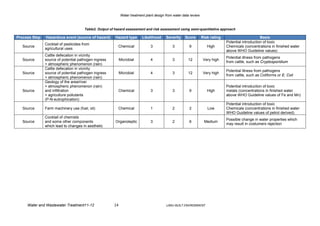
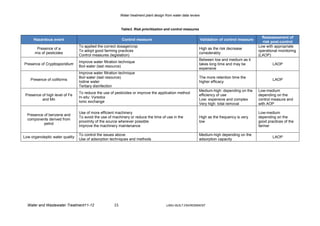
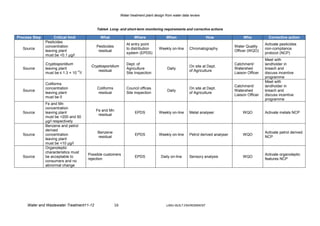
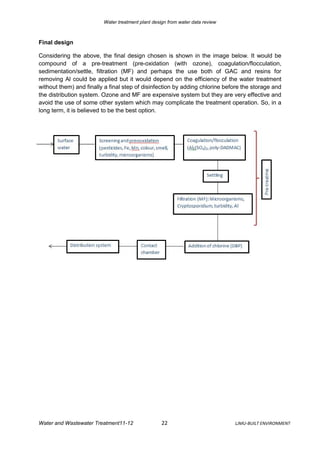
Water treatment plant design from water data review


                    Water treatment plant design
                      from water data review


Water and Wastewater Treatment
Sergio Arenas Gayoso
                                                                                 Photo: Lancaster WTW 17/10/11


   Water and Wastewater Treatment11-12               1                                 LJMU-BUILT ENVIRONMENT
Water treatment plant design from water data review


Index

Introduction                                                      Pag. 3

Review of the water quality data                                 Pag. 3
Pesticides                                                       Pag. 3
Nitrogen                                                         Pag. 3
Hardness                                                         Pag. 6
Conductivity                                                     Pag. 6
Metals                                                           Pag. 6
Microorganisms                                                   Pag. 6
Radioactivity                                                    Pag. 10
Turbidity                                                        Pag. 10
Colour                                                           Pag. 10
TOC                                                              Pag. 10

Characterization of the source water                             Pag. 12

Water safety plan methodology                                    Pag. 13

Water treatment plant design                                     Pag. 17
Coliform removal by the conventional treatment process           Pag. 17
Coliform removal by membrane bioreactors                         Pag. 17
Cryptosporidium                                                  Pag. 18
Disinfection by-products                                         Pag. 18
Turbidity                                                        Pag. 20
Manganese                                                        Pag. 21
Aluminium                                                        Pag. 21
Pesticides                                                       Pag. 21
Final design                                                     Pag. 22

Maintenance and monitoring scheme                                Pag. 23

Conclusion                                                       Pag. 24

References                                                       Pag. 24


                            Number of words (excluding references): 4860


Water and Wastewater Treatment11-12               2                           LJMU-BUILT ENVIRONMENT
Water treatment plant design from water data review


Introduction

The present work tries to evaluate and determinate a water treatment plant from a water
quality data provided.

The characterization of the source water as well as the pollutants contained and their
possible sources have been carried out.

Using the World Health Organization (WHO) Water Safety Plan methodology, the risk
assessment has been undertaken, identifying effective control measures, and describing
appropriate monitoring of the water source.

A water treatment plant has been designed which will adequately treat the water to meet the
conditions for Drinking Water citing the appropriate regulations for the microbiological,
disinfection by-products, turbidity, manganese, aluminum and pesticides parameters
justifying the choice of each process unit chosen.

Finally, a suitable maintenance and monitoring scheme for the chosen process has been
devised.

Review of the water quality data

Pesticides

According to the EU drinking water directive (EUDWD, 1998), the parametric value for total
pesticides is 0.5 (μg/l) and as the chart shows, the value is never reached during the three
years period. However, the parametric value applied to each individual pesticide (which
means organic insecticides, herbicides, fungicides, etc.) is 0.1 μg/l.

Thus, the following pesticides (chart 1) exceed the individual value suggested: Diuron
(herbicide), 24D (herbicide), Atrazine (herbicide), Metaldehyde (pesticide against
gastropods), Mecoprop (herbicide), and MCPA (herbicide). Classification obtained through
FPA (2002).

Furthermore, their concentration (≥1 μg/l), follows a seasonally behaviour, normally between
April and October.

Nitrogen

As the charts 2-4 show, nitrate, nitrite and ammonia have exactly the same behaviour.
According to the WHO Guidelines for Drinking-Water Quality (WHO, 2011), both nitrate and
nitrite as N are not present in significant concentrations (11 and 0.9 mg/l respectively). The
ammonia as N it is also under the threshold odour concentration.

There is a peak right at the end of the year 2010 in all of them, however the value reached,
do not present problem at all.


Water and Wastewater Treatment11-12                3                           LJMU-BUILT ENVIRONMENT
Water treatment plant design from water data review


                                                         Chart 1: PESTICIDES TOTAL
  0.3


 0.25


  0.2


 0.15


  0.1


 0.05


    0


                         12 DIMETHYLBENZE         24 D                           245T                 24DB
                         Aldrin+Dieldrin          ATRAZINE                       Bromoxynil           CARBENDAZIM
                         CARBETAMIDE              Carbofuran                     CHLORMEQUAT          CHLORTOLURON
                         CLOPYRALID               Cyanazine                      DIAZINON             Dicamba
                         DICHLOROPROP             DIURON                         Ethofumesate         FLUROXYPYR
                         GLYPHOSATE               HCH GAMMA TOT                  Heptachlor           Heptachlor epoxid
                         IOXYNIL                  ISOPROTURON                    LINURON              MCPA
                         MCPB                     MECOPROP                       METALDEHYDE          PESTICIDES TOTAL
                         Phnmedipham              Propetamphos                   Propyzamide          SIMAZINE
                         Triclopyr                Triforine                      Maximun              PESTICIDES Overall permited


Water and Wastewater Treatment11-12         4                                LJMU-BUILT ENVIRONMENT
Water treatment plant design from water data review


                                                  Chart 2: NITRATE as N
         6

         4
  mg/l


         2

         0


                                                   Chart 3: NITRITE as N
         0.15

             0.1
  mg/l


         0.05

               0


                                                  Chart 4: Ammonia as N
         0.5
         0.4
         0.3
  mg/l


         0.2
         0.1
           0


Water and Wastewater Treatment11-12   5                                LJMU-BUILT ENVIRONMENT
Water treatment plant design from water data review


Hardness

According to the chart 5, hardness alkalinity, Ca and Mg have the same behaviour along the
three years. According to the WHO guideline, both Ca and Mg are under the taste threshold
(100-300 mg/l). Hardness acceptability may vary considerably from one community to
another; however consumers tolerate water hardness in excess of 500 mg/l, well above the
value along the period in this case (it never exceeds 150 mg/l and never goes under 50 mg/l,
being the average of 92 mg/l), so should not be problems with the interaction of alkalinity
and pH. According to the hardness, water might be considered soft (under 100 mg/l).

Corrosion should not be problem of water mains and pipes in household water systems as it
ranges 6.5-8.5 as it is recommended. The average in this case is 7.34.

Conductivity

Conductivity ranges 100-400 µsie/cm. According to the EU directive it should not be higher
than 2500 µsie/cm. therefore, the values are considered normal (chart 6). Conductivity
behavior does not seem to be affected neither by the nitrogen compounds, Ca, Mg nor
metals like Fe, Al or Mn. Only the peak on 29/12/10 in nitrogen compounds, minerals and
metals seem to be related to.

Metals

According to the EUDWD and considering charts 7 and 8:

        Mn: the parametric value is 50 μg/l and the average along the period is 52 μg/l.
         However, the data show figures normally well above this value, especially from 2009.
         There are three main peaks: in the middle of 2009, at the end of 2010 and right at the
         beginning of 2011.
        Fe: the parametric value is 200 μg/l. However, its values are well above along the
         three years period. In fact, it reaches 1000 μg/l four times at the end/beginning of
         each year.
        Al: the parametric value is 200 μg/l. It follows the same behavior of the Fe and it is
         also above of 200 μg/l along the period of the data (an average of 226 μg/l).

Microorganisms

According to the WHO (2011), there must not be coliforms presence after the disinfection
process. Regarding cryptosporidium, it must be reduced to minimum levels in drinking water
(1.3 × 10⁻⁵/l). As the charts 9-11 depict, both E.coli and total coliforms as well as
Cryptosporidium, are presented along the period. Thus, the average for E.coli, total coliforms
and Cryptosporidium presence are respectively: 895 No/100 ml, 7700 No/100 ml and 0.5
No/l .


Water and Wastewater Treatment11-12                 6                           LJMU-BUILT ENVIRONMENT
Water treatment plant design from water data review


            150                                                                                                                8
                                                                        Chart 5
                                                                                                                               7.5
            100
  mg/l

                                                                                                                               7
            50
                                                                                                                               6.5
             0                                                                                                                 6


                                      Alkalinity pH 45          Ca            Hardness Total      Mg           pH (pH units)


                                                              Chart 6: CONDUCTIVITY 20C
            500
            400
  µsie/cm


            300
            200
            100
              0


                                                                  Chart 7: MANGANESE
            200
            150
  µg/l


            100
            50
             0


Water and Wastewater Treatment11-12                7                                   LJMU-BUILT ENVIRONMENT
Water treatment plant design from water data review


              1500
                                                              Chart 8
              1000
  µg/l


                  500

                   0


                                                               Fe       Al


                                                 Chart 9: Cryptosporidium
              3

              2
  No/l


              1

              0


                                                       Chart 10: E. coli
              10000
               8000
  No/100 ml


               6000
               4000
               2000
                  0


Water and Wastewater Treatment11-12   8                                 LJMU-BUILT ENVIRONMENT
Water treatment plant design from water data review


                                                    Chart 11: COLI TOT
              40000
              30000
  No/100 ml


              20000
              10000
                  0


                                               Chart 12: Radioactivity (Bq/l)
  0.4

  0.2

        0


                                                               α       β


Water and Wastewater Treatment11-12   9                                LJMU-BUILT ENVIRONMENT
Water treatment plant design from water data review


Radioactivity

If the results of the analysis of drinking water are lower than 0.5 Bq/l for total alpha
radioactivity and 1 Bq/l for total beta radioactivity, then additional analysis are no required
(ICRP, 1991). As the chart 12 shows, total alpha radioactivity never reaches 0.1 Bq/l and the
highest value for total beta radioactivity throughout the period is 0.29 Bq/l.

Turbidity

According to WHO (2011), if levels are below of 10 NTU, the water is considered clear. The
average throughout the period of sampling is 9 NTU (chart 13), even considering an unusual
peak in November of 2009 which reaches almost 100 NTU.

Colour

According to the EUDWD (1998), the standard for colour is 20 Hazen (a level at which there
is no visible sign of colour). The chart 14 shows how the levels are constant during the three
years period, but normally above of 20 Hazen. The presence of aluminium at concentrations
in excess of 100–200 μg/l may cause deposition of aluminium hydroxide floccules and the
exacerbation of discoloration of water by iron. Colour is strongly influenced by the presence
of iron and other metals (WHO, 2011).

TOC

Apparently, there is a peak every November-December of each year (chart 15). There is not
established a parametric value for TOC, however the EUDWD says there should not be
abnormal changes once the water has been treated.


Water and Wastewater Treatment11-12                10                          LJMU-BUILT ENVIRONMENT
Water treatment plant design from water data review


                                                     Chart 13: TURBIDITY
         150

         100
  NTU


          50

              0


                                                      Chart 14: COLOUR
         100
          80
          60
  HAZ


          40
          20
           0


                                                         Chart 15: TOC
         20
         15
  mg/l


         10
          5
          0


Water and Wastewater Treatment11-12   11                                LJMU-BUILT ENVIRONMENT
Water treatment plant design from water data review


Characterization of the source water

According to the above, the characterization of the source water will be carried out
depending on the present pollutants, trying to give reasonably explanation of their possible
sources.

Regarding pesticides, even though both annual variation and levels along the period are low
for most of the pesticides, it seems to be a seasonal variation with some pesticides (chart 1).
Thus, apparently there are peaks between the spring-summer season and end of autumn,
which could coincide with spring and winter cereals. Besides, the total of pesticides variation
is more obvious. It may be a reason to think about surface water located in an area either
with agricultural practices or road, railway refurbishment works (FPA, 2002; Palma et al,
2009).

Overall, N levels (as nitrate/nitrite and ammonia) are very low throughout the years (charts 2-
4) except a peak produced in one determined day. Groundwater normally have high levels of
these components because they are highly mobile (Canter, 1997; Bergström and
Kirchmann, 1999), so again, one could say that surface water would be the source in this
case.

However, presence of metals like Fe or Mn are more common in groundwater (Kim et al,
2008), especially in mine areas. Yet, in surface water these metals may be in high levels if
an eutrophication process is been carried out (Tankéré et al, 2000). Even though
eutrophication is mainly due to N and P, it would coincide with the presence of agricultural
practices, being the main source of pollution.

Undoubtedly, the most determinant factor in order to characterize the source water is the
presence of microorganisms and especially the high levels of total coliforms (chart 11) as
they are more common in surface water (Medema et al, 1998).

The presence of coliforms indicates faecal water, which is extremely common in sewage
water. However, taken into account all the parameters along with the presence of
Cryptosporidium, is every likelihood the final source was a mixed farming, with crops and
livestock which would explain the presence the faecal water and therefore, the presence of
coliforms and Cryptosporidium (WHO, 2011). Thus, to sum up, the data might come from
either a river or lake (surface water) where there could be an incipient eutrophication
process and where, presumably, there are agricultural and stockbreeding practices in the
area.


Water and Wastewater Treatment11-12                12                          LJMU-BUILT ENVIRONMENT
Water treatment plant design from water data review


Water safety plan methodology

According to the WHO (2009), a semi-quantitative method is chosen to evaluate the water safety plans (WSP’s).

                                        Table1. Semi-quantitative risk matrix approach (from Deere et al, 2001)

                                                                                                    Severity or consequence
                                                                      Insignificant       Moderate           Major             Catastrophic
                                                                      or no impact -      aesthetic impact regulatory impact   public health impact
                                                                      Rating: 1           Rating: 2          Rating: 3         Rating: 4
                          Likely / Once a week
                                                                              4                    8               12                   16
                          Rating: 4
                          Moderate / Once a month
                                                                              3                    6                9                   12
                          Rating: 3
Likelihood or frequency
                          Unlikely / Once a year
                                                                              2                    4                6                   8
                          Rating: 2
                          Rare / Once every 2-3 years
                                                                              1                    2                3                   4
                          Rating: 1


                                               Risk score        <4       4-7         8-11       >12
                                               Risk rating      Low      Medium       High     Very high


Water and Wastewater Treatment11-12            13                                 LJMU-BUILT ENVIRONMENT
Water treatment plant design from water data review


                                       Table2. Output of hazard assessment and risk assessment using semi-quantitative approach

Process Step   Hazardous event (source of hazard)        Hazard type       Likelihood     Severity    Score        Risk rating                        Basis
                                                                                                                                 Potential introduction of toxic
               Cocktail of pesticides from
   Source                                                 Chemical              3             3          9            High       Chemicals (concentrations in finished water
               agricultural uses
                                                                                                                                 above WHO Guideline values)
               Cattle defecation in vicinity
                                                                                                                                 Potential illness from pathogens
   Source      source of potential pathogen ingress          Microbial          4             3         12          Very high
                                                                                                                                 from cattle, such as Cryptosporidium
               + atmospheric phenomenon (rain)
               Cattle defecation in vicinity
                                                                                                                                 Potential illness from pathogens
   Source      source of potential pathogen ingress          Microbial          4             3         12          Very high
                                                                                                                                 from cattle, such as Coliforms or E. Coli
               + atmospheric phenomenon (rain)
               Geology of the area/river
               + atmospheric phenomenon (rain)                                                                                   Potential introduction of toxic
   Source      and infiltration                           Chemical              3             3          9            High       metals (concentrations in finished water
               + agriculture pollutants                                                                                          above WHO Guideline values of Fe and Mn)
               (P-N-eutrophication)
                                                                                                                                 Potential introduction of toxic
   Source      Farm machinery use (fuel, oil)             Chemical              1             2          2            Low        Chemicals (concentrations in finished water
                                                                                                                                 WHO Guideline values of petrol derived)
               Cocktail of chemists
                                                                                                                                 Possible change in water properties which
   Source      and some other components                 Organoleptic           3             2          6          Medium
                                                                                                                                 may result in costumers rejection
               which lead to changes in aesthetic


     Water and Wastewater Treatment11-12                14                                LJMU-BUILT ENVIRONMENT
Water treatment plant design from water data review


                                                           Table3. Risk prioritization and control measures

                                                                                                                                                   Reassessment of
      Hazardous event                                       Control measure                                      Validation of control measure
                                                                                                                                                   risk post-control
                                 To applied the correct dosage/crop                                                                              Low with appropriate
       Presence of a                                                                                          High as the risk decrease
                                 To adopt good farming practices                                                                                 operational monitoring
      mix of pesticides                                                                                       considerably
                                 Control measures (legislation)                                                                                  (LAOP)
                                                                                                              Between low and medium as it
                                 Improve water filtration technique
Presence of Cryptosporidium                                                                                   takes long time and may be                 LAOP
                                 Boil water (last resource)
                                                                                                              expensive
                                 Improve water filtration technique
                                 Boil water (last resource)                                                   The more retention time the
    Presence of coliforms                                                                                                                                LAOP
                                 Iodine water                                                                 higher efficacy
                                 Tertiary disinfection
                                                                                                              Medium-high: depending on the      Low-medium
                                 To reduce the use of pesticides or improve the application method
 Presence of high level of Fe                                                                                 efficiency of use                  depending on the
                                 In-situ: Vyredox
          and Mn                                                                                              Low: expensive and complex         control measure and
                                 Ionic exchange
                                                                                                              Very high: total removal           with AOP

                                 Use of more efficient machinery                                                                                 Low-medium
  Presence of benzene and
                                 To avoid the use of machinery or reduce the time of use in the               High as the frequency is very      depending on the
  components derived from
                                 proximity of the source wherever possible                                    low                                good practices of the
           petrol
                                 Improve the machinery maintenance                                                                               farmer

                                 To control the issues above                                                  Medium-high depending on the
Low organoleptic water quality                                                                                                                           LAOP
                                 Use of adsorption techniques and methods                                     adsorption capacity


  Water and Wastewater Treatment11-12                 15                                LJMU-BUILT ENVIRONMENT
Water treatment plant design from water data review


                                           Table4. Long- and short-term monitoring requirements and corrective actions

Process Step        Critical limit           What                    Where                When                     How                  Who            Corrective action
               Pesticides
                                                                 At entry point                                                                      Activate pesticides
               concentration               Pesticides                                                                              Water Quality
   Source                                                        to distribution     Weekly on-line      Chromatography                              non-compliance
               leaving plant                residual                                                                               Officer (WQO)
                                                                 system (EPDS)                                                                       protocol (NCP)
               must be <0.1 µg/l
                                                                                                                                                     Meet with
               Cryptosporidium                                   Dept. of                                                          Catchment/        landholder in
                                        Cryptosporidium                                                  On site at Dept.
   Source      leaving plant                                     Agriculture               Daily                                   Watershed         breach and
                                 −5         residual                                                     of Agriculture
               must be ≤ 1.3 × 10 /l                             Site Inspection                                                   Liaison Officer   discuss incentive
                                                                                                                                                     programme
                                                                                                                                                     Meet with
               Coliforms
                                                                                                                                   Catchment/        landholder in
               concentration                Coliforms            Council offices                         On site at Dept.
   Source                                                                                  Daily                                   Watershed         breach and
               leaving plant                 residual            Site inspection                         of Agriculture
                                                                                                                                   Liaison Officer   discuss incentive
               must be 0
                                                                                                                                                     programme
               Fe and Mn
               concentration
                                           Fe and Mn
   Source      leaving plant                                          EPDS           Weekly on-line      Metal analyser                 WQO          Activate metals NCP
                                            residual
               must be <200 and 50
               µg/l respectively
               Benzene and petrol
               derived
                                            Benzene                                                                                                  Activate petrol derived
   Source      concentration                                          EPDS           Weekly on-line      Petrol derived analyser        WQO
                                            residual                                                                                                 NCP
               leaving plant
               must be <10 µg/l
               Organoleptic
               characteristics must
                                       Possible customers                                                                                            Activate organoleptic
   Source      be acceptable to                                       EPDS             Daily on-line     Sensory analysis               WQO
                                       rejection                                                                                                     features NCP
               consumers and no
               abnormal change


     Water and Wastewater Treatment11-12                16                                LJMU-BUILT ENVIRONMENT
Water treatment plant design from water data review


Water treatment plant design

Coliform removal by the conventional treatment process

Conventional water treatment includes a series of processes (coagulation, flocculation,
clarification through sedimentation, filtration and disinfection) that when applied to raw water
sources contribute to the reduction of microorganisms of public health concern (Geldreich,
1996).

One of the major barriers to water reclamation and reuse is concerns regarding the health
risk of exposing public to treated wastewater and associated chemical and microbial
contaminants (Schaefer et al, 2004).

Coliforms concentrations can be removed by primary, secondary, and tertiary effluents. On
average, high concentrations of total and faecal coliforms can be removed by primary
treatment, which may include coagulant addition prior to primary clarifiers. Other operating
factors can also contributed to the increased coliforms removal such as the return of
activated sludge to the primary clarifiers. Return of activated sludge to the primary clarifiers
may have enhanced adsorption and subsequent settling and removal of coliforms (Zhang
and Farahbakhs, 2007). With the secondary treatment, high removal of total and faecal
coliforms may be done (Lucena et al, 2004), as well as in the tertiary treatment process.

Coliform removal by membrane bioreactors

On the other hand, Coliforms may be removed by membrane /membrane bioreactor systems
(MBR) as Zhang and Farahbakhs (2007) tested.

Nominal and absolute pore sizes of the membranes can be between 0.04 and 0.1 mm. The
absolute pore size is the minimum diameter at which 100% of particle or marker of a certain
size is removed and typically describes the largest pore size on the membrane surface. Both
nominal and absolute pore sizes are therefore important in determining microbial removal of
membranes. Since coliform bacteria are larger than the absolute pore size of the
membranes (0.6-1.2 mm in diameter by 2-3 mm in length) no coliform bacteria are expected
in the permeate from the intact membranes.

The MBR system had higher removal efficiencies for all indicator organisms than the
secondary treatment of conventional process, and it had similar or better removal
efficiencies than the conventional treatment plus tertiary treatment and disinfection. This
indicates that the MBR system can, not only replace the biological treatment processes, but
it also eliminate the need for further effluent polishing (sand filtration) as well as disinfection.
This is significant since not only chlorination/dechlorination is costly, but also produces large
quantities of disinfection by-products (DBP), many of which are suspected carcinogens. In
general, the MBR system produced better or comparable effluent quality than that of an
advanced conventional treatment process in far fewer steps (Zhang and Farahbakhs, 2007).

Thus, in order to decide what treatment process should be chosen, MBR would be the first
option as, compared with the conventional activated sludge process (CAS) process followed
by tertiary treatment (RBC, sand filtration, and chlorination), the MBR system achieve better
faecal coliform removal by more than 1 log unit and because the MBR process can achieve


Water and Wastewater Treatment11-12                 17                          LJMU-BUILT ENVIRONMENT
Water treatment plant design from water data review


better microbial removal in fewer steps than a CAS process with advanced tertiary
treatment.

Cryptosporidium

Studies have demonstrated that Cryptosporidium removal throughout all stages of the
conventional treatment process is largely influenced by the effectiveness of coagulation pre-
treatment (Dugan et al, 2001). Cryptosporidium oocysts, like Giardia cysts, are organisms
that can be physically removed from water supplies by conventional particle separation
processes including chemical coagulation-flocculation, clarification (sedimentation), and
granular media filtration (Bellamy et al, 1993). Efficient protozoan cyst removal can be
achieved by properly functioning conventional filters when the water is effectively treated
through coagulation, flocculation and settling prior to filtration (Shaw et al, 2000). Water
treatment plants using granular activated carbon (GAC) and rapid sand filters were more
likely to have effluent samples positive for cysts and oocysts than those plants using dual- or
mixed media filters (LeChevallier et al, 1991).

Pressure-driven membrane processes (microfiltration [MF], ultrafiltration [UF], nanofiltration
[NF], reverse osmosis [RO]) are playing an important role in drinking water production in the
US and in Europe. These processes are being employed in water treatment for multiple
purposes including control of disinfection by-products (DBPs), pathogen removal,
clarification, and removal of inorganic and synthetic organic chemicals (Jacangelo et al,
1997).

MF membranes have the largest pores, ranging from 0.1 to 10 mm, and the highest
permeability so that a sufficient water flux is obtained at a low pressure. MF is an efficient
process to remove particles that may cause problems in further treatment steps. Applications
of MF membranes in water treatment include clarification, pre-treatment and particle and
microbial removal (Jacangelo et al, 1997).

UF membranes have smaller pore sizes (0.002–0.1 mm); therefore the permeability is
considerably lower than in MF and higher pressures are needed. Current applications of UF
membranes in water treatment include particle and microbial removal. Physical sieving is
considered as the major mechanism of removal of protozoan cysts.

So, for this case study, MF would be chosen as, from the energy/environmental and cost
point of view, UF requires more energy and therefore would be more expensive. Besides,
UF would be more practical in case of the necessity of removing small viruses, which is not a
problem in this water. Furthermore, both technologies are good for minimizing turbidity.

Disinfection by-products

The use of chlorine for drinking water disinfection has virtually eliminated most waterborne
diseases resulting from drinking water ingestion (USCDC, 1997). However, chlorination
forms a number of disinfection by-products (DBPs), which are of potential concern. Some of
these DBPs have cancer risks as well as other acute and chronic effects to human health
(King and Marrett 1996). A number of DBPs have been investigated, including
trihalomethanes (THMs), haloacetic acids (HAAs), haloacetonitriles (HANs), and
haloketones (HKs).


Water and Wastewater Treatment11-12                18                          LJMU-BUILT ENVIRONMENT
Water treatment plant design from water data review


       The four THM species (chloroform, bromodichloromethane, dibromochloromethane and
       bromoform), dichloroacetic acids, trichloroacetic acids, trichloroacetonitrile, bromate and
       chlorite have been reported to have carcinogenic effects to human health. In addition, the
       nitrogenous DBPs, such as N-nitrosodimethylamine (NDMA) and other unknown DBPs may
       also pose a potential cancer risks to human health. If chlorine (for primary disinfection) is
       followed by chloramine (for residual protection), NDMA, regulated DBPs and other DBPs
       may be formed. However, THMs and HAAs will be much less in these cases. The amounts
       of DBP formation may be characterized based on the types and combinations of
       disinfectants used. (Chowdhury et al, 2009).

       Table5 shows a good comparison among the most common disinfectants used. It will help to
       choose the best disinfectant for this case.

                                         Table5. Basic information of disinfectants

                                                                                              Ultraviolet
               Issue                                            Chlorine
                                     Chlorine    Chloramine                      Ozone        radiation        Reference
                                                                dioxide
                                       Most                                                   Emerging
          Application                             Common       Occasional       Common                       USEPA (2006)
                                     common                                                      use
                                                  Moderate                                    Extremely
               Cost                  Lowest                         High          High                      Clark et al (1994)
                                                 (>chlorine)                                    high
                Bacteria
                (V. Chloreae,
                                     Excellent     Good         Excellent       Excellent       Good
                Coliform, E. Coli,
                etc.)                                                                                         MWH (2005),
                Viruses
Disinfection
                (Polio virus,        Excellent      Fair        Excellent       Excellent        Fair          Sadiq and
 Efficiency
                Rota virus, etc.)                                                                              Rodríguez
                Protozoa             Fair to                                                                    (2004)
                                                    Poor            Good          Good        Excellent
                (G. Lamblia, etc.)     poor
                                     Good to
                  Endospores                        Poor            Fair        Excellent        Fair
                                       poor
    Organisms Regrowth               Unlikely     Unlikelyy       Likely       More likely    More likely     MHW (2005)
    Limits on free residual           5 mg/l       5 mg/l      0.3-0.5 mg/l        -              -           WHO (2011)
                                                 Traces of
                                     4 THMs
                   Regulated                     THMs and        Chlorite       Bromate         None          WHO (2011)
                                      HAAs
                                                   HAAs
    By-
                                                   Many:
 products
                                                 cyanogen        Many:        Biodegradable     None           Richardson
                  Unregulated         Many
                                                  halides,      chlorate         organics       known            (2005)
                                                   NDMA
          Oxidation                   Strong       Weak         Selective      Strongest        None            Chlorine
   Odour and taste removal           Excellent     Good         Excellent     Good to poor      None           Chemistry
          Stability                   Stable       Stable       Unstable       Unstable        Unstable      Council (2003)


       So, taken into account the water characteristics in this case and after the table information,
       the use of chlorine shapes up as the best alternative in comparison with the others DBPs, as
       it can deal with all the issues with the lowest cost. However, further analysis will be carried
       out in this study.


       Water and Wastewater Treatment11-12                     19                               LJMU-BUILT ENVIRONMENT
Water treatment plant design from water data review


Turbidity

Turbidity removal is carried out by coagulation/flocculation, settling and filtration.

A wide variety of chemicals exist for use in clearing raw water of suspended solids in
coagulation/flocculation processes. It is known that the effectiveness of these coagulants
has a complex dependency on the nature of the raw water, being affected by such things as
temperature, pH, and especially the specific proportions of organic, inorganic, and biological
particles that constitute the suspended solids. Furthermore, it is typically found that
combinations of coagulants can be used to achieve much higher performance and process
efficiency, but this performance again depends on the complex nature of the water source
(Innosol, 2010).

Because of this complexity, no systematic criteria can be applied across all drinking water
treatment facilities, so coagulant selection must be addressed by each facility according to
its own circumstances.

Due to the water conditions in this case, Hydrolyzing Metallic Salts would be the best option
as Pre-Hydrolyzed Metal Salts and Synthetic Cationic Polymers normally require an on-site
production process as well as there is a historical lack of instrumentation for determining
relative amounts especially for the use of polymers.

Among the Hydrolyzing Metallic Salts, Aluminum sulphate, Al2(SO4)3 (better known as alum)
is preferred to ferric salts (even though Al has high concentrations in this case) since they
are less efficient for removing organic suspended solids and also they work better with high
pH values (>8.5). In this case, the pH is suitable for the aluminum and allows fast mixing
(Innosol, 2010).

In order to accelerate the flocculation process or strengthen the floccules to make it easier to
filter, various additives can be used to aid in the coagulation and flocculation process.

Synthetic Cationic Polymers seem to be a good option in this case because they are more
suitable with metallic coagulants. Natural polymers and inorganic coagulants are normally
less efficiency and some of them work better with ferric salts (Innosol, 2010).

Thus, poly-DADMAC may be a solution as little is required to produce large floccules, rapid
precipitation and low turbidity residue. Furthermore, it might improve process performance
and economy when used properly.

Since pre-treatment is necessary for this case, best option for filtering is the use of rapid
sand filters. A filtrate quality is possible that has less than 1 NTU, however, due to the
necessity of removing Cryptosporidium, MF will be the option for removing microorganisms
and turbidity.


Water and Wastewater Treatment11-12                 20                          LJMU-BUILT ENVIRONMENT
Water treatment plant design from water data review


Manganese

Mn along with Fe are in high concentrations in this water analysis. Thus, the suggested
technique for removing Fe and Mn is a combination of three processes which are carried out
in a simple filter system after the disinfection process: 1) ion exchange as an initial phase,
where the dissolved manganese is fixed on the zeolite surface, 2) the subsequent oxidation
of manganese on the surface of the medium, which allows the formation of an oxide film
(MnOx (s)) and 3) the removal of dissolved manganese by adsorption on the oxide film
formed before. This film has high affinity for Mn2+ and Fe2+ (CYTED-XVII, 1996). It should be
enough to reduce Mn levels in critical periods.

Aluminium

Removal of Al can be carried out by several methods such as cation exchange resin,
reverse osmosis and electrodialysis. Processes such as coagulation, sedimentation and
filtration (combined) are moderately effective in Al removal (Srinivisan et al 1999).

Othman et al (2010) achieved high percentages of Al removal by using two chelating resin,
Iontosorb Oxin (IO) and polyhydroxamic acid (PHA), which could be incorporated to the
same filter for removing Mn and Fe. Both chelating resin achieved 93% and 98% of Al
removal being 20 minutes the optimum stirring time. However, it may increase the
complexity and the price of the treatment system.

Pesticides

Increasingly, water treatment plants are applying ozone in the prior oxidation step instead of
chlorine or NaClO due to the numerous advantages that this presents, in spite of its higher
economic cost. Ozone has a high oxidant power and, in principle, does not generate
hazardous organohalogenated by-products, such as THMs (Von Gunten, 2003). Moreover,
colour, smell, and dissolved iron and manganese can be removed via ozonation and
coagulation may be improved (Koga et al, 1992).

According to Ormad et al (2008), Preoxidation by ozone is an efficient treatment for
degrading the majority of the pesticides present and their combination with coagulation does
not improve removal efficiencies of pesticides. Activated carbon adsorption is also an
efficient treatment for the majority of studied pesticides. When this treatment is combined
with preoxidation by ozone, all of the pesticides they studied (about 44) were efficiently
degraded. However, granular activated carbon (GAC) is expensive and may not worth it in
this case.


Water and Wastewater Treatment11-12                21                          LJMU-BUILT ENVIRONMENT
Water treatment plant design from water data review


Final design

Considering the above, the final design chosen is shown in the image below. It would be
compound of a pre-treatment (pre-oxidation (with ozone), coagulation/flocculation,
sedimentation/settle, filtration (MF) and perhaps the use both of GAC and resins for
removing Al could be applied but it would depend on the efficiency of the water treatment
without them) and finally a final step of disinfection by adding chlorine before the storage and
the distribution system. Ozone and MF are expensive system but they are very effective and
avoid the use of some other system which may complicate the treatment operation. So, in a
long term, it is believed to be the best option.


Water and Wastewater Treatment11-12                22                          LJMU-BUILT ENVIRONMENT
Water treatment plant design from water data review


  Maintenance and monitoring scheme

        ISSUE                                                      MAINTENANCE                                                                        MONITORING
                                                                                                                                  -O3 concentration in the aquatic facility water body shall
                          -To be used in with a free halogen residual, which shall be maintained in the water at all times
                                                                                                                                                    not exceed 0.1 mg/l
                          operation
                                                                                                                                    -Refresher training of O3 equipment operation and
        OZONE             -Maintenance of the O3 generating equipment shall be detailed in the premise’s operations manual
                                                                                                                                  maintenance procedures shall be conducted a minimum
                          -Employees involved in the operation of O3 generating equipment shall be trained in the operation
                                                                                                                                         of once every six months (AQW, 2011).
                          and maintenance of the equipment.

                          Alum application rates and the total coagulant applied in terms of alum equivalent mg/l need to be tracked by the supervisory control and data acquisition
     COAGULATION
                          (SCADA) system (AWWA, 2010)
                                                                                                                             -Test method ANSI/NSF standard 60; EN 1408:
                          -The best strategy is to add it near to the main source of the problem.                            1998standard 60.
                          -PolyDADMAC shall be delivered in suitable container.
     FLOCCULATION         -For storage purposes, it shall be store in cool-dry place
                                                                                                                             -Not to exceed 25 mg/l with a carryover of not more than
                          -It shall be kept away from oxidants and strong acids.
                          -Under proper storage conditions, polyDADMAC shall be stable for at least 12 months.               50 µg/l of polyDADMAC into the finished water (SAJH,
                                                                                                                             2002).
                          -Aeration and backpulsing: membranes are to be backpulsed with water and air scour intervals of
                                                                                                                             -Planar ultrasonic transducers may be mounted on each
                          15-30 min to reduce membrane fiber fouling wastewater deconcentration every two to three hours
                                                                                                                             cross-flow cell for continuous monitoring.
                          -Extended backpulse cleaning: 1/d an extended backpulse maintenance clean are to be conducted
    MICROFILTRATION                                                                                                          -Real-time monitoring is necessary for improving the
                          automatically with NaClO to control biofouling on the membrane surface and eliminate potential
                                                                                                                             understanding and control of spatially defined fouling
                          regrowth in the permeate piping.
                                                                                                                             mechanisms involved (Kujundzic et al, 2011).
                          -Recovery cleaning: 1/m using NaClO and citric acid (Feldman et al, 2009).
                                                                                                                             -A routine operation and maintenance schedule should
                          -It need to be stored in steel containers
                                                                                                                             be developed and followed according to manufacturer’s
                          -Safety precautions must be exercised during all phases of treatment regular operation and
                                                                                                                             instructions.
       CHLORINE           maintenance. It involves disassembling and cleaning the various components, once every 6
                                                                                                                             -Control equipment must be tested and calibrated as
                          months.
                                                                                                                             recommended by the equipment manufacturer
                          -Valves and springs should also be inspected and cleaned annually.
                                                                                                                             (Solomon et al, 1998).
    FIRE PROTECTION
                          These include building fire suppression sprinkler systems and firefighter systems at waterfronts (salt water or brackish water (UFC, 2005).
                          -People who handle chemicals in related maintenance activities can attend safety education classes (UFC, 2005).
   HEALTH AND SAFETY
                          -Refer to the COSHH for additional information.
WATER SAMPLE FREQUENCY    For pH, alkalinity, conductivity, inhibitor and calcium hardness is suggested a frequency of 2/W for medium plants (100-350 kW) and 1/d for large plants (>350
AND TESTING REQUIREMENT   kW) (UFC, 2005).


  Water and Wastewater Treatment11-12                   23                                   LJMU-BUILT ENVIRONMENT
Water treatment plant design from water data review


Conclusion

This work has evaluated and determined a water treatment plant from a water quality data
provided.

The water has been characterized as being surface water as the main pollutants were
pesticides, metals (Fe, Mn and Al), some petrol derived and microorganisms, especially
Cryptosporidium and coliforms. The main source may be farming practices and the presence
of livestock.

The risk assessment and the identification of effective control measures, describing
appropriate monitoring of water, have been undertaken under the conditions of the WHO
Water Safety Plan methodology.

Finally a water treatment plant, composed of pre-treatment (ozone, coagulation/flocculation,
sedimentation and microfiltration) and disinfection with chlorine, has been designed in order
to meet the conditions for Drinking Water citing the appropriate regulations for the
microbiological, disinfection by-products, turbidity, manganese, aluminium and pesticides
parameters. Even though ozone and MF are expensive, they are the best option in the long
term in this case.

A reasonable justification and a suitable maintenance and monitoring scheme for the chosen
process, has been given.

References

AWWA, 2010. Operational Control of Coagulation and Filtration Processes. Manual of water supplies
practices M37. 3rd Edit, American Water Works Association, pp. 180.

AQW, 2011. Appendix 4 – requirements for ozone water treatment systems. Available at:
<http://www.public.health.wa.gov.au/1/69/1/Search.pm> [Accessed 07 January 2012].


Bellamy, WD, Cleasby, JL, Logsdon, GS, Allen, MJ, 1993. Assessing treatment plant performance. J.
AWWA, 85, pp. 34-38.

Bergström, LF, Kirchmann, H, 1999. Leaching of total nitrogen from nitrogen-15-labeled poultry
manure and inorganic nitrogen fertilizer. J. Environ. Qual. 28, pp. 1283-1290.

Canter, LW, 1997. Nitrates in Groundwater. CRC Press LLC, Boca Raton, USA, pp. 15.

Chlorine Chemistry Council, 2003. Drinking water chlorination: a review of disinfection practices and
issues. Chlorine Chemistry Council, Arlington, VA.

Chowdhury, S, Champagne, P, McLellan, PJ, 2009. Models for predicting disinfection byproduct
(DBP) formation in drinking waters: A chronological review. Science of the Total Environment 407, pp.
4189-4206.

Clark, RM, Adams, JQ, Lykins, BW, 1994. DBP control in drinking water: cost and performance. J
Environ Eng.; 120(4), pp. 759-82.


Water and Wastewater Treatment11-12                  24                          LJMU-BUILT ENVIRONMENT
Water treatment plant design from water data review


CYTED-XVII, 1996. Agua Potable para comunidades rurales, reuso y tratamientos avanzados de
aguas residuales domésticas. Capítulo 04: remoción de hierro y manganeso en fuentes de agua
subterráneas para abastecimiento público, pp. 37. Available at
<http://www.bvsde.paho.org/bvsair/e/repindex/repi84/vleh/fulltext/acrobat/agua.pdf> [Accessed 02
January 2012]


Deere D, Stevens M, Davison A, Helm G, Dufour A., 2001. Water quality: guidelines, standards and
health-assessment of risk and risk management for water-related infectious disease. Management
Strategies. Fewtrell L, Bartram J, Eds, London, World Health Organization, IWA Publishing, pp. 257-
288.

Dugan, NR, Fox, KR, Owens, JH, Miltner, RJ, 2001. Controlling Cryptosporidium oocysts using
conventional filtration. J. AWWA 93, pp. 64-77.

EUDWD, 1998. The Drinking Water Directive (DWD), Council Directive 98/83/EC. Available at
<http://ec.europa.eu/environment/water/water-drink/index_en.html> [Accessed 07 December 2011].


Feldman, EM, Crossley, IA, Ruge, R, 2009. Minimize microfiltration membrane maintenance.
Consider best practices for cleaning and waste disposal. Opflow, practical ideas for water operators.
American Water Works Association. Available at:
<http://www.hazenandsawyer.com/uploads/files/Membrane_maintenance.pdf> [Accessed 07 January
2012].


FPA, 2002. List of Agricultural Pesticides. Available at:
<http://www.wpro.who.int/hse/pages/agriculturallist.html> [Accessed 22 December 2011].

Geldreich, EE, 1996. Creating microbial quality in drinking water. In: Geldreich, EE (Ed.), Microbial
Quality of Water Supply in Distribution Systems. CRC Press LLC, Boca Raton, FL, pp. 39-101.

ICRP, 1991. 1990 recommendations of the ICRP. Annals of the ICRP. Oxford, Pergamon Press
(International Commission on Radiological Protection Publication 60), 21(1.3)

Innosol, 2010. Available at:
<http://www.dgrsol.com/tempWater/municipalWater/drinkingWater/coagulants.php>         [Accessed    04
January 2012].


Jacangelo, JG, Adham, SS, Laine, JM, 1995. Mechanism of Cryptosporidium, Giardia, and MS2 virus
removal by MF and UF. J. AWWA 87, pp. 107-121.

Jacangelo, JG, Rhodes Trussell, R, Watson, M, 1997. Role of membrane technology in drinking water
treatment in the United States. Desalination 113, pp. 119-127.

Kim, K, Kim, H-J, Choi, B-Y, Kim, S-H, Park, K-H, Park, E, Koh, D-C, Yun, S-T, 2008. Fe and Mn
levels regulated by agricultural activities in alluvial groundwaters underneath a flooded paddy field.
Applied Geochemistry, 23, pp. 44-57.

King WD, Marrett LD, 1996. Case-control study of bladder cancer and chlorination by products in
treated water (Ontario, Canada). Cancer Causes Controls, 7, pp. 596-604.

Koga, M, Kadokami, K, Shinohara, R, 1992. Laboratory-scale ozonation of water contaminated with
trace pesticides. Water Sci. Technol. 26(9-11), pp. 2257-2260.


Water and Wastewater Treatment11-12                  25                           LJMU-BUILT ENVIRONMENT
Water treatment plant design from water data review


Kujundzic, E, Greenberg, AR, Fong, R, Hernández, M, 2011. Monitoring Protein Fouling on Polymeric
Membranes Using Ultrasonic Frequency-Domain Reflectometry. Membranes, 1, pp. 195-216.

LeChevallier, MW, Norton, MW, Lee, RG, 1991. Giardia and Cryptosporidium spp. in filtered drinking
water supplies. Appl. Environ. Microbiology. 57, pp. 2610-2616.

Lucena, F, Duran, AE, Morón, A, Calderón, E, Campos, C, Gantzer, C, Skraber, S, Jofre, J, 2004.
Reduction of bacterial indicators and bacteriophages infecting fecal bacteria in primary and secondary
wastewater treatments. J. Appl. Microbiol. 97 (5), pp. 1069-1076.

Medema, GJ, Schets, FM, Teunis, PFM, Havelaar, AH, 1998. Sedimentation of free and attached
Cryptosporidium oocysts and Giardia cysts in water. Appl. Environment Microbiology, 64 (11), pp.
4460-4466.

MWH, 2005.Water treatment: principles and design. NJ, USA: John Wiley & Sons.

Ormad, MP, Miguel, N, Claver, A, Matesanz, JM, Ovelleiro, JL, 2008. Pesticides removal in the
process of drinking water production. Chemosphere 71, pp. 97-106.

Othman, MN, Abdullah, MP, Abd, YF, 2010. Removal of Aluminium from Drinking Water. Sains
Malaysiana, 39(1), pp. 51-55.

Palma, P, Kuster, M, Alvarenga, P, Palma, VL, Fernandes, RM, Soares, AMVM, López de Alda, MJ,
Barceló, D, Barbosa, IR, 2009. Risk assessment of representative and priority pesticides, in surface
water of the Alqueva reservoir (South of Portugal) using on-line solid phase extraction-liquid
chromatography-tandem mass spectrometry. Environment International 35, pp. 545-551.

Richardson, SD, 2005. New disinfection by-product issues: emerging DBPs and alternative routes of
exposure. Global Nest, Int J, 7(1), pp. 43-60.

Sadiq, R, Rodriguez, M, 2004. Disinfection byproducts (DBPs) in drinking water and predictive models
for their occurrences: a review. Sci Total Environ; 321, pp. 21-46.

SAJH, 2002. Specification for Poly (Diallyldimethylammonium Chloride) or Polydadmac Used For
Potable Water Supply. Quality Assurance Department. Available at:
<http://www.saj.com.my/Spec/SPECIFICATION%20FOR%20POLYDADMAC1.pdf> [Accessed 06
January 2012].


Schaefer, K, Exall, K, Marsalek, J, 2004. Water reuse and recycling in Canada: a status and needs
assessment. Can.Water Resour. J. 29 (3), pp. 195-208.

Shaw, K, Walker, S, Koopman, B, 2000. Improving filtration of Cryptosporidium. J. AWWA 92, pp.
103-111.

Solomon, C, Casey, P, Mackne, C, Lake, A, 1998. Chlorine Disinfection. National Small Flows
Clearinghouse. Available at
<http://www.nesc.wvu.edu/pdf/WW/publications/eti/Chl_Dis_gen.pdf > [Accessed 06 January 2012].


Srinivisan, PT, Viraraghavan, T, Subramanian, KS, 1999. Aluminium in drinking water: An overview.
Water SA, 25(1), pp. 47-56.

Tankéré, SPC, Stathama, PJ, Priceb, NB, 2000. Biogeochemical Cycling of Mn and Fe in an Area
Affected by Eutrophication: The Adriatic Sea. Estuarine, Coastal and Shelf Science, 51, pp. 491-506.


Water and Wastewater Treatment11-12                  26                           LJMU-BUILT ENVIRONMENT
Water treatment plant design from water data review


UFC, 2005. Industrial water treatment operation and maintenance. Available at:
<http://www.wbdg.org/ccb/DOD/UFC/ufc_3_240_13fn.pdf> [Accessed 04 January 2012].


USCDC, 1997. Summary of notifiable diseases; morbidity and mortality weekly report. CDC
surveillance summaries: surveillance for waterborne disease outbreaks-USA.

USEPA, 2006. National primary drinking water regulations: stage 2 disinfectants and disinfection by
products rule: final rule. Fed Register, 71 (2).

Von Gunten, U, 2003. Ozonation in drinking water. Part I: Oxidation kinetics and product formation.
Water Res. 37, pp. 1443-1467.

WHO, 2009. Water Safety Plan Manual. Step-by-step risk management for drinking-water suppliers.
Available at:
<http://www.who.int/water_sanitation_health/publication_9789241562638/en/index.html> [Accessed
28 December 2011].


                                                                                 th
WHO, 2011. Guidelines for drinking-water quality. World Health Organization, 4 ed. Available at:
<http://www.who.int/water_sanitation_health/publications/2011/dwq_guidelines/en/> [Accessed          06
December 2011].


Zhang, K, Farahbakhs, K. 2007. Removal of native coliphages and coliform bacteria from municipal
wastewater by various wastewater treatment processes: Implications to water reuse. Water research,
41, pp. 2816-2824.


Water and Wastewater Treatment11-12                  27                               LJMU-BUILT ENVIRONMENT

Water treatment

  • 1.
    Water treatment plantdesign from water data review Water treatment plant design from water data review Water and Wastewater Treatment Sergio Arenas Gayoso Photo: Lancaster WTW 17/10/11 Water and Wastewater Treatment11-12 1 LJMU-BUILT ENVIRONMENT
  • 2.
    Water treatment plantdesign from water data review Index Introduction Pag. 3 Review of the water quality data Pag. 3 Pesticides Pag. 3 Nitrogen Pag. 3 Hardness Pag. 6 Conductivity Pag. 6 Metals Pag. 6 Microorganisms Pag. 6 Radioactivity Pag. 10 Turbidity Pag. 10 Colour Pag. 10 TOC Pag. 10 Characterization of the source water Pag. 12 Water safety plan methodology Pag. 13 Water treatment plant design Pag. 17 Coliform removal by the conventional treatment process Pag. 17 Coliform removal by membrane bioreactors Pag. 17 Cryptosporidium Pag. 18 Disinfection by-products Pag. 18 Turbidity Pag. 20 Manganese Pag. 21 Aluminium Pag. 21 Pesticides Pag. 21 Final design Pag. 22 Maintenance and monitoring scheme Pag. 23 Conclusion Pag. 24 References Pag. 24 Number of words (excluding references): 4860 Water and Wastewater Treatment11-12 2 LJMU-BUILT ENVIRONMENT
  • 3.
    Water treatment plantdesign from water data review Introduction The present work tries to evaluate and determinate a water treatment plant from a water quality data provided. The characterization of the source water as well as the pollutants contained and their possible sources have been carried out. Using the World Health Organization (WHO) Water Safety Plan methodology, the risk assessment has been undertaken, identifying effective control measures, and describing appropriate monitoring of the water source. A water treatment plant has been designed which will adequately treat the water to meet the conditions for Drinking Water citing the appropriate regulations for the microbiological, disinfection by-products, turbidity, manganese, aluminum and pesticides parameters justifying the choice of each process unit chosen. Finally, a suitable maintenance and monitoring scheme for the chosen process has been devised. Review of the water quality data Pesticides According to the EU drinking water directive (EUDWD, 1998), the parametric value for total pesticides is 0.5 (μg/l) and as the chart shows, the value is never reached during the three years period. However, the parametric value applied to each individual pesticide (which means organic insecticides, herbicides, fungicides, etc.) is 0.1 μg/l. Thus, the following pesticides (chart 1) exceed the individual value suggested: Diuron (herbicide), 24D (herbicide), Atrazine (herbicide), Metaldehyde (pesticide against gastropods), Mecoprop (herbicide), and MCPA (herbicide). Classification obtained through FPA (2002). Furthermore, their concentration (≥1 μg/l), follows a seasonally behaviour, normally between April and October. Nitrogen As the charts 2-4 show, nitrate, nitrite and ammonia have exactly the same behaviour. According to the WHO Guidelines for Drinking-Water Quality (WHO, 2011), both nitrate and nitrite as N are not present in significant concentrations (11 and 0.9 mg/l respectively). The ammonia as N it is also under the threshold odour concentration. There is a peak right at the end of the year 2010 in all of them, however the value reached, do not present problem at all. Water and Wastewater Treatment11-12 3 LJMU-BUILT ENVIRONMENT
  • 4.
    Water treatment plantdesign from water data review Chart 1: PESTICIDES TOTAL 0.3 0.25 0.2 0.15 0.1 0.05 0 12 DIMETHYLBENZE 24 D 245T 24DB Aldrin+Dieldrin ATRAZINE Bromoxynil CARBENDAZIM CARBETAMIDE Carbofuran CHLORMEQUAT CHLORTOLURON CLOPYRALID Cyanazine DIAZINON Dicamba DICHLOROPROP DIURON Ethofumesate FLUROXYPYR GLYPHOSATE HCH GAMMA TOT Heptachlor Heptachlor epoxid IOXYNIL ISOPROTURON LINURON MCPA MCPB MECOPROP METALDEHYDE PESTICIDES TOTAL Phnmedipham Propetamphos Propyzamide SIMAZINE Triclopyr Triforine Maximun PESTICIDES Overall permited Water and Wastewater Treatment11-12 4 LJMU-BUILT ENVIRONMENT
  • 5.
    Water treatment plantdesign from water data review Chart 2: NITRATE as N 6 4 mg/l 2 0 Chart 3: NITRITE as N 0.15 0.1 mg/l 0.05 0 Chart 4: Ammonia as N 0.5 0.4 0.3 mg/l 0.2 0.1 0 Water and Wastewater Treatment11-12 5 LJMU-BUILT ENVIRONMENT
  • 6.
    Water treatment plantdesign from water data review Hardness According to the chart 5, hardness alkalinity, Ca and Mg have the same behaviour along the three years. According to the WHO guideline, both Ca and Mg are under the taste threshold (100-300 mg/l). Hardness acceptability may vary considerably from one community to another; however consumers tolerate water hardness in excess of 500 mg/l, well above the value along the period in this case (it never exceeds 150 mg/l and never goes under 50 mg/l, being the average of 92 mg/l), so should not be problems with the interaction of alkalinity and pH. According to the hardness, water might be considered soft (under 100 mg/l). Corrosion should not be problem of water mains and pipes in household water systems as it ranges 6.5-8.5 as it is recommended. The average in this case is 7.34. Conductivity Conductivity ranges 100-400 µsie/cm. According to the EU directive it should not be higher than 2500 µsie/cm. therefore, the values are considered normal (chart 6). Conductivity behavior does not seem to be affected neither by the nitrogen compounds, Ca, Mg nor metals like Fe, Al or Mn. Only the peak on 29/12/10 in nitrogen compounds, minerals and metals seem to be related to. Metals According to the EUDWD and considering charts 7 and 8:  Mn: the parametric value is 50 μg/l and the average along the period is 52 μg/l. However, the data show figures normally well above this value, especially from 2009. There are three main peaks: in the middle of 2009, at the end of 2010 and right at the beginning of 2011.  Fe: the parametric value is 200 μg/l. However, its values are well above along the three years period. In fact, it reaches 1000 μg/l four times at the end/beginning of each year.  Al: the parametric value is 200 μg/l. It follows the same behavior of the Fe and it is also above of 200 μg/l along the period of the data (an average of 226 μg/l). Microorganisms According to the WHO (2011), there must not be coliforms presence after the disinfection process. Regarding cryptosporidium, it must be reduced to minimum levels in drinking water (1.3 × 10⁻⁵/l). As the charts 9-11 depict, both E.coli and total coliforms as well as Cryptosporidium, are presented along the period. Thus, the average for E.coli, total coliforms and Cryptosporidium presence are respectively: 895 No/100 ml, 7700 No/100 ml and 0.5 No/l . Water and Wastewater Treatment11-12 6 LJMU-BUILT ENVIRONMENT
  • 7.
    Water treatment plantdesign from water data review 150 8 Chart 5 7.5 100 mg/l 7 50 6.5 0 6 Alkalinity pH 45 Ca Hardness Total Mg pH (pH units) Chart 6: CONDUCTIVITY 20C 500 400 µsie/cm 300 200 100 0 Chart 7: MANGANESE 200 150 µg/l 100 50 0 Water and Wastewater Treatment11-12 7 LJMU-BUILT ENVIRONMENT
  • 8.
    Water treatment plantdesign from water data review 1500 Chart 8 1000 µg/l 500 0 Fe Al Chart 9: Cryptosporidium 3 2 No/l 1 0 Chart 10: E. coli 10000 8000 No/100 ml 6000 4000 2000 0 Water and Wastewater Treatment11-12 8 LJMU-BUILT ENVIRONMENT
  • 9.
    Water treatment plantdesign from water data review Chart 11: COLI TOT 40000 30000 No/100 ml 20000 10000 0 Chart 12: Radioactivity (Bq/l) 0.4 0.2 0 α β Water and Wastewater Treatment11-12 9 LJMU-BUILT ENVIRONMENT
  • 10.
    Water treatment plantdesign from water data review Radioactivity If the results of the analysis of drinking water are lower than 0.5 Bq/l for total alpha radioactivity and 1 Bq/l for total beta radioactivity, then additional analysis are no required (ICRP, 1991). As the chart 12 shows, total alpha radioactivity never reaches 0.1 Bq/l and the highest value for total beta radioactivity throughout the period is 0.29 Bq/l. Turbidity According to WHO (2011), if levels are below of 10 NTU, the water is considered clear. The average throughout the period of sampling is 9 NTU (chart 13), even considering an unusual peak in November of 2009 which reaches almost 100 NTU. Colour According to the EUDWD (1998), the standard for colour is 20 Hazen (a level at which there is no visible sign of colour). The chart 14 shows how the levels are constant during the three years period, but normally above of 20 Hazen. The presence of aluminium at concentrations in excess of 100–200 μg/l may cause deposition of aluminium hydroxide floccules and the exacerbation of discoloration of water by iron. Colour is strongly influenced by the presence of iron and other metals (WHO, 2011). TOC Apparently, there is a peak every November-December of each year (chart 15). There is not established a parametric value for TOC, however the EUDWD says there should not be abnormal changes once the water has been treated. Water and Wastewater Treatment11-12 10 LJMU-BUILT ENVIRONMENT
  • 11.
    Water treatment plantdesign from water data review Chart 13: TURBIDITY 150 100 NTU 50 0 Chart 14: COLOUR 100 80 60 HAZ 40 20 0 Chart 15: TOC 20 15 mg/l 10 5 0 Water and Wastewater Treatment11-12 11 LJMU-BUILT ENVIRONMENT
  • 12.
    Water treatment plantdesign from water data review Characterization of the source water According to the above, the characterization of the source water will be carried out depending on the present pollutants, trying to give reasonably explanation of their possible sources. Regarding pesticides, even though both annual variation and levels along the period are low for most of the pesticides, it seems to be a seasonal variation with some pesticides (chart 1). Thus, apparently there are peaks between the spring-summer season and end of autumn, which could coincide with spring and winter cereals. Besides, the total of pesticides variation is more obvious. It may be a reason to think about surface water located in an area either with agricultural practices or road, railway refurbishment works (FPA, 2002; Palma et al, 2009). Overall, N levels (as nitrate/nitrite and ammonia) are very low throughout the years (charts 2- 4) except a peak produced in one determined day. Groundwater normally have high levels of these components because they are highly mobile (Canter, 1997; Bergström and Kirchmann, 1999), so again, one could say that surface water would be the source in this case. However, presence of metals like Fe or Mn are more common in groundwater (Kim et al, 2008), especially in mine areas. Yet, in surface water these metals may be in high levels if an eutrophication process is been carried out (Tankéré et al, 2000). Even though eutrophication is mainly due to N and P, it would coincide with the presence of agricultural practices, being the main source of pollution. Undoubtedly, the most determinant factor in order to characterize the source water is the presence of microorganisms and especially the high levels of total coliforms (chart 11) as they are more common in surface water (Medema et al, 1998). The presence of coliforms indicates faecal water, which is extremely common in sewage water. However, taken into account all the parameters along with the presence of Cryptosporidium, is every likelihood the final source was a mixed farming, with crops and livestock which would explain the presence the faecal water and therefore, the presence of coliforms and Cryptosporidium (WHO, 2011). Thus, to sum up, the data might come from either a river or lake (surface water) where there could be an incipient eutrophication process and where, presumably, there are agricultural and stockbreeding practices in the area. Water and Wastewater Treatment11-12 12 LJMU-BUILT ENVIRONMENT
  • 13.
    Water treatment plantdesign from water data review Water safety plan methodology According to the WHO (2009), a semi-quantitative method is chosen to evaluate the water safety plans (WSP’s). Table1. Semi-quantitative risk matrix approach (from Deere et al, 2001) Severity or consequence Insignificant Moderate Major Catastrophic or no impact - aesthetic impact regulatory impact public health impact Rating: 1 Rating: 2 Rating: 3 Rating: 4 Likely / Once a week 4 8 12 16 Rating: 4 Moderate / Once a month 3 6 9 12 Rating: 3 Likelihood or frequency Unlikely / Once a year 2 4 6 8 Rating: 2 Rare / Once every 2-3 years 1 2 3 4 Rating: 1 Risk score <4 4-7 8-11 >12 Risk rating Low Medium High Very high Water and Wastewater Treatment11-12 13 LJMU-BUILT ENVIRONMENT
  • 14.
    Water treatment plantdesign from water data review Table2. Output of hazard assessment and risk assessment using semi-quantitative approach Process Step Hazardous event (source of hazard) Hazard type Likelihood Severity Score Risk rating Basis Potential introduction of toxic Cocktail of pesticides from Source Chemical 3 3 9 High Chemicals (concentrations in finished water agricultural uses above WHO Guideline values) Cattle defecation in vicinity Potential illness from pathogens Source source of potential pathogen ingress Microbial 4 3 12 Very high from cattle, such as Cryptosporidium + atmospheric phenomenon (rain) Cattle defecation in vicinity Potential illness from pathogens Source source of potential pathogen ingress Microbial 4 3 12 Very high from cattle, such as Coliforms or E. Coli + atmospheric phenomenon (rain) Geology of the area/river + atmospheric phenomenon (rain) Potential introduction of toxic Source and infiltration Chemical 3 3 9 High metals (concentrations in finished water + agriculture pollutants above WHO Guideline values of Fe and Mn) (P-N-eutrophication) Potential introduction of toxic Source Farm machinery use (fuel, oil) Chemical 1 2 2 Low Chemicals (concentrations in finished water WHO Guideline values of petrol derived) Cocktail of chemists Possible change in water properties which Source and some other components Organoleptic 3 2 6 Medium may result in costumers rejection which lead to changes in aesthetic Water and Wastewater Treatment11-12 14 LJMU-BUILT ENVIRONMENT
  • 15.
    Water treatment plantdesign from water data review Table3. Risk prioritization and control measures Reassessment of Hazardous event Control measure Validation of control measure risk post-control To applied the correct dosage/crop Low with appropriate Presence of a High as the risk decrease To adopt good farming practices operational monitoring mix of pesticides considerably Control measures (legislation) (LAOP) Between low and medium as it Improve water filtration technique Presence of Cryptosporidium takes long time and may be LAOP Boil water (last resource) expensive Improve water filtration technique Boil water (last resource) The more retention time the Presence of coliforms LAOP Iodine water higher efficacy Tertiary disinfection Medium-high: depending on the Low-medium To reduce the use of pesticides or improve the application method Presence of high level of Fe efficiency of use depending on the In-situ: Vyredox and Mn Low: expensive and complex control measure and Ionic exchange Very high: total removal with AOP Use of more efficient machinery Low-medium Presence of benzene and To avoid the use of machinery or reduce the time of use in the High as the frequency is very depending on the components derived from proximity of the source wherever possible low good practices of the petrol Improve the machinery maintenance farmer To control the issues above Medium-high depending on the Low organoleptic water quality LAOP Use of adsorption techniques and methods adsorption capacity Water and Wastewater Treatment11-12 15 LJMU-BUILT ENVIRONMENT
  • 16.
    Water treatment plantdesign from water data review Table4. Long- and short-term monitoring requirements and corrective actions Process Step Critical limit What Where When How Who Corrective action Pesticides At entry point Activate pesticides concentration Pesticides Water Quality Source to distribution Weekly on-line Chromatography non-compliance leaving plant residual Officer (WQO) system (EPDS) protocol (NCP) must be <0.1 µg/l Meet with Cryptosporidium Dept. of Catchment/ landholder in Cryptosporidium On site at Dept. Source leaving plant Agriculture Daily Watershed breach and −5 residual of Agriculture must be ≤ 1.3 × 10 /l Site Inspection Liaison Officer discuss incentive programme Meet with Coliforms Catchment/ landholder in concentration Coliforms Council offices On site at Dept. Source Daily Watershed breach and leaving plant residual Site inspection of Agriculture Liaison Officer discuss incentive must be 0 programme Fe and Mn concentration Fe and Mn Source leaving plant EPDS Weekly on-line Metal analyser WQO Activate metals NCP residual must be <200 and 50 µg/l respectively Benzene and petrol derived Benzene Activate petrol derived Source concentration EPDS Weekly on-line Petrol derived analyser WQO residual NCP leaving plant must be <10 µg/l Organoleptic characteristics must Possible customers Activate organoleptic Source be acceptable to EPDS Daily on-line Sensory analysis WQO rejection features NCP consumers and no abnormal change Water and Wastewater Treatment11-12 16 LJMU-BUILT ENVIRONMENT
  • 17.
    Water treatment plantdesign from water data review Water treatment plant design Coliform removal by the conventional treatment process Conventional water treatment includes a series of processes (coagulation, flocculation, clarification through sedimentation, filtration and disinfection) that when applied to raw water sources contribute to the reduction of microorganisms of public health concern (Geldreich, 1996). One of the major barriers to water reclamation and reuse is concerns regarding the health risk of exposing public to treated wastewater and associated chemical and microbial contaminants (Schaefer et al, 2004). Coliforms concentrations can be removed by primary, secondary, and tertiary effluents. On average, high concentrations of total and faecal coliforms can be removed by primary treatment, which may include coagulant addition prior to primary clarifiers. Other operating factors can also contributed to the increased coliforms removal such as the return of activated sludge to the primary clarifiers. Return of activated sludge to the primary clarifiers may have enhanced adsorption and subsequent settling and removal of coliforms (Zhang and Farahbakhs, 2007). With the secondary treatment, high removal of total and faecal coliforms may be done (Lucena et al, 2004), as well as in the tertiary treatment process. Coliform removal by membrane bioreactors On the other hand, Coliforms may be removed by membrane /membrane bioreactor systems (MBR) as Zhang and Farahbakhs (2007) tested. Nominal and absolute pore sizes of the membranes can be between 0.04 and 0.1 mm. The absolute pore size is the minimum diameter at which 100% of particle or marker of a certain size is removed and typically describes the largest pore size on the membrane surface. Both nominal and absolute pore sizes are therefore important in determining microbial removal of membranes. Since coliform bacteria are larger than the absolute pore size of the membranes (0.6-1.2 mm in diameter by 2-3 mm in length) no coliform bacteria are expected in the permeate from the intact membranes. The MBR system had higher removal efficiencies for all indicator organisms than the secondary treatment of conventional process, and it had similar or better removal efficiencies than the conventional treatment plus tertiary treatment and disinfection. This indicates that the MBR system can, not only replace the biological treatment processes, but it also eliminate the need for further effluent polishing (sand filtration) as well as disinfection. This is significant since not only chlorination/dechlorination is costly, but also produces large quantities of disinfection by-products (DBP), many of which are suspected carcinogens. In general, the MBR system produced better or comparable effluent quality than that of an advanced conventional treatment process in far fewer steps (Zhang and Farahbakhs, 2007). Thus, in order to decide what treatment process should be chosen, MBR would be the first option as, compared with the conventional activated sludge process (CAS) process followed by tertiary treatment (RBC, sand filtration, and chlorination), the MBR system achieve better faecal coliform removal by more than 1 log unit and because the MBR process can achieve Water and Wastewater Treatment11-12 17 LJMU-BUILT ENVIRONMENT
  • 18.
    Water treatment plantdesign from water data review better microbial removal in fewer steps than a CAS process with advanced tertiary treatment. Cryptosporidium Studies have demonstrated that Cryptosporidium removal throughout all stages of the conventional treatment process is largely influenced by the effectiveness of coagulation pre- treatment (Dugan et al, 2001). Cryptosporidium oocysts, like Giardia cysts, are organisms that can be physically removed from water supplies by conventional particle separation processes including chemical coagulation-flocculation, clarification (sedimentation), and granular media filtration (Bellamy et al, 1993). Efficient protozoan cyst removal can be achieved by properly functioning conventional filters when the water is effectively treated through coagulation, flocculation and settling prior to filtration (Shaw et al, 2000). Water treatment plants using granular activated carbon (GAC) and rapid sand filters were more likely to have effluent samples positive for cysts and oocysts than those plants using dual- or mixed media filters (LeChevallier et al, 1991). Pressure-driven membrane processes (microfiltration [MF], ultrafiltration [UF], nanofiltration [NF], reverse osmosis [RO]) are playing an important role in drinking water production in the US and in Europe. These processes are being employed in water treatment for multiple purposes including control of disinfection by-products (DBPs), pathogen removal, clarification, and removal of inorganic and synthetic organic chemicals (Jacangelo et al, 1997). MF membranes have the largest pores, ranging from 0.1 to 10 mm, and the highest permeability so that a sufficient water flux is obtained at a low pressure. MF is an efficient process to remove particles that may cause problems in further treatment steps. Applications of MF membranes in water treatment include clarification, pre-treatment and particle and microbial removal (Jacangelo et al, 1997). UF membranes have smaller pore sizes (0.002–0.1 mm); therefore the permeability is considerably lower than in MF and higher pressures are needed. Current applications of UF membranes in water treatment include particle and microbial removal. Physical sieving is considered as the major mechanism of removal of protozoan cysts. So, for this case study, MF would be chosen as, from the energy/environmental and cost point of view, UF requires more energy and therefore would be more expensive. Besides, UF would be more practical in case of the necessity of removing small viruses, which is not a problem in this water. Furthermore, both technologies are good for minimizing turbidity. Disinfection by-products The use of chlorine for drinking water disinfection has virtually eliminated most waterborne diseases resulting from drinking water ingestion (USCDC, 1997). However, chlorination forms a number of disinfection by-products (DBPs), which are of potential concern. Some of these DBPs have cancer risks as well as other acute and chronic effects to human health (King and Marrett 1996). A number of DBPs have been investigated, including trihalomethanes (THMs), haloacetic acids (HAAs), haloacetonitriles (HANs), and haloketones (HKs). Water and Wastewater Treatment11-12 18 LJMU-BUILT ENVIRONMENT
  • 19.
    Water treatment plantdesign from water data review The four THM species (chloroform, bromodichloromethane, dibromochloromethane and bromoform), dichloroacetic acids, trichloroacetic acids, trichloroacetonitrile, bromate and chlorite have been reported to have carcinogenic effects to human health. In addition, the nitrogenous DBPs, such as N-nitrosodimethylamine (NDMA) and other unknown DBPs may also pose a potential cancer risks to human health. If chlorine (for primary disinfection) is followed by chloramine (for residual protection), NDMA, regulated DBPs and other DBPs may be formed. However, THMs and HAAs will be much less in these cases. The amounts of DBP formation may be characterized based on the types and combinations of disinfectants used. (Chowdhury et al, 2009). Table5 shows a good comparison among the most common disinfectants used. It will help to choose the best disinfectant for this case. Table5. Basic information of disinfectants Ultraviolet Issue Chlorine Chlorine Chloramine Ozone radiation Reference dioxide Most Emerging Application Common Occasional Common USEPA (2006) common use Moderate Extremely Cost Lowest High High Clark et al (1994) (>chlorine) high Bacteria (V. Chloreae, Excellent Good Excellent Excellent Good Coliform, E. Coli, etc.) MWH (2005), Viruses Disinfection (Polio virus, Excellent Fair Excellent Excellent Fair Sadiq and Efficiency Rota virus, etc.) Rodríguez Protozoa Fair to (2004) Poor Good Good Excellent (G. Lamblia, etc.) poor Good to Endospores Poor Fair Excellent Fair poor Organisms Regrowth Unlikely Unlikelyy Likely More likely More likely MHW (2005) Limits on free residual 5 mg/l 5 mg/l 0.3-0.5 mg/l - - WHO (2011) Traces of 4 THMs Regulated THMs and Chlorite Bromate None WHO (2011) HAAs HAAs By- Many: products cyanogen Many: Biodegradable None Richardson Unregulated Many halides, chlorate organics known (2005) NDMA Oxidation Strong Weak Selective Strongest None Chlorine Odour and taste removal Excellent Good Excellent Good to poor None Chemistry Stability Stable Stable Unstable Unstable Unstable Council (2003) So, taken into account the water characteristics in this case and after the table information, the use of chlorine shapes up as the best alternative in comparison with the others DBPs, as it can deal with all the issues with the lowest cost. However, further analysis will be carried out in this study. Water and Wastewater Treatment11-12 19 LJMU-BUILT ENVIRONMENT
  • 20.
    Water treatment plantdesign from water data review Turbidity Turbidity removal is carried out by coagulation/flocculation, settling and filtration. A wide variety of chemicals exist for use in clearing raw water of suspended solids in coagulation/flocculation processes. It is known that the effectiveness of these coagulants has a complex dependency on the nature of the raw water, being affected by such things as temperature, pH, and especially the specific proportions of organic, inorganic, and biological particles that constitute the suspended solids. Furthermore, it is typically found that combinations of coagulants can be used to achieve much higher performance and process efficiency, but this performance again depends on the complex nature of the water source (Innosol, 2010). Because of this complexity, no systematic criteria can be applied across all drinking water treatment facilities, so coagulant selection must be addressed by each facility according to its own circumstances. Due to the water conditions in this case, Hydrolyzing Metallic Salts would be the best option as Pre-Hydrolyzed Metal Salts and Synthetic Cationic Polymers normally require an on-site production process as well as there is a historical lack of instrumentation for determining relative amounts especially for the use of polymers. Among the Hydrolyzing Metallic Salts, Aluminum sulphate, Al2(SO4)3 (better known as alum) is preferred to ferric salts (even though Al has high concentrations in this case) since they are less efficient for removing organic suspended solids and also they work better with high pH values (>8.5). In this case, the pH is suitable for the aluminum and allows fast mixing (Innosol, 2010). In order to accelerate the flocculation process or strengthen the floccules to make it easier to filter, various additives can be used to aid in the coagulation and flocculation process. Synthetic Cationic Polymers seem to be a good option in this case because they are more suitable with metallic coagulants. Natural polymers and inorganic coagulants are normally less efficiency and some of them work better with ferric salts (Innosol, 2010). Thus, poly-DADMAC may be a solution as little is required to produce large floccules, rapid precipitation and low turbidity residue. Furthermore, it might improve process performance and economy when used properly. Since pre-treatment is necessary for this case, best option for filtering is the use of rapid sand filters. A filtrate quality is possible that has less than 1 NTU, however, due to the necessity of removing Cryptosporidium, MF will be the option for removing microorganisms and turbidity. Water and Wastewater Treatment11-12 20 LJMU-BUILT ENVIRONMENT
  • 21.
    Water treatment plantdesign from water data review Manganese Mn along with Fe are in high concentrations in this water analysis. Thus, the suggested technique for removing Fe and Mn is a combination of three processes which are carried out in a simple filter system after the disinfection process: 1) ion exchange as an initial phase, where the dissolved manganese is fixed on the zeolite surface, 2) the subsequent oxidation of manganese on the surface of the medium, which allows the formation of an oxide film (MnOx (s)) and 3) the removal of dissolved manganese by adsorption on the oxide film formed before. This film has high affinity for Mn2+ and Fe2+ (CYTED-XVII, 1996). It should be enough to reduce Mn levels in critical periods. Aluminium Removal of Al can be carried out by several methods such as cation exchange resin, reverse osmosis and electrodialysis. Processes such as coagulation, sedimentation and filtration (combined) are moderately effective in Al removal (Srinivisan et al 1999). Othman et al (2010) achieved high percentages of Al removal by using two chelating resin, Iontosorb Oxin (IO) and polyhydroxamic acid (PHA), which could be incorporated to the same filter for removing Mn and Fe. Both chelating resin achieved 93% and 98% of Al removal being 20 minutes the optimum stirring time. However, it may increase the complexity and the price of the treatment system. Pesticides Increasingly, water treatment plants are applying ozone in the prior oxidation step instead of chlorine or NaClO due to the numerous advantages that this presents, in spite of its higher economic cost. Ozone has a high oxidant power and, in principle, does not generate hazardous organohalogenated by-products, such as THMs (Von Gunten, 2003). Moreover, colour, smell, and dissolved iron and manganese can be removed via ozonation and coagulation may be improved (Koga et al, 1992). According to Ormad et al (2008), Preoxidation by ozone is an efficient treatment for degrading the majority of the pesticides present and their combination with coagulation does not improve removal efficiencies of pesticides. Activated carbon adsorption is also an efficient treatment for the majority of studied pesticides. When this treatment is combined with preoxidation by ozone, all of the pesticides they studied (about 44) were efficiently degraded. However, granular activated carbon (GAC) is expensive and may not worth it in this case. Water and Wastewater Treatment11-12 21 LJMU-BUILT ENVIRONMENT
  • 22.
    Water treatment plantdesign from water data review Final design Considering the above, the final design chosen is shown in the image below. It would be compound of a pre-treatment (pre-oxidation (with ozone), coagulation/flocculation, sedimentation/settle, filtration (MF) and perhaps the use both of GAC and resins for removing Al could be applied but it would depend on the efficiency of the water treatment without them) and finally a final step of disinfection by adding chlorine before the storage and the distribution system. Ozone and MF are expensive system but they are very effective and avoid the use of some other system which may complicate the treatment operation. So, in a long term, it is believed to be the best option. Water and Wastewater Treatment11-12 22 LJMU-BUILT ENVIRONMENT
  • 23.
    Water treatment plantdesign from water data review Maintenance and monitoring scheme ISSUE MAINTENANCE MONITORING -O3 concentration in the aquatic facility water body shall -To be used in with a free halogen residual, which shall be maintained in the water at all times not exceed 0.1 mg/l operation -Refresher training of O3 equipment operation and OZONE -Maintenance of the O3 generating equipment shall be detailed in the premise’s operations manual maintenance procedures shall be conducted a minimum -Employees involved in the operation of O3 generating equipment shall be trained in the operation of once every six months (AQW, 2011). and maintenance of the equipment. Alum application rates and the total coagulant applied in terms of alum equivalent mg/l need to be tracked by the supervisory control and data acquisition COAGULATION (SCADA) system (AWWA, 2010) -Test method ANSI/NSF standard 60; EN 1408: -The best strategy is to add it near to the main source of the problem. 1998standard 60. -PolyDADMAC shall be delivered in suitable container. FLOCCULATION -For storage purposes, it shall be store in cool-dry place -Not to exceed 25 mg/l with a carryover of not more than -It shall be kept away from oxidants and strong acids. -Under proper storage conditions, polyDADMAC shall be stable for at least 12 months. 50 µg/l of polyDADMAC into the finished water (SAJH, 2002). -Aeration and backpulsing: membranes are to be backpulsed with water and air scour intervals of -Planar ultrasonic transducers may be mounted on each 15-30 min to reduce membrane fiber fouling wastewater deconcentration every two to three hours cross-flow cell for continuous monitoring. -Extended backpulse cleaning: 1/d an extended backpulse maintenance clean are to be conducted MICROFILTRATION -Real-time monitoring is necessary for improving the automatically with NaClO to control biofouling on the membrane surface and eliminate potential understanding and control of spatially defined fouling regrowth in the permeate piping. mechanisms involved (Kujundzic et al, 2011). -Recovery cleaning: 1/m using NaClO and citric acid (Feldman et al, 2009). -A routine operation and maintenance schedule should -It need to be stored in steel containers be developed and followed according to manufacturer’s -Safety precautions must be exercised during all phases of treatment regular operation and instructions. CHLORINE maintenance. It involves disassembling and cleaning the various components, once every 6 -Control equipment must be tested and calibrated as months. recommended by the equipment manufacturer -Valves and springs should also be inspected and cleaned annually. (Solomon et al, 1998). FIRE PROTECTION These include building fire suppression sprinkler systems and firefighter systems at waterfronts (salt water or brackish water (UFC, 2005). -People who handle chemicals in related maintenance activities can attend safety education classes (UFC, 2005). HEALTH AND SAFETY -Refer to the COSHH for additional information. WATER SAMPLE FREQUENCY For pH, alkalinity, conductivity, inhibitor and calcium hardness is suggested a frequency of 2/W for medium plants (100-350 kW) and 1/d for large plants (>350 AND TESTING REQUIREMENT kW) (UFC, 2005). Water and Wastewater Treatment11-12 23 LJMU-BUILT ENVIRONMENT
  • 24.
    Water treatment plantdesign from water data review Conclusion This work has evaluated and determined a water treatment plant from a water quality data provided. The water has been characterized as being surface water as the main pollutants were pesticides, metals (Fe, Mn and Al), some petrol derived and microorganisms, especially Cryptosporidium and coliforms. The main source may be farming practices and the presence of livestock. The risk assessment and the identification of effective control measures, describing appropriate monitoring of water, have been undertaken under the conditions of the WHO Water Safety Plan methodology. Finally a water treatment plant, composed of pre-treatment (ozone, coagulation/flocculation, sedimentation and microfiltration) and disinfection with chlorine, has been designed in order to meet the conditions for Drinking Water citing the appropriate regulations for the microbiological, disinfection by-products, turbidity, manganese, aluminium and pesticides parameters. Even though ozone and MF are expensive, they are the best option in the long term in this case. A reasonable justification and a suitable maintenance and monitoring scheme for the chosen process, has been given. References AWWA, 2010. Operational Control of Coagulation and Filtration Processes. Manual of water supplies practices M37. 3rd Edit, American Water Works Association, pp. 180. AQW, 2011. Appendix 4 – requirements for ozone water treatment systems. Available at: <http://www.public.health.wa.gov.au/1/69/1/Search.pm> [Accessed 07 January 2012]. Bellamy, WD, Cleasby, JL, Logsdon, GS, Allen, MJ, 1993. Assessing treatment plant performance. J. AWWA, 85, pp. 34-38. Bergström, LF, Kirchmann, H, 1999. Leaching of total nitrogen from nitrogen-15-labeled poultry manure and inorganic nitrogen fertilizer. J. Environ. Qual. 28, pp. 1283-1290. Canter, LW, 1997. Nitrates in Groundwater. CRC Press LLC, Boca Raton, USA, pp. 15. Chlorine Chemistry Council, 2003. Drinking water chlorination: a review of disinfection practices and issues. Chlorine Chemistry Council, Arlington, VA. Chowdhury, S, Champagne, P, McLellan, PJ, 2009. Models for predicting disinfection byproduct (DBP) formation in drinking waters: A chronological review. Science of the Total Environment 407, pp. 4189-4206. Clark, RM, Adams, JQ, Lykins, BW, 1994. DBP control in drinking water: cost and performance. J Environ Eng.; 120(4), pp. 759-82. Water and Wastewater Treatment11-12 24 LJMU-BUILT ENVIRONMENT
  • 25.
    Water treatment plantdesign from water data review CYTED-XVII, 1996. Agua Potable para comunidades rurales, reuso y tratamientos avanzados de aguas residuales domésticas. Capítulo 04: remoción de hierro y manganeso en fuentes de agua subterráneas para abastecimiento público, pp. 37. Available at <http://www.bvsde.paho.org/bvsair/e/repindex/repi84/vleh/fulltext/acrobat/agua.pdf> [Accessed 02 January 2012] Deere D, Stevens M, Davison A, Helm G, Dufour A., 2001. Water quality: guidelines, standards and health-assessment of risk and risk management for water-related infectious disease. Management Strategies. Fewtrell L, Bartram J, Eds, London, World Health Organization, IWA Publishing, pp. 257- 288. Dugan, NR, Fox, KR, Owens, JH, Miltner, RJ, 2001. Controlling Cryptosporidium oocysts using conventional filtration. J. AWWA 93, pp. 64-77. EUDWD, 1998. The Drinking Water Directive (DWD), Council Directive 98/83/EC. Available at <http://ec.europa.eu/environment/water/water-drink/index_en.html> [Accessed 07 December 2011]. Feldman, EM, Crossley, IA, Ruge, R, 2009. Minimize microfiltration membrane maintenance. Consider best practices for cleaning and waste disposal. Opflow, practical ideas for water operators. American Water Works Association. Available at: <http://www.hazenandsawyer.com/uploads/files/Membrane_maintenance.pdf> [Accessed 07 January 2012]. FPA, 2002. List of Agricultural Pesticides. Available at: <http://www.wpro.who.int/hse/pages/agriculturallist.html> [Accessed 22 December 2011]. Geldreich, EE, 1996. Creating microbial quality in drinking water. In: Geldreich, EE (Ed.), Microbial Quality of Water Supply in Distribution Systems. CRC Press LLC, Boca Raton, FL, pp. 39-101. ICRP, 1991. 1990 recommendations of the ICRP. Annals of the ICRP. Oxford, Pergamon Press (International Commission on Radiological Protection Publication 60), 21(1.3) Innosol, 2010. Available at: <http://www.dgrsol.com/tempWater/municipalWater/drinkingWater/coagulants.php> [Accessed 04 January 2012]. Jacangelo, JG, Adham, SS, Laine, JM, 1995. Mechanism of Cryptosporidium, Giardia, and MS2 virus removal by MF and UF. J. AWWA 87, pp. 107-121. Jacangelo, JG, Rhodes Trussell, R, Watson, M, 1997. Role of membrane technology in drinking water treatment in the United States. Desalination 113, pp. 119-127. Kim, K, Kim, H-J, Choi, B-Y, Kim, S-H, Park, K-H, Park, E, Koh, D-C, Yun, S-T, 2008. Fe and Mn levels regulated by agricultural activities in alluvial groundwaters underneath a flooded paddy field. Applied Geochemistry, 23, pp. 44-57. King WD, Marrett LD, 1996. Case-control study of bladder cancer and chlorination by products in treated water (Ontario, Canada). Cancer Causes Controls, 7, pp. 596-604. Koga, M, Kadokami, K, Shinohara, R, 1992. Laboratory-scale ozonation of water contaminated with trace pesticides. Water Sci. Technol. 26(9-11), pp. 2257-2260. Water and Wastewater Treatment11-12 25 LJMU-BUILT ENVIRONMENT
  • 26.
    Water treatment plantdesign from water data review Kujundzic, E, Greenberg, AR, Fong, R, Hernández, M, 2011. Monitoring Protein Fouling on Polymeric Membranes Using Ultrasonic Frequency-Domain Reflectometry. Membranes, 1, pp. 195-216. LeChevallier, MW, Norton, MW, Lee, RG, 1991. Giardia and Cryptosporidium spp. in filtered drinking water supplies. Appl. Environ. Microbiology. 57, pp. 2610-2616. Lucena, F, Duran, AE, Morón, A, Calderón, E, Campos, C, Gantzer, C, Skraber, S, Jofre, J, 2004. Reduction of bacterial indicators and bacteriophages infecting fecal bacteria in primary and secondary wastewater treatments. J. Appl. Microbiol. 97 (5), pp. 1069-1076. Medema, GJ, Schets, FM, Teunis, PFM, Havelaar, AH, 1998. Sedimentation of free and attached Cryptosporidium oocysts and Giardia cysts in water. Appl. Environment Microbiology, 64 (11), pp. 4460-4466. MWH, 2005.Water treatment: principles and design. NJ, USA: John Wiley & Sons. Ormad, MP, Miguel, N, Claver, A, Matesanz, JM, Ovelleiro, JL, 2008. Pesticides removal in the process of drinking water production. Chemosphere 71, pp. 97-106. Othman, MN, Abdullah, MP, Abd, YF, 2010. Removal of Aluminium from Drinking Water. Sains Malaysiana, 39(1), pp. 51-55. Palma, P, Kuster, M, Alvarenga, P, Palma, VL, Fernandes, RM, Soares, AMVM, López de Alda, MJ, Barceló, D, Barbosa, IR, 2009. Risk assessment of representative and priority pesticides, in surface water of the Alqueva reservoir (South of Portugal) using on-line solid phase extraction-liquid chromatography-tandem mass spectrometry. Environment International 35, pp. 545-551. Richardson, SD, 2005. New disinfection by-product issues: emerging DBPs and alternative routes of exposure. Global Nest, Int J, 7(1), pp. 43-60. Sadiq, R, Rodriguez, M, 2004. Disinfection byproducts (DBPs) in drinking water and predictive models for their occurrences: a review. Sci Total Environ; 321, pp. 21-46. SAJH, 2002. Specification for Poly (Diallyldimethylammonium Chloride) or Polydadmac Used For Potable Water Supply. Quality Assurance Department. Available at: <http://www.saj.com.my/Spec/SPECIFICATION%20FOR%20POLYDADMAC1.pdf> [Accessed 06 January 2012]. Schaefer, K, Exall, K, Marsalek, J, 2004. Water reuse and recycling in Canada: a status and needs assessment. Can.Water Resour. J. 29 (3), pp. 195-208. Shaw, K, Walker, S, Koopman, B, 2000. Improving filtration of Cryptosporidium. J. AWWA 92, pp. 103-111. Solomon, C, Casey, P, Mackne, C, Lake, A, 1998. Chlorine Disinfection. National Small Flows Clearinghouse. Available at <http://www.nesc.wvu.edu/pdf/WW/publications/eti/Chl_Dis_gen.pdf > [Accessed 06 January 2012]. Srinivisan, PT, Viraraghavan, T, Subramanian, KS, 1999. Aluminium in drinking water: An overview. Water SA, 25(1), pp. 47-56. Tankéré, SPC, Stathama, PJ, Priceb, NB, 2000. Biogeochemical Cycling of Mn and Fe in an Area Affected by Eutrophication: The Adriatic Sea. Estuarine, Coastal and Shelf Science, 51, pp. 491-506. Water and Wastewater Treatment11-12 26 LJMU-BUILT ENVIRONMENT
  • 27.
    Water treatment plantdesign from water data review UFC, 2005. Industrial water treatment operation and maintenance. Available at: <http://www.wbdg.org/ccb/DOD/UFC/ufc_3_240_13fn.pdf> [Accessed 04 January 2012]. USCDC, 1997. Summary of notifiable diseases; morbidity and mortality weekly report. CDC surveillance summaries: surveillance for waterborne disease outbreaks-USA. USEPA, 2006. National primary drinking water regulations: stage 2 disinfectants and disinfection by products rule: final rule. Fed Register, 71 (2). Von Gunten, U, 2003. Ozonation in drinking water. Part I: Oxidation kinetics and product formation. Water Res. 37, pp. 1443-1467. WHO, 2009. Water Safety Plan Manual. Step-by-step risk management for drinking-water suppliers. Available at: <http://www.who.int/water_sanitation_health/publication_9789241562638/en/index.html> [Accessed 28 December 2011]. th WHO, 2011. Guidelines for drinking-water quality. World Health Organization, 4 ed. Available at: <http://www.who.int/water_sanitation_health/publications/2011/dwq_guidelines/en/> [Accessed 06 December 2011]. Zhang, K, Farahbakhs, K. 2007. Removal of native coliphages and coliform bacteria from municipal wastewater by various wastewater treatment processes: Implications to water reuse. Water research, 41, pp. 2816-2824. Water and Wastewater Treatment11-12 27 LJMU-BUILT ENVIRONMENT