This document provides an introduction to water treatment. It discusses that contaminated water can cause diseases and outlines some global statistics on water-related illnesses. It then describes the objectives and basic processes of water treatment. The document focuses on characterizing raw water sources and quality by examining physical, chemical, and biological parameters. Key water quality indicators discussed include turbidity, pH, hardness, chlorides, bacteria (including coliforms) and more. Standard methods for measuring various water quality parameters are also introduced.
Wolaita Sodo University
Collegeof Engineering
Department of Hydraulic and Water
Resources Engineering
Water Treatment Lecture Note
By: Ermias M. & Muse G.
September, 2017
2.
Chapter 1 -Introduction
Some Facts
88% of diarrhoeal disease is attributed to unsafe water
supply, inadequate sanitation and hygiene.
1.8 million people die every year from diarrhoeal
diseases
90% are children under 5, mostly in developing
countries
3.
Every 8 seconds,a child dies from drinking contaminated
water (that is 10,000 a day).
500 million people are at risk from trachoma, 146 million
are threatened by blindness and 6 million people are
visually impaired from this disease.
In 2006 in the Adami Tulu Jido Kombolcha district,
approximately 11,000 people have been affected by
diarrhea epidemic.
4.
Water treatment isthe process of removing undesirable
substances from a raw water source and make it fit for
use.
Health and aesthetics are the principal motivations for
water treatment.
Contaminated water results in outbreak of waterborne
diseases
Contaminants can include Aquatic pathogens, toxic
chemicals, heavy metals, pesticides, etc.
5.
Absolute treatmentof water is not required but
purification.
Purification of water refers to the removal of impurities
which are not good for health and other uses.
Therefore, potable or wholesome water is water that
does not contain harmful impurities & contains other
salts and impurities either good for health or un-harmful
to health.
6.
Raw Water Source
Thevarious sources of raw water are generally classified
into two categories: Surface sources, and Sub-surface
sources or underground sources.
The available raw waters must be treated and purified
before they can be supplied to the public for their
domestic, industrial or any other uses.
The extent of treatment required to be given to the
particular water depends upon its quality characteristics,
and the quality requirements for the intended use.
7.
Importance of waterquality considerations
To evaluate and classify raw water quality
To identify sources of pollution
To assess the treatment required for beneficial uses
8.
Basic objectives ofwater treatment:
To remove dissolved mineral matters, settleable
suspended matter and non-settleable colloidal
impurities
To improve the aesthetic quality – color, taste and
odor
To remove unpleasant taste and odor,
To kill/destroy troublesome micro-organisms and
their remains,
Softening of water for use in domestic washing
laundries and boilers
Above all, to make water safe for drinking and fit for
domestic, commercial and industrial use.
9.
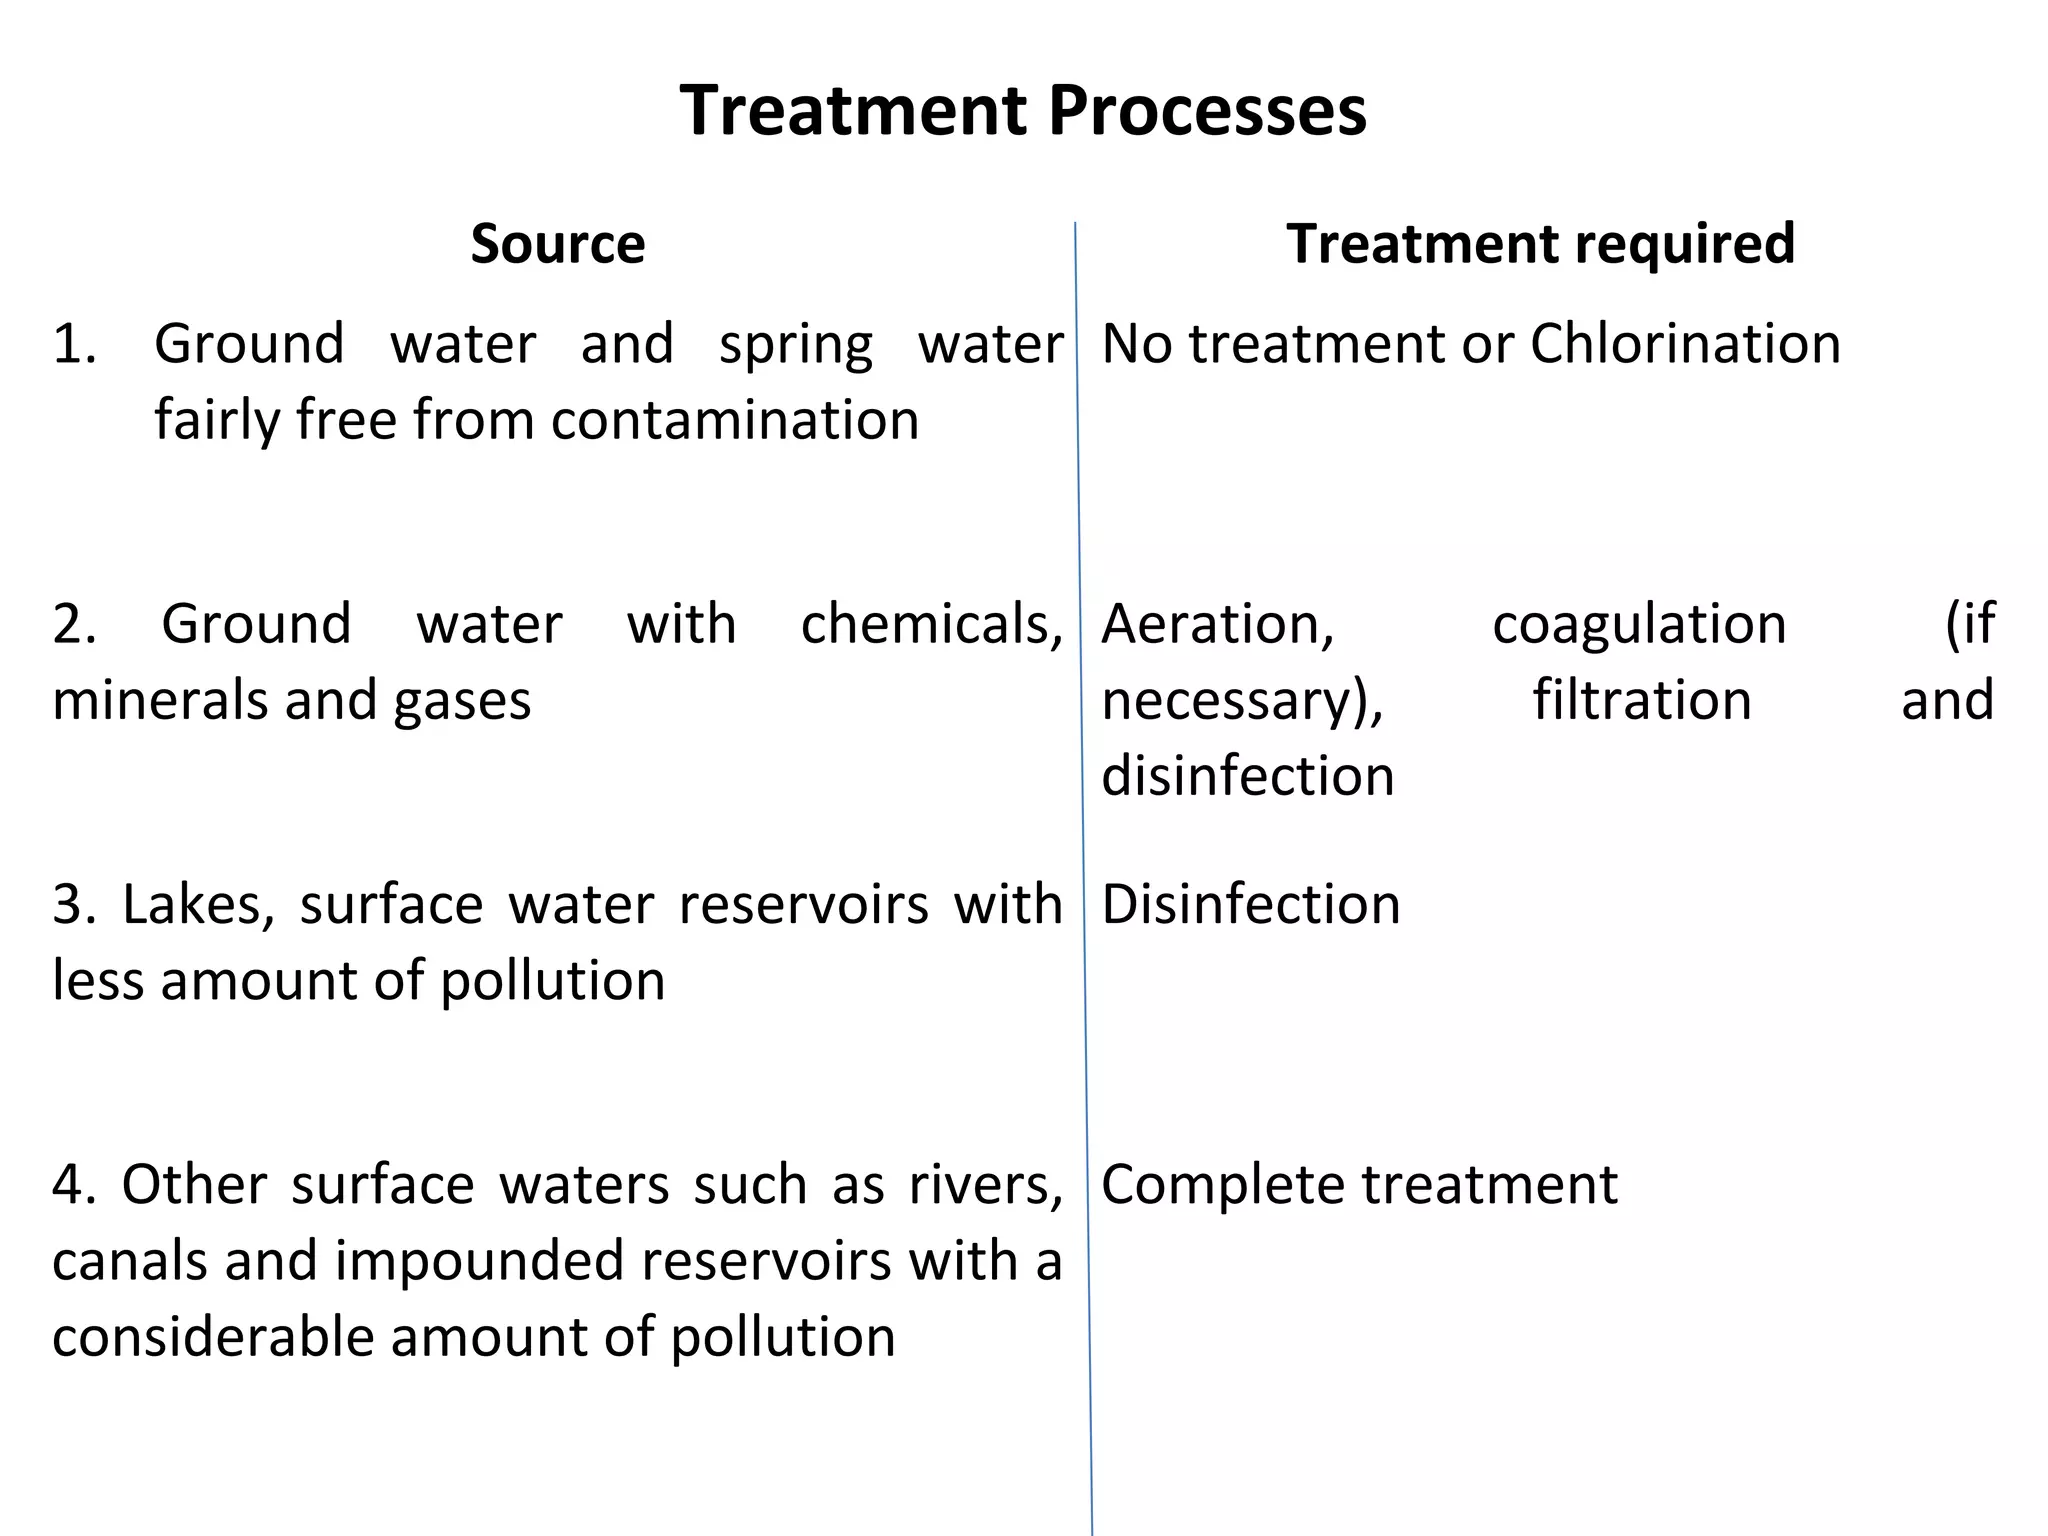
Source Treatment required
1.Ground water and spring water
fairly free from contamination
No treatment or Chlorination
2. Ground water with chemicals,
minerals and gases
Aeration, coagulation (if
necessary), filtration and
disinfection
3. Lakes, surface water reservoirs with
less amount of pollution
Disinfection
4. Other surface waters such as rivers,
canals and impounded reservoirs with a
considerable amount of pollution
Complete treatment
Treatment Processes
10.
1.2. Water Qualitycharacteristics
Normally, the raw water is analyzed by testing
their physical, chemical and bacteriological
characteristics.
11.
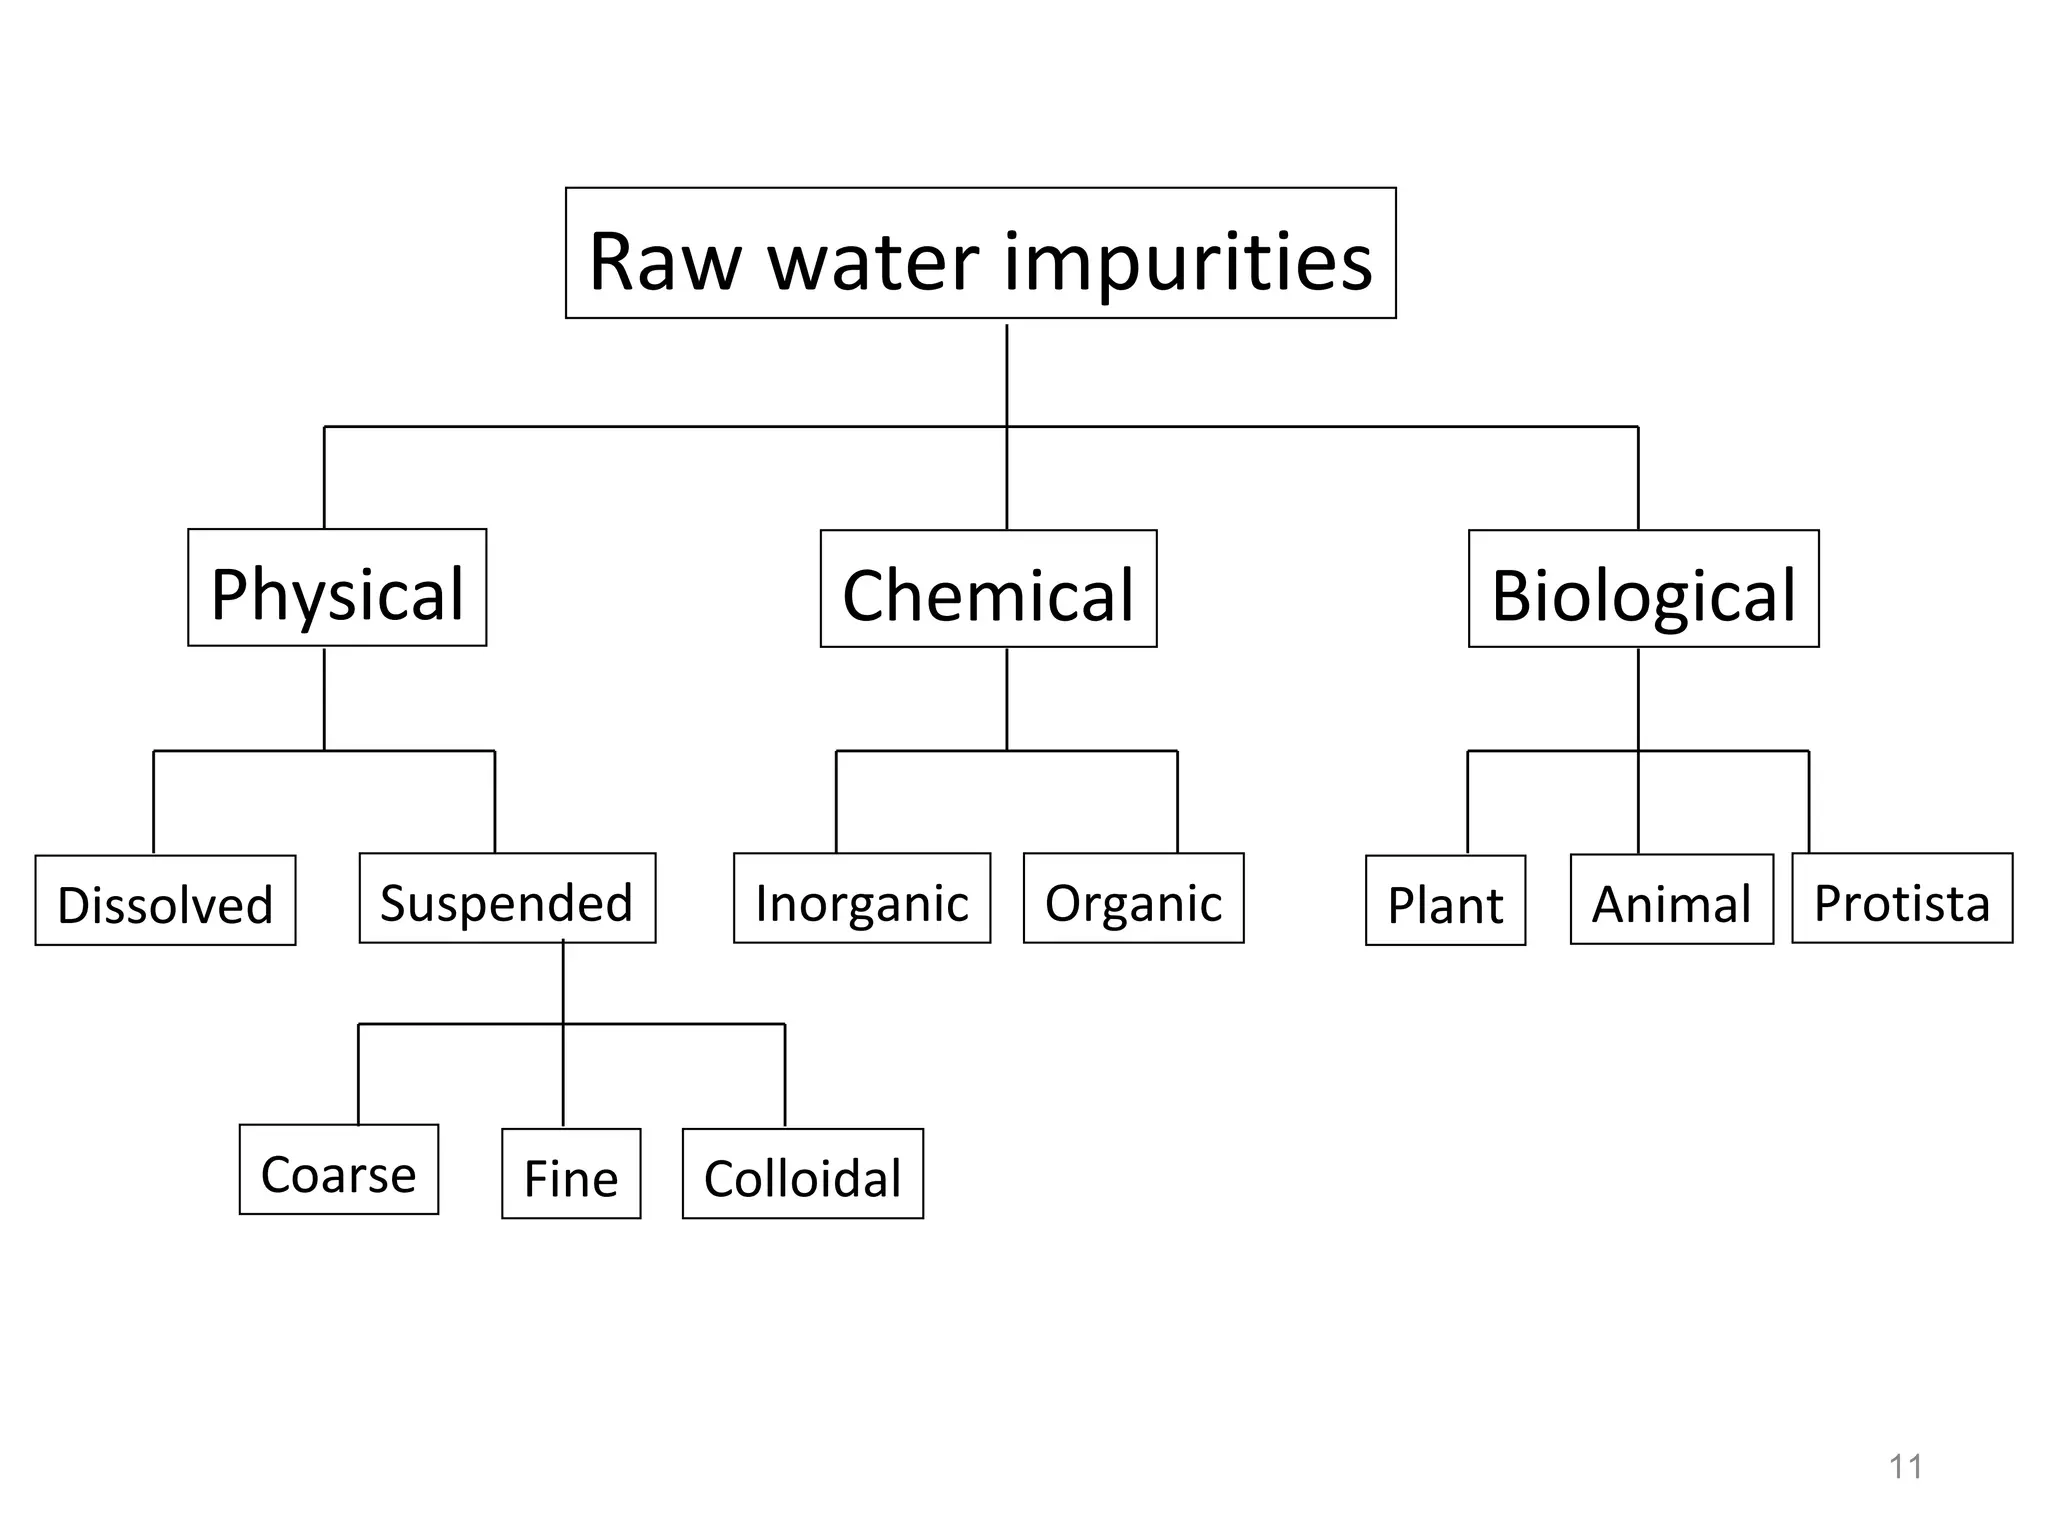
Raw water impurities
PhysicalChemical Biological
Dissolved Suspended Inorganic Organic Plant Animal Protista
Coarse Fine Colloidal
11
12.
1.2.1. Physical Characteristics
PhysicalCharacteristics are those characteristics of water
that respond to the senses of sight, touch, taste or smell.
Physical parameters include:
Suspended solids
Turbidity
Colour
Taste and Odour
Temperature
13.
Suspended solids
• Source
–inorganic or organic particles.
• Inorganic solids clay, silt, and other soil
constituents
• Organic material plant fibers and biological
solids (algal cells, bacteria, etc)
• Impacts
– Aesthetically displeasing and provides adsorption
sites for chemical and biological agents.
• Measurement
– gravimetric tests - by evaporating a sample to
dryness and weighing the residue.
14.
Turbidity
Turbidity is ameasure of the extent of which light is
either absorbed or scattered by suspended material in
water.
It is not a direct quantitative measurement of suspended
solids.
The turbidity depends upon fineness and concentration
of particles present in water.
15.
Source
the erosion ofcolloidal material such as clay, silt, rock
fragments, and metal oxides from the soil.
Vegetable fibers and microorganisms
Impact
aesthetically displeasing due to opaqueness or milky
coloration
adsorption sites for chemicals and biological organisms
16.
Turbidity
Measurement
photometrically by determiningthe percentage of
light of a given intensity that is either absorbed or
scattered.
Measurement apparatus: by a turbidity meters:
Jackson turbidity unit (JTU) - measuring the depth of
column of liquid required to cause the image of a
candle flame at the bottom to diffuse into a uniform
glow.
Nephelometry turbidity unit (NTU) - measure level
of light scattered by the particles at right angles to
the incident light beam.
The IS value for drinking water is 10 to 25 NTU.
17.
Colour
• Source: Dissolvedorganic matter from decaying
vegetation or some inorganic materials
• Impact:
– Colored water is not aesthetically acceptable to the
general public.
– Highly colored water is unsuitable for laundering,
dyeing, papermaking, beverage manufacturing, diary
production and other food processing, and textile
and plastic production.
18.
Measurement:
by comparing thecolour of water sample with other
standard glass tubes containing solutions of different
standard colour intensities.
The standard unit of colour is that which is produced
by one milligram of platinum cobalt dissolved in one
litre of distilled water.
The IS value for treated water is 5 to 25 cobalt units.
19.
Odour and Taste
•Odour depends on the contact of a stimulating
substance with the appropriate human receptor cell.
• Source:
– Most organic and some inorganic chemicals,
originating from municipal or industrial wastes.
– Phenolic compounds, common constituents of
vegetative decay products, produce very
objectionable taste and odor compounds
20.
• Impact: characterand intensity of taste and odour
discloses the nature of pollution or the presence of
microorganisms.
• Measurement:
– Taste and odour can be expressed in terms of odour
intensity or threshold values.
– A new method to estimate taste of water sample has
been developed based on flavour known as 'Flavour
Profile Analysis' (FPA).
21.
Temperature
Temperature to agreat extent determines
– the trends and tendencies of changes in water quality.
– The entire mechanism of water treatment depends
on temperature.
– Sometimes increased temperature may increase the
odour of water because of the increased volatility of
odour producing compounds.
– The increase in temperature decreases palatability,
because at elevated temperatures carbon dioxide and
some other volatile gases are expelled.
• The ideal temperature of water for drinking purposes is
5 to 12 °C - above 25 °C, water is not recommended for
drinking.
22.
1.2.1. Chemical Characteristics
•Water has been called the universal solvent, and
chemical parameters are related to the solvent
capabilities of water.
• Major chemical parameters include:
pH
Acidity
Alkalinity
Hardness
Chlorides
Sulphates
Iron
Nitrates
Metals
23.
pH
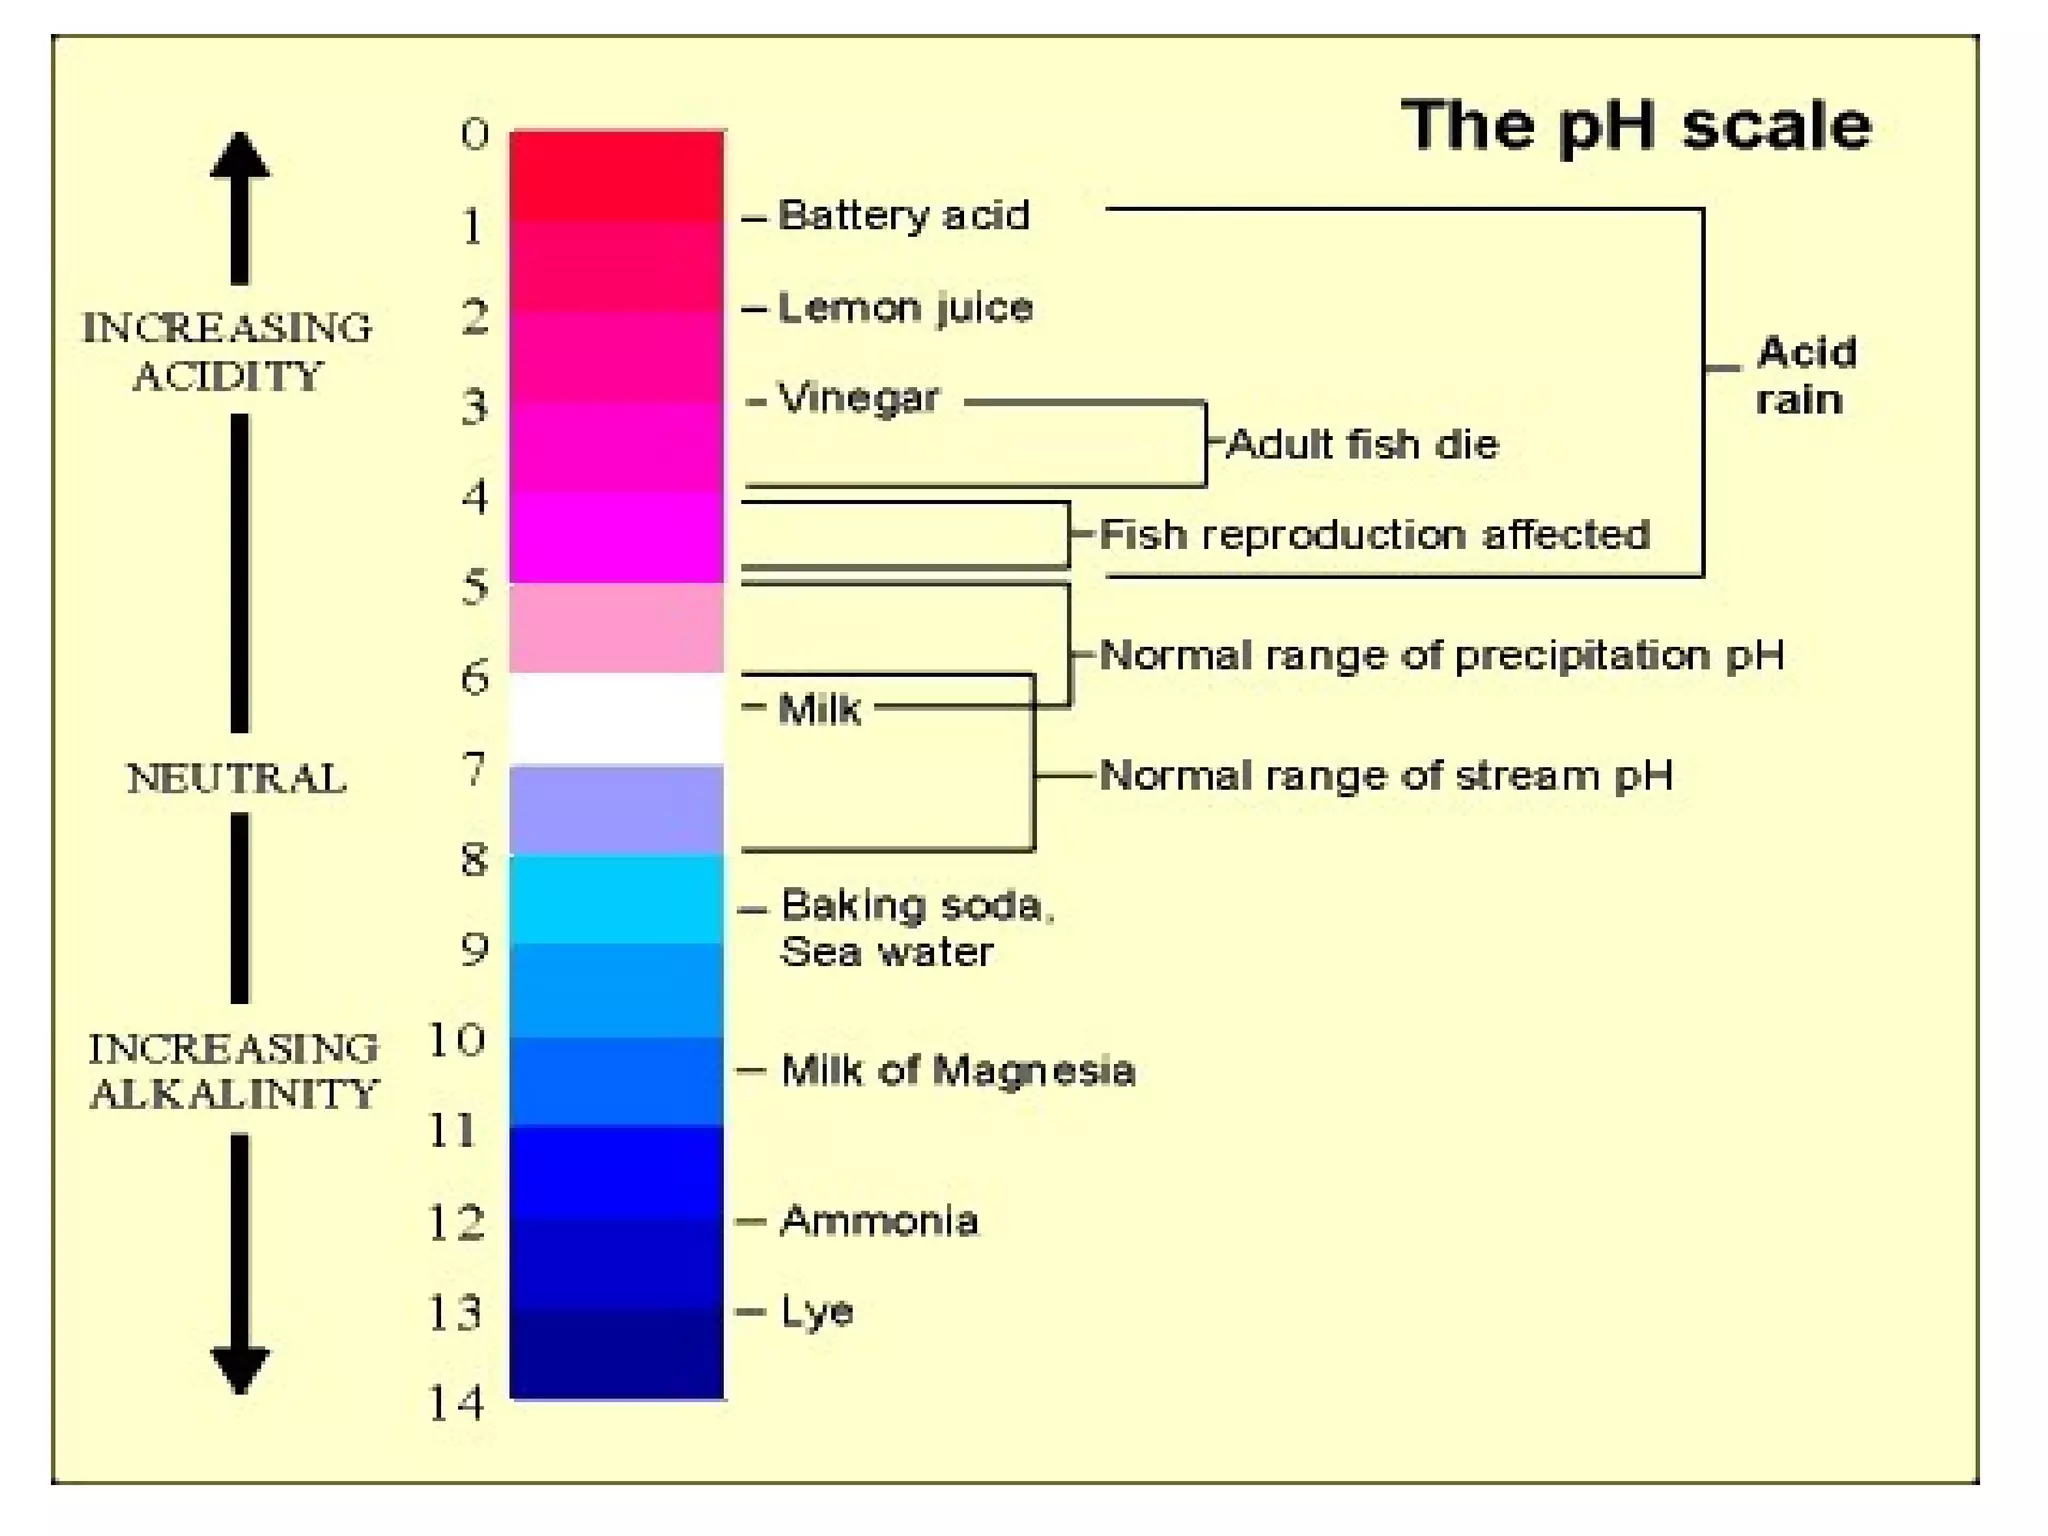
pH value denotesthe acidic or alkaline condition of water.
It is expressed on a scale ranging from 0 to 14, which is
the common logarithm of the reciprocal of the hydrogen
ion concentration.
Without proper adjustment of pH, raw water may be
corrosive and adversely affect treatment processes.
The recommended pH range for treated drinking waters is
6.5 to 8.5.
25.
Acidity
Acidity is nothingbut representation of carbondioxide or
carbonic acids.
Acidity of water may be caused by the presence of
uncombined carbondioxide and weak bases.
The acidity of water is a measure of its capacity to
neutralize bases.
It is expressed as mg/L in terms of calcium carbonate.
Carbon dioxide causes corrosion in public water supply
systems.
26.
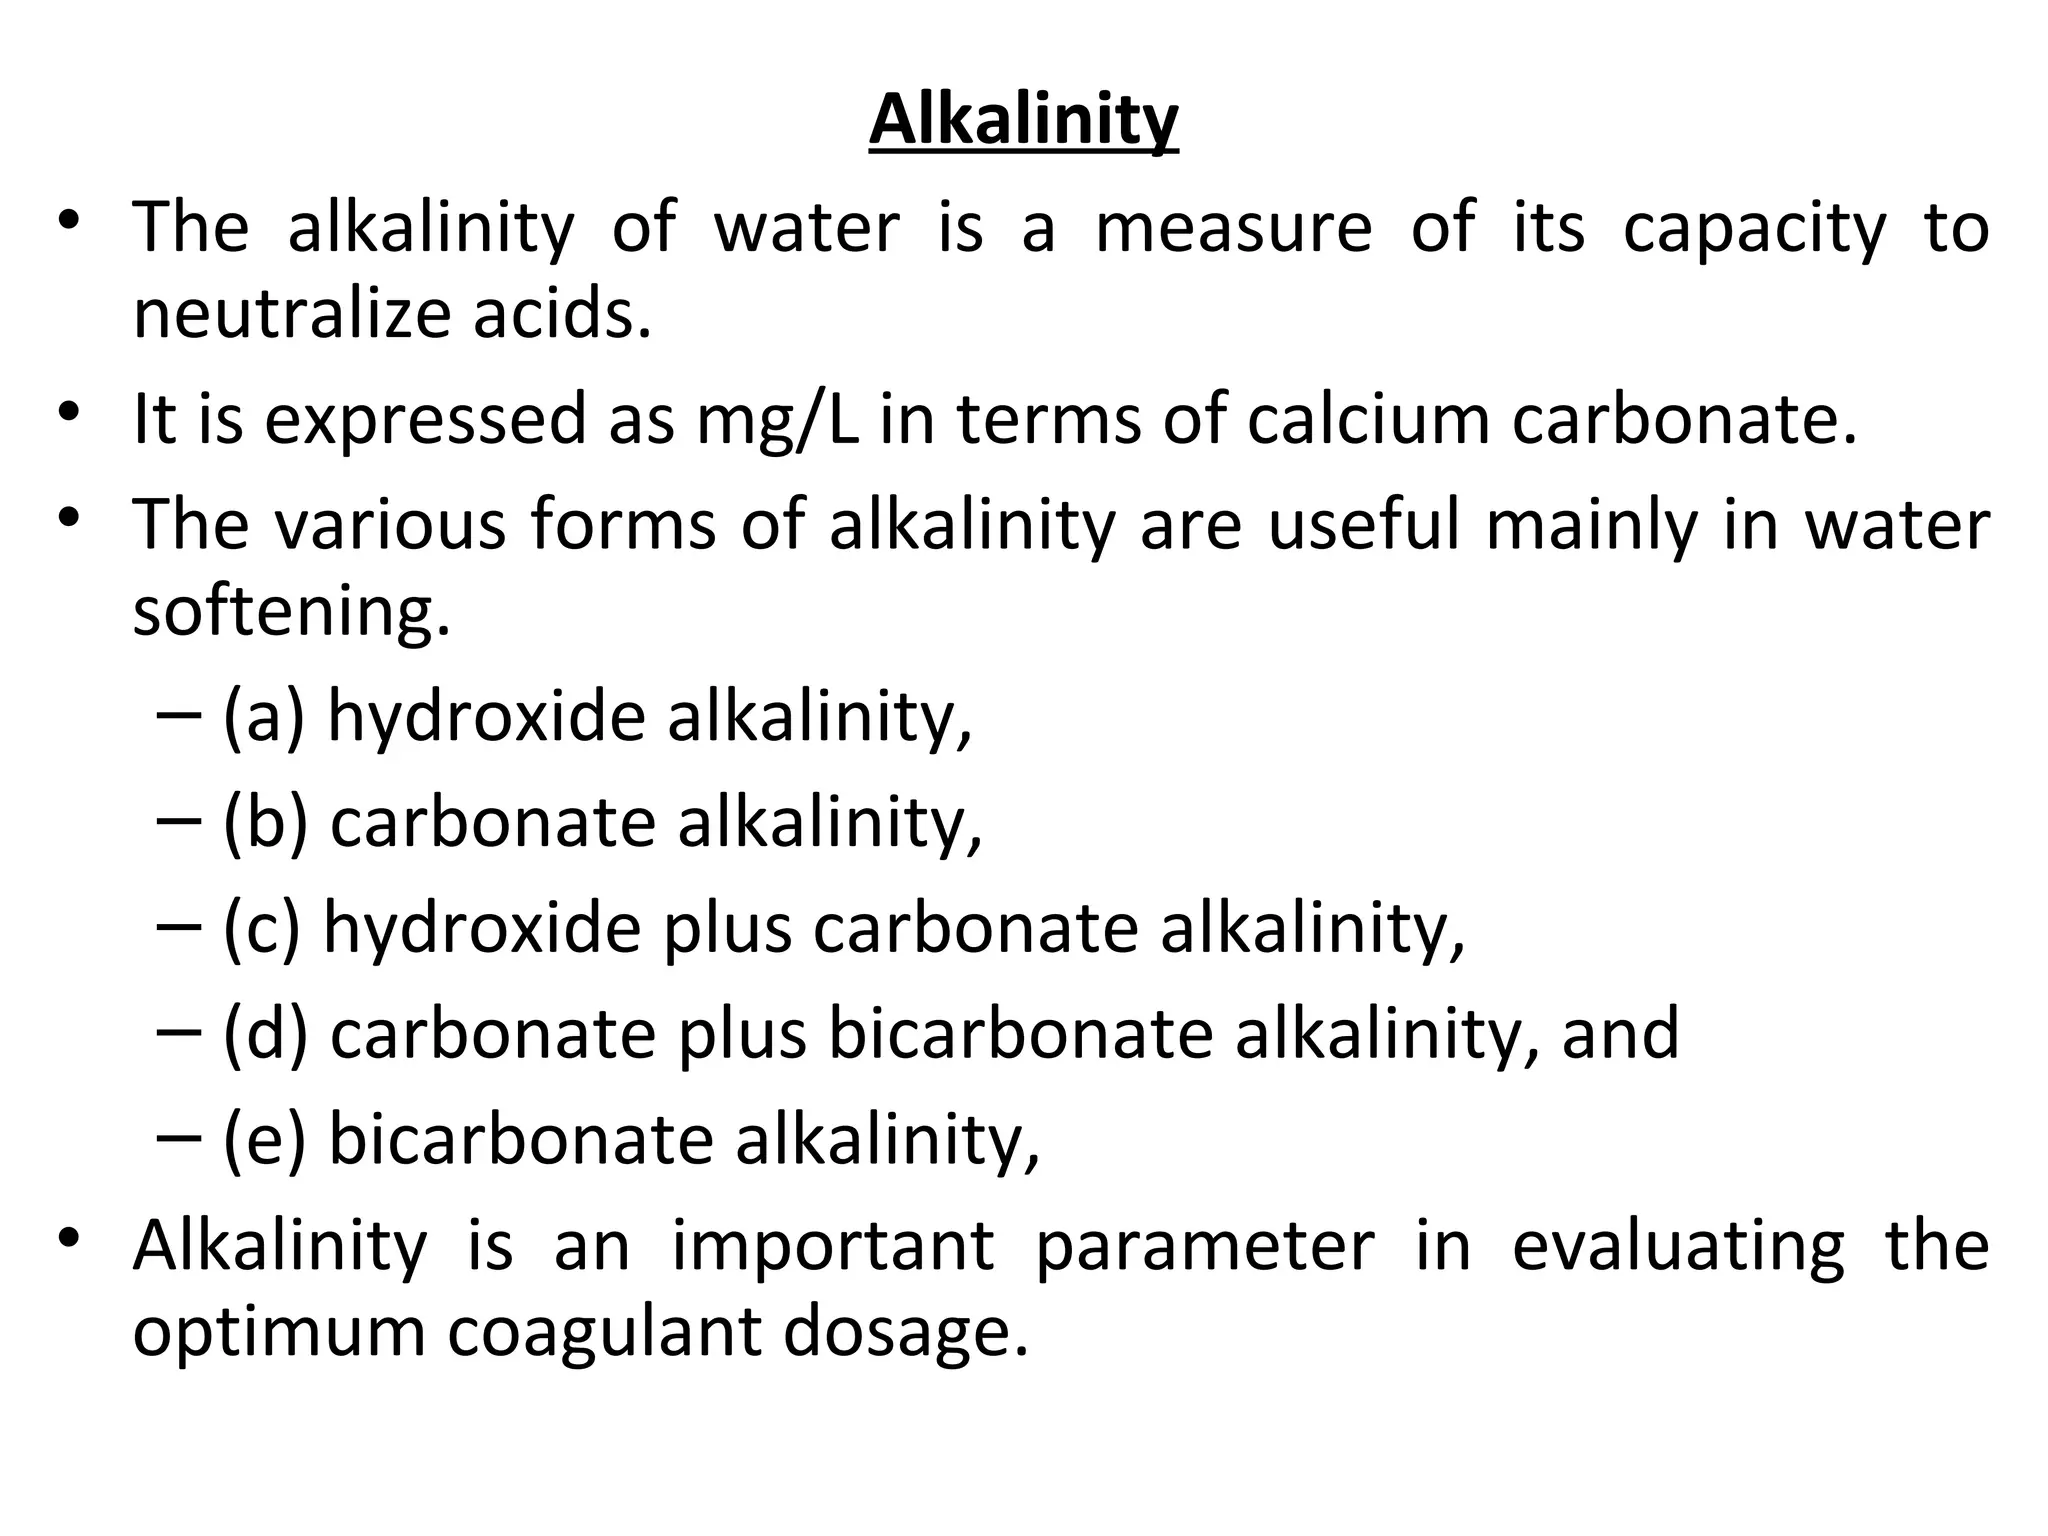
Alkalinity
• The alkalinityof water is a measure of its capacity to
neutralize acids.
• It is expressed as mg/L in terms of calcium carbonate.
• The various forms of alkalinity are useful mainly in water
softening.
– (a) hydroxide alkalinity,
– (b) carbonate alkalinity,
– (c) hydroxide plus carbonate alkalinity,
– (d) carbonate plus bicarbonate alkalinity, and
– (e) bicarbonate alkalinity,
• Alkalinity is an important parameter in evaluating the
optimum coagulant dosage.
27.
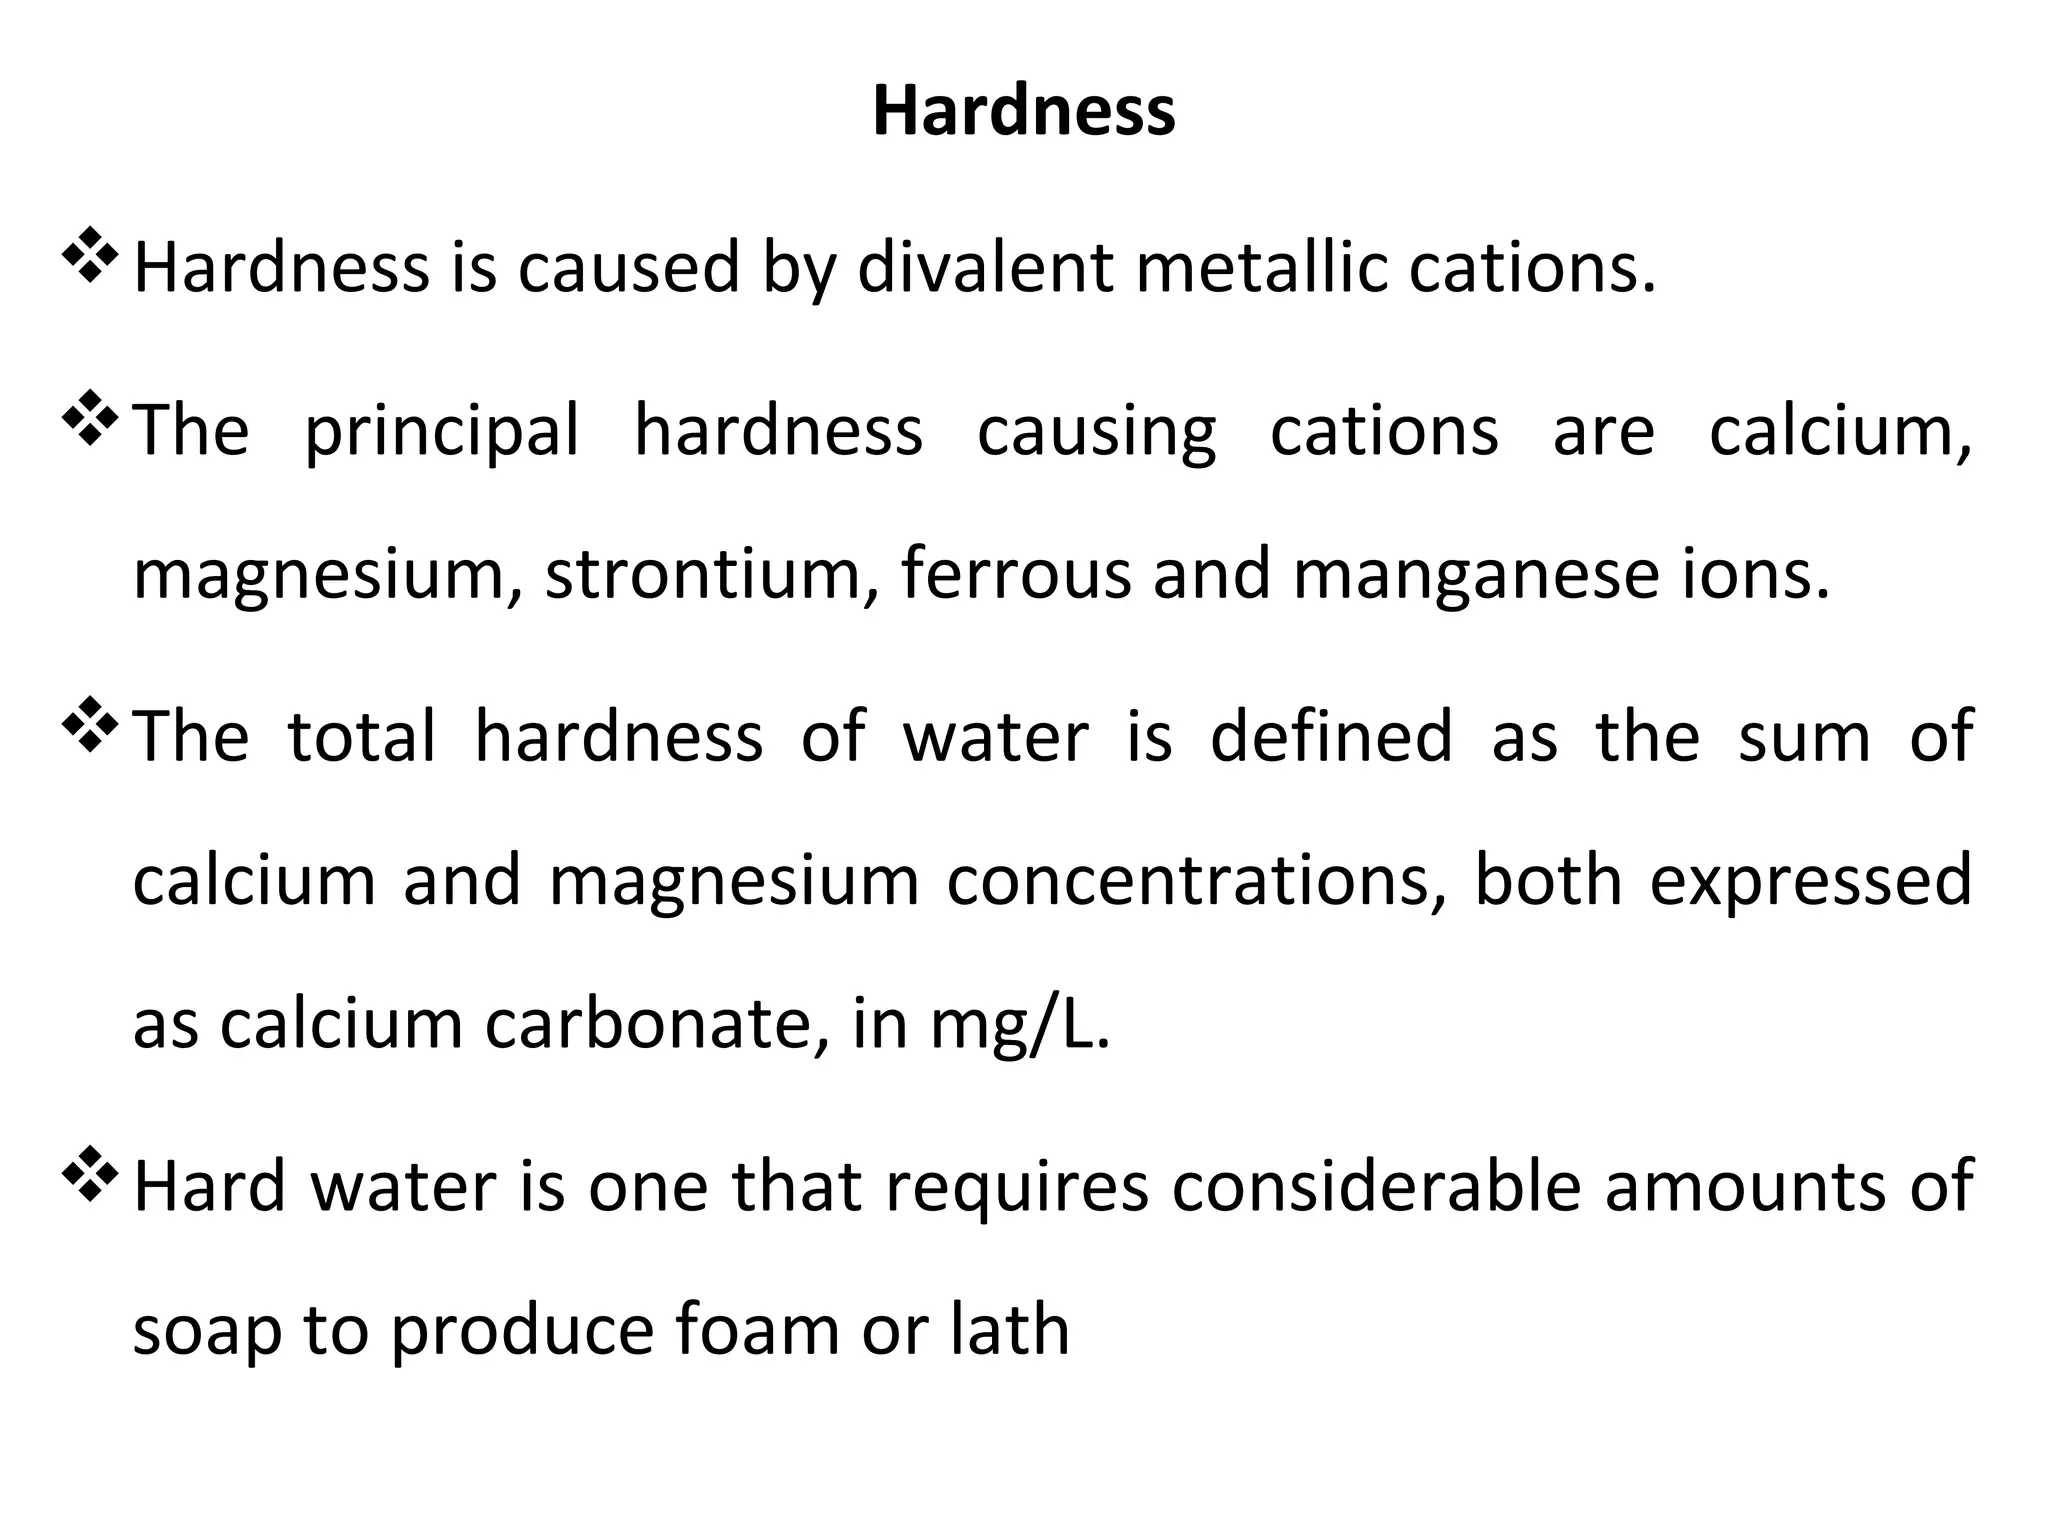
Hardness
Hardness is causedby divalent metallic cations.
The principal hardness causing cations are calcium,
magnesium, strontium, ferrous and manganese ions.
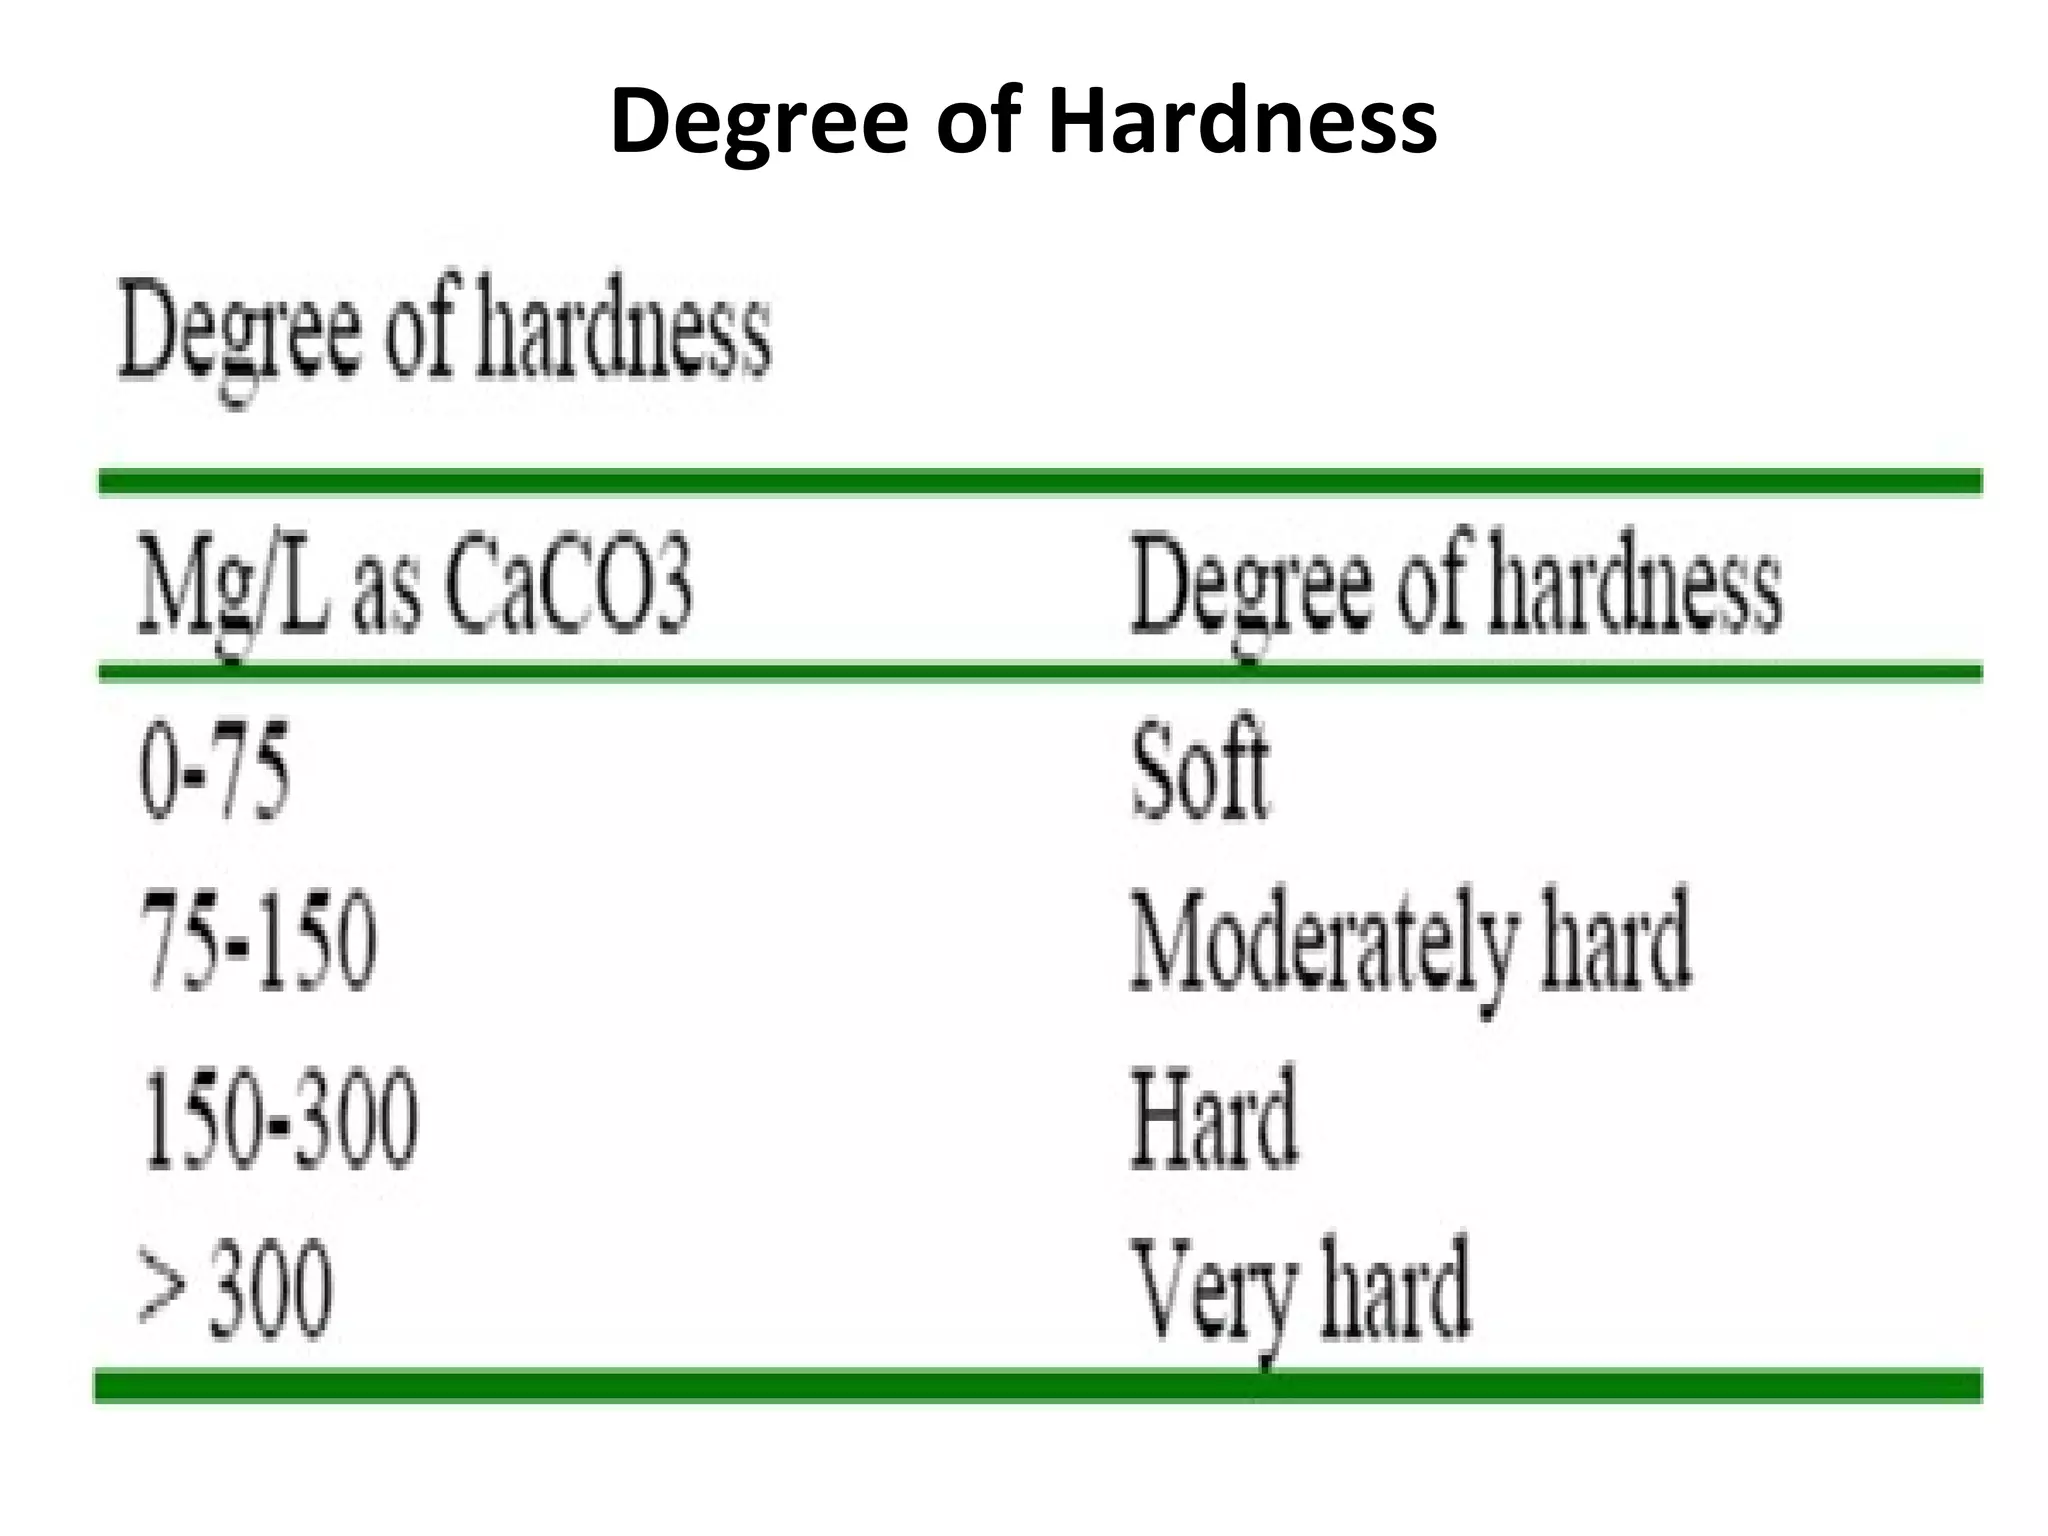
The total hardness of water is defined as the sum of
calcium and magnesium concentrations, both expressed
as calcium carbonate, in mg/L.
Hard water is one that requires considerable amounts of
soap to produce foam or lath
28.
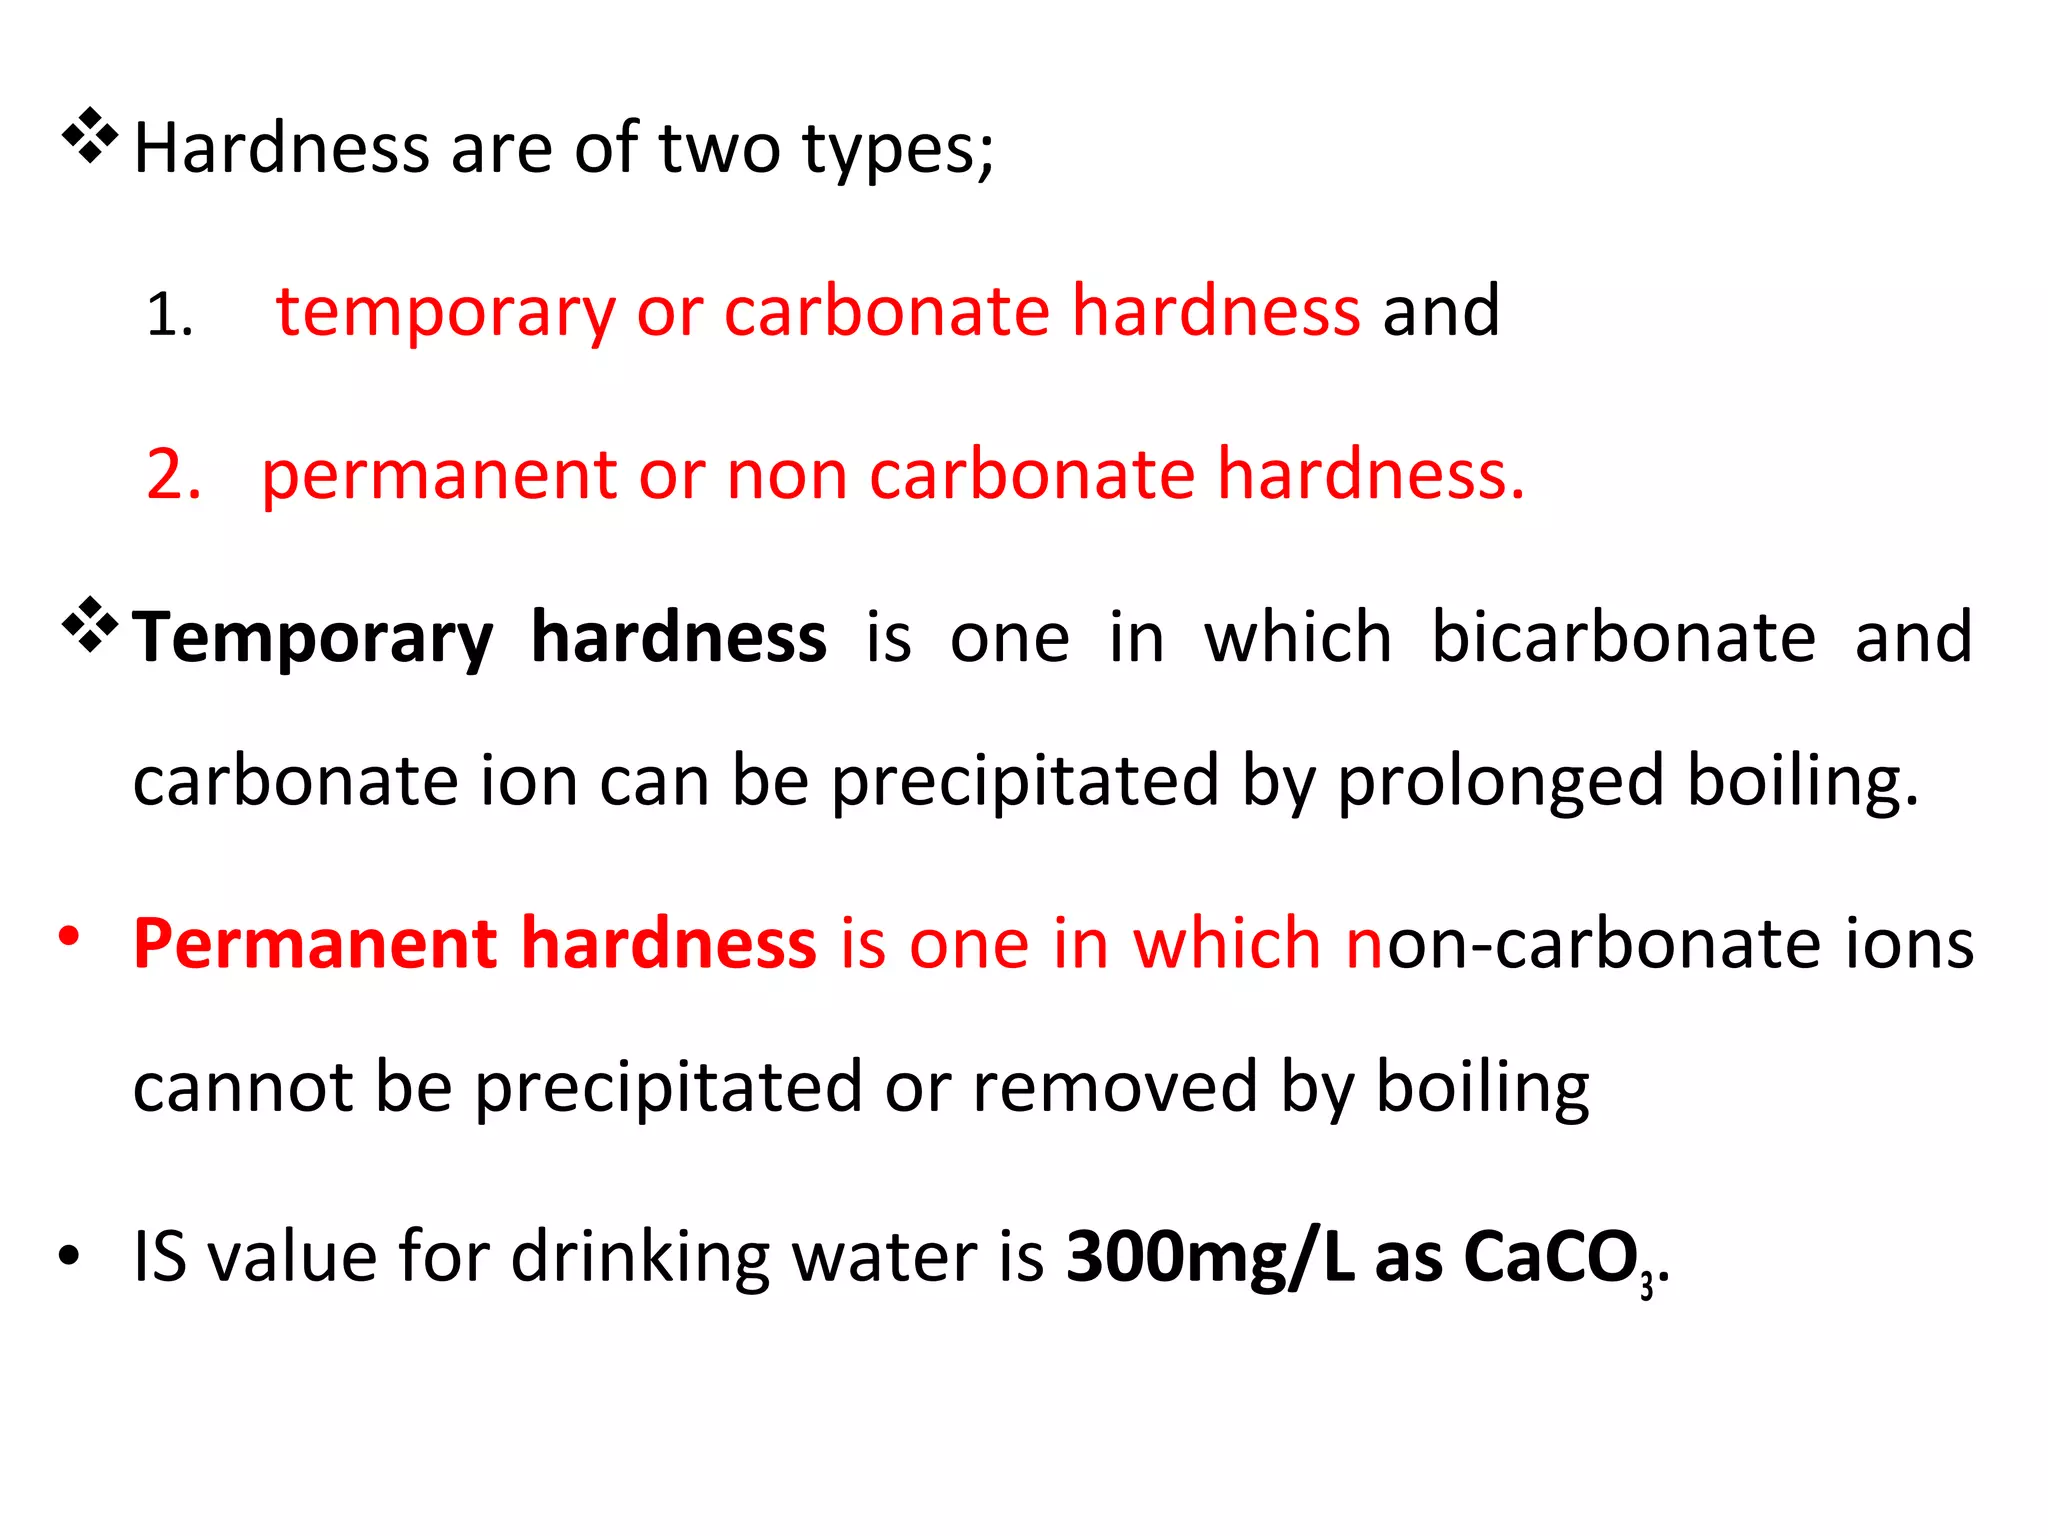
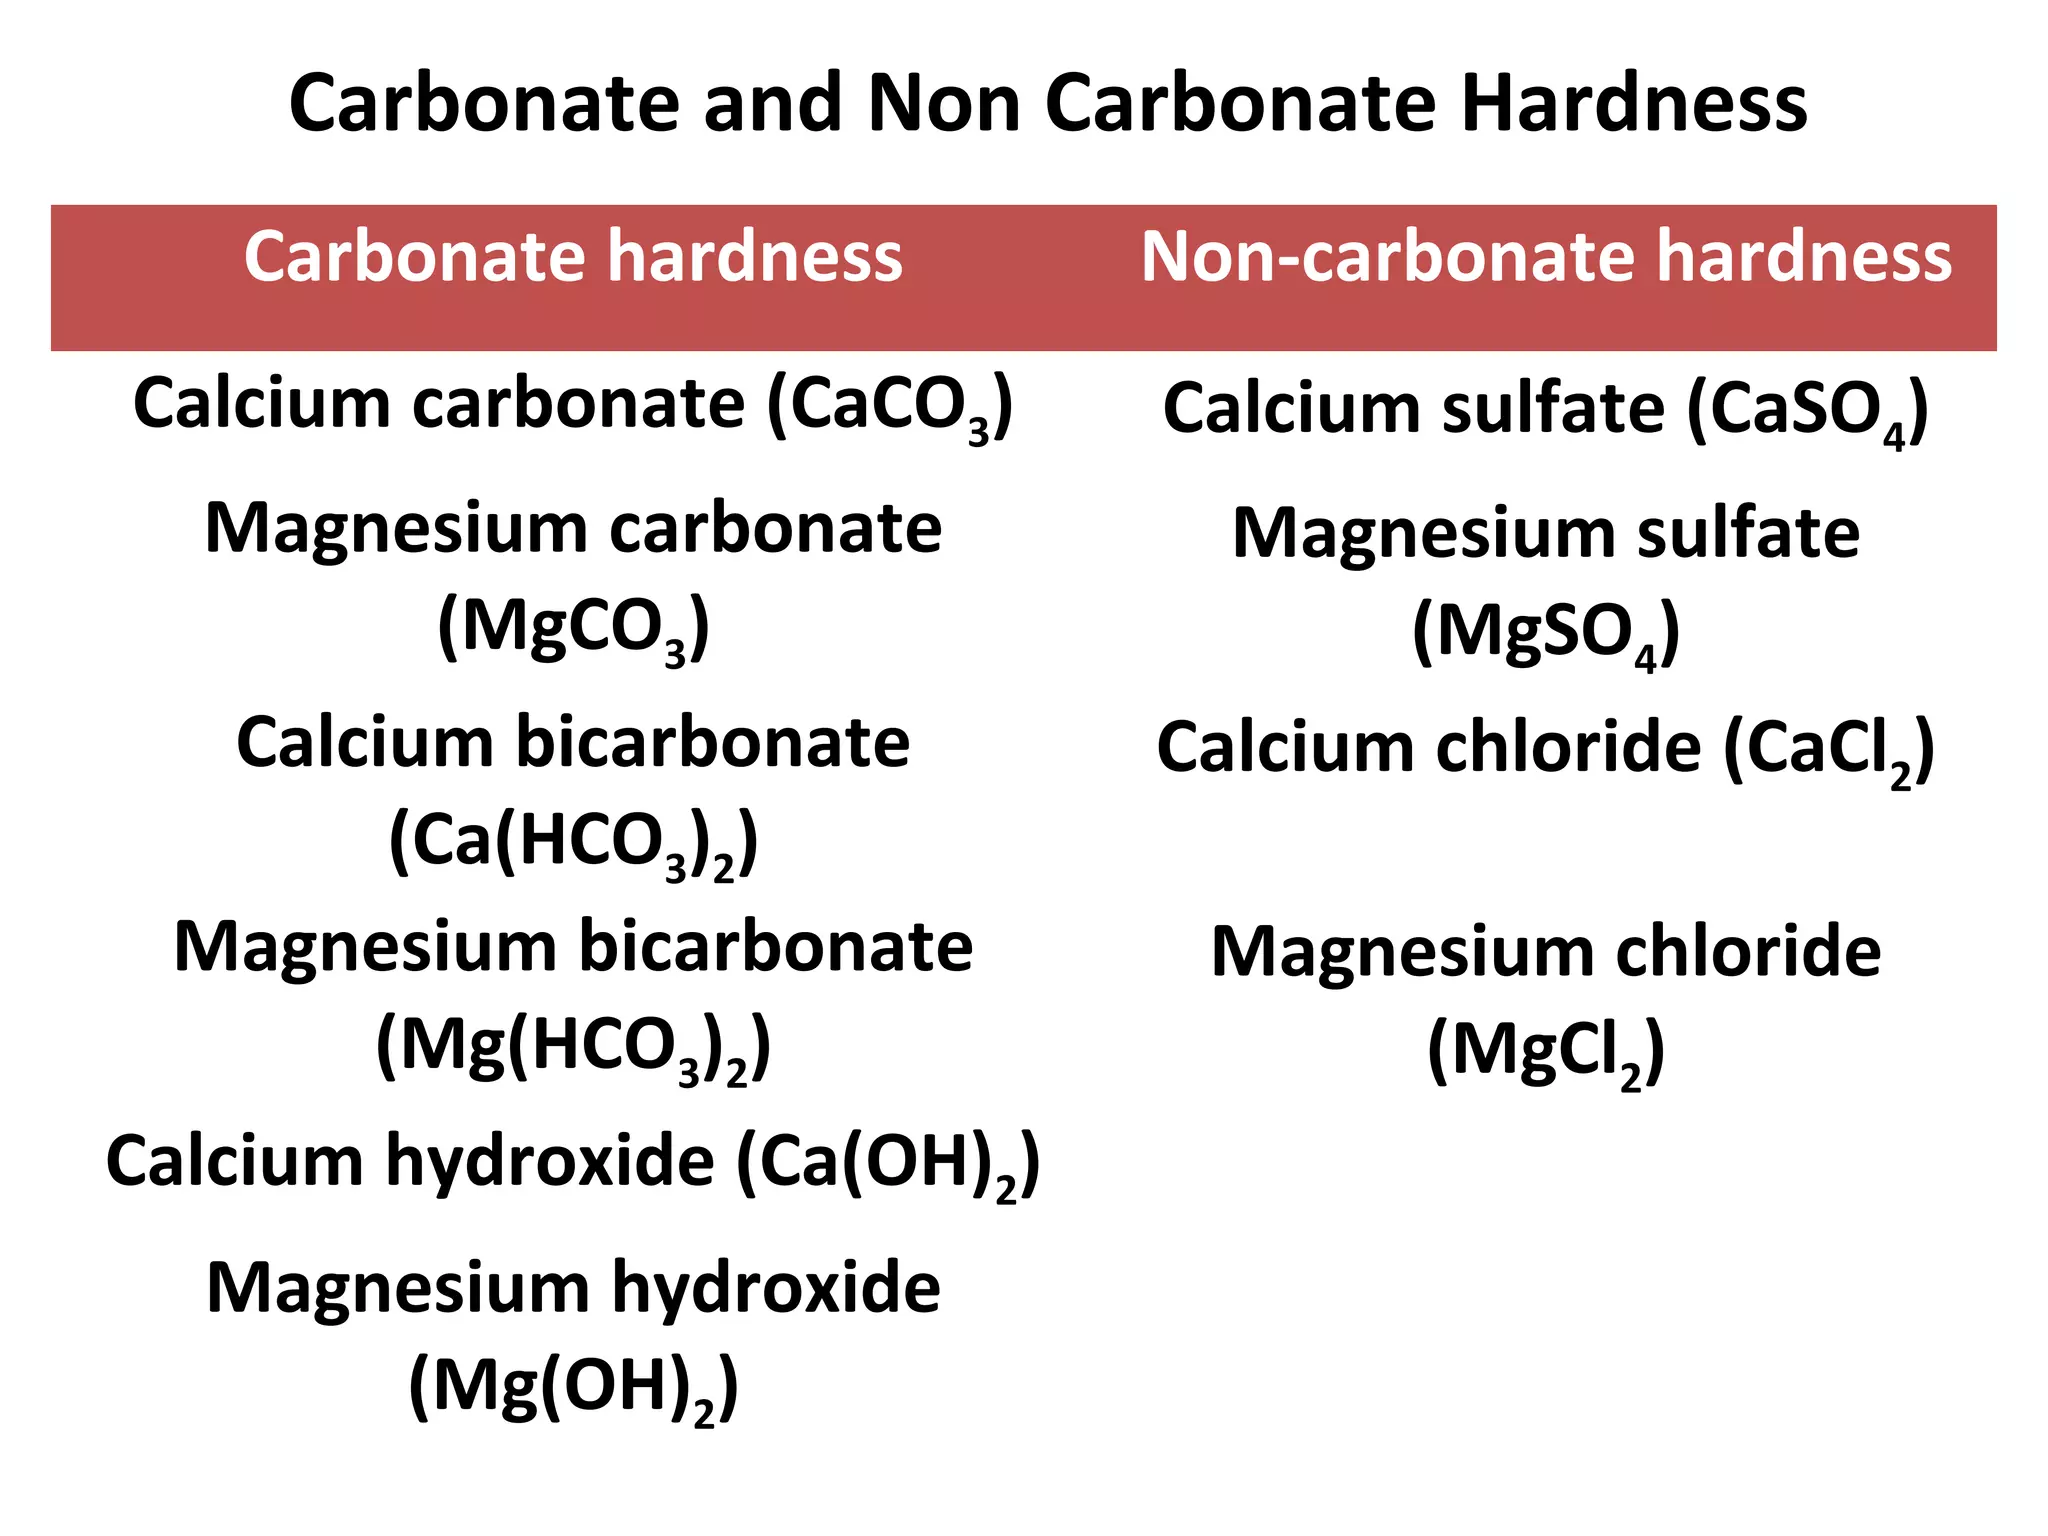
Hardness are oftwo types;
1. temporary or carbonate hardness and
2. permanent or non carbonate hardness.
Temporary hardness is one in which bicarbonate and
carbonate ion can be precipitated by prolonged boiling.
• Permanent hardness is one in which non-carbonate ions
cannot be precipitated or removed by boiling
• IS value for drinking water is 300mg/L as CaCO3.
Chlorides
Chloride ion maypresent in combination with one or
more of the cations of calcium, magnesium, iron and
sodium.
Chlorides of these minerals present in water because of
their high solubility in water.
Each human being consumes about six to eight grams of
sodium chloride per day, a part of which is discharged
through urine and night soil.
Thus, excessive presence of chloride in water indicates
sewage pollution.
IS value for drinking water is 250 to 1000 mg/L.
32.
Sulphates
Sulphates occur inwater due to leaching from sulphate
mineral and oxidation of sulphides.
Sulphates are associated generally with calcium,
magnesium and sodium ions.
Sulphate in drinking water causes a laxative effect and
leads to scale formation in boilers.
It also causes odour and corrosion problems under
aerobic conditions.
Sulphate should be less than 50 mg/L, for some
industries.
Desirable limit for drinking water is150 mg/L. May be
extended upto 400 mg/L.
33.
Iron
• Iron isfound on earth mainly as insoluble ferric oxide.
• When it comes in contact with water, it dissolves to form
ferrous bicarbonate under favorable conditions.
• This ferrous bicarbonate is oxidized into ferric hydroxide,
which is a precipitate.
• Under anaerobic conditions, ferric ion is reduced to
soluble ferrous ion. Iron can impart bad taste to the
water, causes discoloration in clothes and incrustations
in water mains.
• IS value for drinking water is 0.3 to 1.0 mg/L.
34.
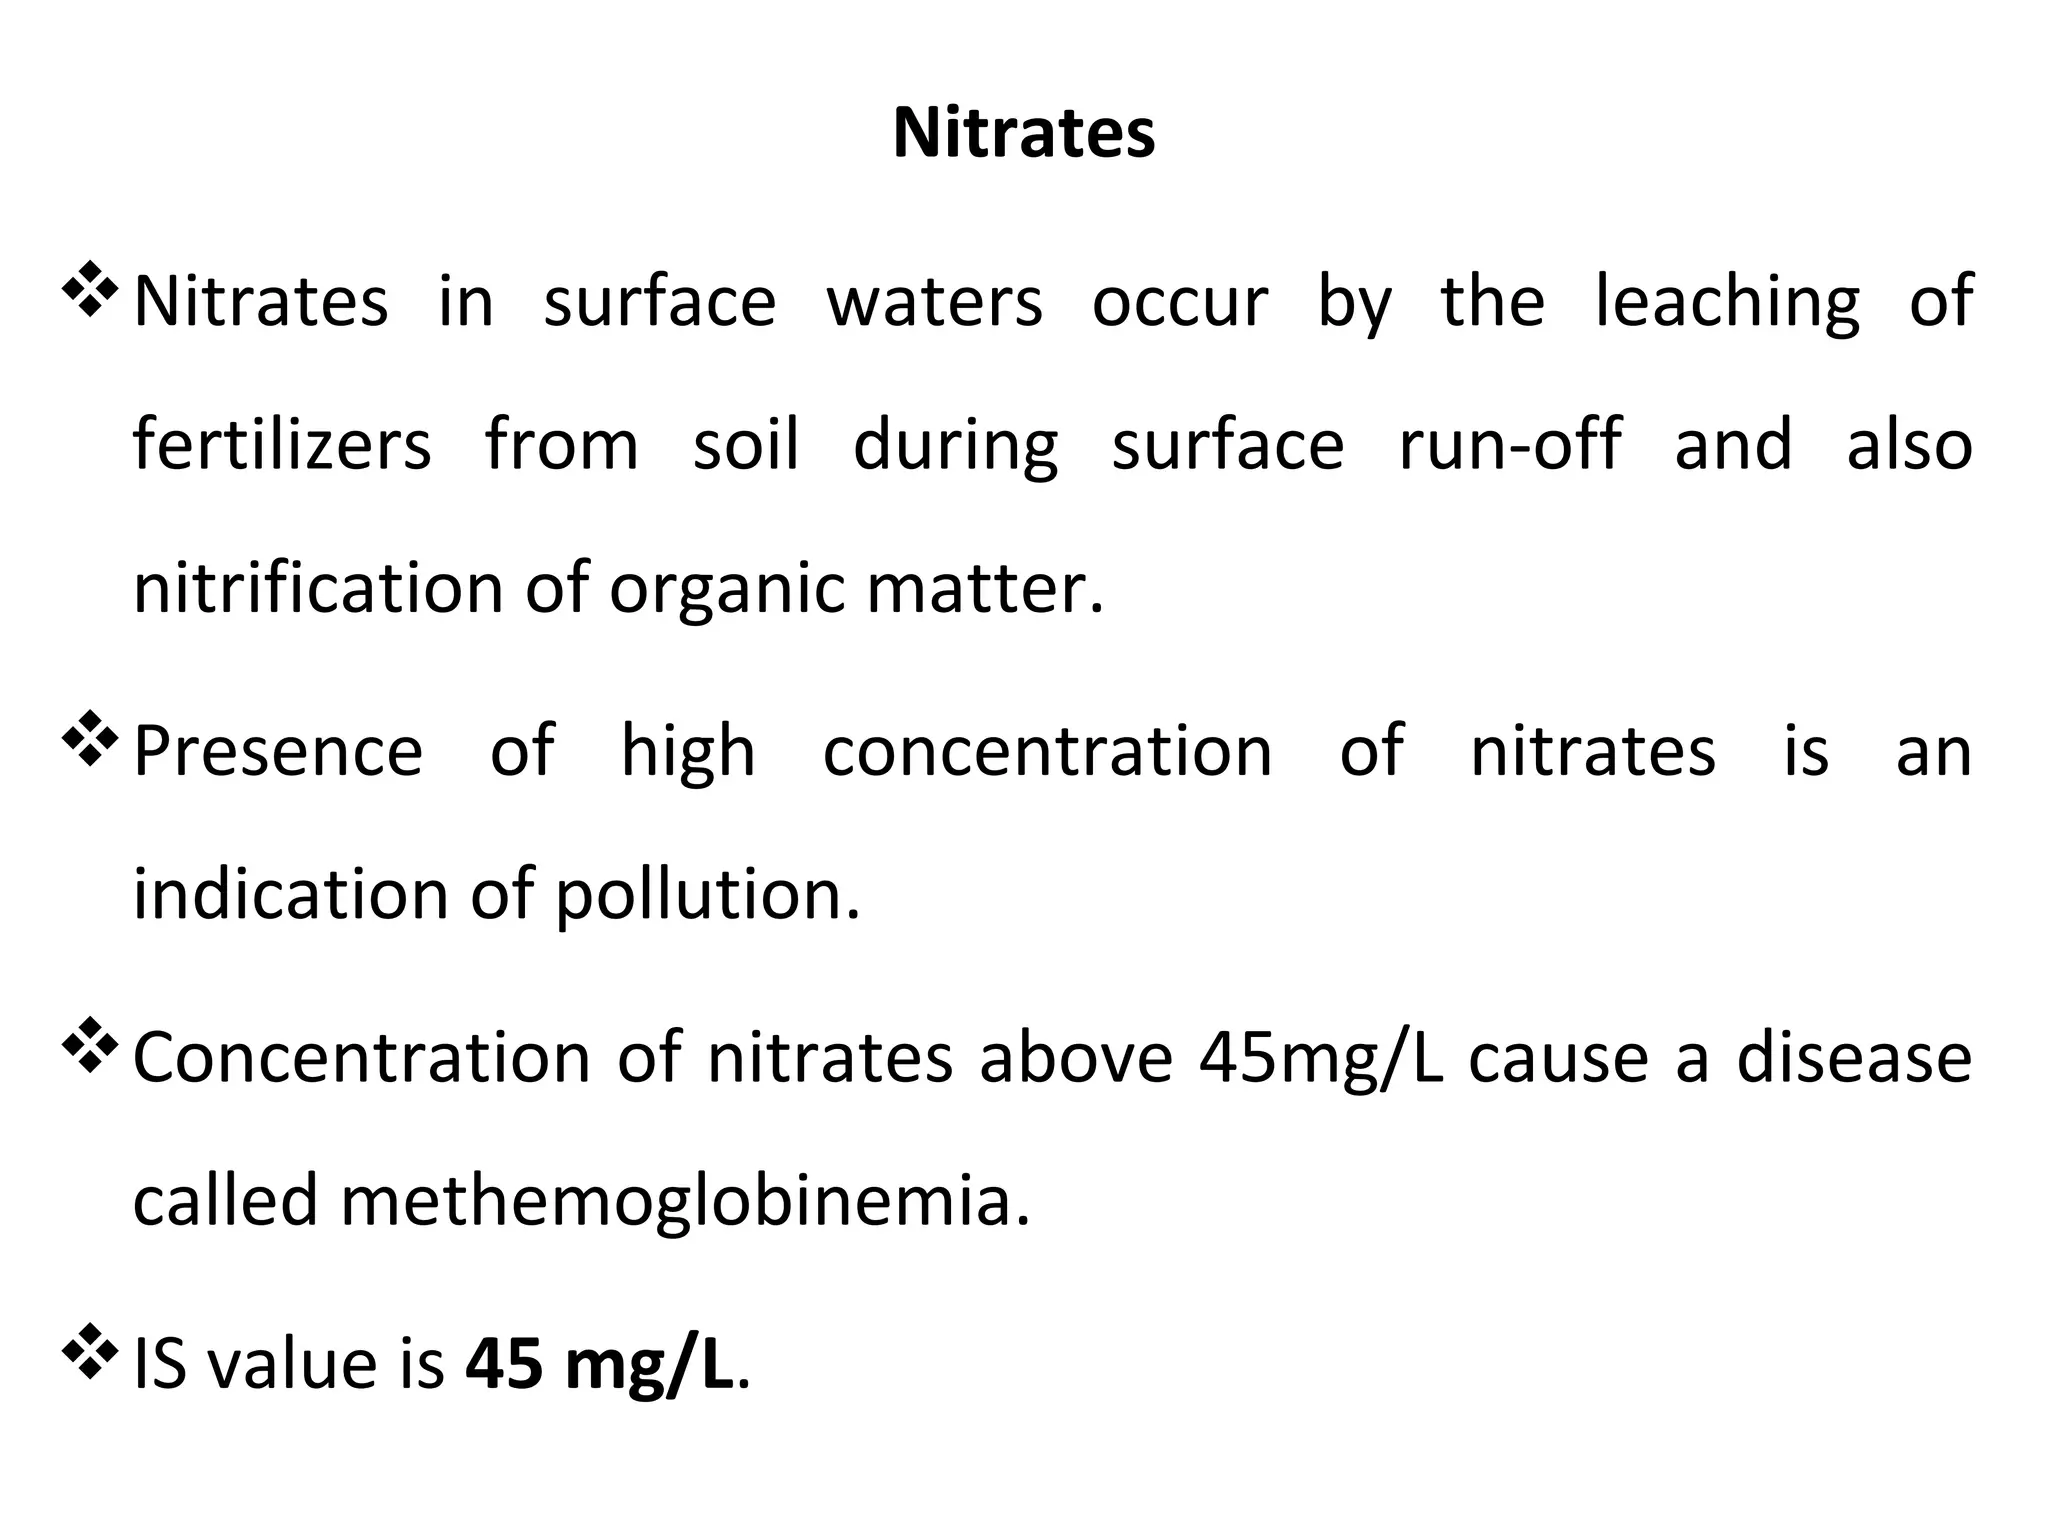
Nitrates
Nitrates in surfacewaters occur by the leaching of
fertilizers from soil during surface run-off and also
nitrification of organic matter.
Presence of high concentration of nitrates is an
indication of pollution.
Concentration of nitrates above 45mg/L cause a disease
called methemoglobinemia.
IS value is 45 mg/L.
35.
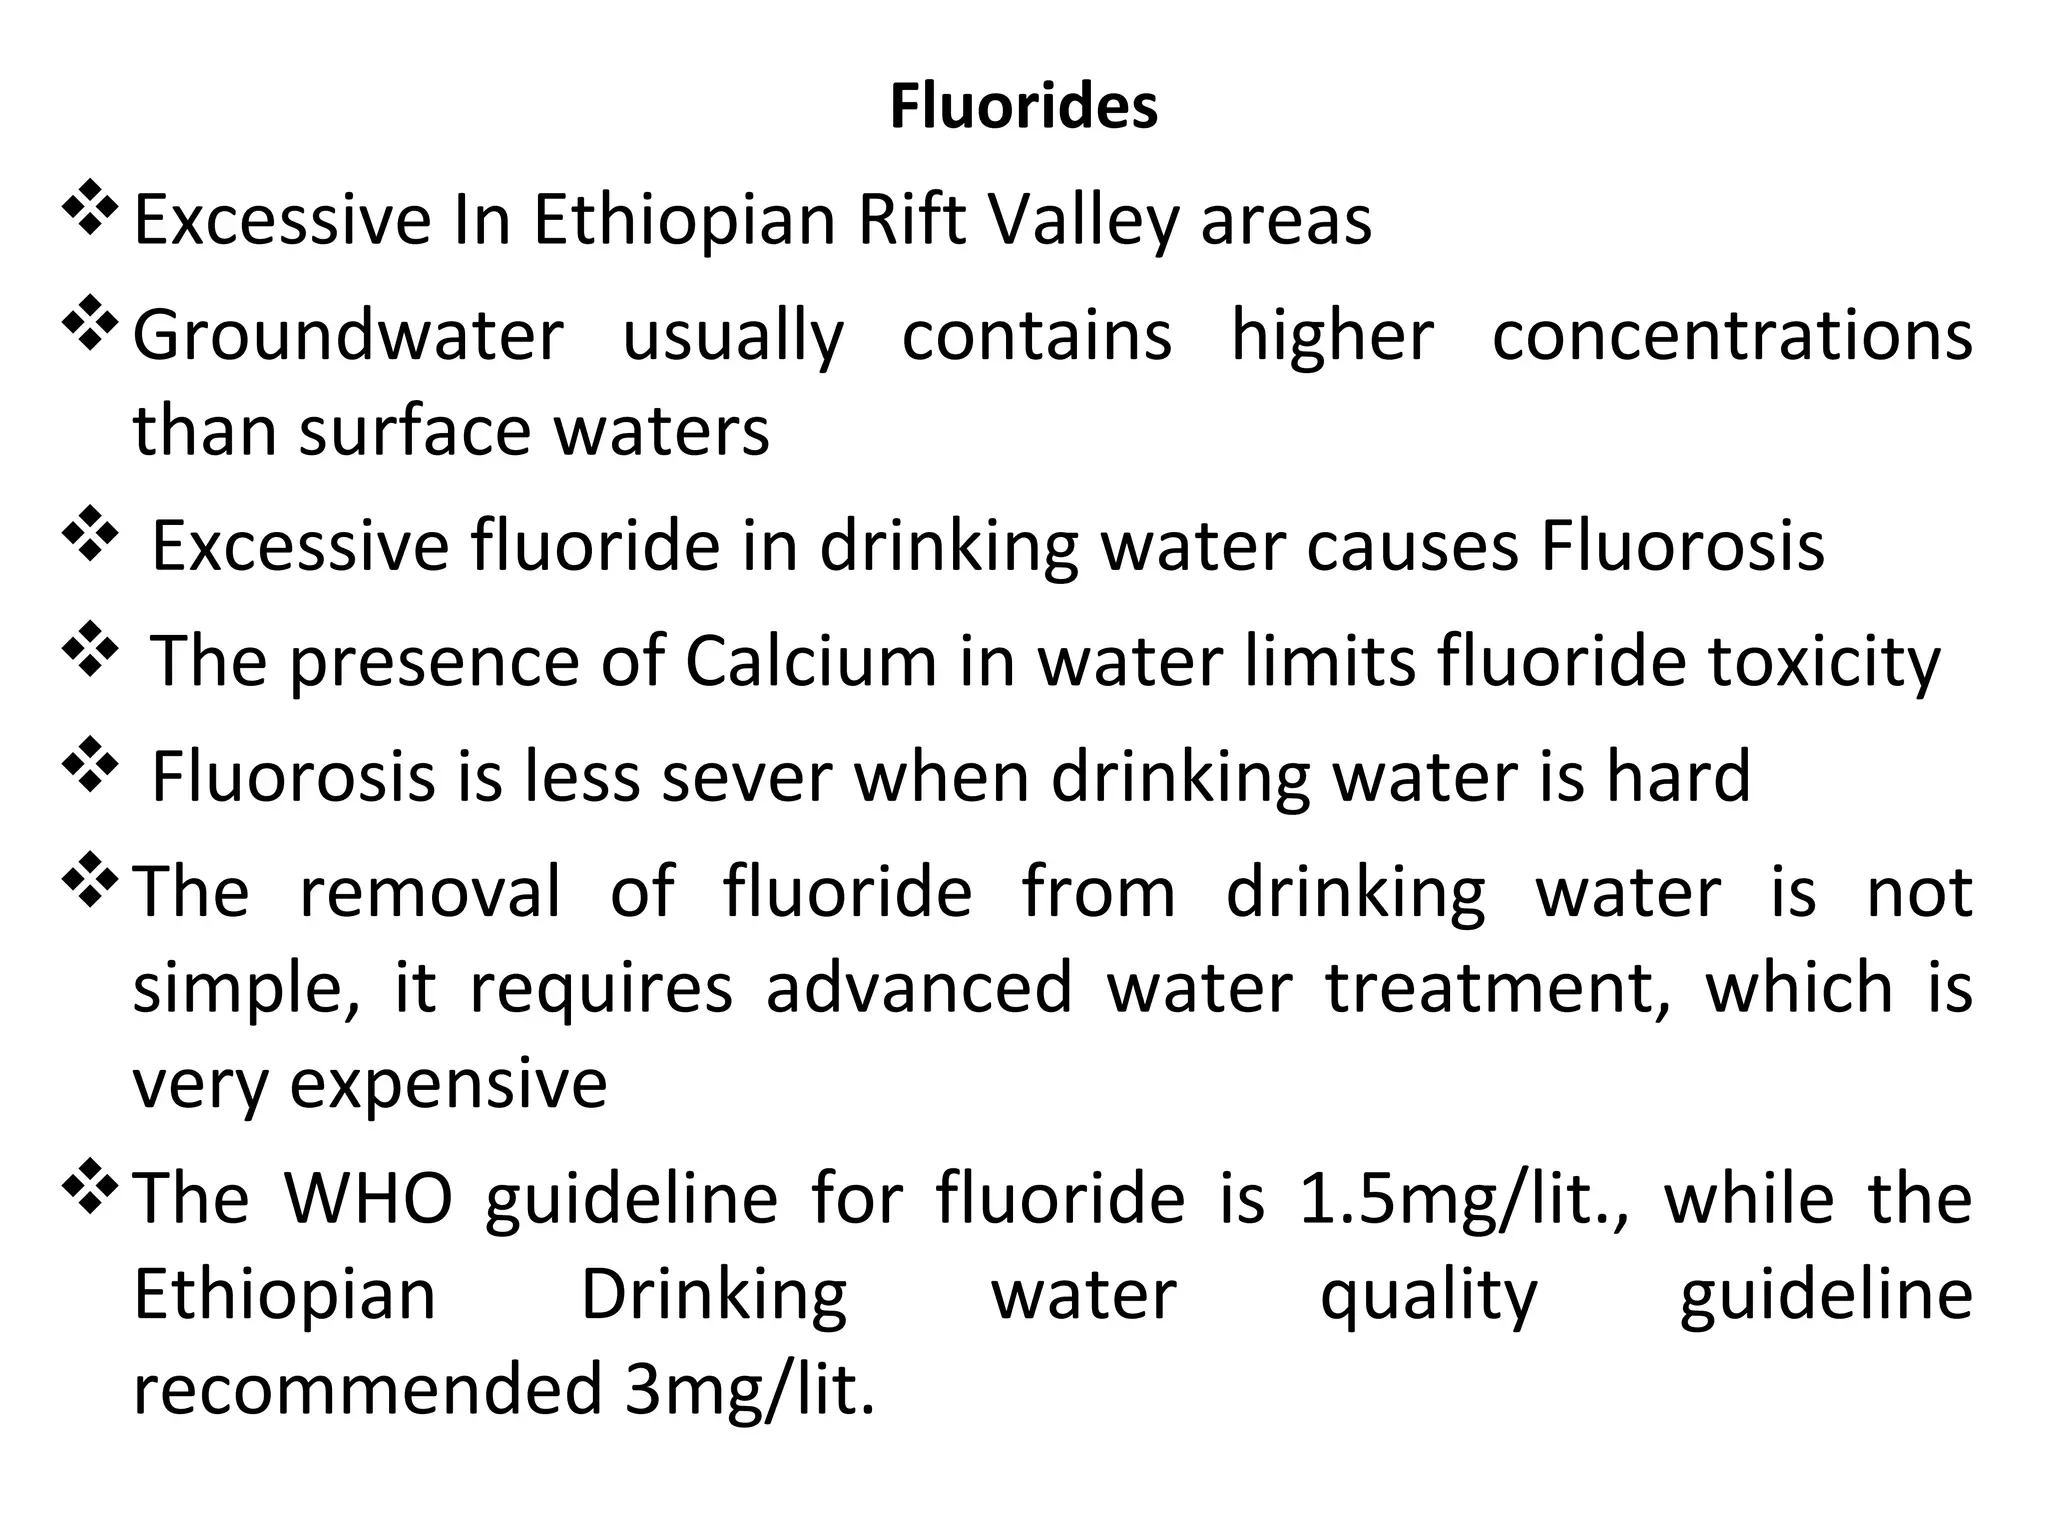
Fluorides
Excessive In EthiopianRift Valley areas
Groundwater usually contains higher concentrations
than surface waters
Excessive fluoride in drinking water causes Fluorosis
The presence of Calcium in water limits fluoride toxicity
Fluorosis is less sever when drinking water is hard
The removal of fluoride from drinking water is not
simple, it requires advanced water treatment, which is
very expensive
The WHO guideline for fluoride is 1.5mg/lit., while the
Ethiopian Drinking water quality guideline
recommended 3mg/lit.
36.
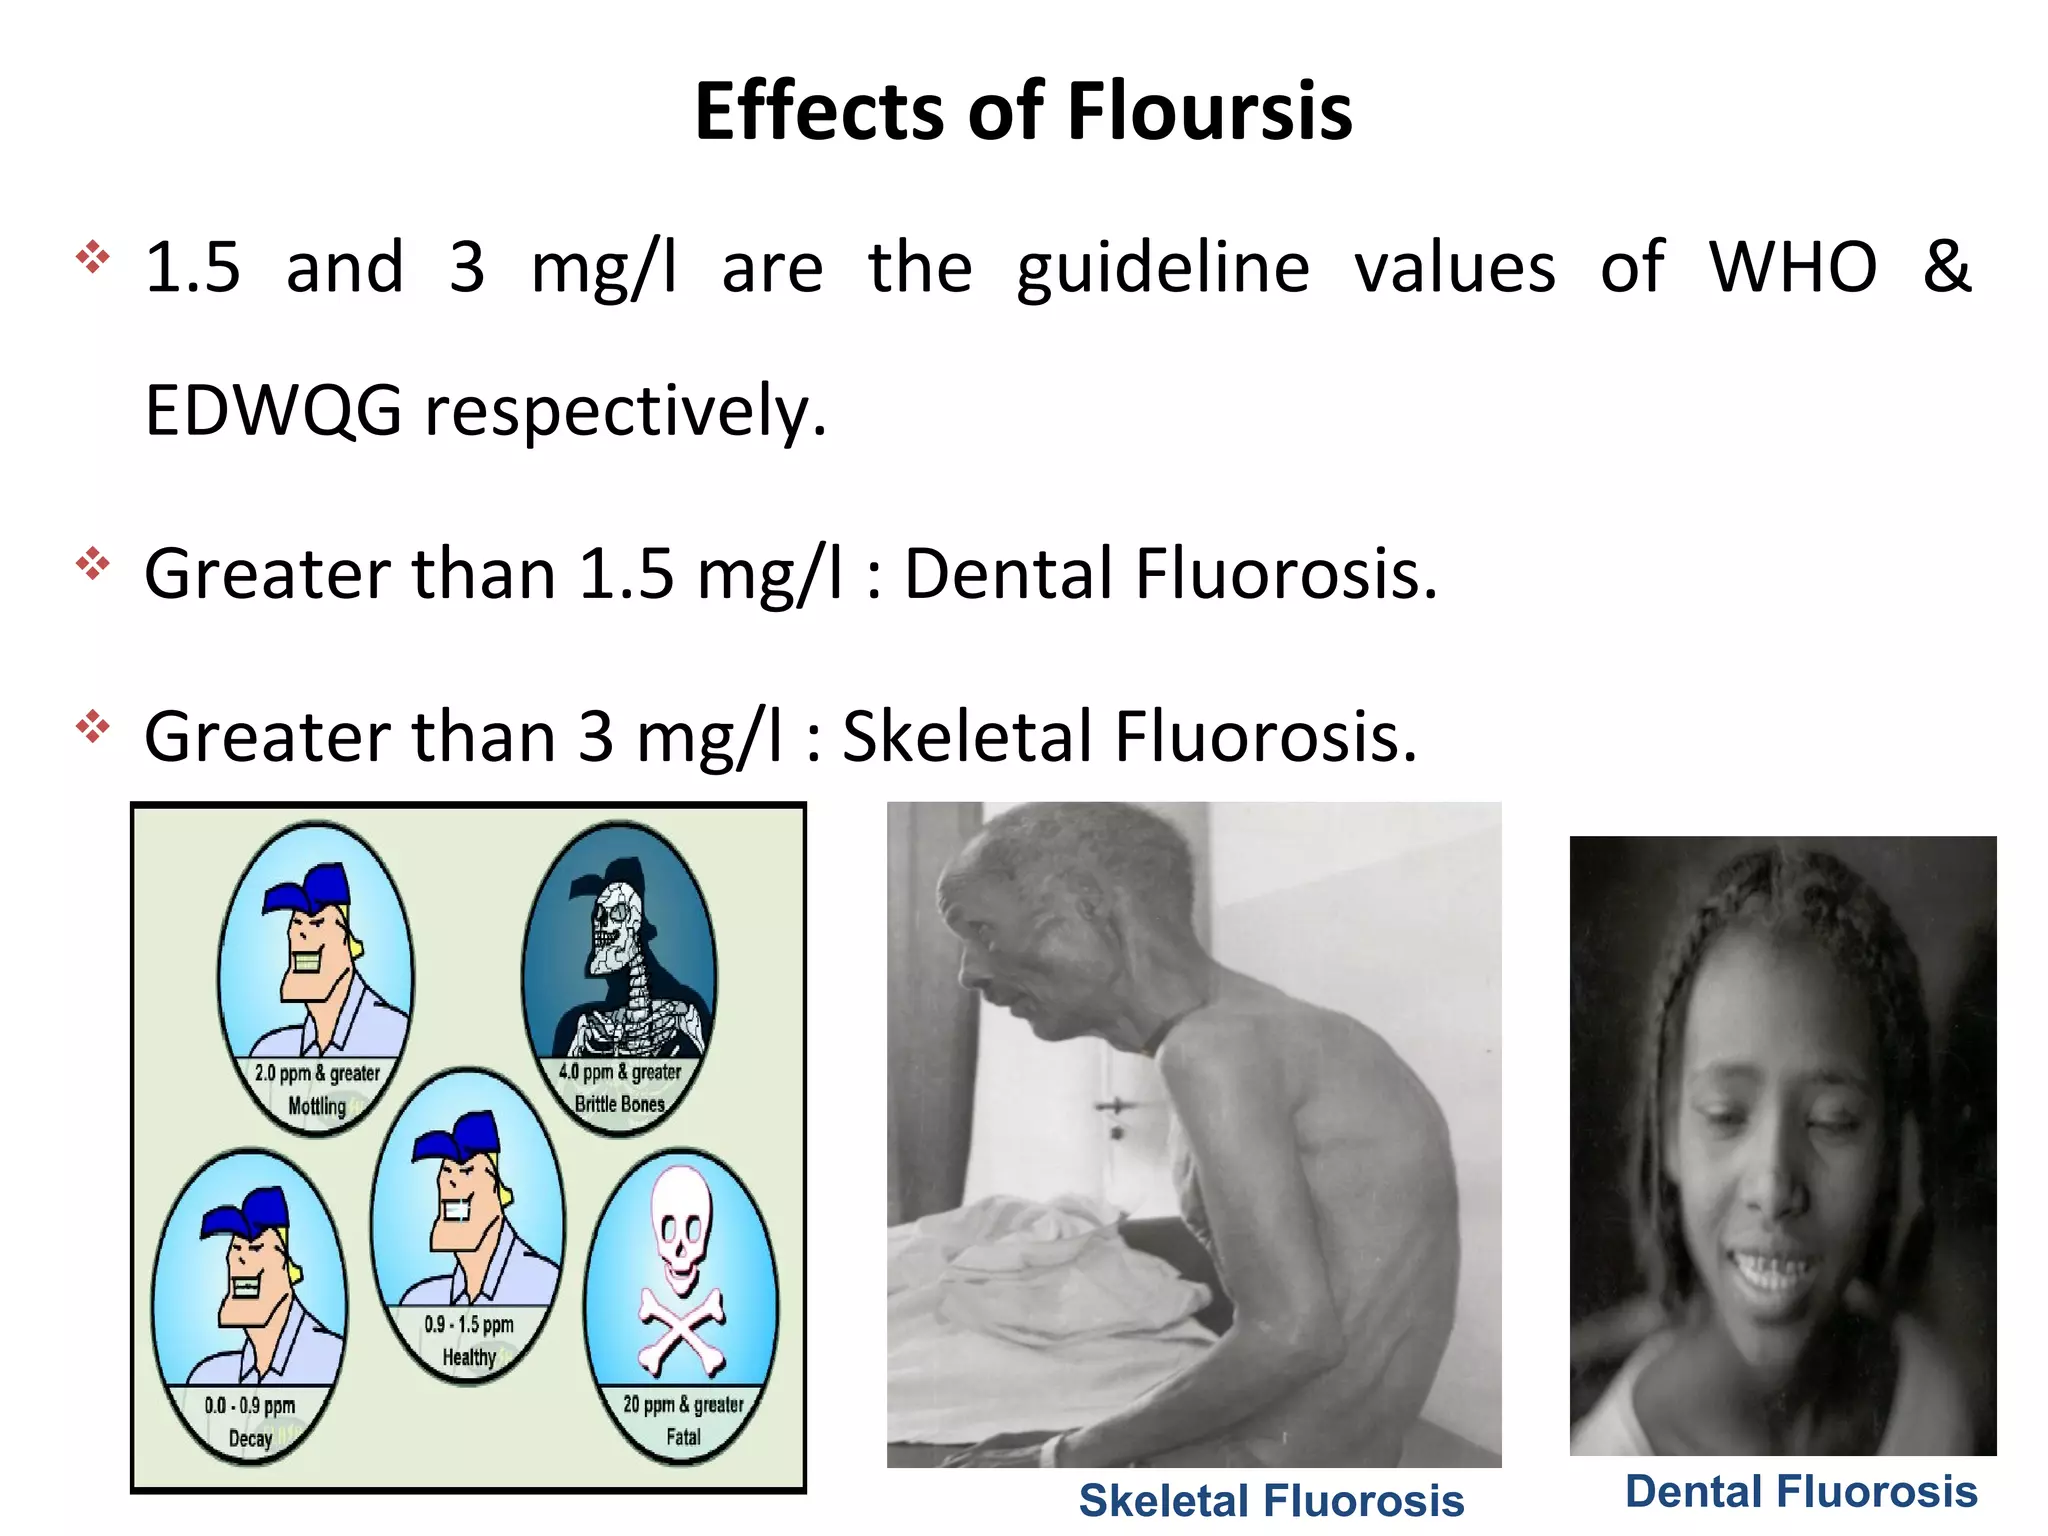
Effects of Floursis
SkeletalFluorosis Dental Fluorosis
1.5 and 3 mg/l are the guideline values of WHO &
EDWQG respectively.
Greater than 1.5 mg/l : Dental Fluorosis.
Greater than 3 mg/l : Skeletal Fluorosis.
37.
Metals
All metals aresoluble to some extent in water
Source:
dissolution from natural deposits and discharges of domestic,
industrial, or agricultural wastewaters.
Nontoxic Metals: toxic only at high concentration;
sodium, iron, magnesium, aluminum, copper and zinc.
Toxic metals: toxic at very low concentration
arsenic, barium, cadmium, lead, mercury, and silver
38.
1.2.3. Biological Characteristics
BiologicalCharacteristics
Presence or absence of living organisms in water most
useful indicators of its quality.
Pathogens: organisms capable of infecting, or of
transmitting diseases to humans.
not native to aquatic systems and usually require an
animal host for growth and reproduction.
Includes: bacteria, viruses, protozoa, and helminthes
(parasitic worms).
39.
Pathogen Indicators:
• Bacterialexamination of water is very important, since it
indicates the degree of pollution.
• Water polluted by sewage contain one or more species of
disease producing pathogenic bacteria.
• Pathogenic organisms cause water borne diseases, and many
non pathogenic bacteria such as E.Coli, a member of coliform
group, also live in the intestinal tract of human beings.
• Coliform itself is not a harmful group but it has more
resistance to adverse condition than any other group.
• So, if it is ensured to minimize the number of coliforms, the
harmful species will be very less.
• So, coliform group serves as indicator of contamination of
water with sewage and presence of pathogens.
40.
Reason for selectingcoliforms:
normally inhabit the intestinal tracts of humans and
other mammals their presence indicates fecal
contamination of the water.
the number of coliform organisms excreted in the feces
outnumbers the disease-producing organism by several
orders of magnitude easier to culture than disease-
producing organisms.
survive in natural waters for relatively long periods of
time without reproduction their presence assures fecal
contamination/ their absence means the water is safe.
coliform group of organisms is relatively easy to culture
without expensive equipments.
41.
• The methodsused to estimate the bacterial quality of
water are:
– Standard Plate Count Test
– Membrane Filter Technique
42.
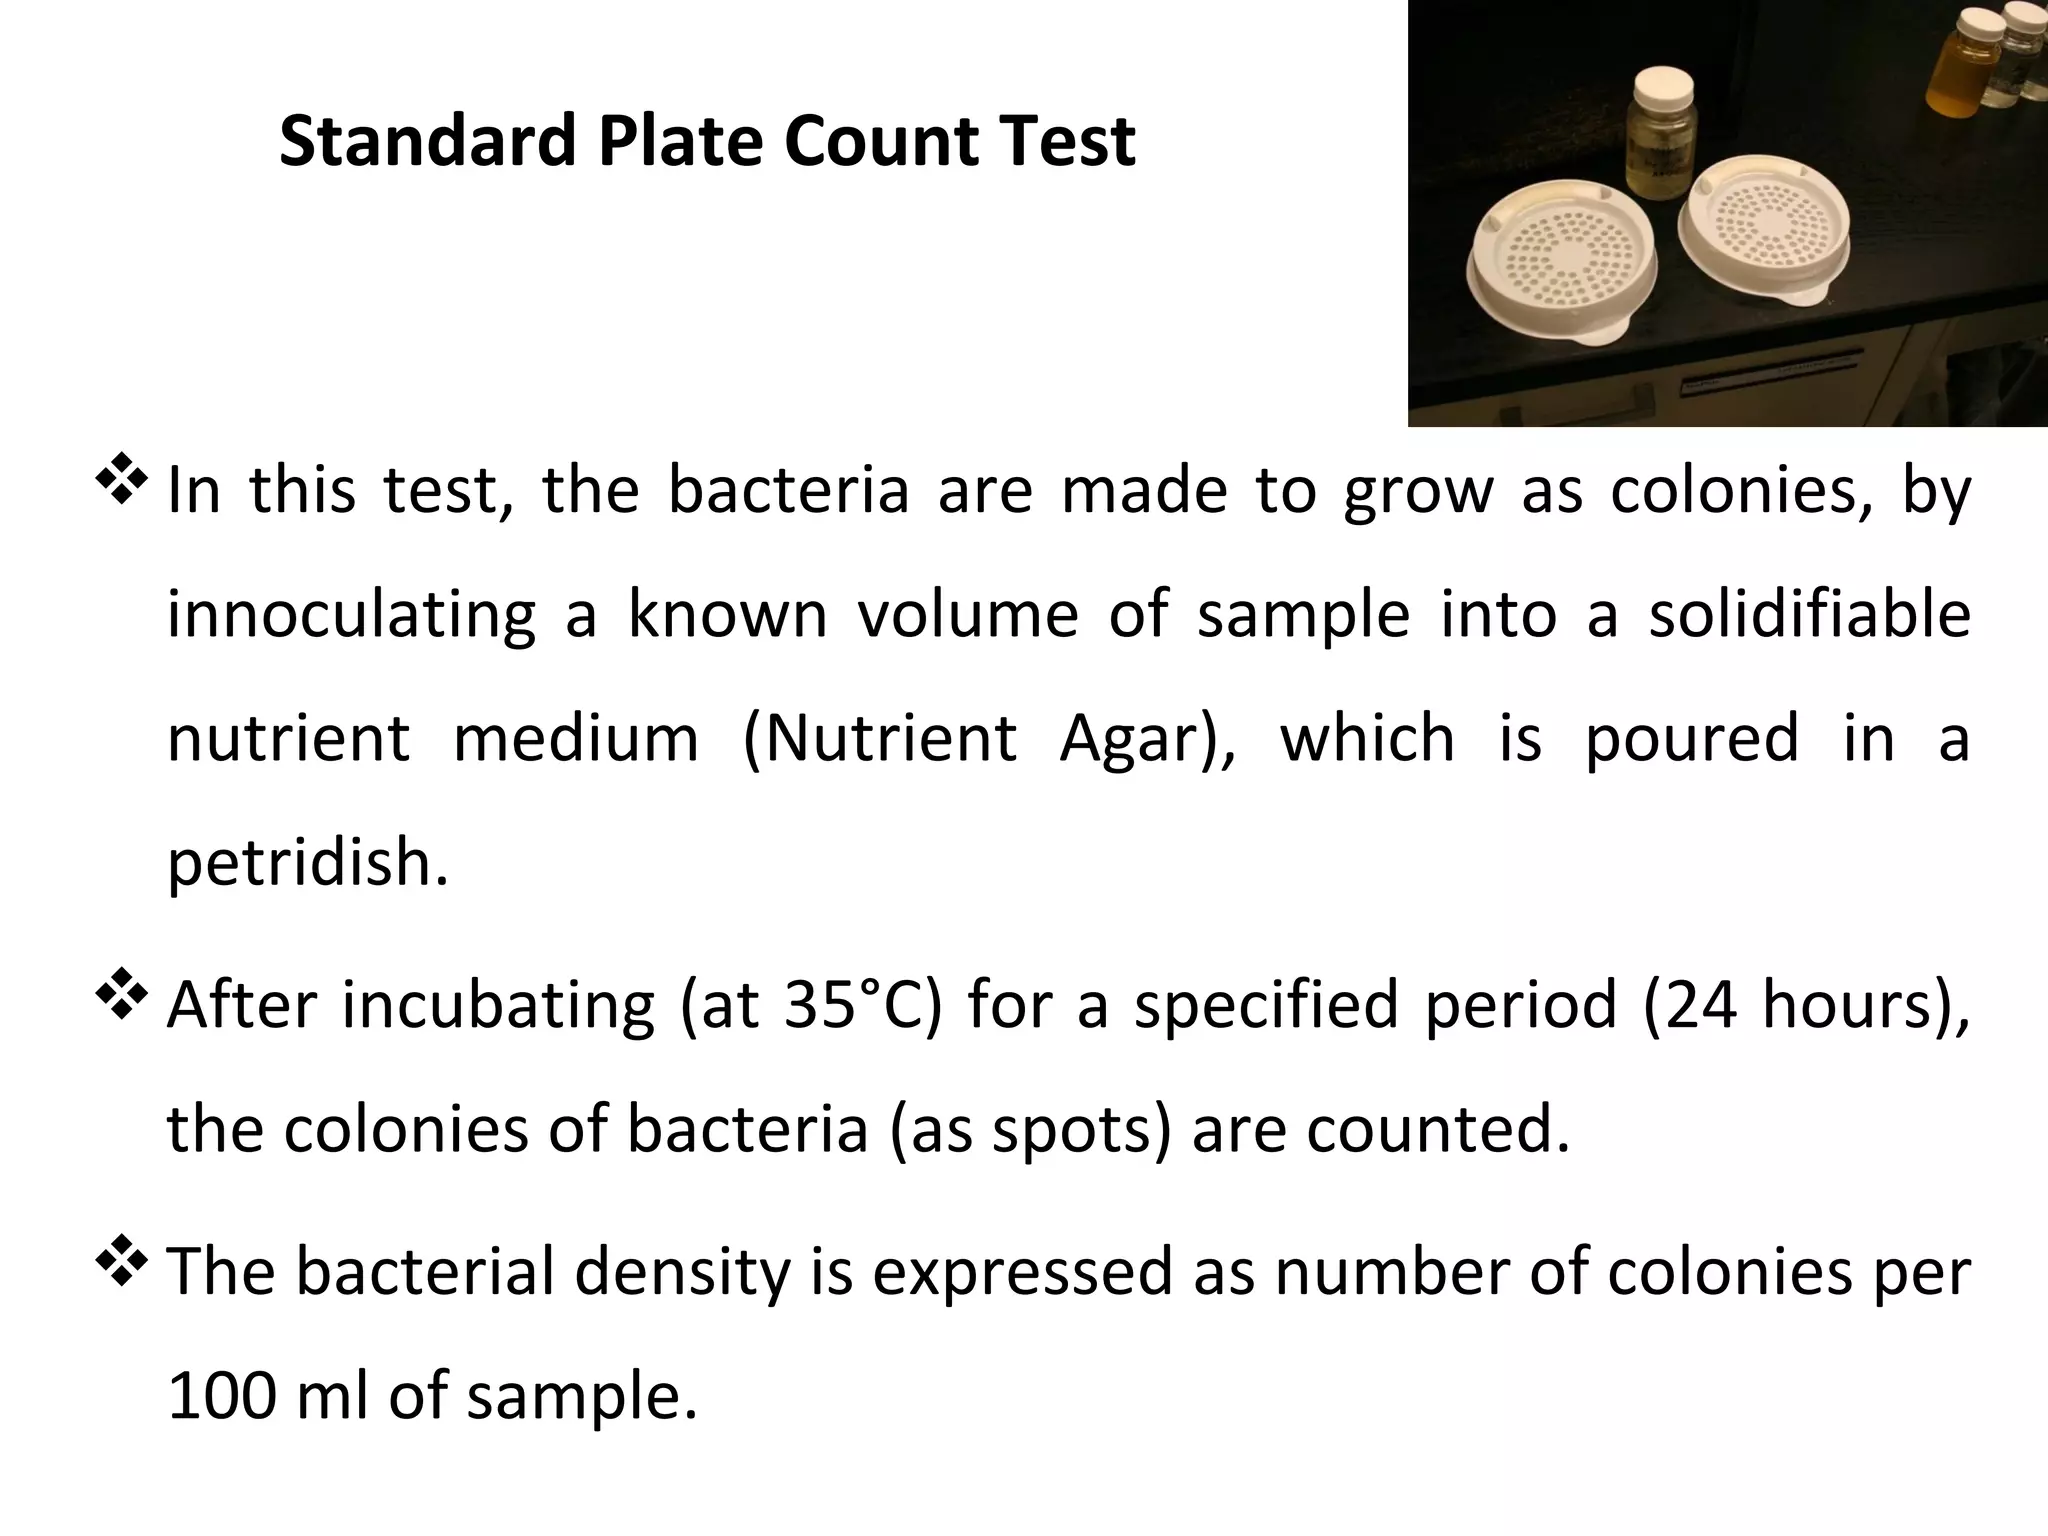
Standard Plate CountTest
In this test, the bacteria are made to grow as colonies, by
innoculating a known volume of sample into a solidifiable
nutrient medium (Nutrient Agar), which is poured in a
petridish.
After incubating (at 35°C) for a specified period (24 hours),
the colonies of bacteria (as spots) are counted.
The bacterial density is expressed as number of colonies per
100 ml of sample.
43.
Membrane Filter Technique
Itis a direct method of counting coliform bacteria.
In this test a known volume of water sample is filtered
through a membrane with opening less than 0.5
microns.
The bacteria present in the sample will be retained upon
the filter paper. The filter paper is put in contact of a
suitable nutrient medium and kept in an incubator for 24
hours at 35°C.
44.
The bacteria willgrow upon the nutrient
medium and visible colonies are counted.
Each colony representing one coliform (one
bacterium of the original sample) is counted.
The bacterial count is expressed as number of
colonies per 100 ml of sample.
45.
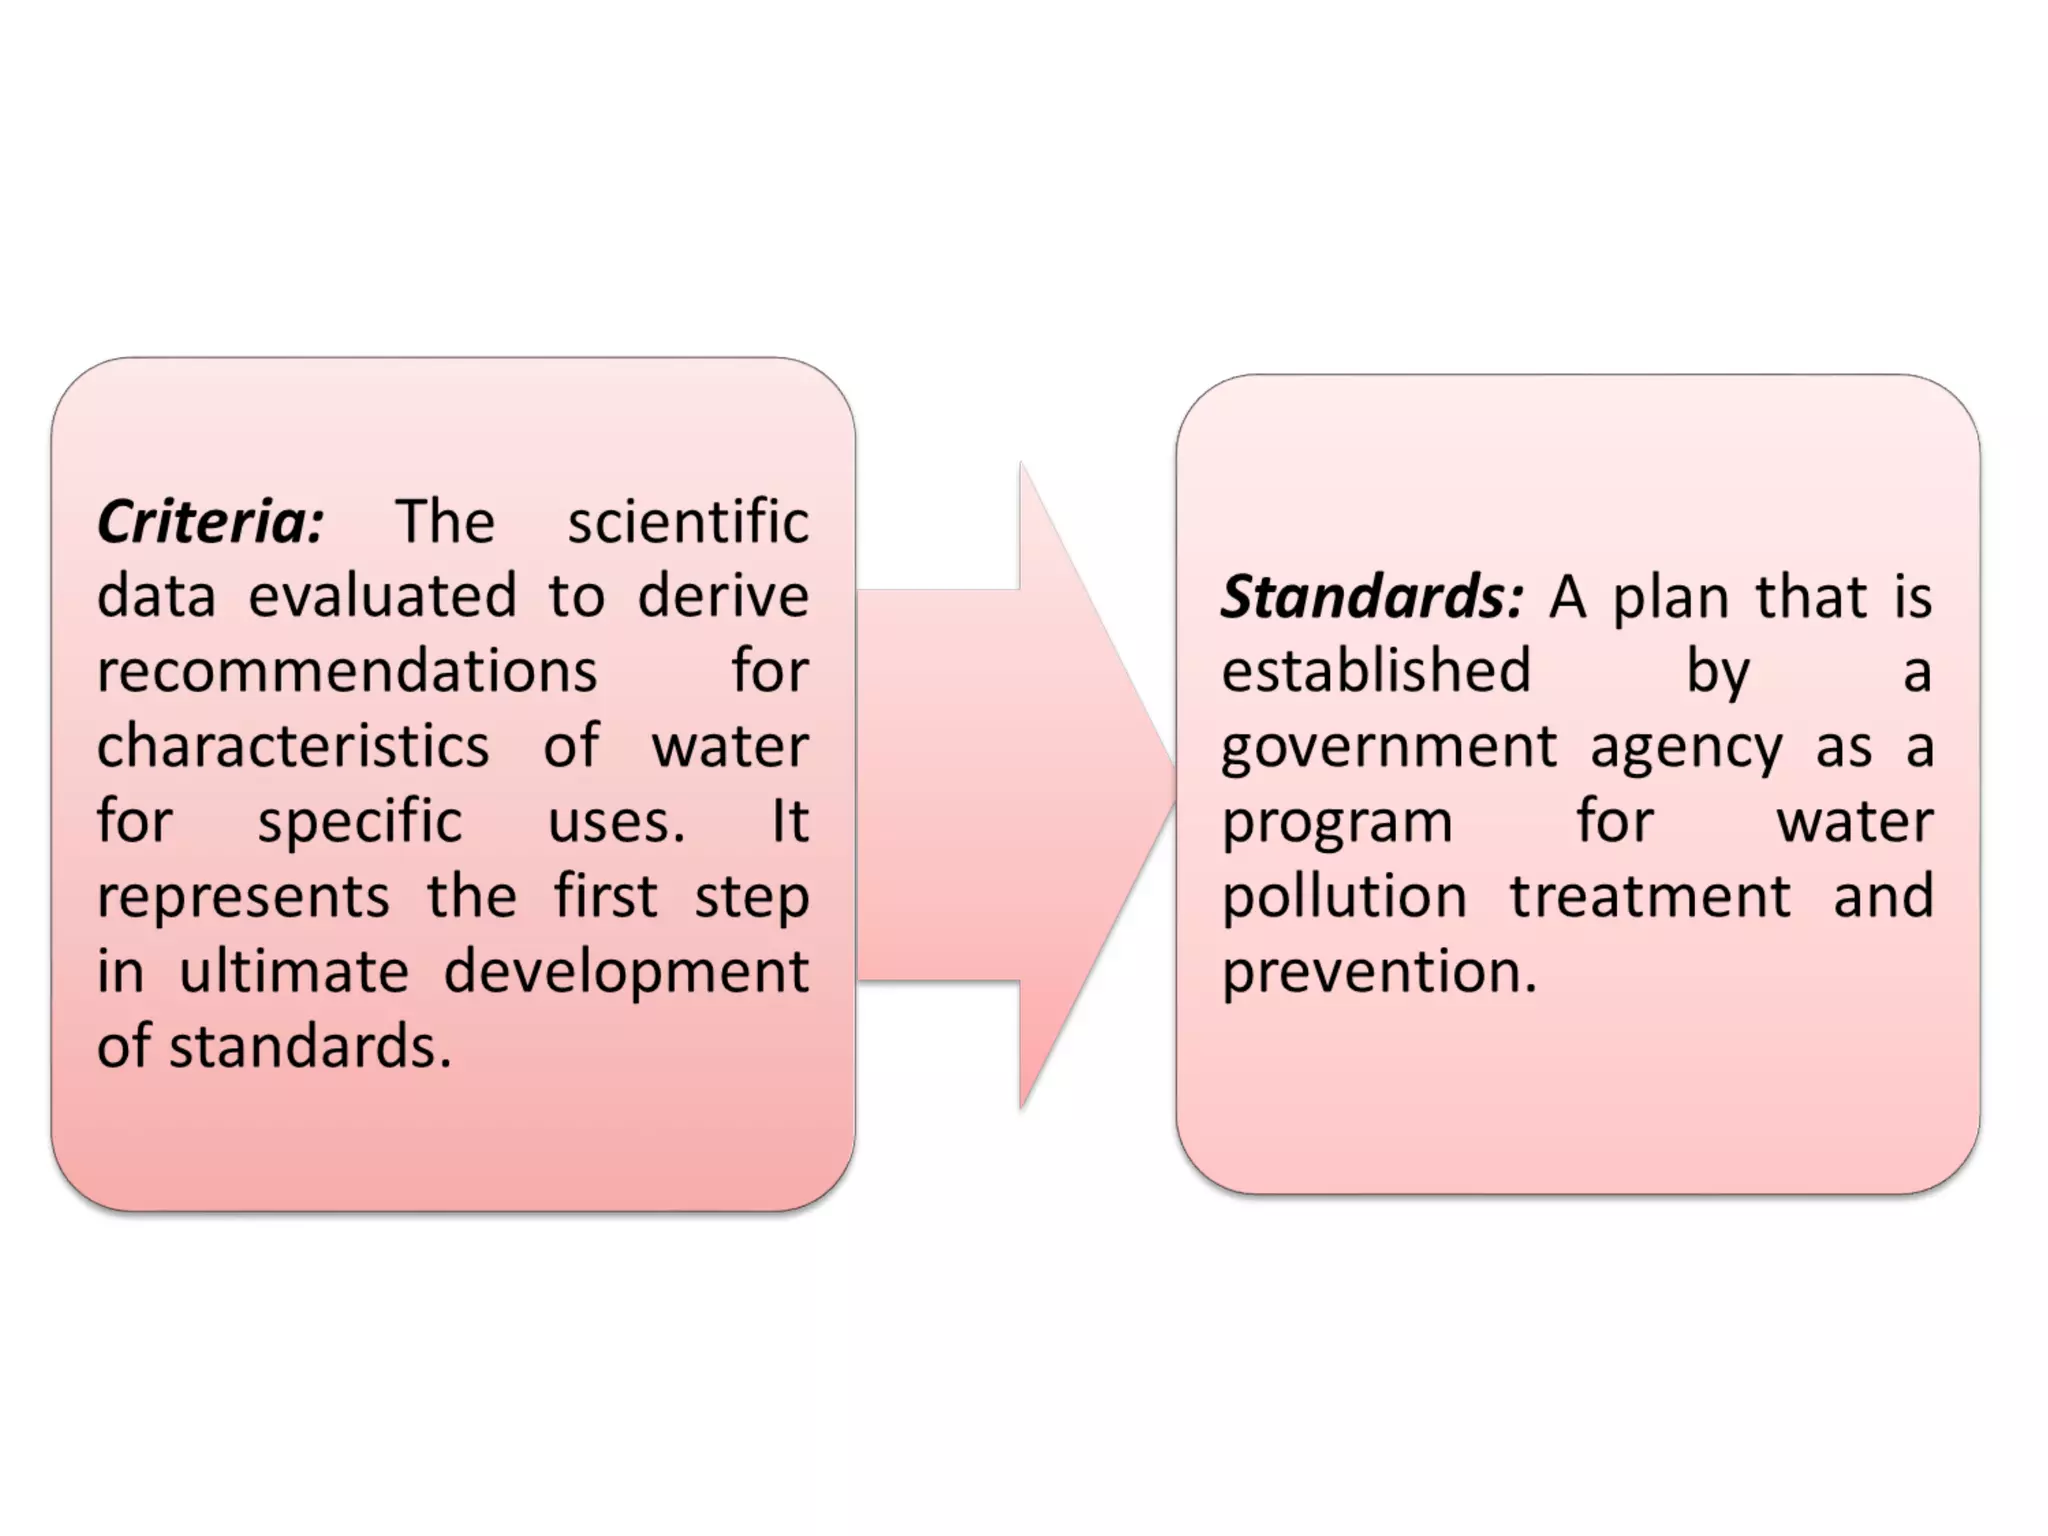
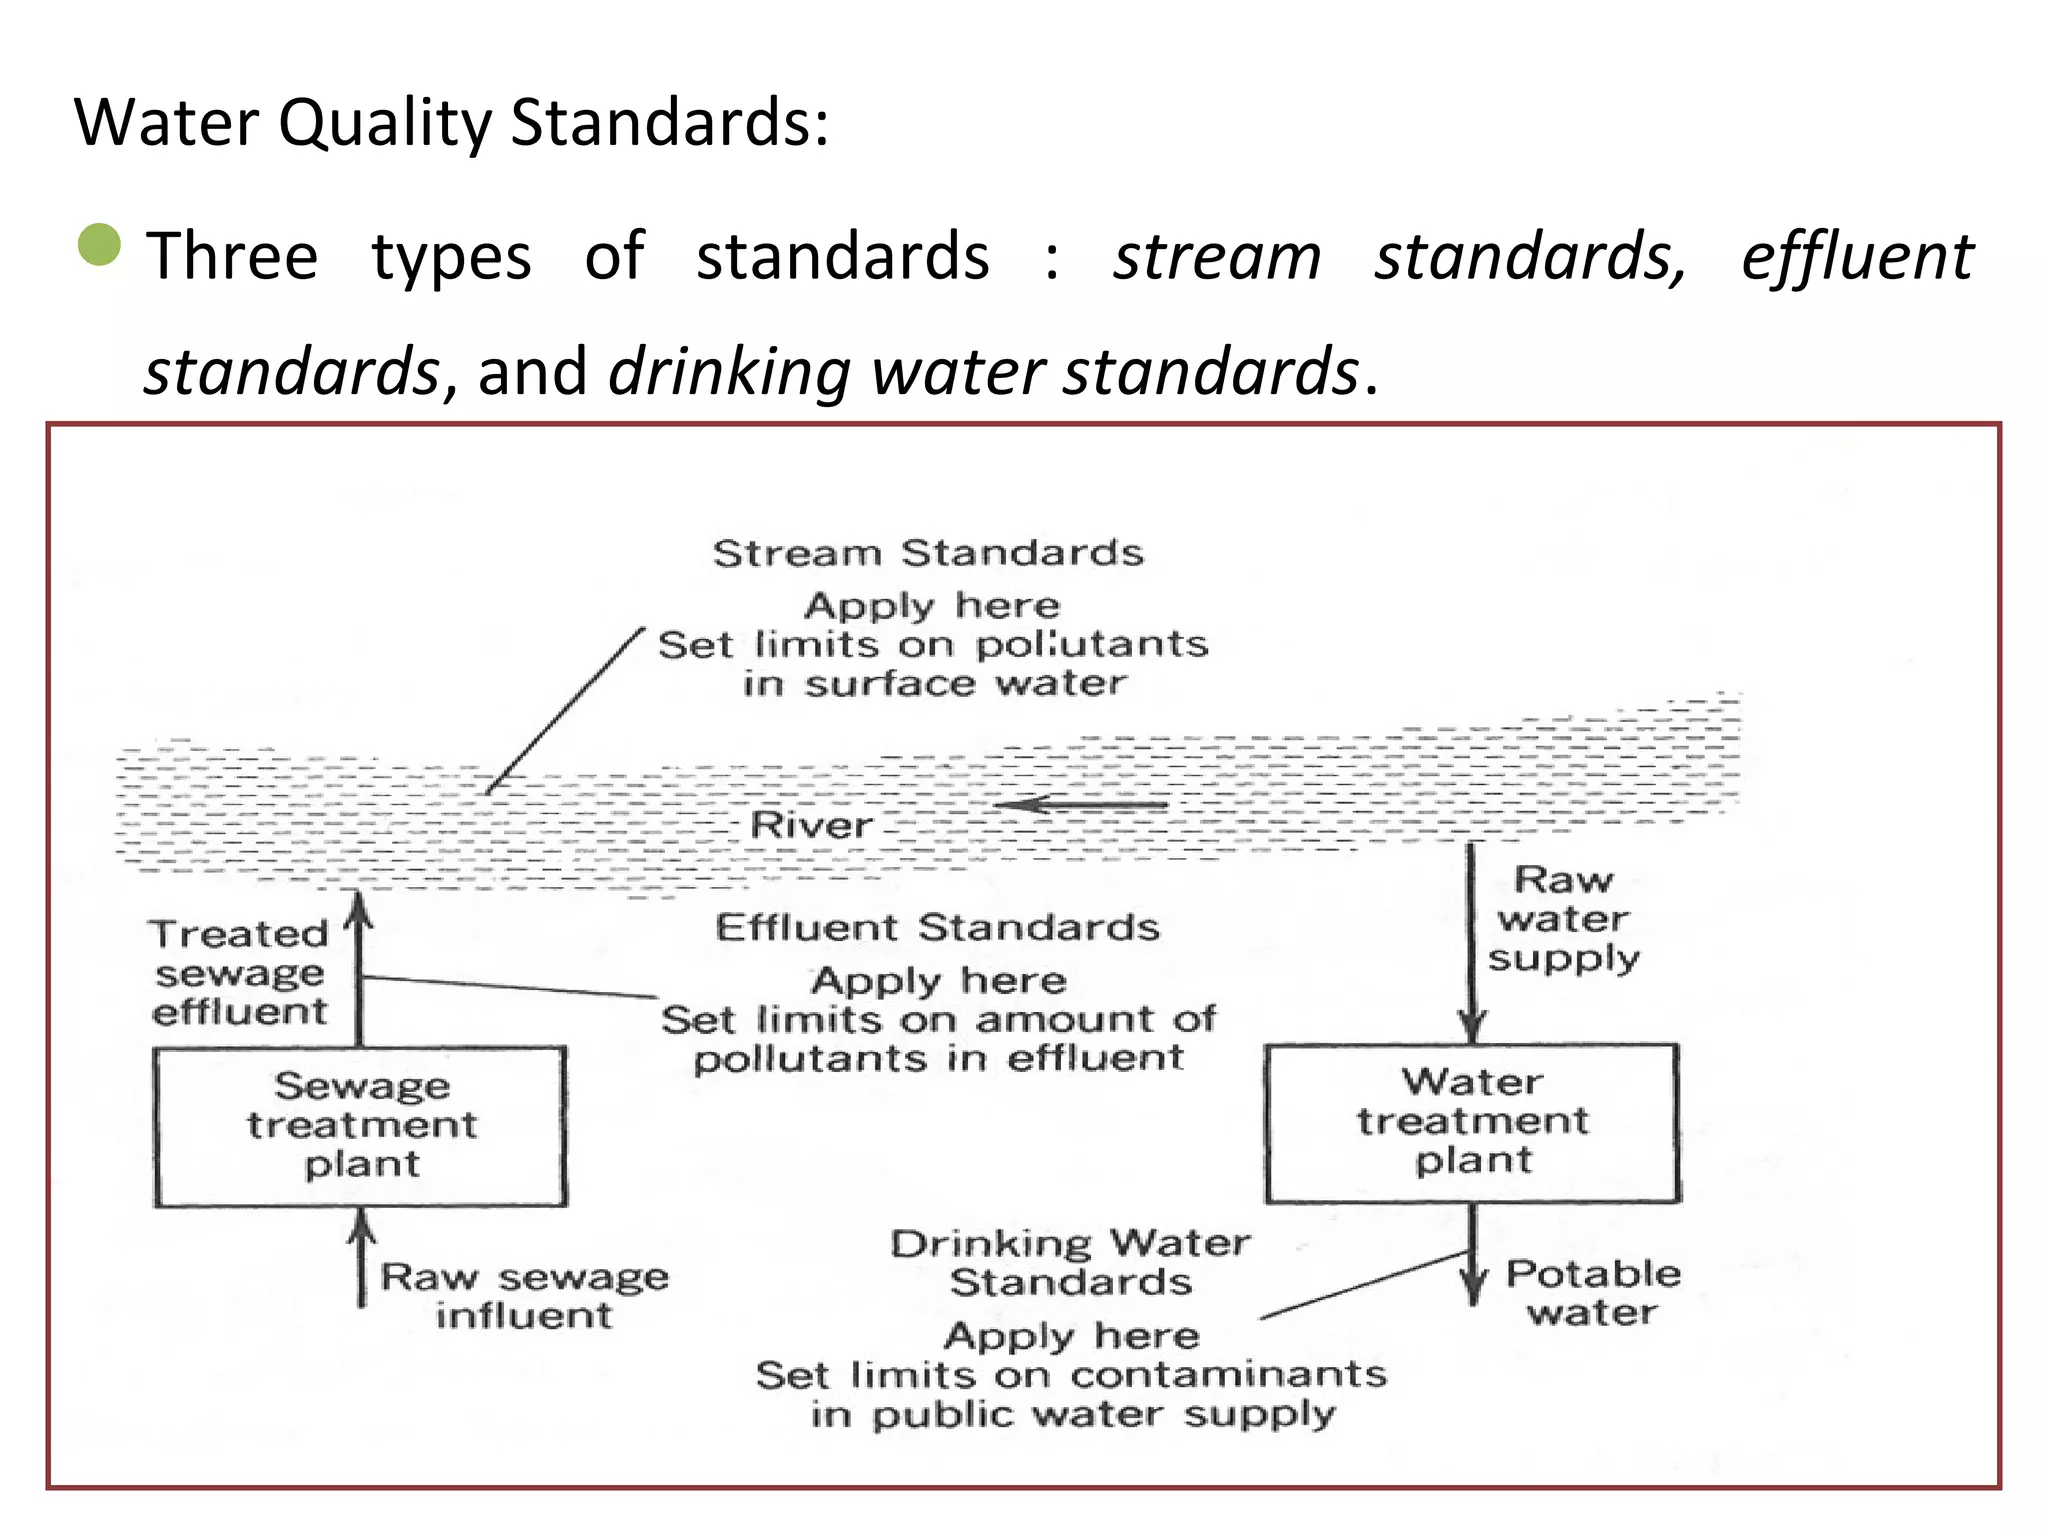
1.3. Water QualityStandards
Water Quality Standards:
limits on the amount of impurities in water for the
intended use
legally enforced or recommended
include rules and regulations for sampling, testing
and reporting procedures.
47.
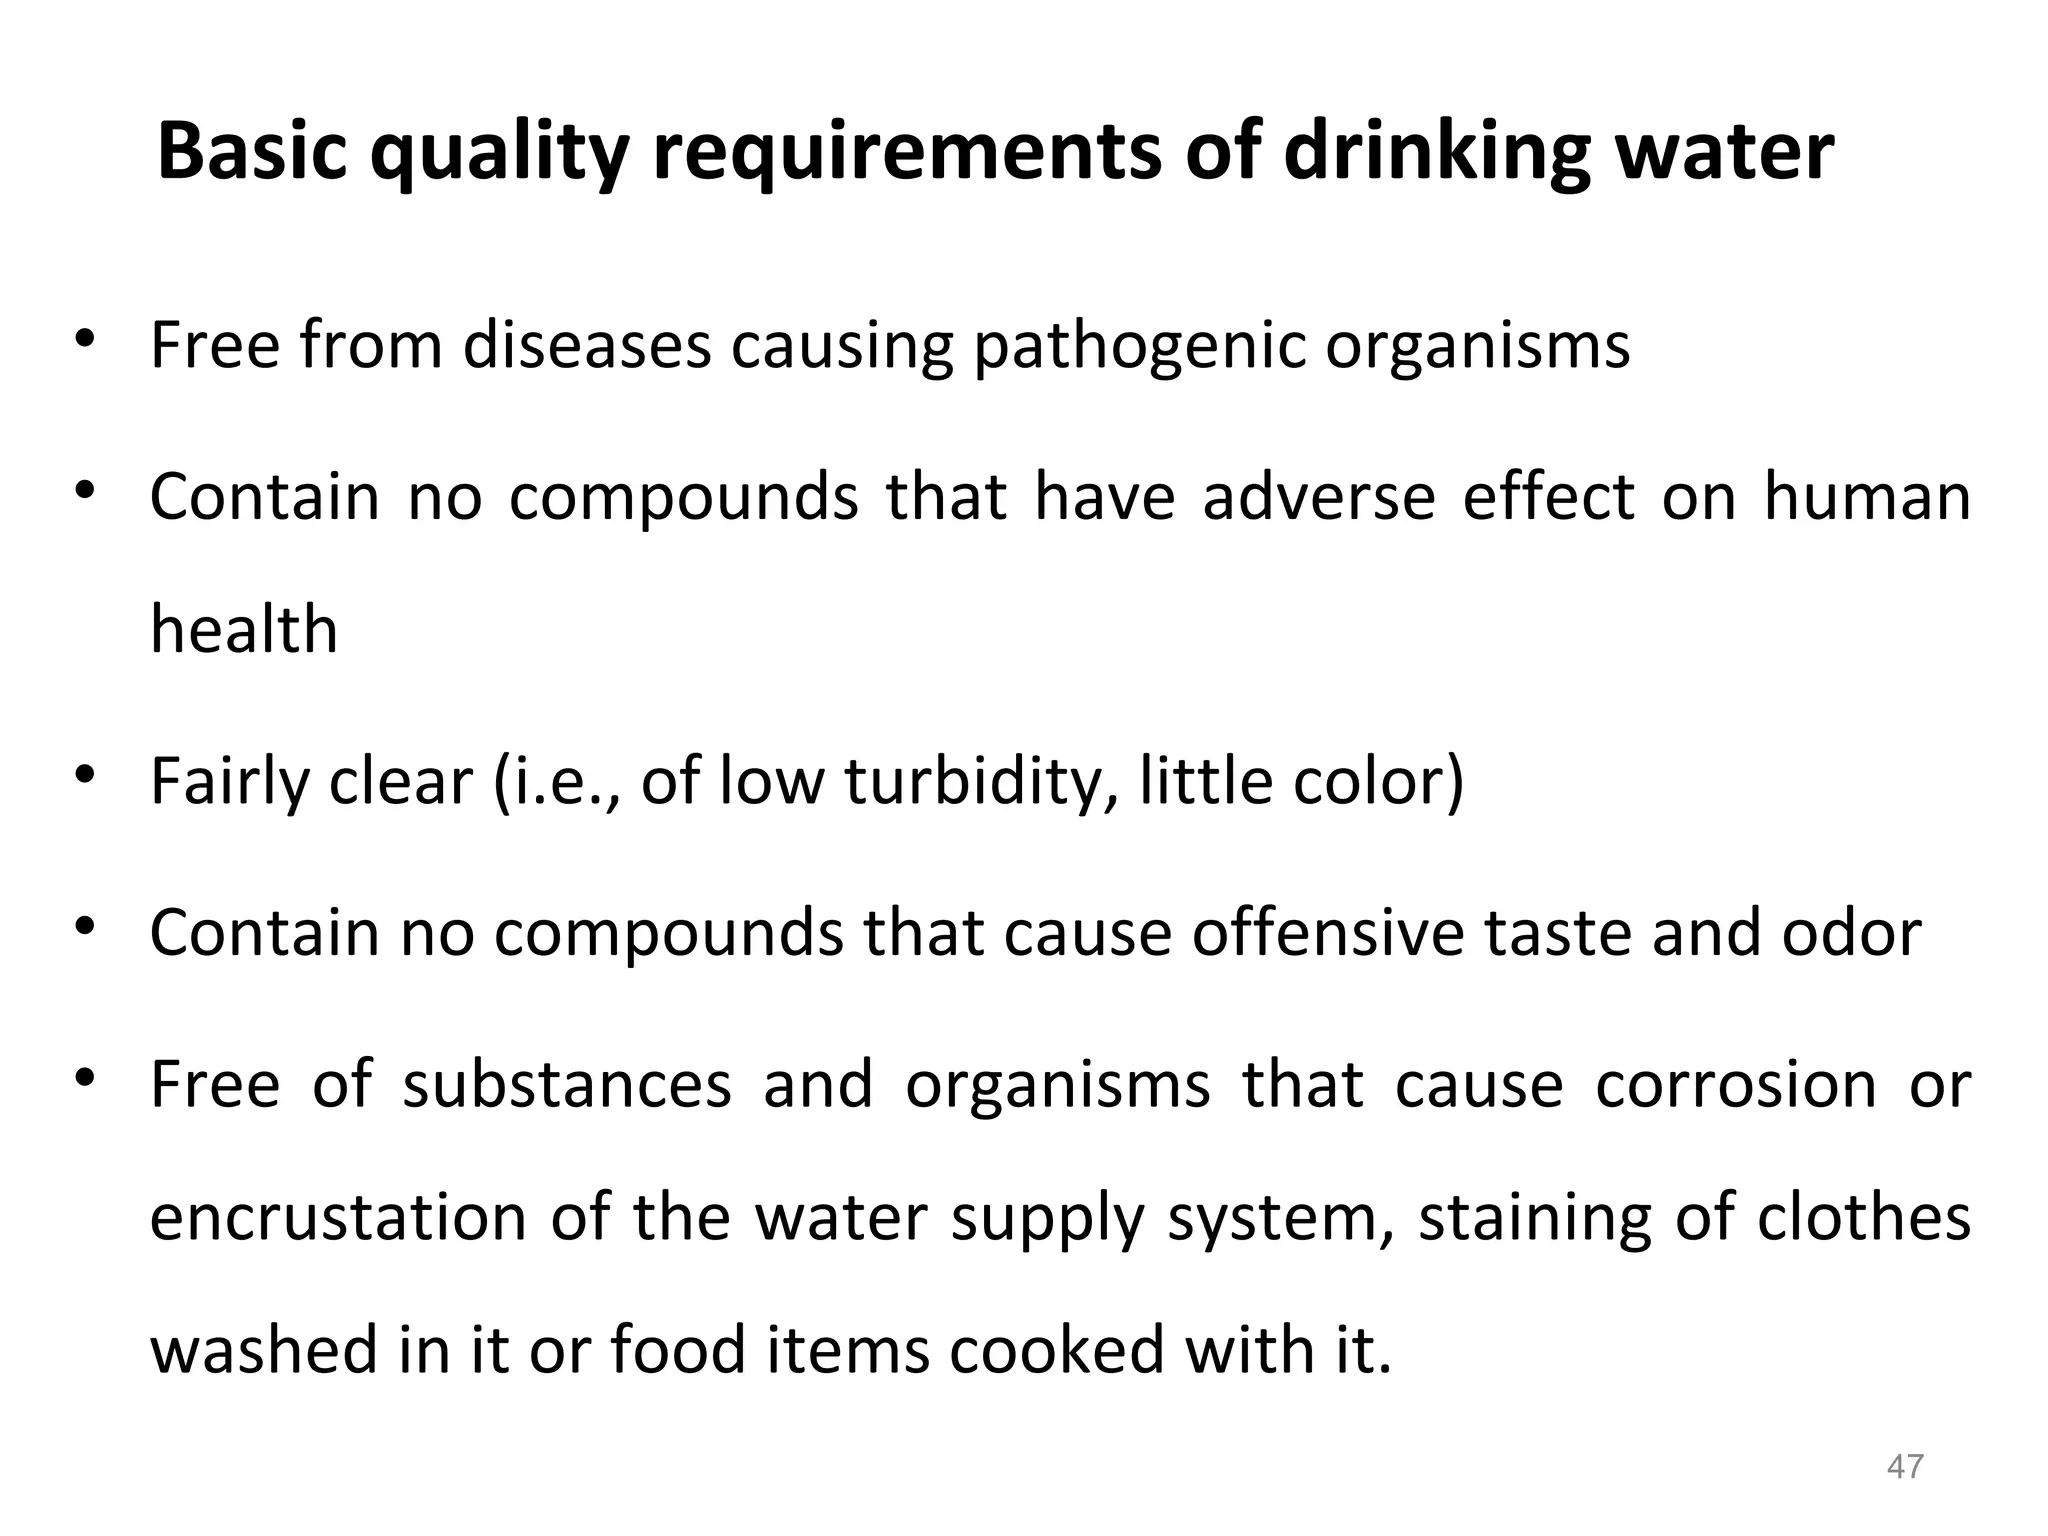
Basic quality requirementsof drinking water
• Free from diseases causing pathogenic organisms
• Contain no compounds that have adverse effect on human
health
• Fairly clear (i.e., of low turbidity, little color)
• Contain no compounds that cause offensive taste and odor
• Free of substances and organisms that cause corrosion or
encrustation of the water supply system, staining of clothes
washed in it or food items cooked with it.
47
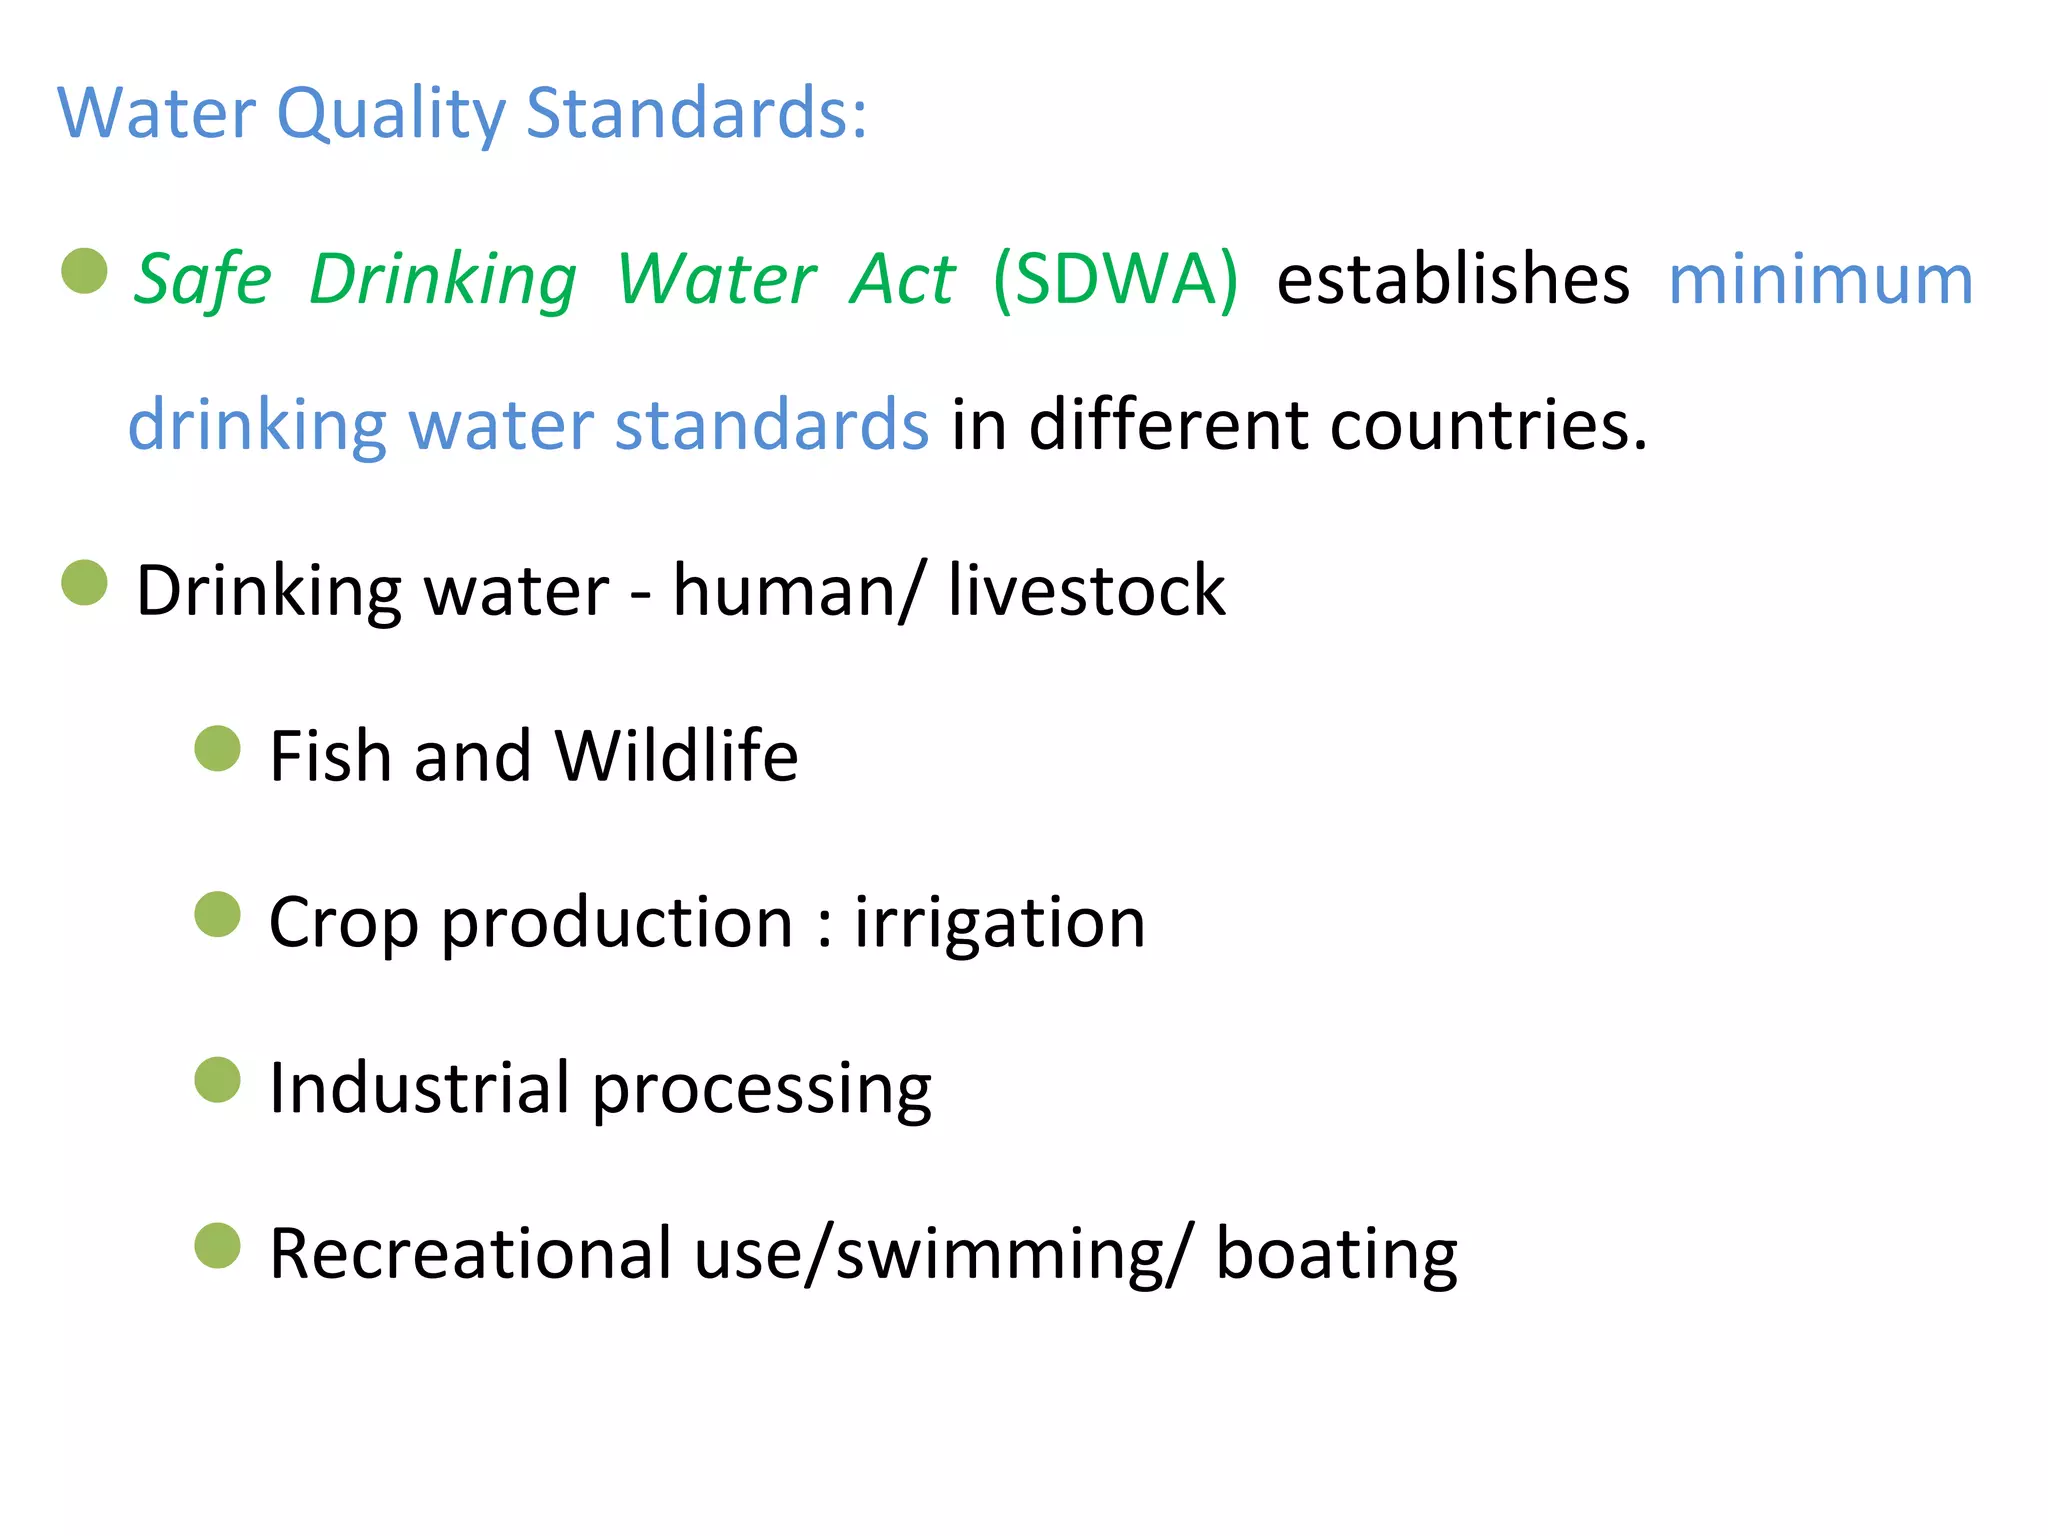
Water Quality Standards:
SafeDrinking Water Act (SDWA) establishes minimum
drinking water standards in different countries.
Drinking water - human/ livestock
Fish and Wildlife
Crop production : irrigation
Industrial processing
Recreational use/swimming/ boating
50.
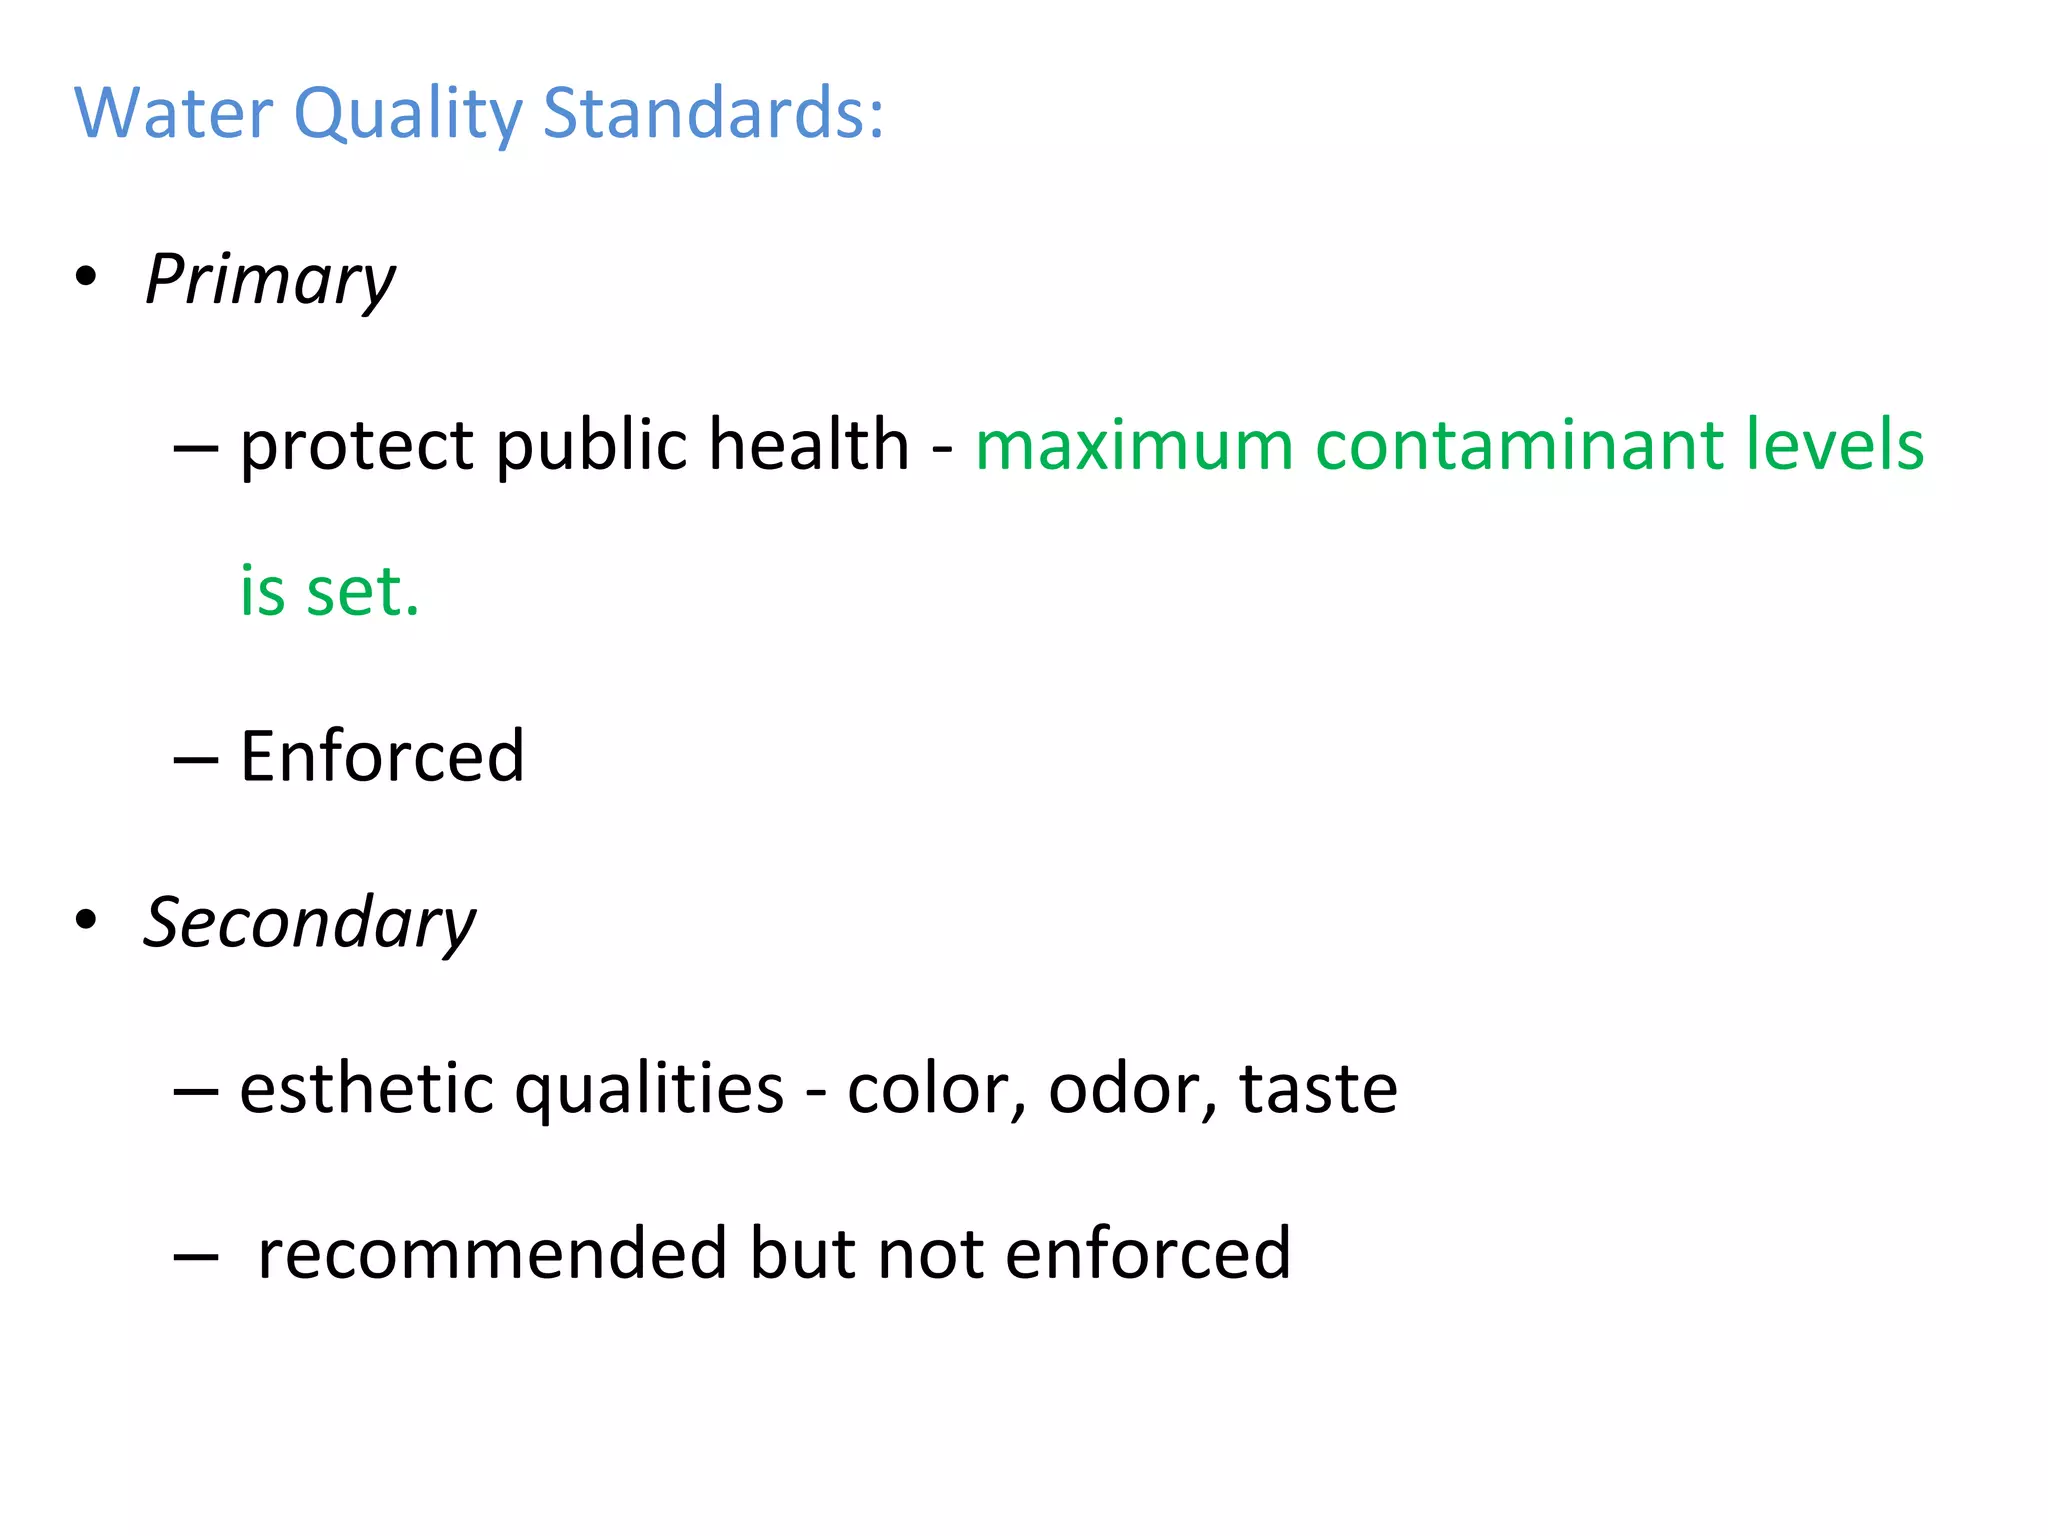
Water Quality Standards:
•Primary
– protect public health - maximum contaminant levels
is set.
– Enforced
• Secondary
– esthetic qualities - color, odor, taste
– recommended but not enforced
51.
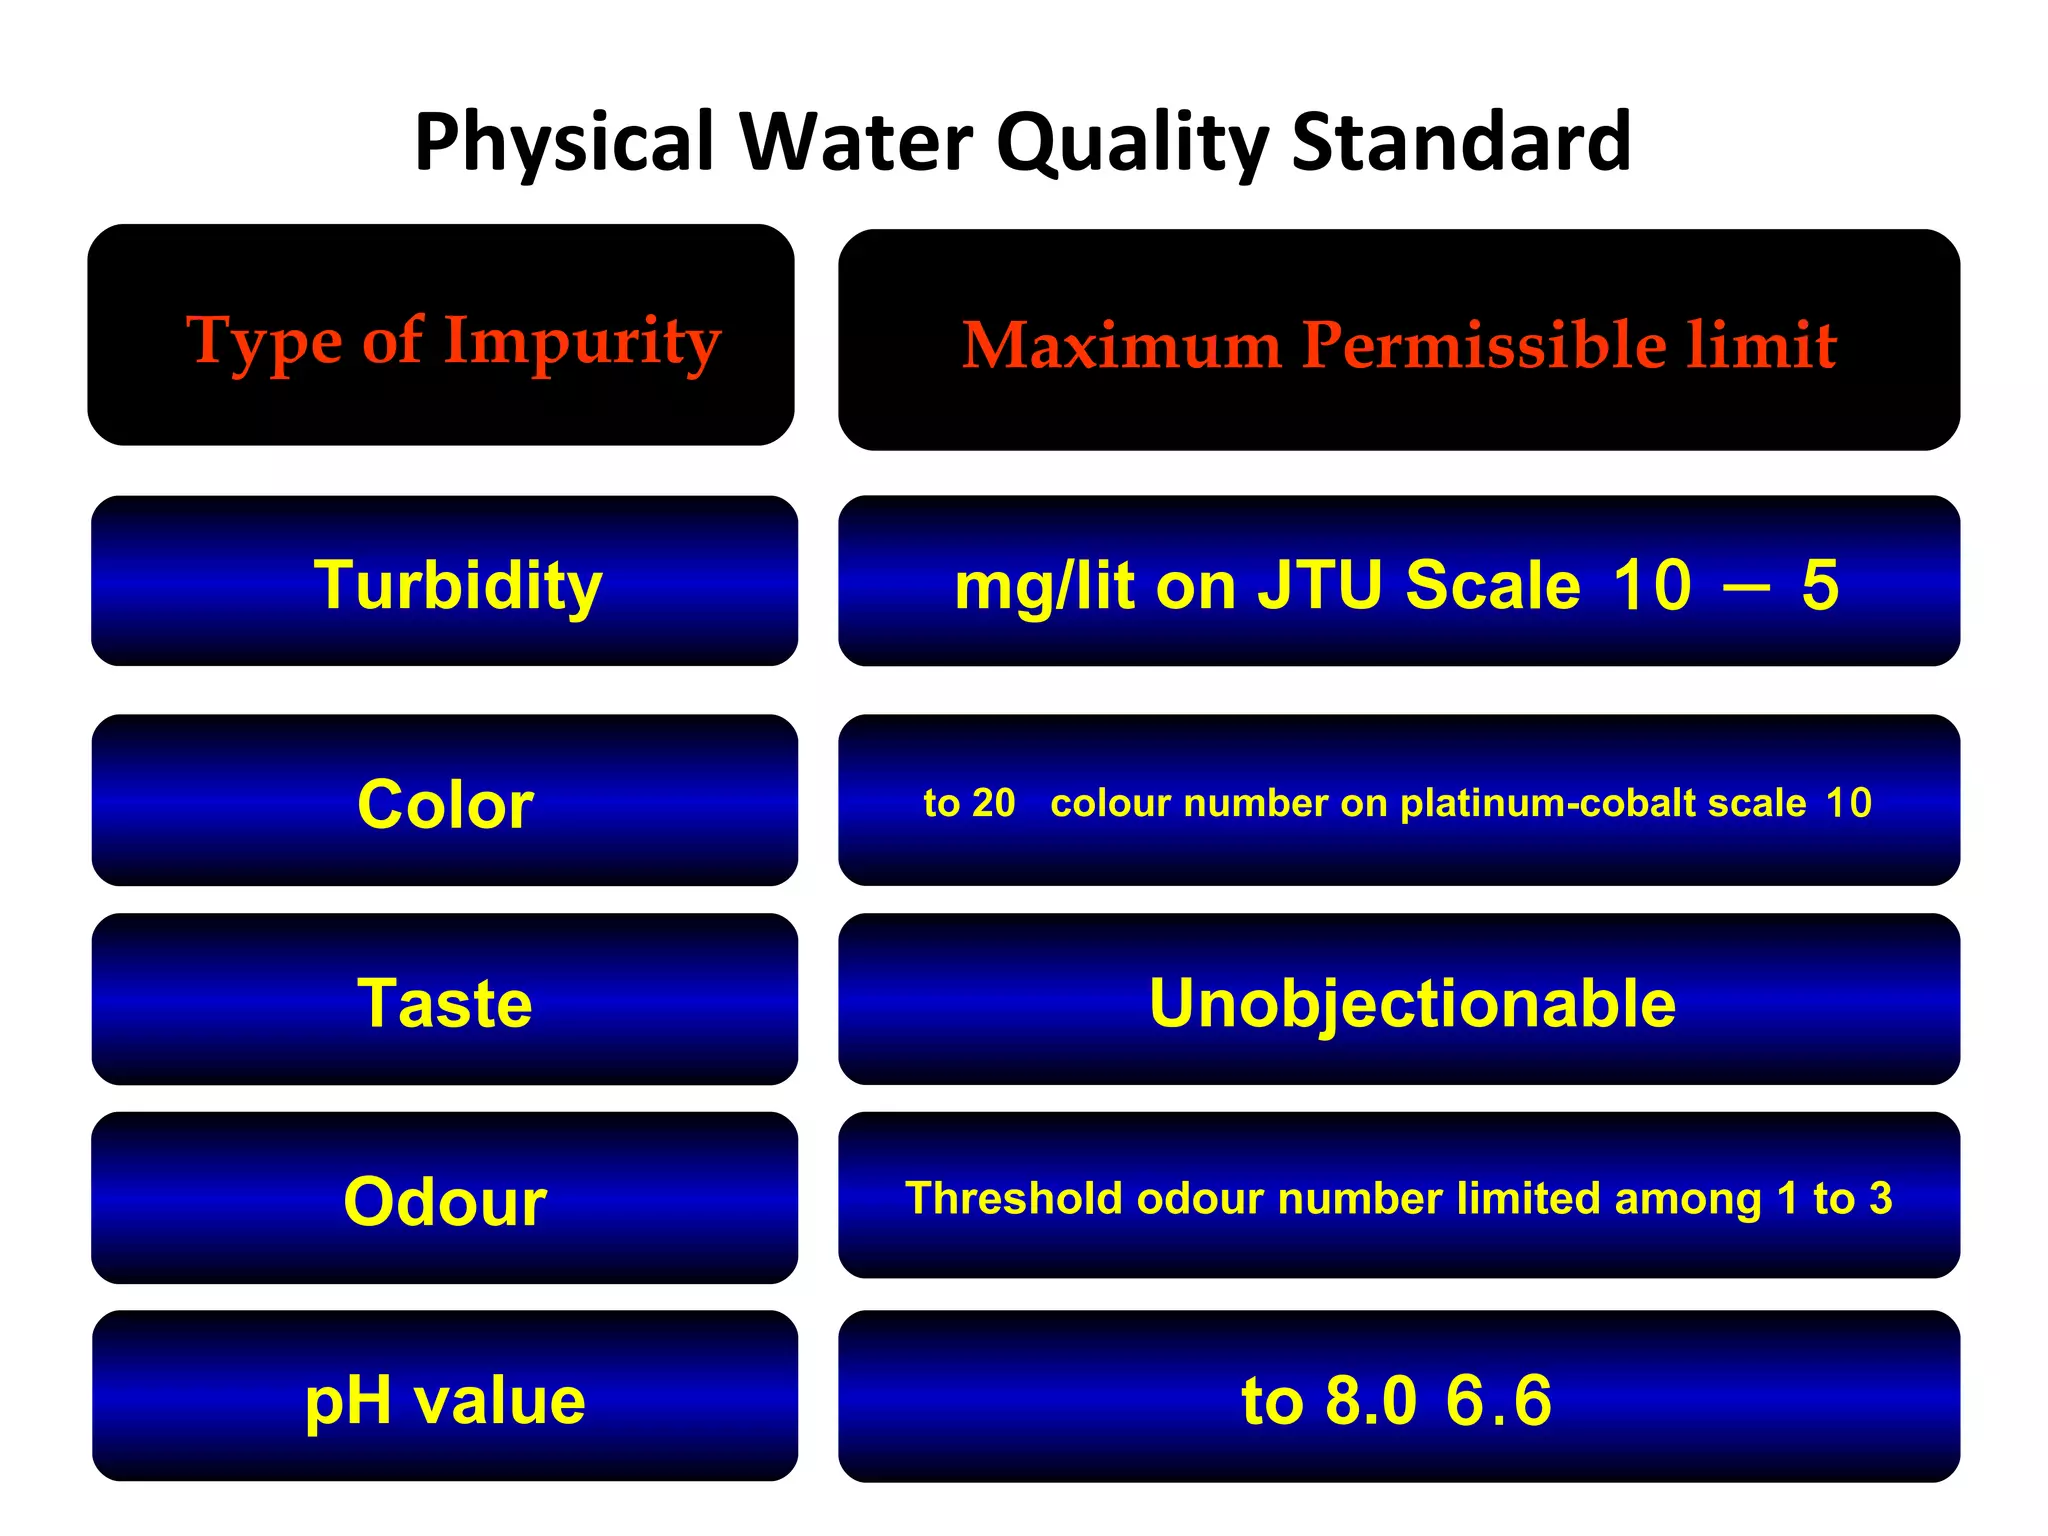
Type of ImpurityMaximum Permissible limit
Turbidity
Color
Taste
5–10mg/lit on JTU Scale
10to 20 colour number on platinum-cobalt scale
Unobjectionable
Odour
pH value
Threshold odour number limited among 1 to 3
.6 6to 8.0
Physical Water Quality Standard
52.
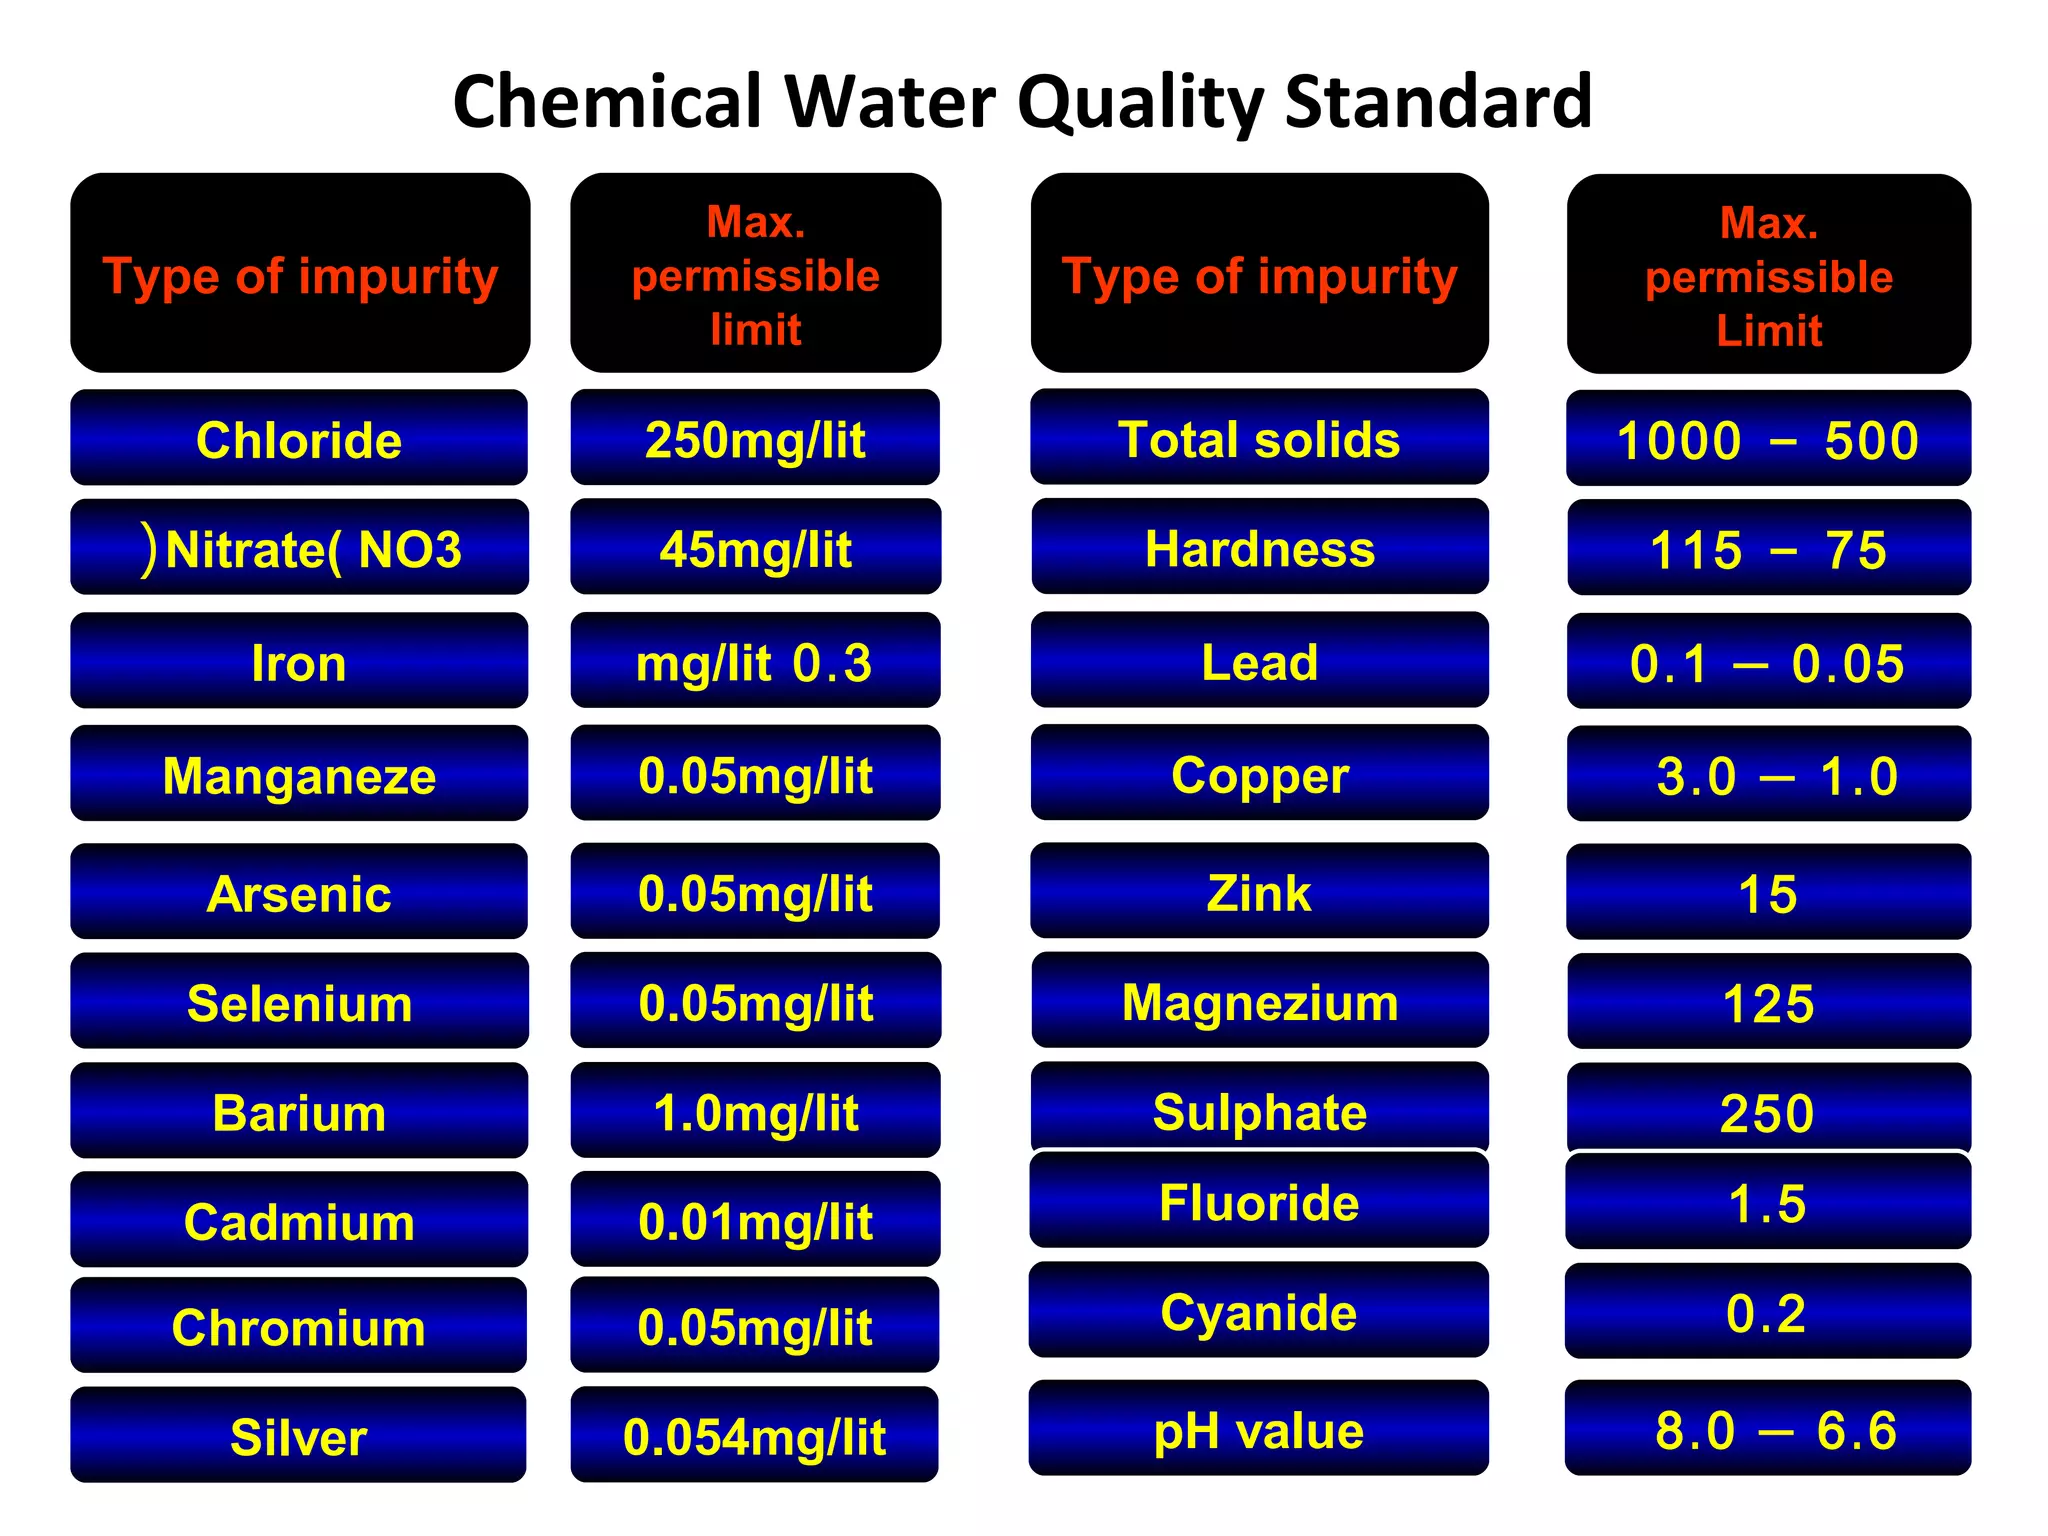
Chemical Water QualityStandard
Type of impurity
Max.
permissible
limit
Type of impurity
Chloride
Nitrate( NO3(
Iron
Manganeze
250mg/lit
45mg/lit
.0 3mg/lit
0.05mg/lit
Total solids
Hardness
Lead
Copper
Max.
permissible
Limit
500-1000
75-115
.0 05–.0 1
.1 0–.3 0
Arsenic
Selenium
Barium
Cadmium
0.05mg/lit
0.05mg/lit
1.0mg/lit
0.01mg/lit
Zink
Magnezium
Sulphate
15
125
250
Chromium
Silver
0.05mg/lit
0.054mg/lit
Fluoride
Cyanide
pH value
.1 5
.0 2
.6 6–.8 0
53.
1.4. Water Sampling
Awater sample for characteristic test has to be properly
collected, preserved, transported, identified and
analyzed.
Sampling methods:
1. Grab sampling
2. Composite sampling
54.
1. Grab Sampling
a single sample collected over a very short period of time.
only represent the conditions of the water at the particular
time and location.
Not suitable for parameters that change instantly
2. Composite Sampling
grab samples taken at regular intervals over the sampling
period.
more appropriate to determine overall or average
conditions over a certain period of time.
55.
• Selection ofSampling Points: sampling points include:
– Source
– Treatment plant
– Reservoirs
– Distribution systems
56.
Transportation and Handlingof Samples
Both chemical and bacteriological samples should be
transported in an insulated boxes (preferable in ice box)
Kept at temperature between 40
C and 100
C.
This can be done by packing with bags containing a
freezing mixture.
If samples cannot be cooled, they must be examined with
in 2 hrs. of sampling, if neither condition can be met, the
sample should not be analyzed. (for bact.)
57.
It is preferablethat the examination of bacteriological
samples be begun within 24 hours of the collection
In the case of chemical analysis, parameters which are
subject to change, such as alkalinity or nitrate analysis
should be conducted within 24 hours of collection
The box used to carry samples should be cleaned and
disinfected.
The bottles and the sampler’s hands should be disinfected
after each use to avoid the contamination.
Generally, the amount of time a sample can be stored
depends on the constituent’s stability
58.
Sample Identification
All samplesshould be identified immediately and clearly
Identification of samples shall be made by labeling and
should include clear information which can be
understood by others like:
– Location of sampling point
– Date
– Time
– Description of sample
– Comments relating to special conditions which might
affect results
59.
Sample Frequency
Sampling frequenciesfor raw water sources depend on;
– Their overall quality
– Their size
– The likelyhood of contamination
– The season of the year
Sampling frequencies for treated water depend on:
– The quality of water sources
– The type of treatment
60.
• Frequency ofsampling increased at a time of:
Epidemics,
Flooding,
Emergency operations,
Following interruptions of supply,
Repair work.
61.
Sampling treated water
Whensamples of disinfected water are taken, the
concentration of residual chlorine & pH should be
determined at the time of collection.
Samples must be taken from different parts of the
distribution systems to ensure that all parts of the
system are tested.
Before the sample is taken, taps & sampling pots should
be disinfected & a quantity of water run first to flush out
the standing water in the pipe.
62.
Sample preservation techniques:
Chemicaladdition/Acidification/ - addition of acid to the
sample to preserve dissolved metals (HNO3, H2SO4, etc)
Freezing
Refrigeration – at 40
C is a common preservation technique,
which is widely used in the fieldwork.
Sample analysis
Water quality analysis categorized in two major groups:
– Bacteriological examinations
63.
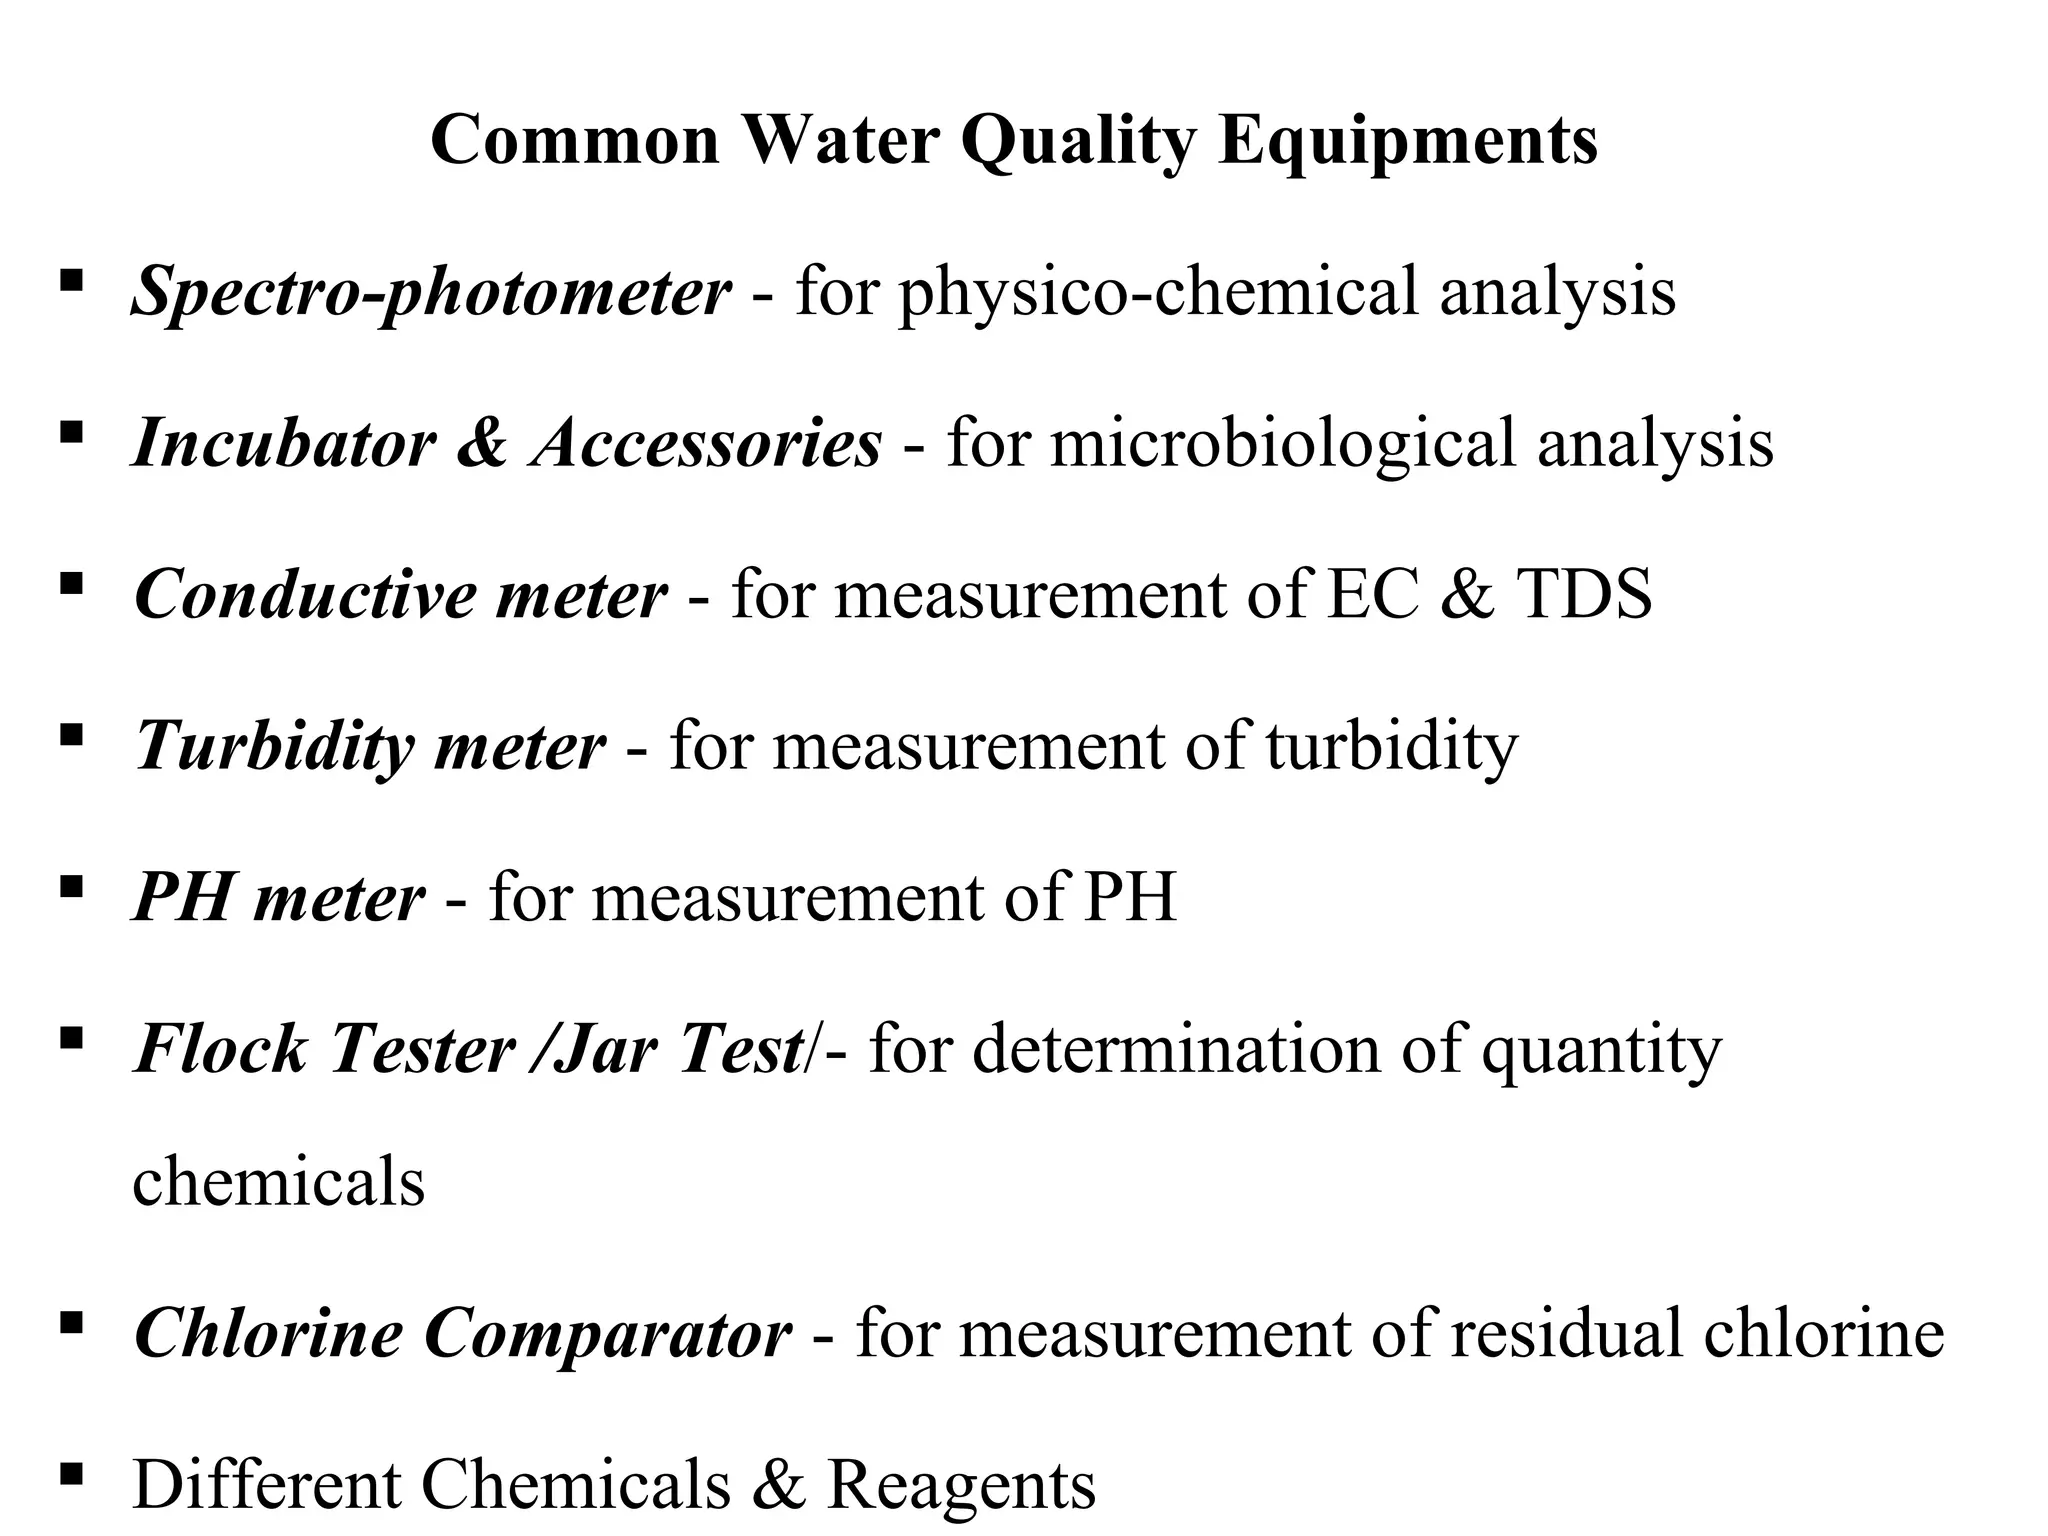
Common Water QualityEquipments
Spectro-photometer - for physico-chemical analysis
Incubator & Accessories - for microbiological analysis
Conductive meter - for measurement of EC & TDS
Turbidity meter - for measurement of turbidity
PH meter - for measurement of PH
Flock Tester /Jar Test/- for determination of quantity
chemicals
Chlorine Comparator - for measurement of residual chlorine
Different Chemicals & Reagents
64.
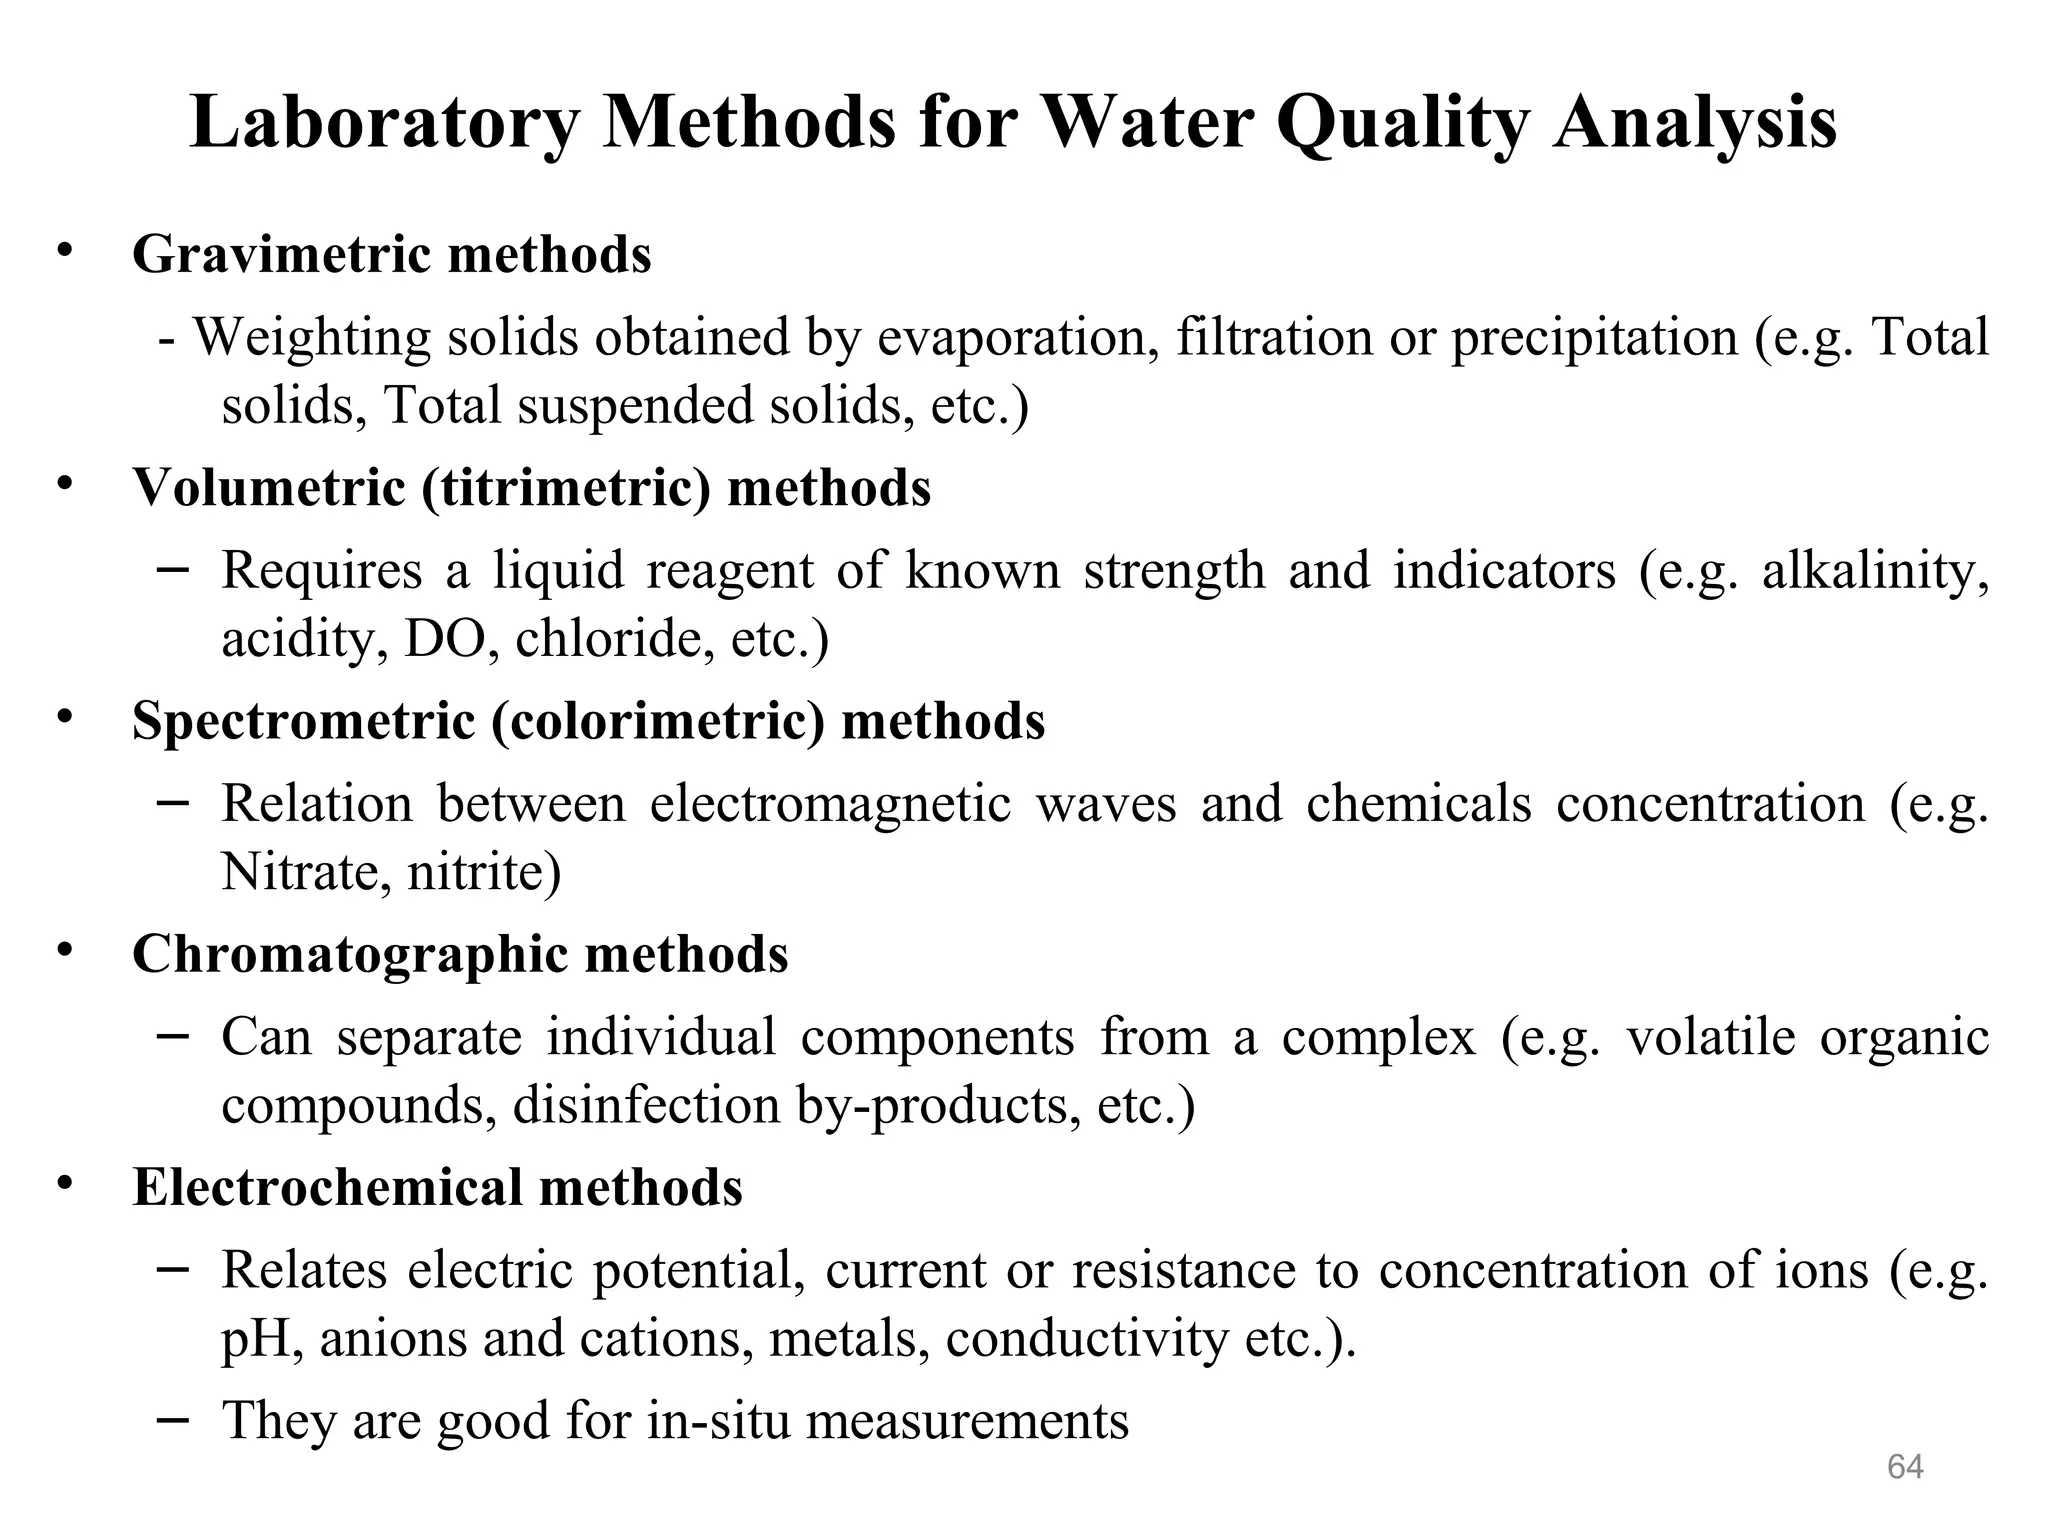
Laboratory Methods forWater Quality Analysis
• Gravimetric methods
- Weighting solids obtained by evaporation, filtration or precipitation (e.g. Total
solids, Total suspended solids, etc.)
• Volumetric (titrimetric) methods
– Requires a liquid reagent of known strength and indicators (e.g. alkalinity,
acidity, DO, chloride, etc.)
• Spectrometric (colorimetric) methods
– Relation between electromagnetic waves and chemicals concentration (e.g.
Nitrate, nitrite)
• Chromatographic methods
– Can separate individual components from a complex (e.g. volatile organic
compounds, disinfection by-products, etc.)
• Electrochemical methods
– Relates electric potential, current or resistance to concentration of ions (e.g.
pH, anions and cations, metals, conductivity etc.).
– They are good for in-situ measurements
64
65.
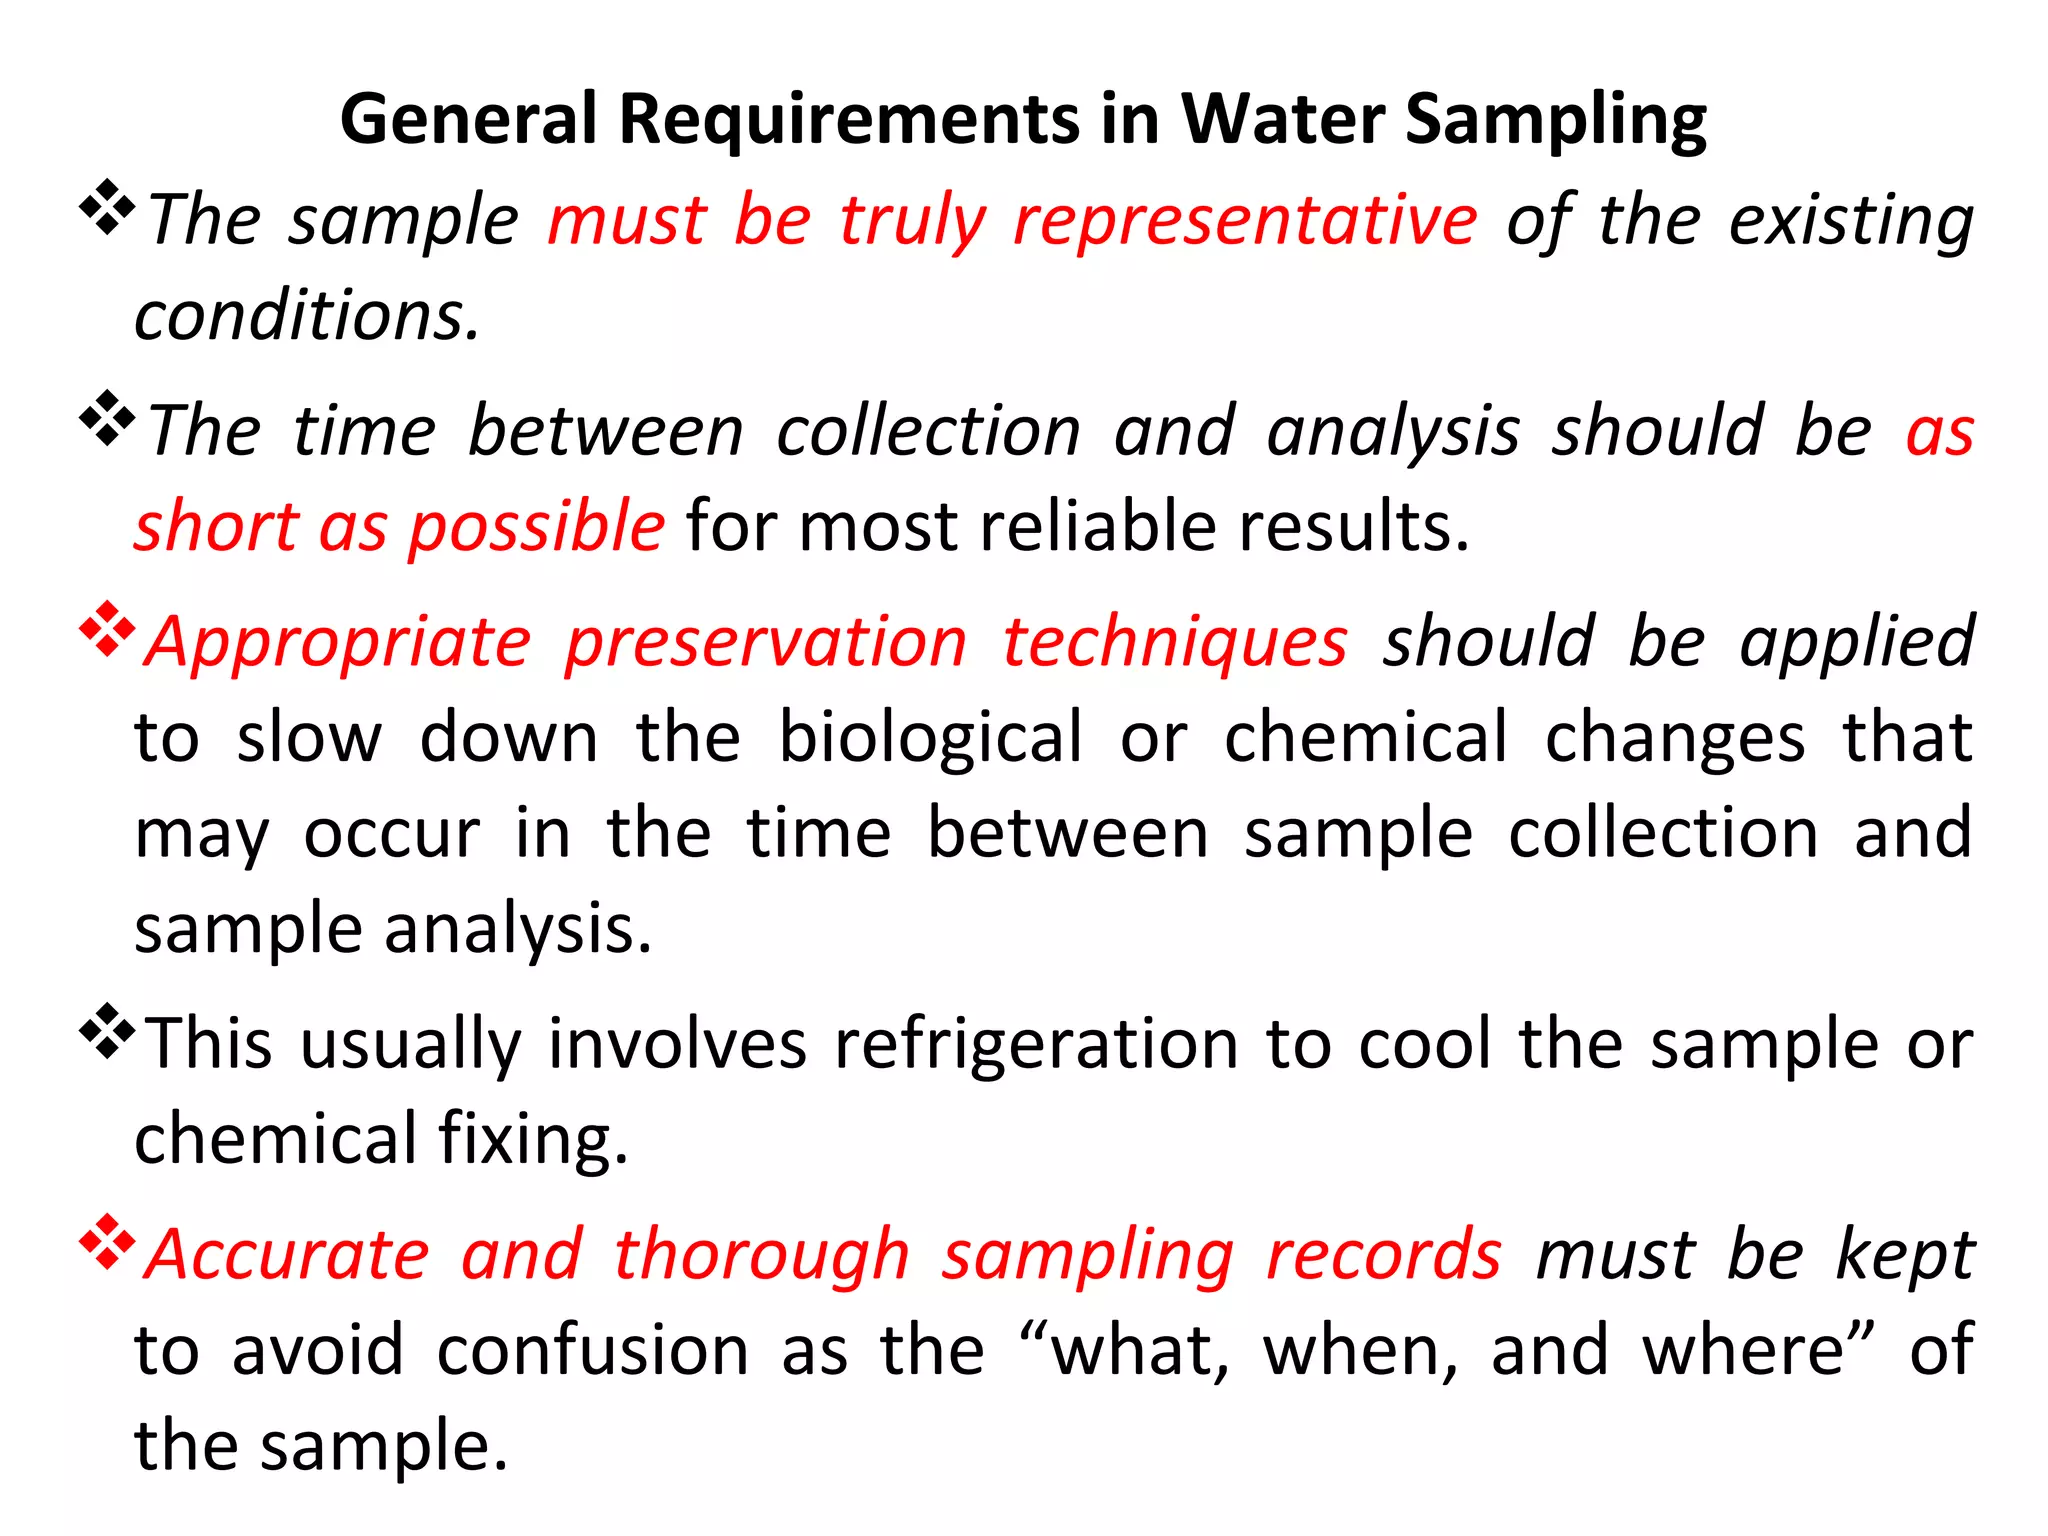
General Requirements inWater Sampling
The sample must be truly representative of the existing
conditions.
The time between collection and analysis should be as
short as possible for most reliable results.
Appropriate preservation techniques should be applied
to slow down the biological or chemical changes that
may occur in the time between sample collection and
sample analysis.
This usually involves refrigeration to cool the sample or
chemical fixing.
Accurate and thorough sampling records must be kept
to avoid confusion as the “what, when, and where” of
the sample.