Download to read offline
![Journal of Chromatography A, 857 (1999) 295–302
www.elsevier.com / locate / chroma
Analysis of b-N-oxalyl-L-a,b-diaminopropionic acid and
homoarginine in Lathyrus sativus by capillary zone electrophoresis
a a a a b b,
Liang Zhao , Xingguo Chen , Zhide Hu , Qianfeng Li , Qian Chen , Zhixiao Li *
a
Department of Chemistry, Lanzhou University, Lanzhou 730000, China
b
National Laboratory of Applied Organic Chemistry, Lanzhou University, Lanzhou 730000, China
Received 29 January 1999; received in revised form 6 July 1999; accepted 6 July 1999
Abstract
A simple capillary zone electrophoresis (CZE) method has been developed for the simultaneous quantitative determination
of b-N-oxalyl-L-a,b-diaminopropionic acid (b-ODAP) and homoarginine in Lathyrus sativus (LS; grass pea). A new
Na 2 B 4 O 7 –Na 2 SO 4 run buffer was used and the pH was 9.20, contents of b-ODAP and homoarginine in crude extracts of LS
plant material were determined with this method, the RSDs of peak areas of b-ODAP and homoarginine were 2.62% and
3.61%, respectively. It was found that the equilibrium concentration ratio of a- and b-ODAP decreased from 34.5 / 65.5 to
28.6 / 71.4 when the pH of the solution increased from pH 3.0 to pH 11.0. © 1999 Elsevier Science B.V. All rights reserved.
Keywords: Lathyrus sativus; Plant material; Oxalyldiaminopropionic acid; Homoarginine; Arginine; Amino acids; Neuro-
toxin
1. Introduction portions following drought- and flood-triggered
famine in those areas. Homoarginine is another non-
With the uncontrolled increase of the population, protein amino acid in LS [2]; it has been considered
the short supply of water resources and the more as a positive factor because it can be converted into
frequent occurrence of disasters, the problem of lysine by the mammalian liver. However, it is also a
foodstuffs has become critical in some regions. precursor of nitric oxide (NO) which mediates
Lathyrus sativus (LS; grass pea) is a popular glutamate neurotoxicity [3]. And Breitner [4] pre-
drought- and flood-tolerant crop and foodstuff in sents a theory that presence of homoarginine in gene
drought-prone areas of northwest China, India, activator–repressor histones may be the direct cause
Pakistan, Ethiopia etc. The seeds of LS may be the of most cancers. So the concentration level of these
only food available during periods of famine. How- two compounds in LS is very important. In dry seeds
ever, the excessive consumption of seeds of LS can of LS, b-ODAP and homoarginine are major free
cause a neurological disorder (lathyrism), which is amino acids, which together make up over 90% of
believed to be caused by the non-protein amino acid the ninhydrin-reacting compounds in the 70% etha-
b-N-oxalyl-L-a,b-diaminopropionic acid (b-ODAP) nol extracts [5]. The level of both compounds in the
[1]. The disease sometimes reaches epidemic pro- dry seeds varies widely depending on genetic factors
and environmental conditions.
*Corresponding author. Intensive research for developing low- or zero-
0021-9673 / 99 / $ – see front matter © 1999 Elsevier Science B.V. All rights reserved.
PII: S0021-9673( 99 )00788-8](https://image.slidesharecdn.com/odapchromatgrphy-110927022257-phpapp01/85/Odap-chromatgrphy-1-320.jpg)
![Journal of Chromatography A, 857 (1999) 295–302
www.elsevier.com / locate / chroma
Analysis of b-N-oxalyl-L-a,b-diaminopropionic acid and
homoarginine in Lathyrus sativus by capillary zone electrophoresis
a a a a b b,
Liang Zhao , Xingguo Chen , Zhide Hu , Qianfeng Li , Qian Chen , Zhixiao Li *
a
Department of Chemistry, Lanzhou University, Lanzhou 730000, China
b
National Laboratory of Applied Organic Chemistry, Lanzhou University, Lanzhou 730000, China
Received 29 January 1999; received in revised form 6 July 1999; accepted 6 July 1999
Abstract
A simple capillary zone electrophoresis (CZE) method has been developed for the simultaneous quantitative determination
of b-N-oxalyl-L-a,b-diaminopropionic acid (b-ODAP) and homoarginine in Lathyrus sativus (LS; grass pea). A new
Na 2 B 4 O 7 –Na 2 SO 4 run buffer was used and the pH was 9.20, contents of b-ODAP and homoarginine in crude extracts of LS
plant material were determined with this method, the RSDs of peak areas of b-ODAP and homoarginine were 2.62% and
3.61%, respectively. It was found that the equilibrium concentration ratio of a- and b-ODAP decreased from 34.5 / 65.5 to
28.6 / 71.4 when the pH of the solution increased from pH 3.0 to pH 11.0. © 1999 Elsevier Science B.V. All rights reserved.
Keywords: Lathyrus sativus; Plant material; Oxalyldiaminopropionic acid; Homoarginine; Arginine; Amino acids; Neuro-
toxin
1. Introduction portions following drought- and flood-triggered
famine in those areas. Homoarginine is another non-
With the uncontrolled increase of the population, protein amino acid in LS [2]; it has been considered
the short supply of water resources and the more as a positive factor because it can be converted into
frequent occurrence of disasters, the problem of lysine by the mammalian liver. However, it is also a
foodstuffs has become critical in some regions. precursor of nitric oxide (NO) which mediates
Lathyrus sativus (LS; grass pea) is a popular glutamate neurotoxicity [3]. And Breitner [4] pre-
drought- and flood-tolerant crop and foodstuff in sents a theory that presence of homoarginine in gene
drought-prone areas of northwest China, India, activator–repressor histones may be the direct cause
Pakistan, Ethiopia etc. The seeds of LS may be the of most cancers. So the concentration level of these
only food available during periods of famine. How- two compounds in LS is very important. In dry seeds
ever, the excessive consumption of seeds of LS can of LS, b-ODAP and homoarginine are major free
cause a neurological disorder (lathyrism), which is amino acids, which together make up over 90% of
believed to be caused by the non-protein amino acid the ninhydrin-reacting compounds in the 70% etha-
b-N-oxalyl-L-a,b-diaminopropionic acid (b-ODAP) nol extracts [5]. The level of both compounds in the
[1]. The disease sometimes reaches epidemic pro- dry seeds varies widely depending on genetic factors
and environmental conditions.
*Corresponding author. Intensive research for developing low- or zero-
0021-9673 / 99 / $ – see front matter © 1999 Elsevier Science B.V. All rights reserved.
PII: S0021-9673( 99 )00788-8](https://image.slidesharecdn.com/odapchromatgrphy-110927022257-phpapp01/75/Odap-chromatgrphy-1-2048.jpg)
![296 L. Zhao et al. / J. Chromatogr. A 857 (1999) 295 – 302
toxin varieties of LS seeds is going on in several where the sample vial was raised by 10.0 cm for 5 s.
institutes focusing on agricultural reserves. The most Data acquisition was carried out with a Maxima820
obvious option to achieve this goal entails plant chromatography workstation. A 1 min wash cycle
breeding and post-harvest processing. This involves with 0.5 M NaOH solution followed by 1 min
processing of a large number of samples, requiring a distilled water and 1 min separation buffer was
fast and selective method for monitoring the toxic necessary to condition the capillary.
compounds. The most widely used method for
determining the neurotoxin utilizes the reaction of
o-phthaladehyde (OPA) with 2,3-diaminopropionic 2.2. Reagent
acid (DAP) formed on hydrolysis of ODAP and
measurement of the absorbance at 420 nm [6,7], LS and its plant material were obtained from the
since free DAP is not a natural constituent of LS State Key Laboratory of Arid Agroecology, Lanzhou
seeds. But this method is nonselective between b- University, Lanzhou, China. L-Homoarginine, L-ar-
ODAP and its innoxious isomer a-N-oxalyl-L-a,b- ginine, L-glycine, L-alanine, L-tyrosine and L-phenyl-
diaminopropionic acid (a-ODAP). A few HPLC alanine were obtained from Sigma (St. Louis, MO,
methods for ODAP have been developed in recent USA). b-ODAP was extracted from LS as in the
years, including dansyl-Cl [8] and 9-fluorenylmethyl method of Ref. [13]; in most cases this method
chloroformate [9] derivatization methods which do resulted in a mixture of a-ODAP and b-ODAP (Fig.
not differentiate between the two isomers. Separation 1) rather than in pure b-ODAP because the isomeri-
of a- and b-ODAP was achieved by HPLC [10], zation of b-ODAP in aqueous solution. At higher
based on precolumn phenyl isothiocyanate derivati- temperatures, the reaction speed of the transforma-
zation, this method also can determine the con- tion of b-ODAP into a-ODAP considerably acceler-
centration of homoarginine. All these methods are ated, the reaction speed at 958C was 84 times faster
based on inconvenient and time-consuming off-line than at 758C [14]. Thus to keep the temperature of
pretreatments. Selective and speedy determination of the ODAP solution low in the process of the
b-ODAP could be achieved by capillary zone elec- preparation of b-ODAP, and decrease the heating
trophoresis (CZE) [11] or a LC–biosensor method time in the recrystallization step would help to bring
[12], but both these methods could not determine about a pure b-ODAP.
homoarginine at the same time. This paper presents a The structures of homoarginine, arginine, a-
new CZE method for the determination of homoar- ODAP and b-ODAP were shown in Fig. 2.
ginine, a- and b-ODAP simultaneously. The method
is sensitive, fast, and simple.
2.3. Sample extraction
0.020 g powder of LS seeds or its plant material
2. Experimental was soaked with 2 ml ethanol–water (30:70, v / v)
solution and shaken for 24 h. After ultracentrifuga-
tion, the upper clear solution was injected directly
2.1. Instruments into the CZE system.
CZE has been carried out using a Waters Quanta
4000 system (Waters, Milford, MA, USA) and UV 2.4. Preparation of electrolyte
detecting at 185 nm. The temperature is 22618C.
Separation was performed in uncoated fused-silica Buffers were mixed from 0.10 M Na 2 B 4 O 7 and
capillaries manufactured by Waters Accasep. Capil- 0.10 M Na 2 SO 4 solutions and diluted with distilled
laries of 55 cm (47.4 cm effective length)375 mm water; the required pH of buffer was adjusted by
I.D., were used. Samples were introduced from the H 3 PO 4 . Unless otherwise specified, all chemicals
anodic end of the capillary by hydrostatic injection were of analytical-reagent grade.](https://image.slidesharecdn.com/odapchromatgrphy-110927022257-phpapp01/85/Odap-chromatgrphy-2-320.jpg)
![L. Zhao et al. / J. Chromatogr. A 857 (1999) 295 – 302 297
Fig. 1. Electropherogram of aqueous solution of ODAP prepared by the method of Ref. [13]. Concentration of borate 0.0010 M, Na 2 SO 4
0.005 M, pH 9.2, applied voltage: 21 kV, UV detection at 185 nm. Peaks: 15a-ODAP; 25b-ODAP.
Fig. 2. Structures of homoarginine, arginine, a-ODAP and b-ODAP.](https://image.slidesharecdn.com/odapchromatgrphy-110927022257-phpapp01/85/Odap-chromatgrphy-3-320.jpg)
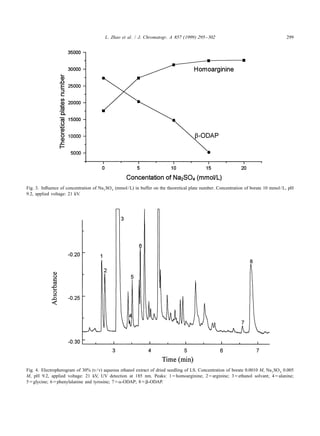
![298 L. Zhao et al. / J. Chromatogr. A 857 (1999) 295 – 302
3. Results and discussion buffer, because it was found that when the con-
centration of buffer increased, peak tailing of
3.1. Calculations homoarginine and arginine decreased, and they sepa-
rated better. To increase the ion strength and not
The separation efficiency was calculated by: change the pH of the buffer, the only way is to add
another salt into the buffer. Solutions such as KCl,
S D
tR
N 5 5.54 ]]
w1 / 2
2
(1)
NaCl, NaNO 3 , KNO 3 , Na 2 SO 4 , etc. have been tried
to add into buffer, the former four salts have a strong
UV absorption, only Na 2 SO 4 has a very low UV
where N is the theoretical plate number, t R is the
absorption, and Na 2 SO 4 was added into buffer in
migration time of analyte, w 1 / 2 is the peak width at
concentration from 5 mmol / L to 25 mmol / L. The
half height.
relation between the numbers of theoretical plates for
homoarginine and b-ODAP and the concentration of
3.2. Effect of different buffers and pH Na 2 SO 4 is shown in Fig. 3. It was shown that when
the ion strength increased, the numbers of theoretical
Solutions such as barbiturate, acetate, Tris– plates of homoarginine increased, but for b-ODAP
H 3 PO 4 , phosphate etc. were investigated as buffers. the numbers of theoretical plates decreased. The
All of these buffers have strong UV absorption at choice of 10 mmol / L borate and 5 mmol / L Na 2 SO 4
185 nm except borate. So the borate was selected as as the buffer was a compromise of the experimental
buffer. With increasing of the borate concentration, results.
the background of UV absorption enhanced, and
hence the sensitivity decreased, so the concentration 3.4. Applied voltage
of the borate buffer in this paper was kept at 10
mmol / L. A higher applied voltage resulted in a lower
In the pH range examined, there were positive migration time, and also the peak broadened due to
charges on the arginine and homoarginine molecules, the excess Joule heat and diffusion. 21 kV was
and negative charges on a- and b-ODAP. A marked selected as the optimized applied voltage in the
positive and negative mobility could be observed. method presented.
Experimental results showed that a- and b-ODAP
are separated well and show satisfactory peak shapes 3.5. Peak identification
at pH 7.8; however, the peaks of arginine and
homoarginine overlapped at this pH. When the pH Peaks were identified by the addition of standard
increased from pH 7.8 to pH 10.0, the peaks of amino acids to the sample solution: by the increase
homoarginine, arginine, a- and b-ODAP tail. At pH of peak area the amino acid peak could easily be
8.50, a- and b-ODAP cannot be separated, and the identified. The peak of a-ODAP was identified by
peaks of arginine and homoarginine begin to be adding a mixture of a- and b-ODAP to the sample
separated into two peaks, but not completely. At pH solution, except the peak of b-ODAP which have
9.20, a- and b-ODAP separated completely although been identified, another area increased peak is a-
their peaks are tailing; arginine and homoarginine are ODAP. Or it could be identified by the peak area
relatively separated better. When the pH increased, increase of a-ODAP after the sample solution was
the difference in mobilities of arginine and homoar- heated for several hours. Because a- and b-ODAP
ginine decreased, and their separation was declined. have an equilibrium concentration ratio of about
So pH 9.20 was selected as the optimal buffer pH. 35:65, but in LS sample, the concentration of a-
ODAP never exceeded 5% of the total concentration
3.3. Effect of ion strength of buffer of a- and b-ODAP, however, undergoes a slow
transformation from b-ODAP to a-ODAP in water at
To obtain a better separation of homoarginine and room temperature. A higher temperature will acceler-
arginine, we tried to increase the ion strength of the ate this transformation process.](https://image.slidesharecdn.com/odapchromatgrphy-110927022257-phpapp01/85/Odap-chromatgrphy-4-320.jpg)
![300 L. Zhao et al. / J. Chromatogr. A 857 (1999) 295 – 302
Fig. 5. Electropherogram of 30% (v / v) aqueous ethanol extract of leaf powder of LS. Concentration of borate 0.0010 M, Na 2 SO 4 0.005 M,
pH 9.2, Applied voltage: 21 kV, UV detection at 185 nm. Peaks: 15arginine; 25ethanol solvant; 35b-ODAP.
Typical electropherograms were shown in Figs. 4 the mixture was determined by NMR spectroscopy
and 5. From the electropherogram of the LS sample, [15,16].
it can be seen that the peak of homoarginine appears A linear relationship between the concentration of
first, and the peak at the end is b-ODAP. At the homoarginine, a- and b-ODAP and the corre-
optimal buffer pH 9.2, other amino acids such as sponding peak area was found. The result was shown
asparagine and serine etc. were added to the LS in Table 1. The reproducibility of analytes [relative
sample, the migration time of asparagine was longer standard deviations (RSDs) of relative migration
with these amino acids present, but much shorter (2 times and peak areas], limits of detection, and
min) than that of b-ODAP. The contents of these concentration ranges were also shown in Table 1.
amino acids were so low that the UV detector could
not detect them. In addition, the possibility of co-
eluting peaks with b-ODAP and homoarginine was 4. Applications
excluded by a recovery test. So there are no amino
acids or other unknown substances in samples inter- 4.1. Analysis of LS samples
fering with the separation of homoarginine and b-
ODAP at optimal separation conditions. This method was applied to the separation and
determination of homoarginine and b-ODAP in the
leaf, seedlings and seeds of LS. The typical results of
3.6. Linearity and reproducibility different samples were listed in Table 2. It was
apparent that the concentration of homoarginine in
A mixture of a- and b-ODAP was used to get the LS leaf was much lower than that in LS seeds, the
curve of a-ODAP because of a lack of pure a- concentration of b-ODAP in the seedling signifi-
ODAP; the concentration ratio of a- and b-ODAP of cantly increased compared with that in the seeds;](https://image.slidesharecdn.com/odapchromatgrphy-110927022257-phpapp01/85/Odap-chromatgrphy-6-320.jpg)
![L. Zhao et al. / J. Chromatogr. A 857 (1999) 295 – 302 301
Table 1
Linear relationships, correlation coefficients, limits of detection, concentration ranges, migration times and reproducibilities for the three
analytes under optimum conditions
Analytes Linear relationship a S5 A1B 3C Correlation Limit of Concentration Migration RSD (%) for RSD (%) for
coefficient detection range time migration time peak area
A (mV s) B (mV s / mg ml 21 ) (mg ml 21 ) (mg ml 21 ) (min) (n55) (n55)
Homoarginine 0.26?10 2 1.50?10 2 0.9985 1.5 4–200 2.57 0.89 3.61
a-ODAP 2.26?10 2 2.91?10 2 0.998 2.5 5–90 6.28 0.71 3.37
b-ODAP 1.99?10 2 3.25?10 2 0.9998 2.5 5–600 6.70 0.92 2.62
S is peak area (mV?s); C is the concentration of analytes (mg ml 21 ).
a
Table 2
Assay results of LS sample
Sample a Homoarginine b-ODAP (by CZE method) b-ODAP (by OPA method)
(%, w / w) (%, w / w) (%, w / w)
1 0.01 0.47 0.46
2 0.02 0.57 0.54
3 1.06 0.47 0.45
4 0.43 0.58 0.56
5 0.32 0.16 0.18
6 1.02 0.53 0.54
7 0.90 1.95 –
8 1.00 2.27 2.51
9 0.11 0.25 –
10 0.12 0.27 –
a
Samples 1 and 2 were powder of LS leaf of different periods of growth. Samples 3–6 were powder of LS seeds. Samples 7 and 8 were
dried seedling of seed of sample 6 that has been grown for three days. Samples 9 and 10 were fresh seedling of samples 7 and 8.
however, the concentration of homoarginine was acidities at 558C, the results were shown in Table 3
nearly unchanged from seeds to seedling. Also, the It was shown in Table 3 that not only the
contents of b-ODAP determined by CZE was com- transformation reaction is slower at higher pH, but
pared with that using the OPA method [6] as shown also the equilibrium concentration ratio of a- and
in Table 2. The results by the two methods were b-ODAP was different at different acidity. The
consistent. equilibrium concentration ratio of a- and b-ODAP
decreased when the pH increased. In the cooking
4.2. Thermal isomerization of b -ODAP process, the pH of food made by LS seeds is around
7, so it is important to use the equilibrium ratio at pH
In the aqueous solution of b-ODAP, there exists a 7.0 to calculate the efficiency of thermal isomeriza-
slow transformation from b-ODAP to its nontoxic tion detoxification.
isomer a-ODAP, so thermal isomerization is one of
the detoxification methods used. Using NMR spec-
troscopy, Abegaz [16] found that the equilibrium Table 3
concentration ratio of b-ODAP and a-ODAP is 3 / 2 Experimental results of thermal isomerization of b-ODAP
at 558C; the transformation reaction from b-ODAP Heating time (h) Concentration ratio of a-ODAP (%, w / w)
to a-ODAP in solution of b-ODAP (pH 2.3) was at 54.28C
quicker than in solution of sodium salt of b-ODAP pH 3.0 pH 7.0 pH 11.0
(pH 6.6). The CZE method in this paper was 0 0.5 0.5 0.5
employed to detect the concentration ratio of b- 7 12.8 11.4 10.7
ODAP and a-ODAP. The thermal isomerization of 80 34.6 31.1 24.6
136 34.5 31.0 28.6
b-ODAP has been studied in buffers of various](https://image.slidesharecdn.com/odapchromatgrphy-110927022257-phpapp01/85/Odap-chromatgrphy-7-320.jpg)
![302 L. Zhao et al. / J. Chromatogr. A 857 (1999) 295 – 302
5. Conclusions [2] F. Lambein, J.K. Khan, Y.H. Kuo, Planta Med. 58 (1992)
380.
[3] V.L. Dawson, T.M. Dawson, E.D. London, D.S. Bredt, S.M.
The CZE method could conveniently determine Snyder, Proc. Natl. Acad. Sci. USA (1991) 6368.
the concentration of homoarginine, a- and b-ODAP [4] C.T. Breitner, Speculations Sci. Technol. 11 (1988) 328–
in crude extracts of LS. The simple and fast method 329.
brought less pollution to the environment than the [5] F. Lambein, J.K. Khan, Y.H. Kuo, Planta Med. 58 (1992)
381.
traditional methods [6]. The method could also be
[6] S.L.N. Rao, Anal. Biochem. 14 (1978) 387.
employed to determine thermodynamic constants of [7] Z. Li, Y. Meng, L. Shang, Y. Chen, J. Lanzhou Univ. (Nat.
the thermal isomerization of b-ODAP because the Sci.) 28 (1992) 89–92.
concentration ratio of a- and b-ODAP in aqueous [8] G.E. Kisby, D.N. Roy, P.S. Spencer, J. Neurosci. Methods 26
solution could be measured expediently by this (1993) 45–54.
[9] A. Geda, C.J. Briggs, S.J. Venkataram, J. Chromatogr. 635
method.
(1993) 338.
[10] J.K. Khan, Y.H. Kuo, N. Kebede, F. Lambein, J. Chromatogr.
A 687 (1994) 113.
Acknowledgements [11] A.M.K. Arentoft, B.N. Greirson, J. Agric. Food Chem. 43
(1995) 942.
[12] A. Belay, T. Ruzgas, E. Csoregi, G. Moges, M. Tessema, T.
This project is financially supported by the Nation-
Solomon, L. Gorton, Anal. Chem. 69 (1997) 3471.
al Natural Science Foundation (No. 39770469 and [13] L.H. Frances, P.B. Nunn, R.R. Hill, Phytochemistry 16
No. 29475194), Natural Science Foundation of (1977) 1211.
Gansu Province. [14] L. Zhao, Z. Li, G. Li, X. Chen, Z. Hu, Phys. Chem. Chem.
Phys., (1999) in press.
[15] B.M. Abegaz, Presented at the International on Workshop on
Ecology and Biochemistry of Non-Protein Amino Acids
References from Plants, including a Case Study: Lathyrus sativus and
Human Lathyrism, Ghent, 1990.
[1] V.S. Murti, T.R. Seshadri, T.A. Venkitasubramanian, Phyto- [16] B.M. Abegaz, P.B. Nunn, A.D. Bruyn, F. Lambein, Phyto-
chemistry 3 (1964) 73. chemistry 33 (1993) 1121.](https://image.slidesharecdn.com/odapchromatgrphy-110927022257-phpapp01/85/Odap-chromatgrphy-8-320.jpg)

This document describes a new capillary zone electrophoresis (CZE) method for the simultaneous quantitative determination of β-N-oxalyl-L-α,β-diaminopropionic acid (β-ODAP) and homoarginine in Lathyrus sativus (grass pea). The method uses a new sodium borate-sodium sulfate run buffer at pH 9.2. It was found that the ratio of α- and β-ODAP isomers changes from 34.5/65.5 to 28.6/71.4 as the pH increases from 3.0 to 11.0. The method allows for the fast, simple, and sensitive determination of β-OD


