Download to read offline
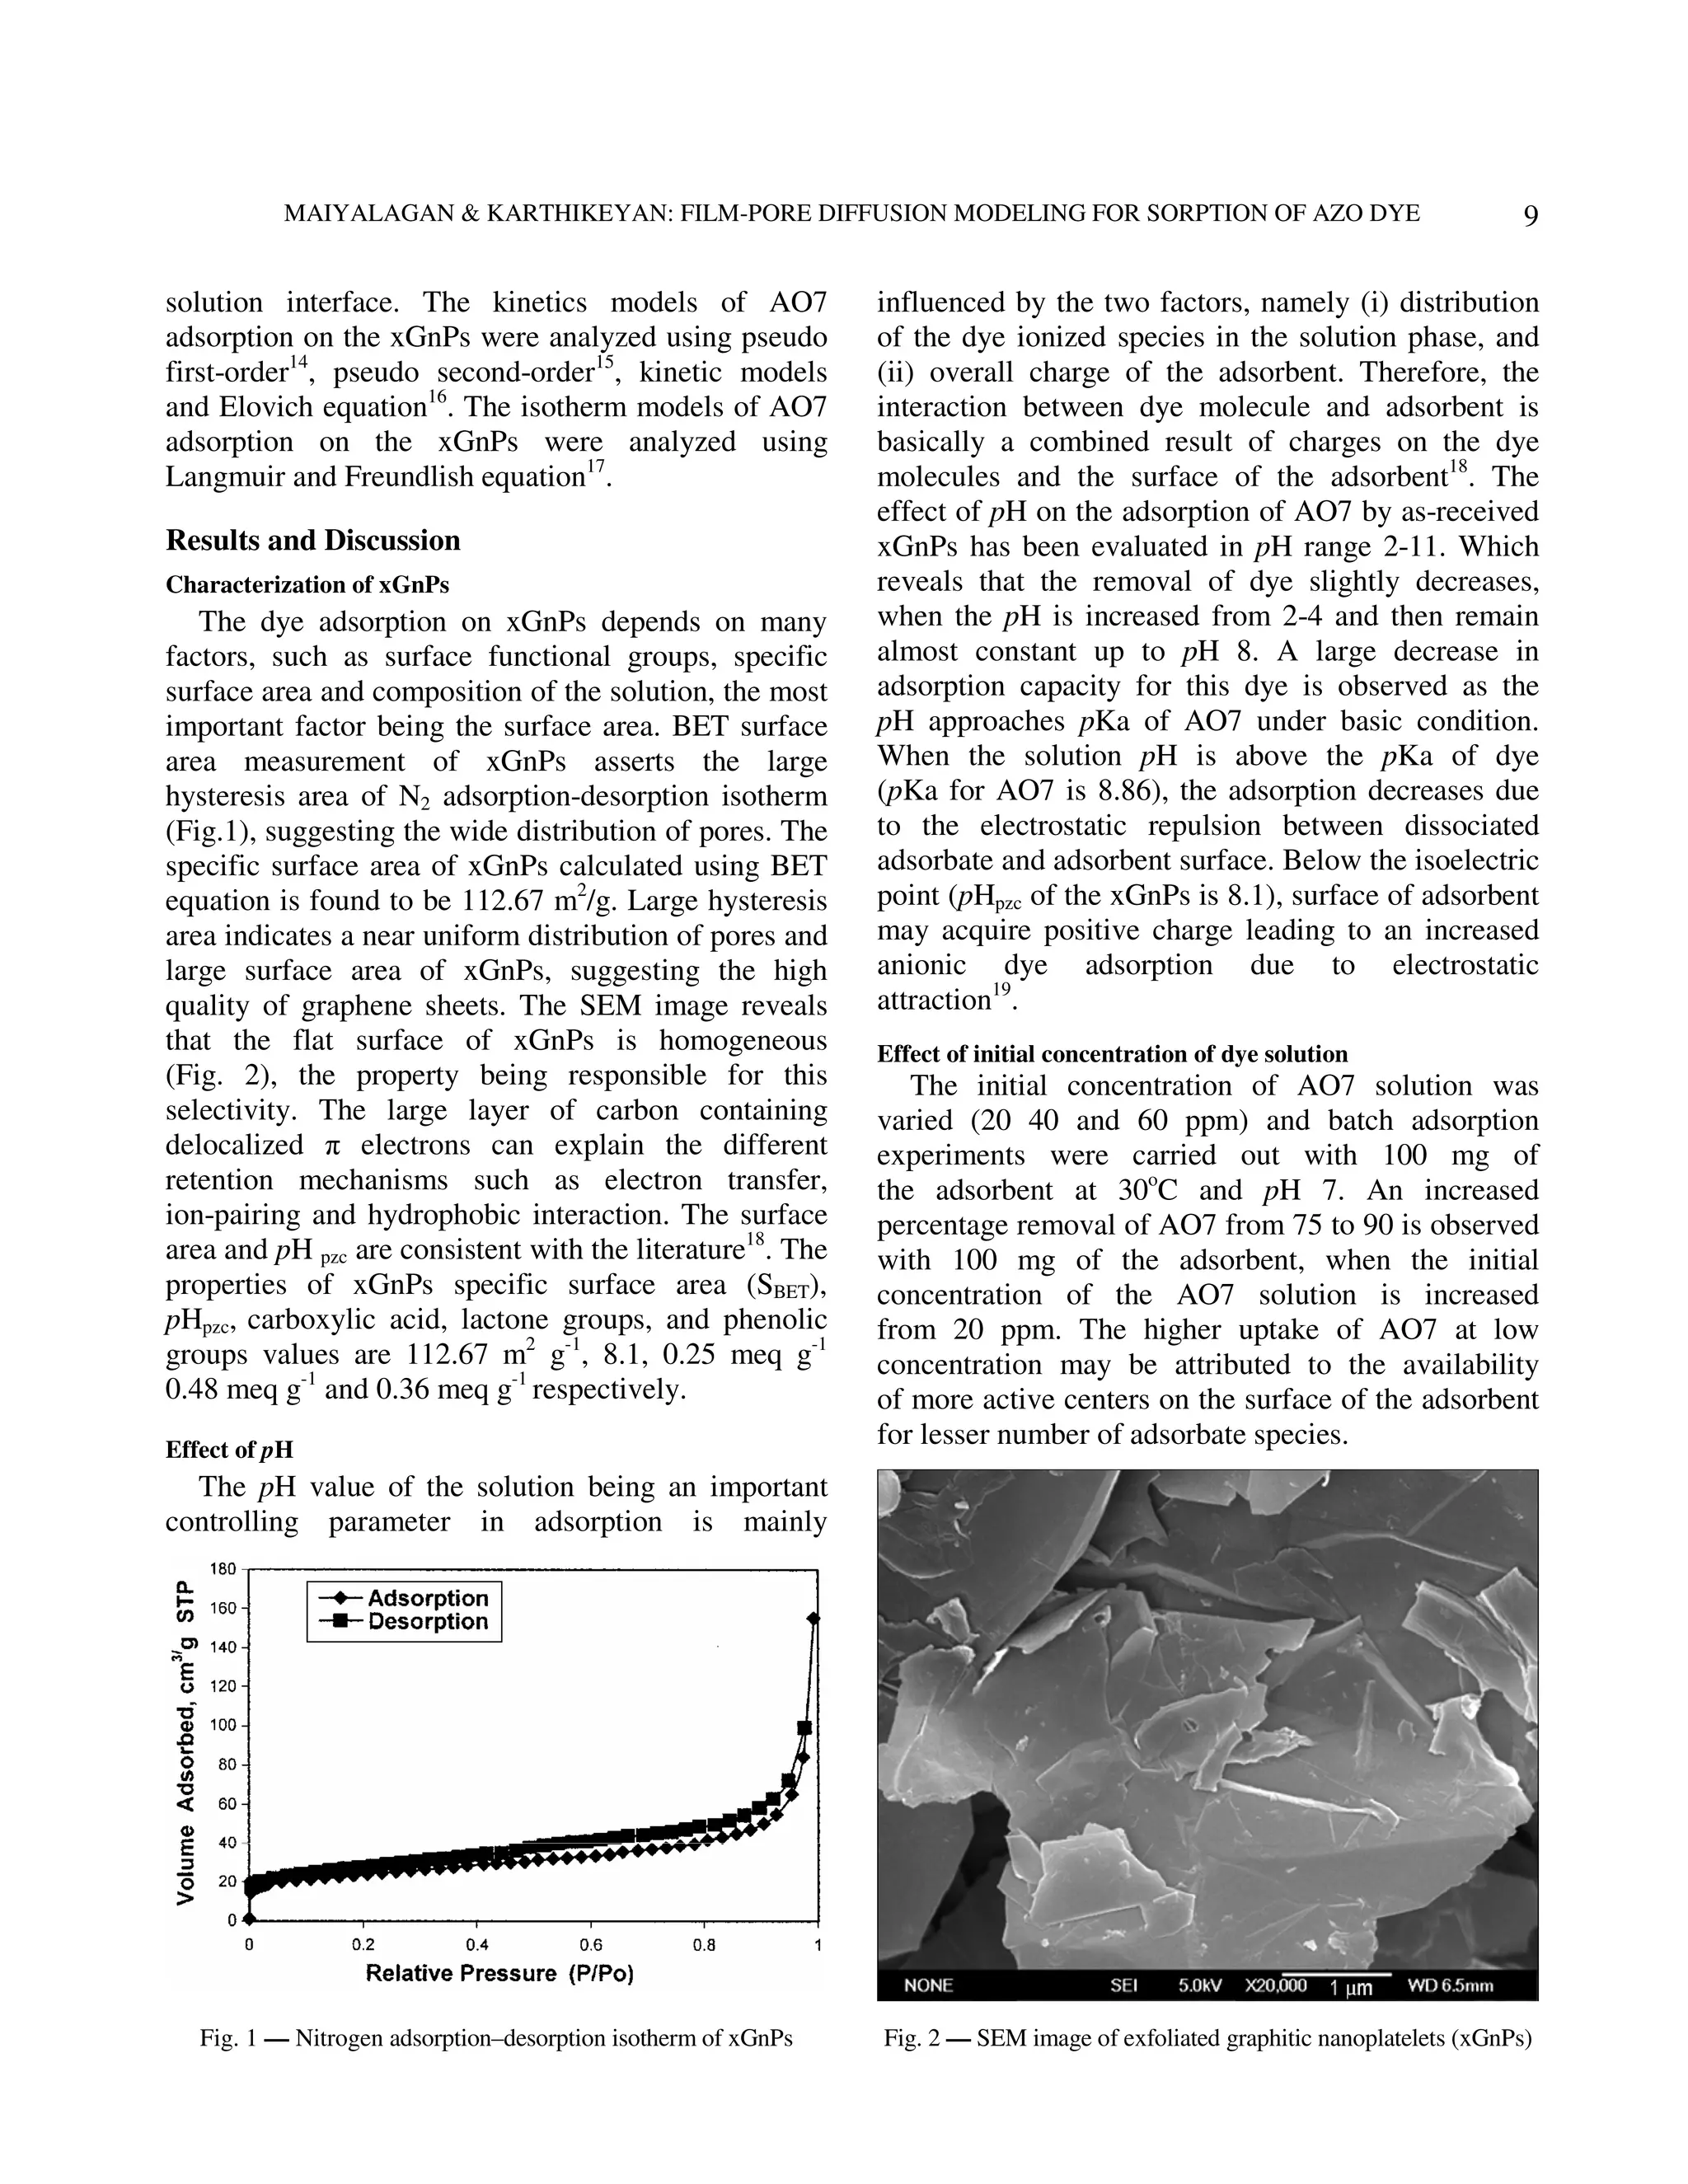
![12 INDIAN J. CHEM TECHNOL., JANUARY 2013
Table 3 –– Comparison of maximum adsorption capacity for (iii) adsorptions of the ingoing ion (adsorbate) on the
Acid orange 7 on other different adsorbents. interior surface of adsorbent.
Adsorbent Adsorption capacity Reference Out of these three processes the third process is
mg/g considered to be not the limiting step in the uptake of
Canola stalks 25.06 20 dyes on to xGnPs28. The remaining two steps impart
Beech wood sawdust 5.06 21 the following three possibilities:
Spent brewery grains 30.5 22 Case I − External transport < internal transport, where
Soil 3.47 23 rate is governed by particle diffusion.
Waste Brewery’s yeast 3.56 24
Case II − External transport > internal transport,
Untreated S. marginatum 35.62 25
Exfoliated graphitic 85.172 Present study
where rate is governed by external diffusion.
nanoplatelets Case III − External transport ≈ internal transport,
where the transport of the adsorbate ions to the
the rate of an adsorption process is controlled either
boundary may not be possible with significant rate,
by external diffusion, internal diffusion or by both
this may result into a possibility of formation of a
types of diffusion.
liquid film surrounded by the adsorbent particles with
The adsorption of adsorbent on graphene layer is a proper concentration gradient.
remarkably different from other conventional porous
carbons in several aspects. First, due to their two- In the present study, the quantitative treatment of
dimensional nano structure, the external surface the sorption dynamic is found in accordance with the
available for adsorption is considerably larger than the observation of Reichenberge29, as described by the
surface area arising from inner cavities. The following equation:
predominance of outer cavity surface area to inner cavity 6 ∞
1
surface area determines the adsorption characteristics of F =1−
π 2 ∑n
N −1
2
exp [ − n 2 β t ] … (3)
dyes on xGnPs. The adsorption on the external surface
of graphene nanoplatelets is more important than the where F is the fractional attainment of equilibrium at
adsorption inside micro/mesoporous cavities. Another time t; and n, the constant30.
noteworthy difference should be ascribed to the Qt
interstitial space between individual graphene sheets. F= … (4)
The dimension of this space is determined by the Q∞
relative positions among individual graphene sheets. where Q1 and Q∞ are the amounts adsorbed after time
In the batch mode contact time adsorption t and after infinite time respectively.
experiments, rapid stirring is maintained. This induces
AO7 from the solution to the external surface of
π 2 Di
B= = time constant … (5)
the adsorbent material and this step may control the r02
rate of the adsorption process26. To interpret the where Di is the effective diffusion coefficient of
experimental data it is necessary to recognize the adsorbate in the adsorbent phase; and ro, the radius of
steps involved in the process of adsorption that adsorbent particles.
govern the overall rate of removal of dye. The For energy observed values of F, corresponding
ingenious mathematical treatments recommended by values of Bt are derived from Reichenberg̕ s table38. In
Boyd et al.27 have been applied. These mathematical each case the plot of Bt vs time distinguishes between
treatments are found to be useful to distinguish the processes involved film diffusion and particles-
between particles diffusion and film diffusion. diffusion controlled rate of adsorption.
The successive steps in the adsorption dyes by Typical Bt vs time plots at the concentration
adsorbents are: 20 mg/L of AO7 adsorbed on xGnPs at different
(i) transport of adsorbates to the external surface of temperature are represented in Fig. 8. It is found to be
adsorbent (film diffusion); non-linear throughout the temperature 30, 45 and
(ii) transport of adsorbates within the pores of the 60°C, thus the process involved can be represented as
adsorbent, except for a small amount of film diffusion. At 30°C the adsorbent exhibits linearity
adsorption, which occurs on the external surface in Bt vs time plots in the entire concentration range,
(particle diffusion); and but the straight lines obtained do not pass through](https://image.slidesharecdn.com/film-porediffusionmodelingforsorptionofazodyeontoexfoliatedgraphiticnanoplatelets-130209001340-phpapp02/75/Film-pore-diffusion-modeling-for-sorption-of-azo-dye-on-to-exfoliated-graphitic-nanoplatelets-6-2048.jpg)
![MAIYALAGAN & KARTHIKEYAN: FILM-PORE DIFFUSION MODELING FOR SORPTION OF AZO DYE 13
values of ∆ S# reflect that no significant change
occurs in the internal structure of chosen adsorbent
using the adsorption process.
Conclusion
The study shows that xGnPs is an effective
adsorbent for the removal of AO7 from aqueous
solution. The adsorption of AO7 is dependent on the
initial concentration and agitation time. Equilibrium
of AO7 adsorption reaches at 160 min.
The pseudo first- and second-order equations
provide a best fit description for the sorption of
AO7 onto xGnPs related to Elovich model, but the
Fig. 8 –– Time vs Bt plots at different temperature of AO7 - xGnPs pseudo first-order correlation coefficient has better
adsorption correlation value than pseudo second-order equation,
Table 4 –– Values of energy of activation (Ea), entropy of Pseudo first-order equation is consider to be the
activation ( S#), effective diffusion coefficient (Di) and most appropriate due to high correlation coefficient
pre-exponential factor (Do) when compared to pseudo second-order equation, and
Parameter Value adsorption takes place via film diffusion process.
Di, cm2s-1 Langmuir and Freundlich adsorption isotherms
30° C 1.4687 × 10⁻¹¹ correlate the equilibrium adsorption data. The
45° C 1.313 × 10⁻¹¹ adsorption of AO7 onto xGnPs is an exothermic
60° C 1.093 × 10⁻¹¹ reaction based on enthalpy change values.
Ea, kJmol-1 -9.7153
S#, JK-1mol-1 -179.53 Acknowledgement
Do, cm2s-1 9.4932 × 10⁻¹² The authors acknowledge with thanks the support
origin, revealing thereby that the rate-determining of Department of Chemistry, Chikkanna Govt.
process is film diffusion at this temperature for Arts College, Tirupur and Sophisticated Analytical
chosen adsorbent. Instrument Facility, Indian Institute of Technology,
The Di values were also calculated for each Madras for characterization process.
adsorbent material at the three different temperatures
References
(30, 45 and 60°C) using Eq. (6), and the values 1 Kaviyarasan V, Mohan N, Kannan V, Ebenezer P &
observed specify that Di increases within increasing Karthikeyan S, Poll Res, 22 (1) (2003) 77.
temperature. This may be due to the increased 2 Behnajady M A, Modirshhla N, Daneshvar N & Rabbani M,
mobility of ions and decreased retarding forces acting Chem Eng J, 127 (2007) 167.
on diffusing ion. The energy of activation (Ea), 3 Gupta V K & Suhas, J Environ Manage, 90 (2009) 2313.
entropy of activation ( S#), and pre-exponential 4 Rafatullah M, Sulaiman O, Hashim R & Ahmad A, J Hazard
Mater, 177 (2010) 70.
constant (Do) analogous to the Arrhenius frequency 5 Rao G P, Lu C & Su F, Sep Purif Technol, 58 (2007) 224.
factor are evaluated indicating no significant change 6 Yao Y, Xu F, Chen M, Xu Z & Zhu Z, Bioresour Technol,
in the internal structure of xGnPs during the 101 (2010) 3040.
adsorption, as shown below: 7 Ji L L, Chen W, Zheng S R, Xu Z Y & Zhu D Q, Langmuir,
25 (2009) 11608.
Di = Do exp [− E a / RT ] … (6) 8 Li X & Gen G, Mater Lett, 63 (2009) 930.
9 Vieira F, Cisneros I, Rosa N G, Trindade G M & Mohallem
Do = (2.72d 2 kT / h) exp ∆S # / R
… (7) N D S, Carbon, 44 (12) (2006) 2590.
10 Tryba B, Morawski W A, Kalenczuk R J & Inagaki M, Spill
where d is the average distance between the Sci Technol B, 8 (5-6) (2003) 569.
successive exchange sites and is taken as 5 Å; and R, 11 Kalaitzidou K, Fukushima H & Drzal L T, Composites, 38
(2007) 1675.
h and k are the gas, plank and Boltzmann constants 12 Zu S Z & Han B H, J Phys Chem C, 113 (31) (2009) 13651.
respectively. The values of Ea, Di, Do, ∆ S# and other 13 Lopez-Ramon M V, Stoeckli F, Moreno-Castilla C &
parameters are given in the Table 4. The negative Carrasco-Marin F, Carbon, 37 (1999) 1215.](https://image.slidesharecdn.com/film-porediffusionmodelingforsorptionofazodyeontoexfoliatedgraphiticnanoplatelets-130209001340-phpapp02/75/Film-pore-diffusion-modeling-for-sorption-of-azo-dye-on-to-exfoliated-graphitic-nanoplatelets-7-2048.jpg)

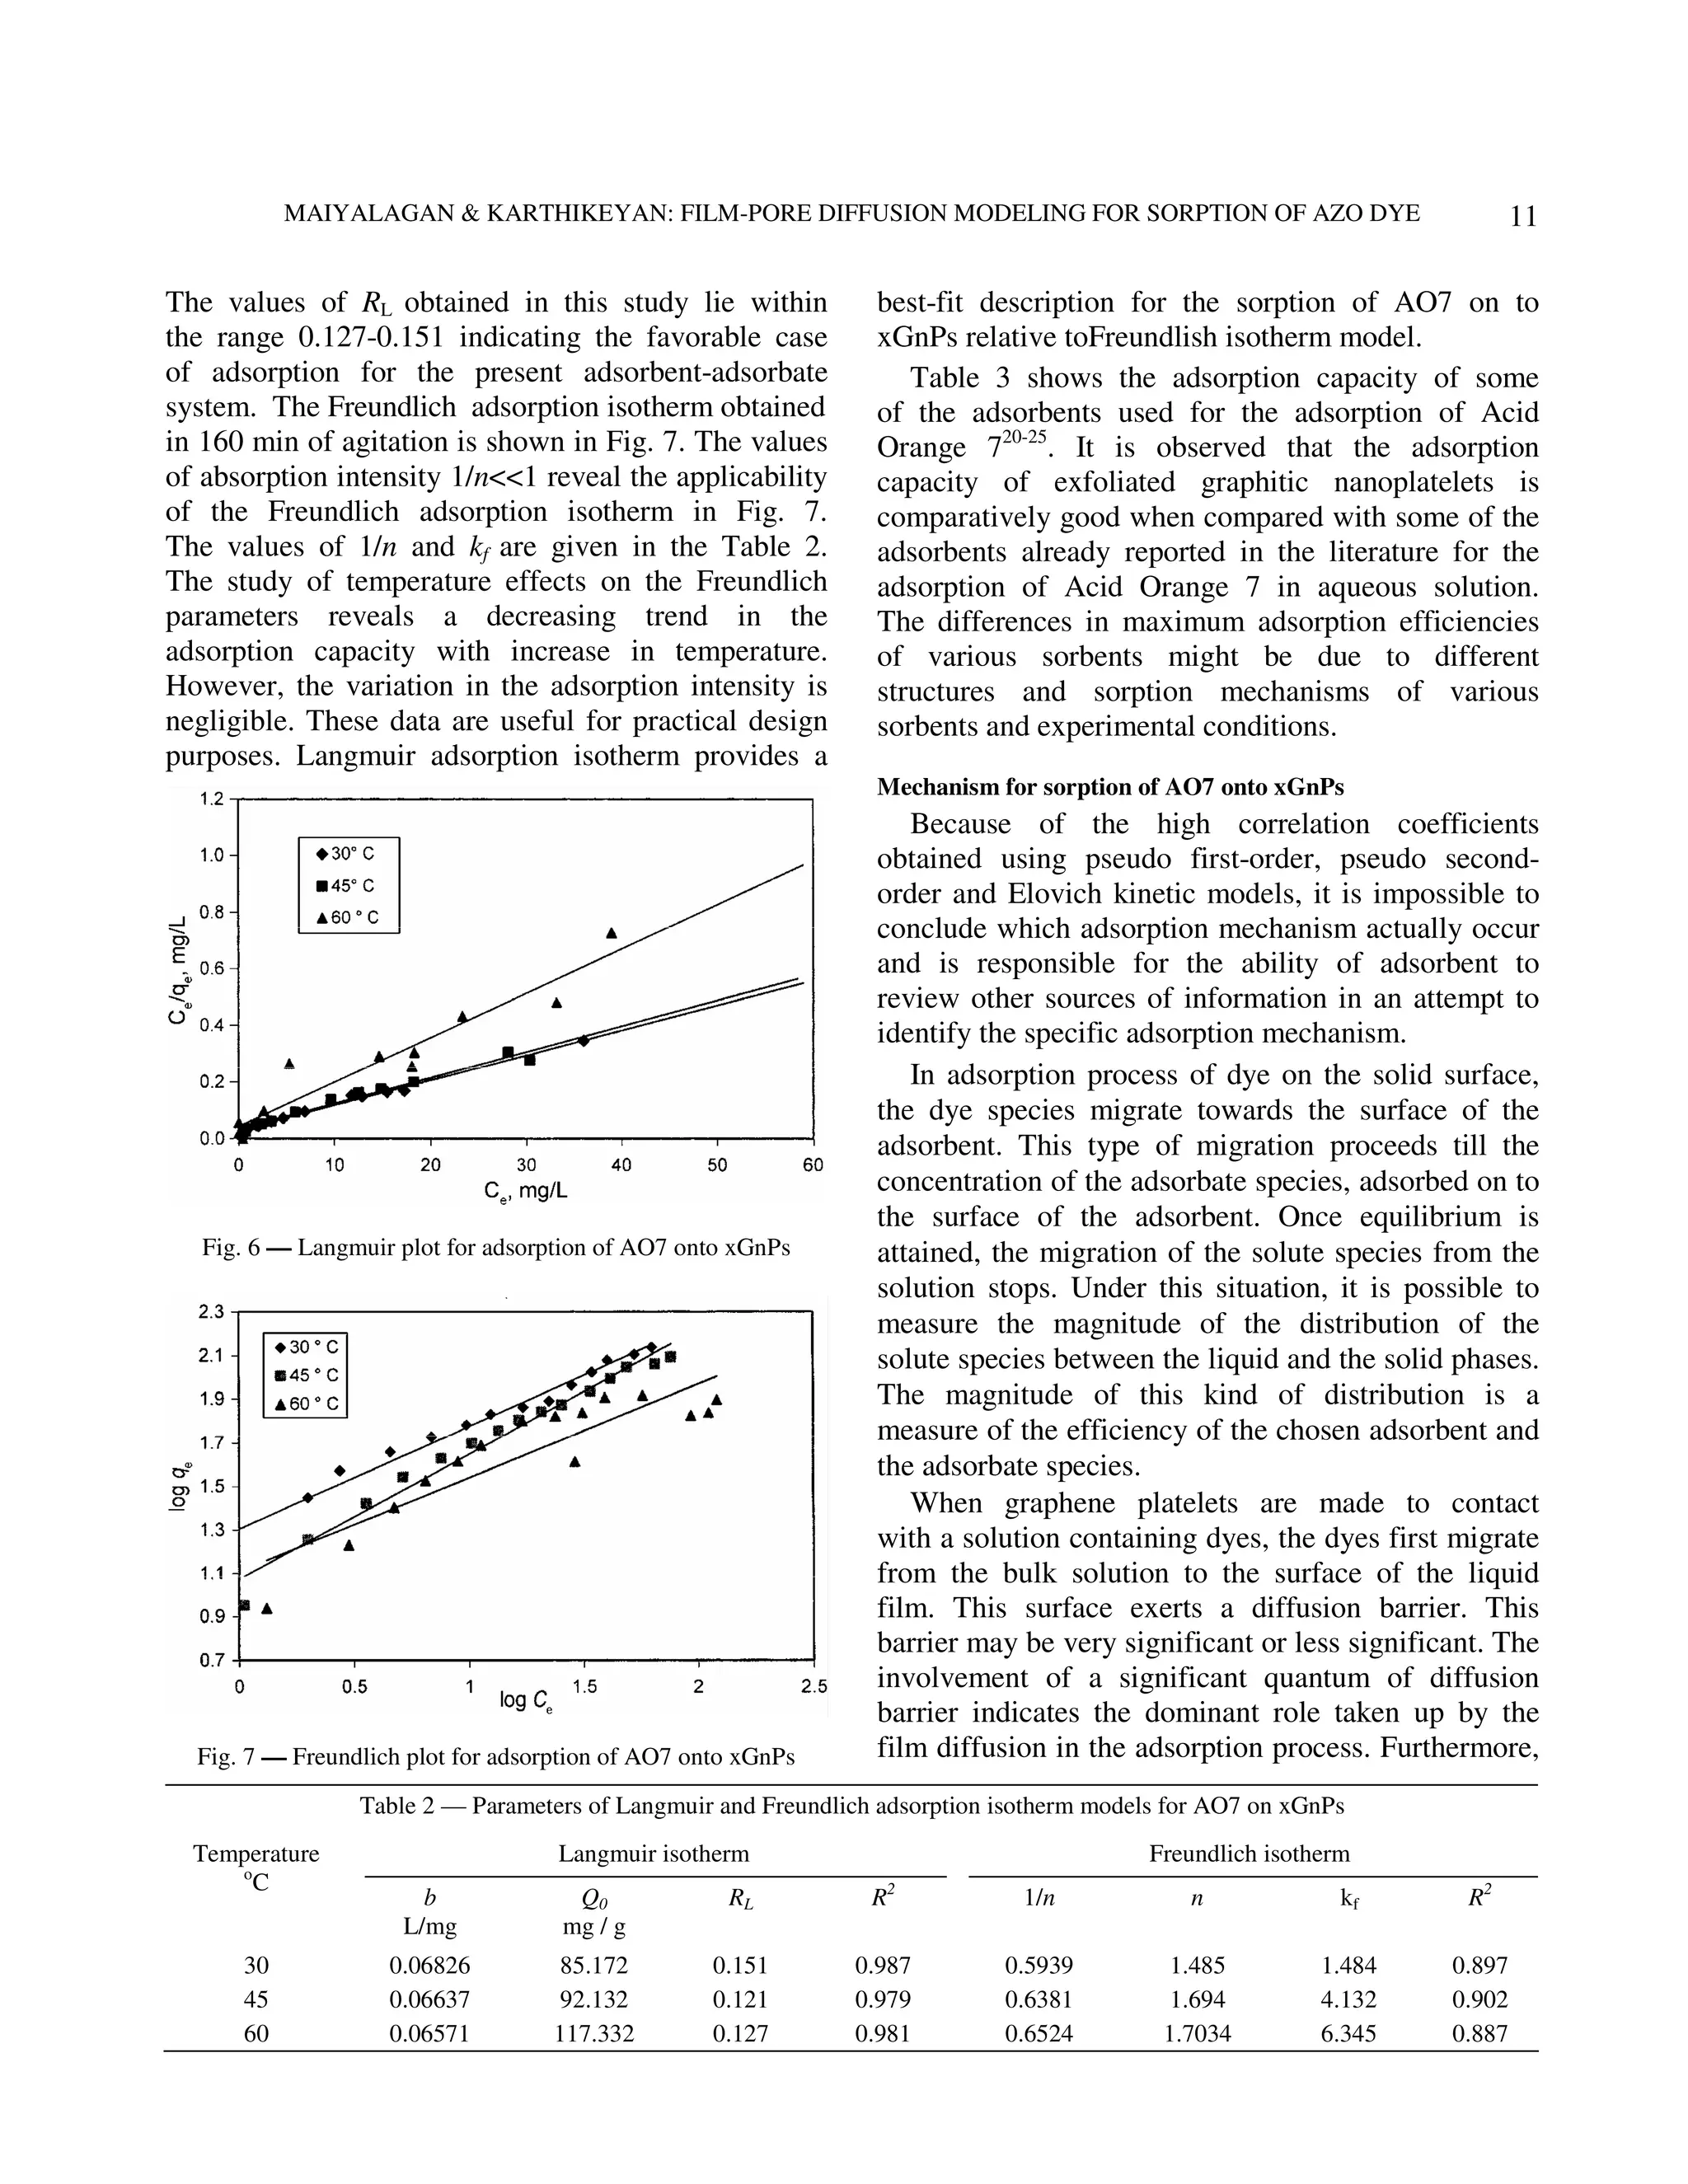
The document describes research on using exfoliated graphitic nanoplatelets (xGnPs) to adsorb the azo dye Acid Orange 7 from aqueous solutions. The effects of temperature, pH, and initial dye concentration on the adsorption process were studied. Kinetic data fit the pseudo-first-order and pseudo-second-order models well. Adsorption isotherms followed the Langmuir model. Analysis of the kinetics and isotherms provided insight into the adsorption mechanism and rate determining steps. The xGnPs were found to efficiently and effectively remove the acid dye from solutions through an exothermic adsorption process governed by chemical reaction kinetics.


![11.[30 39]sorption kinetics for dye removal from aqueous solution using natur...](https://cdn.slidesharecdn.com/ss_thumbnails/11-30-39sorptionkineticsfordyeremovalfromaqueoussolutionusingnaturalclay-120512235656-phpapp02-thumbnail.jpg?width=640&height=640&fit=bounds)


