The document discusses a study on the identification of hydrophobic sites on protein surfaces using bromophenol blue (bpb) and absorption difference spectroscopy, highlighting its advantages over traditional fluorescence methods. It outlines the strong intrinsic quenching of fluorescence in hydrophobic interactions and presents findings that absorption difference spectroscopy can measure binding constants without interference from quenchers. A binding constant of 3 × 10^6 M^-1 for bpb to bovine serum albumin (BSA) was determined, indicating the method's effectiveness for investigating protein interactions.
![ANALYTICAL
BIOCHEMISTRY
Analytical Biochemistry 313 (2003) 187–195
www.elsevier.com/locate/yabio
The identification of hydrophobic sites on the surface
of proteins using absorption difference spectroscopy
of bromophenol blue
M. Bertsch, A.L. Mayburd, and R.J. Kassner*
Department of Chemistry, University of Illinois at Chicago, Science and Engineering South 845 West Taylor Street,
Rm. 4500, Chicago, IL 60607, USA
Received 21 May 2002
Abstract
Hydrophobic sites on the surface of protein molecules are thought to have important functional roles. The identification of such
sites can provide information about the function and mode of interaction with other cellular components. While the fluorescence
enhancement of polarity-sensitive dyes has been useful in identifying hydrophobic sites on a number of targets, strong intrinsic
quenching of Nile red and ANSA dye fluorescence is observed on binding to a cytochrome c0 . Fluorescence quenching is also
observed to take place in the presence of a variety of other biologically important molecules which can compromise the quantitative
determination of binding constants. Absorption difference spectroscopy is shown not to be sensitive to the presence of fluorescence
quenchers but sensitive enough to measure binding constants. The dye BPB is shown to bind to the same hydrophobic sites
on proteins as polarity-sensitive fluorescence probes. The absorption spectrum of BPB is also observed to be polarity sensitive.
A binding constant of 3 Â 106 MÀ1 for BPB to BSA has been measured by absorption difference spectroscopy. An empirical
correlation is observed between the shape of the absorption difference spectrum of BPB and the polarity of the environment. The
results indicate that absorption difference spectroscopy of BPB provides a valuable supplement to fluorescence for determining
the presence of hydrophobic sites on the surface of proteins as well as a method for measuring binding constants.
Ó 2003 Elsevier Science (USA). All rights reserved.
Keywords: Protein structure; Hydrophobic sites; Polarity-sensitive dyes; Absorption difference; Fluorescence spectroscopy
It is well known that hydrophobic interactions are pathogen for susceptibility to predominantly hydro-
important determinants of protein structure and that phobic antibiotics [9], protein folding [10], and design of
most hydrophobic groups of amino acid residues enzymatic assays accompanied by release or uptake of a
are found in the interior of proteins. When hydrophobic hydrophobic molecule [11].
groups are found on the surface of proteins, they are A number of physical and spectroscopic approaches
often thought to have functional roles as interaction have been used to determine the presence of hydro-
sites for small molecules, other proteins, and mem- phobic sites on proteins, including hydrophobic in-
branes. Hydrophobic regions in proteins have thus been teraction chromatography [12,13] and fluorescence
the objects of numerous studies. These studies include [1,2,4–6,14–17]. Changes in the intrinsic fluorescence
detection of hydrophobic sites by binding to micelles [1], of tyrosine and tryptophan and quenching of the
active sites of enzymes [2,3], pH and ligand-induced fluorescence of exposed tyrosine and tryptophan resi-
conformational changes [4–6], medically important po- dues have been used to identify the presence of these
lymerizations and aggregations [7,8], screening of a groups on the surface of proteins [14]. A number of
extrinsic environmentally sensitive fluorescence probes
have also been used to identify hydrophobic sites on
*
Corresponding author. Fax: 1-312-996-0431. the surface of proteins. Environmentally sensitive
E-mail address: rkassner@uic.edu (R.J. Kassner). fluorescent probes related to 8-anilino-1-naphthalene-
0003-2697/03/$ - see front matter Ó 2003 Elsevier Science (USA). All rights reserved.
PII: S 0 0 0 3 - 2 6 9 7 ( 0 2 ) 0 0 5 9 0 - 0](https://image.slidesharecdn.com/absdiffspectrbpb-13559620632321-phpapp01-121219181429-phpapp02/85/Absorption-Difference-Spectroscopy-BPB-1-320.jpg)
![ANALYTICAL
BIOCHEMISTRY
Analytical Biochemistry 313 (2003) 187–195
www.elsevier.com/locate/yabio
The identification of hydrophobic sites on the surface
of proteins using absorption difference spectroscopy
of bromophenol blue
M. Bertsch, A.L. Mayburd, and R.J. Kassner*
Department of Chemistry, University of Illinois at Chicago, Science and Engineering South 845 West Taylor Street,
Rm. 4500, Chicago, IL 60607, USA
Received 21 May 2002
Abstract
Hydrophobic sites on the surface of protein molecules are thought to have important functional roles. The identification of such
sites can provide information about the function and mode of interaction with other cellular components. While the fluorescence
enhancement of polarity-sensitive dyes has been useful in identifying hydrophobic sites on a number of targets, strong intrinsic
quenching of Nile red and ANSA dye fluorescence is observed on binding to a cytochrome c0 . Fluorescence quenching is also
observed to take place in the presence of a variety of other biologically important molecules which can compromise the quantitative
determination of binding constants. Absorption difference spectroscopy is shown not to be sensitive to the presence of fluorescence
quenchers but sensitive enough to measure binding constants. The dye BPB is shown to bind to the same hydrophobic sites
on proteins as polarity-sensitive fluorescence probes. The absorption spectrum of BPB is also observed to be polarity sensitive.
A binding constant of 3 Â 106 MÀ1 for BPB to BSA has been measured by absorption difference spectroscopy. An empirical
correlation is observed between the shape of the absorption difference spectrum of BPB and the polarity of the environment. The
results indicate that absorption difference spectroscopy of BPB provides a valuable supplement to fluorescence for determining
the presence of hydrophobic sites on the surface of proteins as well as a method for measuring binding constants.
Ó 2003 Elsevier Science (USA). All rights reserved.
Keywords: Protein structure; Hydrophobic sites; Polarity-sensitive dyes; Absorption difference; Fluorescence spectroscopy
It is well known that hydrophobic interactions are pathogen for susceptibility to predominantly hydro-
important determinants of protein structure and that phobic antibiotics [9], protein folding [10], and design of
most hydrophobic groups of amino acid residues enzymatic assays accompanied by release or uptake of a
are found in the interior of proteins. When hydrophobic hydrophobic molecule [11].
groups are found on the surface of proteins, they are A number of physical and spectroscopic approaches
often thought to have functional roles as interaction have been used to determine the presence of hydro-
sites for small molecules, other proteins, and mem- phobic sites on proteins, including hydrophobic in-
branes. Hydrophobic regions in proteins have thus been teraction chromatography [12,13] and fluorescence
the objects of numerous studies. These studies include [1,2,4–6,14–17]. Changes in the intrinsic fluorescence
detection of hydrophobic sites by binding to micelles [1], of tyrosine and tryptophan and quenching of the
active sites of enzymes [2,3], pH and ligand-induced fluorescence of exposed tyrosine and tryptophan resi-
conformational changes [4–6], medically important po- dues have been used to identify the presence of these
lymerizations and aggregations [7,8], screening of a groups on the surface of proteins [14]. A number of
extrinsic environmentally sensitive fluorescence probes
have also been used to identify hydrophobic sites on
*
Corresponding author. Fax: 1-312-996-0431. the surface of proteins. Environmentally sensitive
E-mail address: rkassner@uic.edu (R.J. Kassner). fluorescent probes related to 8-anilino-1-naphthalene-
0003-2697/03/$ - see front matter Ó 2003 Elsevier Science (USA). All rights reserved.
PII: S 0 0 0 3 - 2 6 9 7 ( 0 2 ) 0 0 5 9 0 - 0](https://image.slidesharecdn.com/absdiffspectrbpb-13559620632321-phpapp01-121219181429-phpapp02/75/Absorption-Difference-Spectroscopy-BPB-1-2048.jpg)
![188 M. Bertsch et al. / Analytical Biochemistry 313 (2003) 187–195
sulfonic acid (ANSA)1 [15] have been most widely Materials and methods
used to study hydrophobic sites including 4; 40 -bis
[1-(phenylamino)-8-naphthalenesulfonate] (bis-ANS) [16], Reagents
2-(40 -(iodoacetamido)anilino)naphthalene-6-sulfonic acid
(IAANSA) [2], 2-(p-toluidinol)naphthalene-6-sulfonic The sodium salt of BPB (Fig. 1) was obtained from
acid (TNS) [4], N-phenyl-1-naphthylamine (NPN) [9], Aldrich. BSA (A2153), Nile red (NR, Fig. 1), 8-anilino-1-
6-acryloyl-2-dimethylaminonaphthalene (acrylodan, AD), naphthalenesulfonic acid (Fig. 1), and tris(hydroxy-
and 6-bromoacetyl-2-dimethylaminonaphthalene (badan, methyl)aminomethane (Tris) were obtained from Sigma.
BD) [5]. The fluorescence of these dyes is red-shifted and Recombinant cytochrome c0 , from Chromatium vino-
strongly quenched in a polar aqueous environment sum, was obtained by expressing the pBluescript II SK+
and progressively blue-shifted and greatly enhanced as clone [22] in Escherichia coli W3110 strain grown under
the solvent becomes less polar, approaching a maxi- semianaerobic growth in LB media, containing ampicillin
mum blue shift and intensity in hydrocarbon solvents and 1 mM KNO3 [23].
or when bound to hydrophobic sites of proteins.
Nile red [17] and 12-N-methylanthraniloylphorbol Fluorimetric measurements
13-acetate (sapintoxin D) [6] are other environmentally
sensitive fluorescent probes that have been used to The binding constants for ANSA and Nile red to
identify hydrophobic sites on the surface of proteins. BSA were determined by fluorimetric titration of ANSA
The fluorescence of Nile red has been shown to be with BSA or NR with BSA, using a Hitachi F-4500
strongly dependent on the polarity of the environment fluorescence spectrometer. After each addition of ti-
being red-shifted and strongly quenched in a polar trant, the system was allowed to reach equilibrium
aqueous environment and progressively blue-shifted and ($6 min) before the fluorescence was measured. The
greatly enhanced as the solvent becomes less polar, ap- measured fluorescence was corrected for dilution asso-
proaching a maximum blue shift and intensity in hy- ciated with the addition of titrant in all experiments. The
drocarbon solvents or when bound to hydrophobic sites initial fluorescence of ANSA (or NR) was subtracted
of proteins. Polarity-sensitive fluorescent probes have from the fluorescence corrected for dilution. A simple
also been shown to be useful in identifying conforma-
tional changes in proteins that lead to exposed hydro-
phobic groups following binding of effector molecules,
changes in pH, and denaturation [4–6]. While environ-
mentally sensitive fluorescent molecules are valuable
probes for hydrophobic sites on many or even most
proteins, the search for hydrophobic targets using fluo-
rescence enhancement may encounter complications due
to quenching by other molecules in solution. Among the
quenching species normally associated with a living
system, one can list molecular oxygen and nitrous oxide
[18], histidine, cysteine, protons, NOÀ ; Cu2þ , and other
3
electron scavengers [19]. Caffeine has also been shown
[20] to interfere with the detection of Ca2þ by fluorescent
dyes. Purines and pyrimidines [21] have also been shown
to quench the fluorescence of dyes. A surface hydro-
phobic site in a protein may not be identified due to
quenching of the fluorescence by other molecules in the
solution or the protein under consideration. In this re-
port we show that absorption difference spectroscopy
provides an alternative approach to fluorescence for
identifying surface hydrophobic sites on proteins.
1
Abbreviations used: ANSA, 8-anilino-1-naphthalenesulfonic acid;
bis-ANS, 4; 40 -bis[1-(phenylamino)-8-naphthalenesulfonate]; IAANSA,
2-(40 -iodoacetamido)anilino)naphthalene-6-sulfonic acid; TNS, 2-(p-
toluidinol)naphthalene-6-sulfonic acid; NPN, 6-acryloyl-2-dimethyla-
minonaphthalene; BD, 6-bromoacetyl-2-dimethylaminonaphthalene;
BPB, bromophenol blue; BSA, bovine serum albumin; NR, Nile red. Fig. 1. Structures of Nile red, ANSA, and BPB.](https://image.slidesharecdn.com/absdiffspectrbpb-13559620632321-phpapp01-121219181429-phpapp02/85/Absorption-Difference-Spectroscopy-BPB-2-320.jpg)
![M. Bertsch et al. / Analytical Biochemistry 313 (2003) 187–195 189
binding model involving a 2:1 stoichiometric ratio of Absorption difference measurements
components in the complex was observed, assuming that
the two BSA binding sites are noninteracting and The titration of BPB with BSA was performed by
equivalent, absorption difference spectroscopy in standard single-
BSA þ ANSA ( BSA Á ANSA
) ð1Þ compartment cuvettes using the CARY14/OLIS spec-
trophotometer. Both cuvettes contained BPB solution.
K ¼ ½BSA Á ANSAŠ=ð½ANSAŠ½BSAŠÞ; ð2Þ The BSA aliquots were added to the sample cuvette, and
where K is the binding constant. the same volumes of 0.100 M Tris buffer, pH 8.0, were
added to the reference cuvette at each titration step. The
½ANSAŠ ¼ ½ANSAŠ0 À ½BSA Á ANSAŠ; ð3Þ
BPB concentration was determined from the absorbance
where ½ANSAŠ0 is the total concentration of ANSA, and of BPB solution at 620 nm. The molar absorption co-
½BSAŠ ¼ ½BSAŠ0 À ½BSA Á ANSAŠ; ð4Þ efficient of 7:26 Â 104 MÀ1 cmÀ1 for the BPB solution in
0.100 M Tris buffer, pH 8.0, was determined from two
where ½BSAŠ0 is the total concentration of BSA binding preparations of concentrated BPB solutions by weight
sites, equal to twice the protein concentration. Then, and duplicate measurements of absorbance at 620 nm.
½BSA Á ANSAŠ ¼ ðF =F100 Þ½ANSAŠ0 ð5Þ Positive absorbance differences at 620 nm were used in
the determination of the binding constant of BPB to
½ANSAŠ ¼ ½ANSAŠ0 À ðF =F100 Þ½ANSAŠ0 ð6Þ BSA. An equation analogous to Eq. (8) was used for
fitting of the absorption difference titration data. The
½BSAŠ ¼ ½BSAŠ0 À ðF =F100 Þ½ANSAŠ0 ; ð7Þ presence of two equivalent noninteracting sites for BPB
where F is the fluorescence at each concentration of BSA binding to BSA was confirmed by a JobÕs continuous
corrected for the small initial fluorescence of ANSA and variation experiment analogous to the BSAÁANSA ex-
F100 is the fluorescence corresponding to 100% complex periment described above. The molar ratio (or the BPB
formation. The fluorescence of BSA alone is very small molar fraction) corresponding to the solution with
in aqueous solution compared to that of the complex maximum absorbance difference at 620 nm indicates the
such that it was not necessary to correct the observed stoichiometry of the complex.
fluorescence for the contribution of added BSA. The titration of BSA with NR was performed by
Substituting (5), (6), and (7) into 2 and solving for F absorption difference spectroscopy in dual cuvettes us-
gives the final explicit fitting model: ing the Lambda 6 UV/VIS Perkin–Elmer spectropho-
tometer as previously described [27]. One compartment
F ¼ ðF100 ðK½ANSAŠ0 þ K½BSAŠ0 þ 1Þ
of the sample cuvette contains BSA and the other
2
À F100 ððK½ANSAŠ0 þ K½BSAŠ0 þ 1Þ compartment contains buffer. Likewise, one compart-
1=2 ment of the reference cuvette contains BSA and the
À 4K 2 ½ANSAŠ0 ½BSAŠ0 Þ Þ=ð2K½ANSAŠ0 Þ: ð8Þ
other buffer. In the titration, NR was added to the BSA
The total concentration of BSA-binding sites, ½BSAŠ0 , compartment of the sample cuvette and to the buffer
was twice the BSA protein concentration determined compartment of the reference cuvette. Positive absor-
from the absorbance of BSA solution at 278 nm, using a bance differences at 600 nm were used in the determi-
molar absorption coefficient of 4:44 Â 104 MÀ1 cmÀ1 nation of the binding constant of NR to BSA.
[24]. The concentration of ANSA was obtained from the The binding constant for ANSA to cytochrome c0
absorbance of ANSA solution at 350 nm, using a molar was determined spectrophotometrically from the com-
absorption coefficient of 6:3 Â 103 MÀ1 cmÀ1 [24]. The petitive effect of ANSA on the binding of BPB based on
presence of two equivalent noninteracting sites for the known binding constant for BPB to the cytochrome
ANSA binding to BSA was confirmed by a JobÕs con- [27] according to the following expressions,
tinuous variation experiment [25,26]. Briefly, solutions P þA( PÁA ) ð9Þ
of varying BSA:ANSA molar ratios were prepared,
while keeping the total molarity of the protein and dye KPA ¼ ½P Á AŠ=ð½PŠ½AŠÞ ð10Þ
constant. Under these conditions, the molar ratio (or the
dye molar fraction) corresponding to the solution with PþB( PÁB
) ð11Þ
maximum fluorescence emission indicates the stoichi-
KPB ¼ ½P Á BŠ=ð½PŠ½BŠÞ; ð12Þ
ometry of the complex. Sigma Plot 2000 was used to fit
changes in the observed fluorescence, F, to changes in where P is the concentration of protein binding sites, A
the concentration of added BSA according to Eq. (8). is the ligand of known binding constant, KPA , and B is
The goodness of fit was verified by plotting the experi- the ligand of unknown binding constant, KPB .
mental data and theoretical curve corresponding to Eq. PÁAþB( PÁBþA
) ð13Þ
(8) fitted with K. An analogous equation was used for
the titration of NR with BSA. K ¼ ½P Á BŠ½AŠ=ð½P Á AŠ½BŠ ¼ KPB =KPA ð14Þ](https://image.slidesharecdn.com/absdiffspectrbpb-13559620632321-phpapp01-121219181429-phpapp02/85/Absorption-Difference-Spectroscopy-BPB-3-320.jpg)
![190 M. Bertsch et al. / Analytical Biochemistry 313 (2003) 187–195
½PAŠ þ ½PBŠ ¼ ½PŠ0 ð15Þ
½PBŠ=½PAŠ ¼ ðS0 À SÞ=ðS À SF Þ; ð16Þ
where S0 is the initial absorbance difference of P Á A, S is
the intermediate absorbance difference at each concen-
tration of B and SF is the final absorbance of P Á B. In
the competitive titration of the cytochrome c0 Á BPB
(P Á A) complex with ANSA (B), S0 and S correspond to
the sum of the positive absorbance difference at 610 nm
and negative absorbance difference at 580 nm, whereas
in the competitive titration of the BSA-BPB complex
with ANSA, S0 and S correspond to the positive ab-
sorbance difference at 620 nm. During the titration of
P Á A with B,
½AŠ ¼ ½AŠ0 À ½P Á AŠ % ½AŠ0 ð17Þ
½BŠ ¼ ½BŠ0 À ½P Á BŠ; ð18Þ
where ½AŠ0 and ½BŠ0 are the total concentrations of A and
B, respectively. Substituting Eqs. (16)–(18) into (14)
gives:
KPB =KPA ¼ ðS0 À SÞ=ðS À SF Þ½AŠ0
=ð½BŠ0 À ½PŠ0 ðS0 À SÞ=ðS0 À SF ÞÞ: ð19Þ
In the absorption difference titration, SF is zero yielding
the following equation
ðS0 À SÞ=S ¼ ðKPB =KPA Þð½BŠ0 À ½PŠ0 ðS0 À SÞ=S0 Þ=½AŠ0 : Fig. 2. (A) Fluorometric titration of 2.5 lM ANSA with BSA in
ð20Þ 100 mM Tris, pH 8.0. Measurements on Hitachi F-4500 fluorescence
spectrometer, excitation at 370 nm, 2.5 nm excitation, and 10 nm
Under conditions for which ½BŠ0 is much greater than emission slit widths. Emission spectra A–I correspond to concentra-
½PŠ0 , KPB can be determined from the slope of a plot of tions of BSA-binding sites from 0.0 to 15.4 lM. (B) Dots correspond to
emission at 465 nm for spectra A–I in (A). The solid line is the theo-
ðS0 À SÞ=S vs ½BŠ0 , KPA and ½AŠ0 . Alternatively, KPB was
retical curve with fitted value of K.
determined by fitting the following explicit form of Eq.
(20):
S ¼ ½AŠ0 ðÀS0 ð1 þ K½BŠ0 =½AŠ0 À K½PŠ0 =½AŠ0 Þ constant, K. An equilibrium constant was also deter-
þ 2
ðS0 ð1 þ K=½AŠ0 ð½BŠ0 À ½PŠ0 ÞÞ
2 mined for the binding of NR to BSA by following the
fluorescence enhancement at 600 nm with excitation at
þ 4K½PŠ0 S0 =½AŠ0 Þ1=2 Þ=ð2K½PŠ0 Þ:
2
ð21Þ 510 nm. The binding constants are indicated in Table 1.
It was recently reported [27] that BPB binds to the
dimeric cytochrome c0 from C. vinosum with a stoichi-
ometry of one BPB per monomer and a binding con-
Results
stant of 4:2 Â 105 MÀ1 . The mode of binding was
As noted earlier, several studies have identified sur-
face hydrophobic sites on proteins by observing the
Table 1
fluorescence enhancement of polarity sensitive dyes like Association constants ðMÀ1 Þ for polarity-sensitive chromophoric and
ANSA and NR on addition to the proteins. Fig. 2A fluorophoric ligands and proteins determined by absorption difference
shows the fluorescence emission spectra of a solution of (A) and fluorescence (F)
ANSA during titration with increments of BSA. The Protein BPB NR ANSA
figure shows an increase in the fluorescence, which ap-
BSA 3ð2Þ Â 106 1:0ð0:1Þ Â 106 1:2ð0:1Þ Â 106
proaches a maximum as the ANSA is fully complexed to (A) (F) (F)
the protein. Fig. 2B shows a plot of the emission in- 9:5ð0:5Þ Â 105
tensity at 465 nm corresponding to spectra A–I in Fig. (A)
2B. The solid line in Fig. 2B is the theoretical curve Cytochrome c0 1:2ð0:2Þ Â 105 5ð1Þ Â 103
(A) (A)
corresponding to Eq. (8) fitted with the binding](https://image.slidesharecdn.com/absdiffspectrbpb-13559620632321-phpapp01-121219181429-phpapp02/85/Absorption-Difference-Spectroscopy-BPB-4-320.jpg)
![M. Bertsch et al. / Analytical Biochemistry 313 (2003) 187–195 191
cytochrome c0 is nonlinear (plot not shown). The up-
ward curvature of the plot is consistent with a combi-
nation of dynamic and static quenching mechanisms.
This apparent fluorescence quenching by cellular cyto-
chrome c0 suggested that detection of a surface hydro-
phobic site on a protein by polarity sensitive fluorescent
dyes might be compromised by internal quenching as-
sociated with a prosthetic group close to the hydro-
phobic site.
Absorption difference spectroscopy was thus investi-
gated as an alternative method to identify the presence
Fig. 3. Anomalous effect of cytochrome c0 on the fluorescence of po-
of hydrophobic sites in proteins and measure the bind-
larity-sensitive dyes. Hitachi F-4500 fluorescence spectrometer, 10 nm ing constants of these sites with polarity-sensitive chro-
excitation and 10 nm emission slit widths. (A) Emission of 6.7 lM NR mophores. Earlier studies have indicated that NR
at 650 nm in 100 mM Tris, pH 8.0, with increasing concentrations of exhibits absorption as well as emission blue shifts in
cytochrome c0 from Chromatium vinosum. Excitation is at 500 nm. (B) nonpolar environments [17]. Fig. 4A shows the results of
Emission of 33 lM ANSA at 500 nm in 100 mM Tris, pH 8.0, with
increasing concentrations of cytochrome c0 from Chromatium vinosum.
an absorption difference titration of BSA with NR. The
Excitation is at 380 nm. figure indicates that binding of NR to BSA is charac-
terized by large absorbance differences with a maximum
at about 550 nm. Fig. 4B shows the effect of solvent
suggested to be hydrophobic and a large surface hy- polarity on the absorption spectrum of NR as a model
drophobic patch was identified by analysis of the crystal for the effect of protein environment on NR in BSA. The
structure using Rasmol. An attempt was made to con- absorption spectrum of NR has a broad absorption
firm the presence of the surface hydrophobic patch by band in water with a maximum at $590 nm. The ab-
fluorescence enhancement using ANSA and Nile red as sorption spectrum of NR in the ethanol/water mixtures
described for BSA. Fig. 3 shows that contrary to that has a narrower absorption band and a maximum that
expected, no fluorescence enhancement was observed on shifts from 610 to 540 nm as the concentration of etha-
addition of C. vinosum cytochrome c0 to a solution of nol increases from 20 to 100%. A comparison of the
ANSA or NR, suggesting either that these dyes do not absorption spectrum of NR in water to that of the
bind to the cytochrome c0 or that the fluorescence of the spectra in ethanol and water suggests that NR may be
bound dyes is quenched by the cytochrome c0 . A Stern– severely aggregated in water at the concentrations most
Volmer plot of the fluorescence quenching of NR by amenable for visible absorption studies. Attempts to fit
Fig. 4. (A) Absorption difference titration of 54 lM BSA by NR in 100 mM Tris, pH 8.0. Concentrations of NR are: A, 17.1 lM; B, 22.8 lM; C,
28.5 lM; D, 34.2 lM; E, 39.9 lM; F, 45.6 lM; G, 53.0 lM; H, 63.0 lM; I, 85.0 lM; J, 108 lM. (B) Effect of solvent polarity on the absorption
spectrum of 45 lM NR in 100 mM Tris, pH 8.0. Spectra A–F correspond to ethanol–water mixtures of A, 100% water; B, 20% ethanol; C, 40%
ethanol, D, 60% ethanol; E, 80% ethanol; F, 100% ethanol.](https://image.slidesharecdn.com/absdiffspectrbpb-13559620632321-phpapp01-121219181429-phpapp02/85/Absorption-Difference-Spectroscopy-BPB-5-320.jpg)
![192 M. Bertsch et al. / Analytical Biochemistry 313 (2003) 187–195
the absorbance differences in Fig. 4A to a simple binding A JobÕs plot was constructed to establish the stoi-
model were unsuccessful. chiometry of BPB binding to BSA. Fig. 6 shows a JobÕs
BPB has earlier been shown to exhibit relatively large plot of the absorbance differences at 620 nm for solu-
absorbance changes on binding to lactic dehydrogenase tions containing the same total concentration of the
[28] although a correlation of the changes with a hy-
drophobic protein environment was not made. It was
recently observed [27] that BPB binds a cytochrome c0
and that the binding is characterized by large absor-
bance differences in the spectrum of BPB that could be
modeled by changes in the polarity of the BPB envi-
ronment. BPB was therefore further considered as a
visible absorbance probe of hydrophobic sites on pro-
teins since it is very soluble in water in contrast to NR.
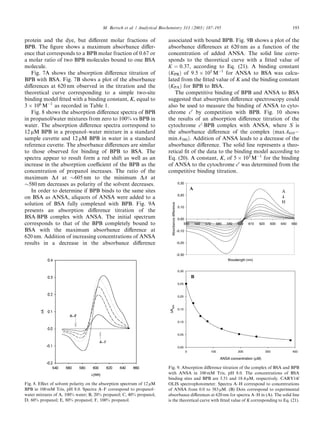
An absorption spectrum of BPB complexed by BSA
is compared to a spectrum of the same concentration of
BPB in neat Tris buffer, pH 8.0, in Fig. 5A. It is evident
that the absorption maximum is shifted toward higher
wavelengths upon complexation with the protein. The
absorption difference spectrum of the above solutions of
Fig. 6. JobÕs continuous variation experiment: molar fraction of BPB is
BPB with BSA and BPB in Tris buffer is presented in varied while keeping the total concentration of BPB and BSA constant
Fig. 5B. The absorbance difference is positive from 650 at 8.0 lM. CARY14/OLIS spectrophotometer. Dots correspond to
to 600 nm, with a maximum at 620 nm and negative absorbance differences at 620 nm for the following BPB molar frac-
from 600 to 550 nm, with a minimum at 587 nm. tions: 0.0, 0.1, 0.2, 0.3, 0.4, 0.5, 0.6, 0.67, 0.7, 0.75, 0.8, 0.9, and 1.0.
A
A
B
B
Fig. 7. (A) Absorption difference titration of 7.99 lM BPB by BSA in
Fig. 5. (A) Absorption spectra of 7.77 lM BPB in the presence of 100 mM Tris, pH 8.0. CARY14/OLIS spectrophotometer. Spectra A–J
11.6 lM BSA (full line) and in pure 100 mM Tris, pH 8.0 (dotted line). correspond to concentrations of BSA-binding sites from 0.0 to
CARY14/OLIS spectrophotometer. (B) Absorption difference spec- 18.4 lM. (B) Dots correspond to absorbance differences at 620 nm for
trum of 7.77 lM BPB in the presence of 11.6 lM BSA taken vs 7.77 lM spectra A–J in (A). The solid line is the theoretical curve with fitted
BPB in 100 mM Tris, pH 8.0. value of K.](https://image.slidesharecdn.com/absdiffspectrbpb-13559620632321-phpapp01-121219181429-phpapp02/85/Absorption-Difference-Spectroscopy-BPB-6-320.jpg)
![194 M. Bertsch et al. / Analytical Biochemistry 313 (2003) 187–195
observed in Fig. 4, indicate that absorption difference
spectroscopy may also be used to identify hydrophobic
sites on proteins, although NR may not be suitable for
quantitative measurements of binding constants because
of its limited solubility in water.
By contrast to NR, BPB is very soluble in water and
also shows large absorption changes on binding to BSA
(Fig. 5), which appear to be associated with a change in
polarity of its environment as indicated, by similar
changes in spectra in propanol–water mixtures (Fig. 8)
and in a micellar environment [27]. In contrast to the
blue shift observed for NR, BPB is characterized by a
red shift when placed in a nonpolar environment. The
wavelength of absorption depends on the energy differ-
Fig. 10. Absorption difference titration of the complex of cytochrome c0 ence between the ground and excited states. The envi-
and BPB with ANSA in 100 mM Tris, pH 8.0. The concentrations of c0 ronment may change the energy of the ground and/or
and BPB are 11.4 lM (heme) and 76 lM, respectively. Dots correspond excited state and thus change the energy difference. It
to experimental values. The solid line is the theoretical curve with fitted appears that for BPB a nonpolar (hydrophobic) envi-
value of K corresponding to Eq. (20).
ronment reduces the energy difference while for NR a
nonpolar environment increases the energy difference
Discussion between the ground and excited states. A possible ex-
planation is that BPB has two negative charges such that
As shown in Fig. 2, the binding of ANSA to BSA is the ground state should be destabilized in a hydrophobic
characterized by a large enhancement of the ANSA environment relative to water, perhaps contributing to a
fluorescence consistent with its interaction with a hy- decrease in the energy difference between the ground and
drophobic site on the protein as earlier observed [15]. excited states. For NR, there is a zwitterionic resonance
The measured binding constants, shown in Table 1, in- structure involving the tertiary amino group and the
dicate that the binding affinity of BPB to BSA is ap- quinoid oxygen. The zwitterion should be more stabi-
proximately three times greater than that of ANSA or lized in a polar than nonpolar environment. The zwit-
NR to BSA. The greater binding affinity of BPB may be terion may make a larger contribution to the excited
associated with differences in charge between BPB and state of NR which would be destabilized in a hydro-
NR or ANSA, specific hydrogen bonding interactions phobic environment leading to an increase in the energy
involving oxygen, and/or a larger apparent hydrophobic difference corresponding to a blue shift.
surface area. The large absorbance changes observed for BPB
As indicated above, the fluorescence enhancement of upon binding to BSA and the high equilibrium constant
polarity sensitive dyes like NR and ANSA provides an suggest that BPB may provide a suitable visible chro-
important probe for the hydrophobic sites of many mophoric probe of hydrophobic sites on other proteins.
proteins. However, as shown in Fig. 3, fluorescence As noted above, the shape of the absorption differ-
enhancement of NR and ANSA was not observed in the ence spectra for BPB in propanol–water mixtures
presence of cytochrome c0 which was earlier reported to changes as the percentage of propanol changes. As in-
have a surface hydrophobic site based on the binding of dicated in Fig. 8, the ratio of the maximum DA at
BPB [27]. Since it was shown in Fig. 10 that ANSA $605 nm to the minimum DA at $580 nm decreases as
decreases the complex formation between cytochrome c0 polarity of the solvent decreases with an increase in the
and BPB, it is concluded that ANSA competes with BPB percentage of propanol. The ratio of the maximum to
for a hydrophobic binding site on the protein. Thus the the minimum may thus provide an empirical measure of
absence of fluorescence enhancement of NR and ANSA the relative polarity of the hydrophobic site in the pro-
in the presence of cytochrome c0 suggests that the fluo- tein. Thus it may be observed that the ratio of the
rescence of these dyes is quenched by the protein. As maximum DA to the minimum DA in the absorption
noted earlier, a Stern–Volmer plot of the fluorescence difference spectra for BPB bound to BSA is close to one,
quenching of NR suggests a combination of static and suggesting that the polarity of the binding site of BPB in
dynamic quenching. The heme prosthetic group is the BSA is less polar (more hydrophobic) than that of the
expected quenching agent of the protein. In cytochrome propanol itself by comparison to spectrum F in Fig. 8.
c0 the heme is partially exposed to the solvent as well as Likewise, it may be observed that the earlier reported
adjacent to the proposed hydrophobic binding site [27]. [27] difference spectrum for BPB bound to cytochrome c0
The large changes in absorption spectra for NR when is similar to that of BPB in propanol and thus suggests
bound to BSA or in solvents of lower polarity, as that the hydrophobic binding site in BSA is less polar](https://image.slidesharecdn.com/absdiffspectrbpb-13559620632321-phpapp01-121219181429-phpapp02/85/Absorption-Difference-Spectroscopy-BPB-8-320.jpg)
![M. Bertsch et al. / Analytical Biochemistry 313 (2003) 187–195 195
(more hydrophobic) than that in cytochrome c0 It may amylose and amylopectine as substrates, Biotechnol. Bioeng. 20
also be observed that the binding constant for BPB to (2000) 127–133.
BSA is about 20-fold greater than that for BPB to cy- [12] E. Keshavarz, S. Nakia, The relationship between hydrophobicity
and interfacial tension of proteins, Biochim. Biophys. Acta 576
tochrome c0 , suggesting that the binding affinity of BPB (1979) 269–279.
may be related to the hydrophobicity of the binding site. [13] V.P. Shanbhag, C.G. Axelsson, Hydrophobic interaction deter-
Thus absorption difference spectroscopy of BPB may mined by partition in aqueous two-phase systems. Partition of
provide a useful method to determine the presence and proteins in systems containing fatty acid esters of poly(ethylene
glycol), Eur. J. Biochem. 60 (1975) 17–22.
relative hydrophobicity of sites on proteins.
[14] M.R. Eftink, J.L. Zajicek, C.A. Ghiron, A hydrophobic quencher
of protein fluorescence: 2,2,2-trichloroethanol, Biochim. Biophys.
Acta 491 (1977) 473–481.
Acknowledgments [15] G. Weber, L.B. Young, Fragmentation of bovine serum albumin
by pepsin. I. The origin of the acid expansion of the albumin
We acknowledge the assistance of undergraduate molecule, J. Biol. Chem. 239 (1964) 1415–1423.
[16] A. Prasad, R. Luduena, P. Horowitz, Bis(8-anilinonaphthalene-1-
students Jeong-Hye Hwang and Blerina Balliu.
sulfonate) as a probe for tubulin decay, Biochemistry 25 (1986)
739–742.
[17] D. Sackett, J. Wolff, Nile red as a polarity-sensitive fluorescent
References probe of hydrophobic protein surfaces, Anal. Biochem. (1987)
167,228–234.
[1] E. London, A fluorescence-based detergent binding assay for [18] J.R. Lakowicz, in: Principles of Fluorescence Spectroscopy,
protein hydrophobicity, Anal. Biochem. 154 (1986) 57–63. Plenum, New York, 1983, pp. 258–259 (Chapter IX).
[2] A.M. Bhattacharyya, P. Horowitz, Alteration around the active [19] R.F. Steiner, E.P. Kirby, The interaction of the ground and
site of rhodanese during urea-induced denaturation and its excited states of indole derivatives with electron scavengers,
implications for folding, J. Biol. Chem. 275 (2000) 14860–14864. J. Phys. Chem. 73 (1969) 4130–4135.
[3] A.M. Kettlun, V. Espinosa, A. Zanocco, M.A. Valenzuela, [20] M. Muschol, B. Dasgupta, B. Salzberg, Caffeine interaction with
Studies on ATP-diphosphohydrolase nucleotide-binding sites by fluorescent calcium indicator dyes, Biophys. J. (1999) 77,577–
intrinsic fluorescence, Braz. J. Med. Biol. Res. 33 (2000) 725–729. 586.
[4] M. QaÕDan, L.M. Spyres, J.D. Ballard, pH-induced conforma- [21] T.G. Scott, R.D. Spencer, N.J. Leonard, G. Weber, Emission
tional changes in Clostridium difficale toxin, Infect. Immun. 68 properties of NADH. Studies of fluorescence lifetimes and
(2000) 2470–2474. quantum efficiencies of NADH, AcPyADH, and simplified
[5] T. Hiratsuka, ATP-induced opposite changes in the local envi- synthetic models, J. Am. Chem. Soc. 92 (1970) 687–695.
ronments around Cys(697) (SH2) and Cys(707) (SH1) of the [22] M.T. Even, R.J. Kassner, M. Dolata, T.E. Meyer, M.A. Cusa-
myosin motor domain revealed by the prodan fluorescence, J. novich, Molecular cloning and sequencing of cytochrome c0 from
Biol. Chem. 274 (1999) 29156–29163. the phototrophic purple sulfur bacterium Chromatium vinosum,
[6] C. Ho, S.J. Slater, B.A. Stagliano, C.D. Stubbs, Conformation of Biochim. Biophys. Acta 1231 (1995) 220–222.
the C1 phorbol-ester-binding domain participates in the activating [23] M. Ubbink, J. Van Beeumen, G. Canters, Cytochrome c550 from
conformational change of protein kinase C, Biochem J. 344 (1999) Thiobacillus versutus: cloning, expression in Escherichia coli, and
451–460. purification of the heterologous holoprotein, J. Bacteriol. (1992)
[7] P.K. Nandi, Polymerization of human prion peptide HuPrp 106– 174,3707–3714.
126 to amiloid in nucleic acid solution, Arch. Virol. 143 (1998) [24] D.A. Kolb, G. Weber, Cooperativity of binding of anilinonaph-
1251–1263. thalene sulfonate to serum albumin induced by a second ligand,
[8] B. Kundu, P. Guptasarma, Hydrophobic dye inhibits aggregation Biochemistry 14 (1975) 4476–4481.
of molten carbonic anhydrase during thermal unfolding and [25] P. Job, Formation and stability of inorganic complexes in
refolding, Proteins 37 (1999) 321–324. solution, Ann. Chim. (Paris) 9 (1928) 113–203.
[9] J.E. Bina, R.A. Alm, M. Uria-Nickelsen, S.R. Thomas, T.J. Trust, [26] K.C. Ingham, On the application of JobÕs method of continuous
R.E. Hancock, Helicobacter pylori uptake and efflux: basis for variation to the stoichiometry of protein-ligand complexes, Anal.
intrinsic susceptibility to antibiotics in vitro, Antimicrob. Agents Biochem. 68 (1975) 660–663.
Chemother. 44 (2000) 248–254. [27] A.L. Mayburd, Y. Tan, R.J. Kassner, Complex formation
[10] L.A. Wallace, H.W. Dirr, Folding and assembly of dimeric human between Chromatium vinosum ferric cytochrome c0 and brom-
glutathione transferase A1-1, Biochemistry 38 (1999) 16686–16694. ophenolblue, Arch. Biochem. Biophys. 378 (2000) 40–44.
[11] N. Battle, J.V. Carbonell, J.M. Sendra, Determination of beta- [28] J.F. Towell III, R.W. Woody, Induced circular dichroism in
amylase activity by a fluorimetric 2-p-toluidinylnaphthalene-6- enzyme-dye complexes: lactic dehydrogenase-bromophenol blue,
sulfonate flow-injection analysis (2,6-TNS-FIA) method, using Biochemistry 19 (1980) 4231–4237.](https://image.slidesharecdn.com/absdiffspectrbpb-13559620632321-phpapp01-121219181429-phpapp02/85/Absorption-Difference-Spectroscopy-BPB-9-320.jpg)


![Cucurbituril[7] Host - Viologen Guest Complexes: Electrochromic and Photochem...](https://cdn.slidesharecdn.com/ss_thumbnails/mfreitagdefense-13350324202652-phpapp01-120421132458-phpapp01-thumbnail.jpg?width=640&height=640&fit=bounds)

