Download as PDF, PPTX
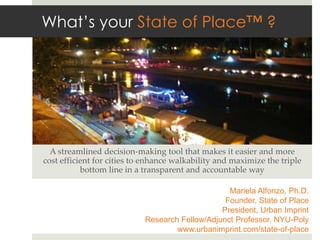
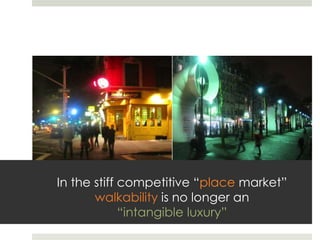
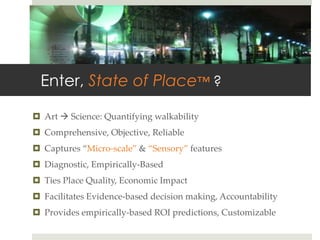
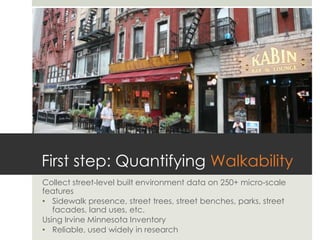
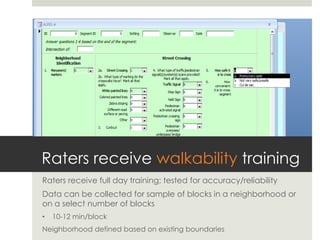
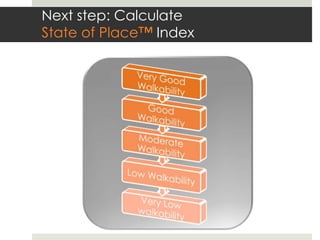
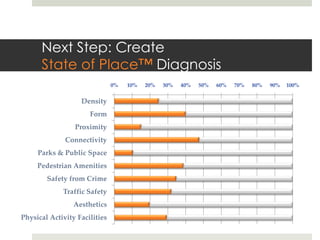
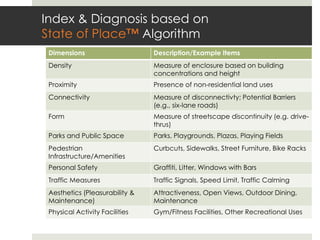
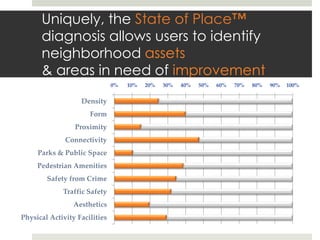
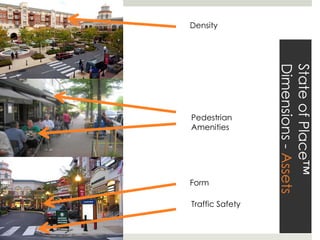
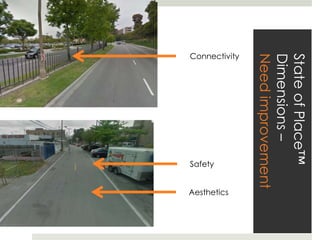
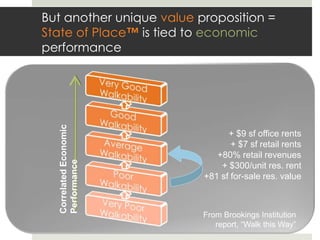
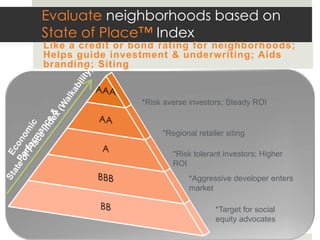
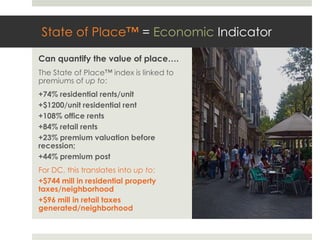
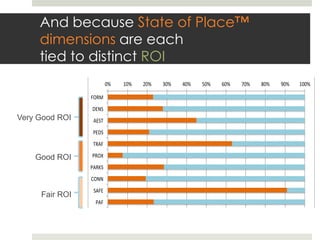
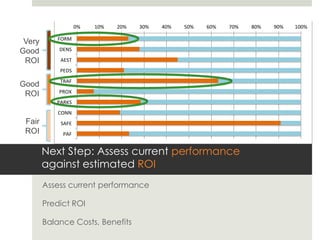
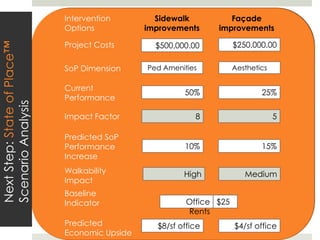
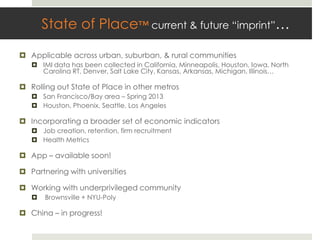

State of Place is a decision-making tool designed to enhance urban walkability in a cost-effective way, addressing challenges such as public policy hurdles and the lack of metrics. It quantifies walkability using over 250 micro-scale features and provides a State of Place Index, which links urban quality to economic performance indicators. The tool aids cities in making data-driven investments to improve neighborhoods, ultimately impacting property values and tax revenues.


