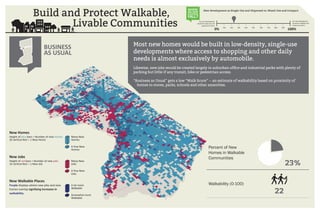
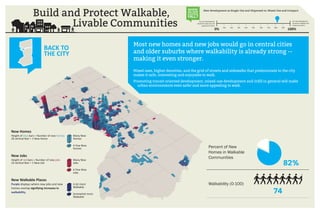
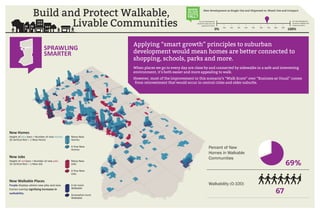
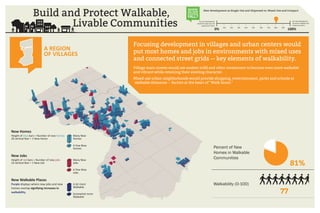
BUSINESS
AS USUAL
Build and Protect Walkable,
Livable Communities 0% 100%
10% 20% 30% 40% 50% 60% 70% 80% 90%
New Development as Single-Use and Dispersed vs. Mixed-Use and Compact
ALL new development
should be single-use and
spread out in form
ALL new development
should be walkable and
mixed use in form
WHERE
DO OUR
SCENARIOS
FALL?
Percent of New
Homes in Walkable
Communities
23%
Walkability (0-100)
22
Most new homes would be built in low-density, single-use
developments where access to shopping and other daily
needs is almost exclusively by automobile.
Likewise, new jobs would be created largely in suburban office and industrial parks with plenty of
parking but little if any transit, bike or pedestrian access.
“Business as Usual” gets a low “Walk Score” -- an estimate of walkability based on proximity of
homes to stores, parks, schools and other amenities.
New Homes
A Few New
Homes
Many New
Homes
Height of blue bars = Number of new homes
20 vertical feet = 1 New Home
New Jobs
A Few New
Jobs
Many New
Jobs
Height of red bars = Number of new jobs
10 vertical feet = 1 New Job
New Walkable Places
Somewhat more
Walkable
A lot more
Walkable
Purple displays where new jobs and new
homes overlap signifying increases in
walkability.
Build and Protect Walkable,
Livable Communities 0% 100%
10% 20% 30% 40% 50% 60% 70% 80% 90%
New Development as Single-Use and Dispersed vs. Mixed-Use and Compact
ALL new development
should be single-use and
spread out in form
ALL new development
should be walkable and
mixed use in form
WHERE
DO OUR
SCENARIOS
FALL?
Most new homes and new jobs would go in central cities
and older suburbs where walkability is already strong --
making it even stronger.
Mixed uses, higher densities, and the grid of streets and sidewalks that predominate in the city
makes it safe, interesting and enjoyable to walk.
Promoting transit oriented development, mixed-use development and infill in general will make
urban environments even safer and more appealing to walk.
BACK TO
THE CITY
Percent of New
Homes in Walkable
Communities
82%
Walkability (0-100)
74
New Homes
A Few New
Homes
Many New
Homes
Height of blue bars = Number of new homes
20 vertical feet = 1 New Home
New Jobs
A Few New
Jobs
Many New
Jobs
Height of red bars = Number of new jobs
10 vertical feet = 1 New Job
New Walkable Places
Somewhat more
Walkable
A lot more
Walkable
Purple displays where new jobs and new
homes overlap signifying increases in
walkability.
Build and Protect Walkable,
Livable Communities 0% 100%
10% 20% 30% 40% 50% 60% 70% 80% 90%
New Development as Single-Use and Dispersed vs. Mixed-Use and Compact
ALL new development
should be single-use and
spread out in form
ALL new development
should be walkable and
mixed use in form
WHERE
DO OUR
SCENARIOS
FALL?
Applying “smart growth” principles to suburban
development would mean homes are better connected to
shopping, schools, parks and more.
When places we go to every day are close by and connected by sidewalks in a safe and interesting
environment, it’s both easier and more appealing to walk.
However, most of the improvement in this scenario’s “Walk Score” over “Business as Usual” comes
from reinvestment that would occur in central cities and older suburbs.
SPRAWLING
SMARTER
Percent of New
Homes in Walkable
Communities
69%
Walkability (0-100)
67
New Homes
A Few New
Homes
Many New
Homes
Height of blue bars = Number of new homes
20 vertical feet = 1 New Home
New Jobs
A Few New
Jobs
Many New
Jobs
Height of red bars = Number of new jobs
10 vertical feet = 1 New Job
New Walkable Places
Somewhat more
Walkable
A lot more
Walkable
Purple displays where new jobs and new
homes overlap signifying increases in
walkability.
Build and Protect Walkable,
Livable Communities 0% 100%
10% 20% 30% 40% 50% 60% 70% 80% 90%
New Development as Single-Use and Dispersed vs. Mixed-Use and Compact
ALL new development
should be single-use and
spread out in form
ALL new development
should be walkable and
mixed use in form
WHERE
DO OUR
SCENARIOS
FALL?
Focusing development in villages and urban centers would
put most homes and jobs in environments with mixed uses
and connected street grids -- key elements of walkability.
Village main streets would see modest infill and other investment to become even more walkable
and vibrant while retaining their existing character.
MIxed use urban neighborhoods would provide shopping, entertainment, parks and schools at
walkable distances -- factors at the heart of “Walk Score.”
A REGION
OF VILLAGES
Percent of New
Homes in Walkable
Communities
81%
Walkability (0-100)
77
New Homes
A Few New
Homes
Many New
Homes
Height of blue bars = Number of new homes
20 vertical feet = 1 New Home
New Jobs
A Few New
Jobs
Many New
Jobs
Height of red bars = Number of new jobs
10 vertical feet = 1 New Job
New Walkable Places
Somewhat more
Walkable
A lot more
Walkable
Purple displays where new jobs and new
homes overlap signifying increases in
walkability.

Livable communties

  • 1.
    BUSINESS AS USUAL Build andProtect Walkable, Livable Communities 0% 100% 10% 20% 30% 40% 50% 60% 70% 80% 90% New Development as Single-Use and Dispersed vs. Mixed-Use and Compact ALL new development should be single-use and spread out in form ALL new development should be walkable and mixed use in form WHERE DO OUR SCENARIOS FALL? Percent of New Homes in Walkable Communities 23% Walkability (0-100) 22 Most new homes would be built in low-density, single-use developments where access to shopping and other daily needs is almost exclusively by automobile. Likewise, new jobs would be created largely in suburban office and industrial parks with plenty of parking but little if any transit, bike or pedestrian access. “Business as Usual” gets a low “Walk Score” -- an estimate of walkability based on proximity of homes to stores, parks, schools and other amenities. New Homes A Few New Homes Many New Homes Height of blue bars = Number of new homes 20 vertical feet = 1 New Home New Jobs A Few New Jobs Many New Jobs Height of red bars = Number of new jobs 10 vertical feet = 1 New Job New Walkable Places Somewhat more Walkable A lot more Walkable Purple displays where new jobs and new homes overlap signifying increases in walkability.
  • 2.
    Build and ProtectWalkable, Livable Communities 0% 100% 10% 20% 30% 40% 50% 60% 70% 80% 90% New Development as Single-Use and Dispersed vs. Mixed-Use and Compact ALL new development should be single-use and spread out in form ALL new development should be walkable and mixed use in form WHERE DO OUR SCENARIOS FALL? Most new homes and new jobs would go in central cities and older suburbs where walkability is already strong -- making it even stronger. Mixed uses, higher densities, and the grid of streets and sidewalks that predominate in the city makes it safe, interesting and enjoyable to walk. Promoting transit oriented development, mixed-use development and infill in general will make urban environments even safer and more appealing to walk. BACK TO THE CITY Percent of New Homes in Walkable Communities 82% Walkability (0-100) 74 New Homes A Few New Homes Many New Homes Height of blue bars = Number of new homes 20 vertical feet = 1 New Home New Jobs A Few New Jobs Many New Jobs Height of red bars = Number of new jobs 10 vertical feet = 1 New Job New Walkable Places Somewhat more Walkable A lot more Walkable Purple displays where new jobs and new homes overlap signifying increases in walkability.
  • 3.
    Build and ProtectWalkable, Livable Communities 0% 100% 10% 20% 30% 40% 50% 60% 70% 80% 90% New Development as Single-Use and Dispersed vs. Mixed-Use and Compact ALL new development should be single-use and spread out in form ALL new development should be walkable and mixed use in form WHERE DO OUR SCENARIOS FALL? Applying “smart growth” principles to suburban development would mean homes are better connected to shopping, schools, parks and more. When places we go to every day are close by and connected by sidewalks in a safe and interesting environment, it’s both easier and more appealing to walk. However, most of the improvement in this scenario’s “Walk Score” over “Business as Usual” comes from reinvestment that would occur in central cities and older suburbs. SPRAWLING SMARTER Percent of New Homes in Walkable Communities 69% Walkability (0-100) 67 New Homes A Few New Homes Many New Homes Height of blue bars = Number of new homes 20 vertical feet = 1 New Home New Jobs A Few New Jobs Many New Jobs Height of red bars = Number of new jobs 10 vertical feet = 1 New Job New Walkable Places Somewhat more Walkable A lot more Walkable Purple displays where new jobs and new homes overlap signifying increases in walkability.
  • 4.
    Build and ProtectWalkable, Livable Communities 0% 100% 10% 20% 30% 40% 50% 60% 70% 80% 90% New Development as Single-Use and Dispersed vs. Mixed-Use and Compact ALL new development should be single-use and spread out in form ALL new development should be walkable and mixed use in form WHERE DO OUR SCENARIOS FALL? Focusing development in villages and urban centers would put most homes and jobs in environments with mixed uses and connected street grids -- key elements of walkability. Village main streets would see modest infill and other investment to become even more walkable and vibrant while retaining their existing character. MIxed use urban neighborhoods would provide shopping, entertainment, parks and schools at walkable distances -- factors at the heart of “Walk Score.” A REGION OF VILLAGES Percent of New Homes in Walkable Communities 81% Walkability (0-100) 77 New Homes A Few New Homes Many New Homes Height of blue bars = Number of new homes 20 vertical feet = 1 New Home New Jobs A Few New Jobs Many New Jobs Height of red bars = Number of new jobs 10 vertical feet = 1 New Job New Walkable Places Somewhat more Walkable A lot more Walkable Purple displays where new jobs and new homes overlap signifying increases in walkability.