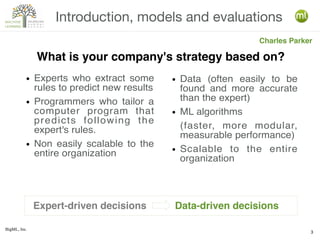
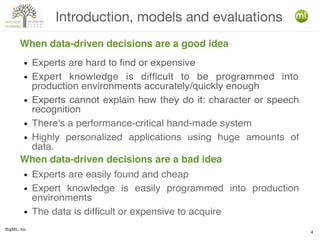
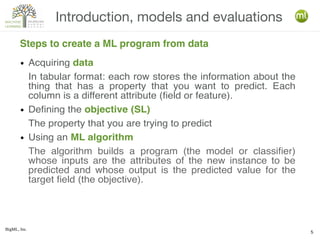
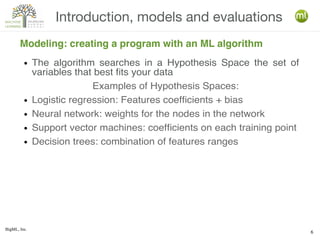
Class summary
BigML, Inc.
2
Day 1 – Morning sessions
Class su
BigML, Inc.
3
Introduction, models and evaluations
Charles Parker
● Experts who extract some
rules to predict new results
● Programmers who tailor a
computer program that
predicts following the
expert's rules.
● Non easily scalable to the
entire organization
● Data (often easily to be
found and more accurate
than the expert)
● ML algorithms
(faster, more modular,
measurable performance)
● Scalable to the entire
organization
What is your company's strategy based on?
Expert-driven decisions Data-driven decisions
BigML, Inc.
4
Introduction, models and evaluations
When data-driven decisions are a good idea
● Experts are hard to find or expensive
● Expert knowledge is difficult to be programmed into
production environments accurately/quickly enough
● Experts cannot explain how they do it: character or speech
recognition
● There's a performance-critical hand-made system
● Highly personalized applications using huge amounts of
data.
● Experts are easily found and cheap
● Expert knowledge is easily programmed into production
environments
● The data is difficult or expensive to acquire
When data-driven decisions are a bad idea
BigML, Inc.
5
Introduction, models and evaluations
Steps to create a ML program from data
● Acquiring data
In tabular format: each row stores the information about the
thing that has a property that you want to predict. Each
column is a different attribute (field or feature).
● Defining the objective (SL)
The property that you are trying to predict
● Using an ML algorithm
The algorithm builds a program (the model or classifier)
whose inputs are the attributes of the new instance to be
predicted and whose output is the predicted value for the
target field (the objective).
BigML, Inc.
6
Introduction, models and evaluations
Modeling: creating a program with an ML algorithm
● The algorithm searches in a Hypothesis Space the set of
variables that best fits your data
Examples of Hypothesis Spaces:
● Logistic regression: Features coefficients + bias
● Neural network: weights for the nodes in the network
● Support vector machines: coefficients on each training point
● Decision trees: combination of features ranges
BigML, Inc.
7
Introduction, models and evaluations
Decision tree construction
● What question splits better you data? try all possible splits
and choose the one that achieves more purity
● When should we stop?
When the subset is totally pure
When the size reaches a predetermined minimum
When the number of nodes or tree depth is too large
When you can’t get any statistically significant
improvement
● Nodes that don’t meet the latter criteria can be removed
after tree construction via pruning
The recursive algorithm analyzes the data to find
BigML, Inc.
8
Introduction, models and evaluations
Visualizing a decision tree
Root node
(split at petal length=2.45)
Branches
Leaf
(splitting stops)
BigML, Inc.
9
Introduction, models and evaluations
Decision tree outputs
● Prediction: Start from the root node. Use the inputs to
answer the question associated to each node you reach.
The answer will decide which branch will be used to
descend the tree. If you reach a leaf node, the majority
class in the leaf will be the prediction.
● Confidence: Degree of reliability of the prediction. Depends
on the purity of the final node and the number of instances
that it classifies.
● Field importance: Which field is more decisive in the
model's classification. Depends on the number of times it is
used as the best split and the error reduction it achieves.
Inputs: values of the features for a new instance
BigML, Inc.
10
Introduction, models and evaluations
Evaluating your models
● Testing your model with new data is the key to measure its
performance. Never evaluate with training data!
● Simplest approach: split your data into a training dataset
and a test dataset (80-20% usually)
● Advanced approach: to avoid biased splits, do it repeatedly
and average evaluations or k-fold cross-validate.
● Accuracy is not a good metric when classes are
unbalanced. Use the confusion matrix instead or phi, F1-
score or balanced accuracy.
Which evaluation metric to choose?
BigML, Inc.
11
● Confusion matrix can tell the number of correctly classified
(TP, TN) or misclassified instances (FP, FN) but this does
not tell you how misclassifications will impact your
business.
● You can change the probability threshold for the prediction
of the positive class to improve your results according to
the domain needs.
● As a domain expert, you can assign a cost to each FP or
FN (cost matrix). This cost/gain ratio is the significant
performance measure for your models.
Introduction, models and evaluations
Domain specific evaluation
BigML, Inc.
12
●
Ensembles are groups of different models built on
samples of data.
● Randomness is introduced in the models. Each model is a
good approximation for a different random sample of data.
●
A single ML Algorithm may not adapt nicely to some
datasets. Combining different models can.
●
Combining models can reduce the over-fitting caused by
anomalies, errors or outliers.
● The combination of several accurate models gets us closer
to the real model.
Ensembles and Logistic Regressions
Can a group of weaker models outperform a stronger
single model?
Poul Petersen
BigML, Inc.
13
● Decision Forest (bagging) models are built on random samples
(with replacement) of n instances.
● Random Decision Forest in addition to the random samples of
bagging, the models are built by choosing randomly the candidate
features at each split (random candidates).
● Plurality majority wins
● Confidence weighted each vote is weighted by confidence and
majority wins
● Probability weighted each tree votes according to the
distribution at its prediction node
● K-Threshold a class is predicted only if enough models vote for it
● Confidence Threshold votes for a class are only computed if
their confidence is over the threshold
Ensembles and Logistic Regressions
Types of ensembles: Decision Forests
Types of combinations
BigML, Inc.
14
● Each model is computing corrections to the
previous predictions. Therefore, the final prediction
adds up the individual model predictions and
models need to be computed in a serial way.
● Weights
● Missing splits
● Node threshold
Ensembles and Logistic Regressions
Types of ensembles: Boosting
Parameters
Number of models
Deterministic or random sampling
Replacement
Random candidates (RDF)
Number of iterations
Early out of bag
Early holdout
Learning rate
DF / RDF Boosting
BigML, Inc.
15
● How many trees / iterations?
● How many nodes?
● Missing splits?
● Random Candidates?
● SMACdown: automatic optimization of ensembles by
exploring the configuration space.
● Stacked generalization: Building different models and
creating a meta-model to choose the optimal for each
prediction.
Ensembles and Logistic Regressions
Configuration parameters
Too many parameters? Complex algorithms?Automate!
BigML, Inc.
16
● Regressions are typically used to
relate two numeric variables
● But using the proper function we
can relate discrete variables too
Ensembles and Logistic Regressions
How comes we use a regression to classify?
Logistic Regression is a classification ML Algorithm
BigML, Inc.
17
● We should use feature engineering to transform raw
features in linearly related predictors, if needed.
● The ML algorithm searches for the coefficients to
solve the problem
by transforming it into a linear regression problem
In general, the algorithm will find a coefficient per
feature plus a bias coefficient and a missing
coefficient
Ensembles and Logistic Regressions
Assumption: The output is linearly related to the
predictors.
BigML, Inc.
18
Default numeric: Replaces missing numeric values.
Missing numeric: Adds a field for missing numerics.
Bias: Allows an intercept term. Important if P(x=0) != 0
Strength “C”: Higher values reduce regularization.
Regularization
L1: prefers zeroing individual coefficients
L2: prefers pushing all coefficients towards zero
EPS: The minimum error between steps to stop.
Auto-scaling: Ensures that all features contribute equally.
Recommended unless there is a specific need to not auto-
scale.
Ensembles and Logistic Regressions
Configuration parameters
BigML, Inc.
19
• Multi-class LR: Each class has its own LR computed as
a binary problem (one-vs-the-rest). A set of coefficients is
computed for each class.
• Non-numeric predictors: As LR works for numeric
predictors, the algorithm needs to do some encoding of
the non-numeric features to be able to use them. These
are the field-encodings.
– Categorical: one-shot, dummy encoding, contrast
encoding
– Text and Items: frequencies of terms
● Curvilinear LR: adding quadratic features as new features
Ensembles and Logistic Regressions
Extending the domain for the algorithm
BigML, Inc.
20
Ensembles and Logistic Regressions
Logistic Regressions versus Decision Trees
● Expects a "smooth" linear
relationship with predictors
● L R i s c o n c e r n e d w i t h
probability of a discrete
outcome.
● Lots of parameters to get
wrong: regularization, scaling,
codings
● Slightly less prone to over-
fitting
● Because fits a shape, might
work better when less data
available.
● Adapts well to ragged non-
linear relationships
● No concern:
classification, regression,
multi-class all fine.
● Virtually parameter free
● Slightly more prone to over-
fitting
● Prefers surfaces parallel to
parameter axes, but given
enough data will discover
any shape.
BigML, Inc.
21
Day 1 – Evening sessions
BigML, Inc.
22
● Clustering is a ML technique designed to find and
group of similar instances in your data.
● It's unsupervised learning, as opposed to
supervised learning algorithms, like decision trees,
where training data has been labeled and the model
learns to predict that label. Clusters are built on raw
data.
● Goal: finding k clusters in which similar data can be
grouped together. Data in each cluster is similar self
similar and dissimilar to the rest.
Clusters and Anomaly Detection
Clusters: looking for similarity
Poul Petersen
BigML, Inc.
23
● Customer segmentation: grouping users to act on each
group differently
● Item discovery: grouping items to find similar alternatives
● Similarity: Grouping products or cases to act on each
group differently
● Recommender: grouping products to recommend similar
ones
● Active learning: grouping partially labeled data as
alternative to labeling each instance
Clustering can help us to identify new features shared by
the data in the groups
Clusters and Anomaly Detection
Use cases
BigML, Inc.
24
● K-means: The number of expected groups is given by the user. The algorithm
starts using random data points as centers.
– K++: the first center is chosen randomly from instances and each
subsequent center is chosen from the remaining instances with probability
proportional to its squared distance from the point's closest existing
cluster center
Clusters and Anomaly Detection
Types of clustering algorithm
The algorithm computes distances based on
each instance features. Each instance is
assigned to the nearest center or centroid.
Centroids are recalculated as the center of all
the data points in each cluster and process is
repeated till the groups converge.
●
G-means: The number of groups is also
determined by the algorithm. Starting from k=2,
each group is split if the data distribution in it is
not Gaussian-like.
BigML, Inc.
25
How distance between two instances is defined?
For clustering to work we need a distance function that must be
computable for all the features in your data. Scaled euclidean
distance is used for numeric features. What about the rest of field
types?
Categorical: Features contribute to the distance if categories for
both points are not the same
Text and Items: Words are parsed and its frequencies are stored
in a vector format. Cosine distance (1 – cosine similarity) is
computed.
Missing values: Distance to a missing value cannot be defined.
Either you ignore the instances with missing values or you
previously assign a common value (mean, median, zero, etc.)
Clusters and Anomaly Detection
Extending clustering to different data types
BigML, Inc.
26
K-means: (user inputs k)
k groups of self-similar instances
Centroids describing the instances in each group
Models describing the features that determine whether an
instance belongs to a cluster.
G-means: (assuming gaussian clusters)
The optimal number of clusters (no need for the user to set it)
Centroids describing the instances In each group
Models describing the features that determine whether an
instance belongs to a cluster.
Clusters and Anomaly Detection
Clusters output
BigML, Inc.
27
● Anomaly detectors use ML algorithms designed to
single out instances in your data which do not
follow the general pattern.
● As clustering, they fall into the unsupervised
learning category, so no labeling is required.
Anomaly detectors are built on raw data.
● Goal: Assigning to each data instance an anomaly
score, ranging from 0 to 1, where 0 means very
similar to the rest of instances and 1 means very
dissimilar (anomalous).
Clusters and Anomaly Detection
Anomaly detection: looking for the unusual
Poul Petersen
BigML, Inc.
28
● Unusual instance discovery
● Intrusion Detection: users whose behaviour does not
comply to the general pattern may indicate an intrusion
● Fraud: Cluster per profile and look for anomalous
transactions at different levels (card, user, user groups)
● Identify Incorrect Data
● Remove Outliers
● Model Competence / Input Data Drift: Models
performance can be downgraded because new data has
evolved to be statistically different. Check the
prediction's anomaly score.
Clusters and Anomaly Detection
Use cases
BigML, Inc.
29
Clusters and Anomaly Detection
Statistical anomaly indicators
● Univariate-approach: Given a single
variable, and assuming normal distribution
(Gaussian). Compute the standard
deviation and choose a multiple of it as
threshold to define what's anomalous.
● Benford's law: In real-life numeric sets
the small digits occur disproportionately
often as leading significant digits.
BigML, Inc.
30
Clusters and Anomaly Detection
Isolation forests
● Train several random
decision trees that over-fit
data till each instance is
completely isolated
● Use the medium depth of
these trees as threshold to
compute the anomaly
score, a number from 0 to 1
where 0 is similar and 1 is
dissimilar
● New instances are run
through the trees and
assigned an anomaly score
according to the average
depth they reach
BigML, Inc.
31
Clusters and Anomaly Detection
Anomaly Detector output
● Subset of instances that don’t comply with the general patterns in
the dataset.
● Each anomalous instance has information about which fields makes
it anomalous.
BigML, Inc.
32
● Association Discovery is an unsupervised technique, like
clustering and anomaly detection.
● Uses the “Magnum Opus” algorithm by Geoff Webb
Association Discovery
Poul Petersen
Looking for “interesting” relations between variables
date customer account auth class zip amount
Mon Bob 3421 pin clothes 46140 135
Tue Bob 3421 sign food 46140 401
Tue Alice 2456 pin food 12222 234
Wed Sally 6788 pin gas 26339 94
Wed Bob 3421 pin tech 21350 2459
Wed Bob 3421 pin gas 46140 83
Tue Sally 6788 sign food 26339 51
{class = gas} amount < 100
{customer = Bob, account = 3421} zip = 46140
Antecedent Consequent
BigML, Inc.
33
Association Discovery
Use Cases
Market Basket Analysis
Web usage patterns
Intrusion detection
Fraud detection
Bioinformatics
Medical risk factors
BigML, Inc.
34
● Very high support patterns can be spurious
● Very infrequent patterns can be significant
So the user selects the measure of interest
System finds the top-k associations on that measure
within constraints
– Must be statistically significant interaction between
antecedent and consequent
– Every item in the antecedent must increase the strength
of association
Association Discovery
It turns out that:
Problems with frequent pattern mining
●
Often results in too few or too many patterns
●
Some high value patterns are infrequent, etc.
BigML, Inc.
35
Association Discovery
Measures:
Coverage
Support
Confidence
Lift Leverage
Support/
Coverage
Ratio Difference
BigML, Inc.
36
Association Discovery
Output: meaningful relations and metrics
BigML, Inc.
37
A document can be analyzed from different levels
● According to its terms (one or more words)
● According to its topics (distributions of terms ~
semantics)
● Documents are generated by repeatedly drawing a
topic and a term in that topic at random
● Goal: To infer the topic distribution
How? Dirichlet Process is used to model the term|
topic, and topic|document distributions
Latent Dirichlet Allocation
Thinking of documents in terms of Topics
Generative Models for documents
BigML, Inc.
39
● Topics can reduce the feature space
● Are nicely interpretable
● Automatically tailored to the document
● Need to choose the number of topics
● Takes a lot of time to fit or do inference
● Takes a lot of text to make it meaningful
● Tends to focus on “meaningless minutiae”
Latent Dirichlet Allocation
Nice properties about topics
Caveats
BigML, Inc.
40
● Set of topics detected in the training collection of
documents
● Terms related to each topic and their probability
distibution
● Topic distribution to classify documents
Latent Dirichlet Allocation
Topic Models outputs

VSSML17 Review. Summary Day 1 Sessions

  • 1.
  • 2.
    BigML, Inc. 2 Day 1– Morning sessions Class su
  • 3.
    BigML, Inc. 3 Introduction, modelsand evaluations Charles Parker ● Experts who extract some rules to predict new results ● Programmers who tailor a computer program that predicts following the expert's rules. ● Non easily scalable to the entire organization ● Data (often easily to be found and more accurate than the expert) ● ML algorithms (faster, more modular, measurable performance) ● Scalable to the entire organization What is your company's strategy based on? Expert-driven decisions Data-driven decisions
  • 4.
    BigML, Inc. 4 Introduction, modelsand evaluations When data-driven decisions are a good idea ● Experts are hard to find or expensive ● Expert knowledge is difficult to be programmed into production environments accurately/quickly enough ● Experts cannot explain how they do it: character or speech recognition ● There's a performance-critical hand-made system ● Highly personalized applications using huge amounts of data. ● Experts are easily found and cheap ● Expert knowledge is easily programmed into production environments ● The data is difficult or expensive to acquire When data-driven decisions are a bad idea
  • 5.
    BigML, Inc. 5 Introduction, modelsand evaluations Steps to create a ML program from data ● Acquiring data In tabular format: each row stores the information about the thing that has a property that you want to predict. Each column is a different attribute (field or feature). ● Defining the objective (SL) The property that you are trying to predict ● Using an ML algorithm The algorithm builds a program (the model or classifier) whose inputs are the attributes of the new instance to be predicted and whose output is the predicted value for the target field (the objective).
  • 6.
    BigML, Inc. 6 Introduction, modelsand evaluations Modeling: creating a program with an ML algorithm ● The algorithm searches in a Hypothesis Space the set of variables that best fits your data Examples of Hypothesis Spaces: ● Logistic regression: Features coefficients + bias ● Neural network: weights for the nodes in the network ● Support vector machines: coefficients on each training point ● Decision trees: combination of features ranges
  • 7.
    BigML, Inc. 7 Introduction, modelsand evaluations Decision tree construction ● What question splits better you data? try all possible splits and choose the one that achieves more purity ● When should we stop? When the subset is totally pure When the size reaches a predetermined minimum When the number of nodes or tree depth is too large When you can’t get any statistically significant improvement ● Nodes that don’t meet the latter criteria can be removed after tree construction via pruning The recursive algorithm analyzes the data to find
  • 8.
    BigML, Inc. 8 Introduction, modelsand evaluations Visualizing a decision tree Root node (split at petal length=2.45) Branches Leaf (splitting stops)
  • 9.
    BigML, Inc. 9 Introduction, modelsand evaluations Decision tree outputs ● Prediction: Start from the root node. Use the inputs to answer the question associated to each node you reach. The answer will decide which branch will be used to descend the tree. If you reach a leaf node, the majority class in the leaf will be the prediction. ● Confidence: Degree of reliability of the prediction. Depends on the purity of the final node and the number of instances that it classifies. ● Field importance: Which field is more decisive in the model's classification. Depends on the number of times it is used as the best split and the error reduction it achieves. Inputs: values of the features for a new instance
  • 10.
    BigML, Inc. 10 Introduction, modelsand evaluations Evaluating your models ● Testing your model with new data is the key to measure its performance. Never evaluate with training data! ● Simplest approach: split your data into a training dataset and a test dataset (80-20% usually) ● Advanced approach: to avoid biased splits, do it repeatedly and average evaluations or k-fold cross-validate. ● Accuracy is not a good metric when classes are unbalanced. Use the confusion matrix instead or phi, F1- score or balanced accuracy. Which evaluation metric to choose?
  • 11.
    BigML, Inc. 11 ● Confusionmatrix can tell the number of correctly classified (TP, TN) or misclassified instances (FP, FN) but this does not tell you how misclassifications will impact your business. ● You can change the probability threshold for the prediction of the positive class to improve your results according to the domain needs. ● As a domain expert, you can assign a cost to each FP or FN (cost matrix). This cost/gain ratio is the significant performance measure for your models. Introduction, models and evaluations Domain specific evaluation
  • 12.
    BigML, Inc. 12 ● Ensembles aregroups of different models built on samples of data. ● Randomness is introduced in the models. Each model is a good approximation for a different random sample of data. ● A single ML Algorithm may not adapt nicely to some datasets. Combining different models can. ● Combining models can reduce the over-fitting caused by anomalies, errors or outliers. ● The combination of several accurate models gets us closer to the real model. Ensembles and Logistic Regressions Can a group of weaker models outperform a stronger single model? Poul Petersen
  • 13.
    BigML, Inc. 13 ● DecisionForest (bagging) models are built on random samples (with replacement) of n instances. ● Random Decision Forest in addition to the random samples of bagging, the models are built by choosing randomly the candidate features at each split (random candidates). ● Plurality majority wins ● Confidence weighted each vote is weighted by confidence and majority wins ● Probability weighted each tree votes according to the distribution at its prediction node ● K-Threshold a class is predicted only if enough models vote for it ● Confidence Threshold votes for a class are only computed if their confidence is over the threshold Ensembles and Logistic Regressions Types of ensembles: Decision Forests Types of combinations
  • 14.
    BigML, Inc. 14 ● Eachmodel is computing corrections to the previous predictions. Therefore, the final prediction adds up the individual model predictions and models need to be computed in a serial way. ● Weights ● Missing splits ● Node threshold Ensembles and Logistic Regressions Types of ensembles: Boosting Parameters Number of models Deterministic or random sampling Replacement Random candidates (RDF) Number of iterations Early out of bag Early holdout Learning rate DF / RDF Boosting
  • 15.
    BigML, Inc. 15 ● Howmany trees / iterations? ● How many nodes? ● Missing splits? ● Random Candidates? ● SMACdown: automatic optimization of ensembles by exploring the configuration space. ● Stacked generalization: Building different models and creating a meta-model to choose the optimal for each prediction. Ensembles and Logistic Regressions Configuration parameters Too many parameters? Complex algorithms?Automate!
  • 16.
    BigML, Inc. 16 ● Regressionsare typically used to relate two numeric variables ● But using the proper function we can relate discrete variables too Ensembles and Logistic Regressions How comes we use a regression to classify? Logistic Regression is a classification ML Algorithm
  • 17.
    BigML, Inc. 17 ● Weshould use feature engineering to transform raw features in linearly related predictors, if needed. ● The ML algorithm searches for the coefficients to solve the problem by transforming it into a linear regression problem In general, the algorithm will find a coefficient per feature plus a bias coefficient and a missing coefficient Ensembles and Logistic Regressions Assumption: The output is linearly related to the predictors.
  • 18.
    BigML, Inc. 18 Default numeric:Replaces missing numeric values. Missing numeric: Adds a field for missing numerics. Bias: Allows an intercept term. Important if P(x=0) != 0 Strength “C”: Higher values reduce regularization. Regularization L1: prefers zeroing individual coefficients L2: prefers pushing all coefficients towards zero EPS: The minimum error between steps to stop. Auto-scaling: Ensures that all features contribute equally. Recommended unless there is a specific need to not auto- scale. Ensembles and Logistic Regressions Configuration parameters
  • 19.
    BigML, Inc. 19 • Multi-classLR: Each class has its own LR computed as a binary problem (one-vs-the-rest). A set of coefficients is computed for each class. • Non-numeric predictors: As LR works for numeric predictors, the algorithm needs to do some encoding of the non-numeric features to be able to use them. These are the field-encodings. – Categorical: one-shot, dummy encoding, contrast encoding – Text and Items: frequencies of terms ● Curvilinear LR: adding quadratic features as new features Ensembles and Logistic Regressions Extending the domain for the algorithm
  • 20.
    BigML, Inc. 20 Ensembles andLogistic Regressions Logistic Regressions versus Decision Trees ● Expects a "smooth" linear relationship with predictors ● L R i s c o n c e r n e d w i t h probability of a discrete outcome. ● Lots of parameters to get wrong: regularization, scaling, codings ● Slightly less prone to over- fitting ● Because fits a shape, might work better when less data available. ● Adapts well to ragged non- linear relationships ● No concern: classification, regression, multi-class all fine. ● Virtually parameter free ● Slightly more prone to over- fitting ● Prefers surfaces parallel to parameter axes, but given enough data will discover any shape.
  • 21.
    BigML, Inc. 21 Day 1– Evening sessions
  • 22.
    BigML, Inc. 22 ● Clusteringis a ML technique designed to find and group of similar instances in your data. ● It's unsupervised learning, as opposed to supervised learning algorithms, like decision trees, where training data has been labeled and the model learns to predict that label. Clusters are built on raw data. ● Goal: finding k clusters in which similar data can be grouped together. Data in each cluster is similar self similar and dissimilar to the rest. Clusters and Anomaly Detection Clusters: looking for similarity Poul Petersen
  • 23.
    BigML, Inc. 23 ● Customersegmentation: grouping users to act on each group differently ● Item discovery: grouping items to find similar alternatives ● Similarity: Grouping products or cases to act on each group differently ● Recommender: grouping products to recommend similar ones ● Active learning: grouping partially labeled data as alternative to labeling each instance Clustering can help us to identify new features shared by the data in the groups Clusters and Anomaly Detection Use cases
  • 24.
    BigML, Inc. 24 ● K-means:The number of expected groups is given by the user. The algorithm starts using random data points as centers. – K++: the first center is chosen randomly from instances and each subsequent center is chosen from the remaining instances with probability proportional to its squared distance from the point's closest existing cluster center Clusters and Anomaly Detection Types of clustering algorithm The algorithm computes distances based on each instance features. Each instance is assigned to the nearest center or centroid. Centroids are recalculated as the center of all the data points in each cluster and process is repeated till the groups converge. ● G-means: The number of groups is also determined by the algorithm. Starting from k=2, each group is split if the data distribution in it is not Gaussian-like.
  • 25.
    BigML, Inc. 25 How distancebetween two instances is defined? For clustering to work we need a distance function that must be computable for all the features in your data. Scaled euclidean distance is used for numeric features. What about the rest of field types? Categorical: Features contribute to the distance if categories for both points are not the same Text and Items: Words are parsed and its frequencies are stored in a vector format. Cosine distance (1 – cosine similarity) is computed. Missing values: Distance to a missing value cannot be defined. Either you ignore the instances with missing values or you previously assign a common value (mean, median, zero, etc.) Clusters and Anomaly Detection Extending clustering to different data types
  • 26.
    BigML, Inc. 26 K-means: (userinputs k) k groups of self-similar instances Centroids describing the instances in each group Models describing the features that determine whether an instance belongs to a cluster. G-means: (assuming gaussian clusters) The optimal number of clusters (no need for the user to set it) Centroids describing the instances In each group Models describing the features that determine whether an instance belongs to a cluster. Clusters and Anomaly Detection Clusters output
  • 27.
    BigML, Inc. 27 ● Anomalydetectors use ML algorithms designed to single out instances in your data which do not follow the general pattern. ● As clustering, they fall into the unsupervised learning category, so no labeling is required. Anomaly detectors are built on raw data. ● Goal: Assigning to each data instance an anomaly score, ranging from 0 to 1, where 0 means very similar to the rest of instances and 1 means very dissimilar (anomalous). Clusters and Anomaly Detection Anomaly detection: looking for the unusual Poul Petersen
  • 28.
    BigML, Inc. 28 ● Unusualinstance discovery ● Intrusion Detection: users whose behaviour does not comply to the general pattern may indicate an intrusion ● Fraud: Cluster per profile and look for anomalous transactions at different levels (card, user, user groups) ● Identify Incorrect Data ● Remove Outliers ● Model Competence / Input Data Drift: Models performance can be downgraded because new data has evolved to be statistically different. Check the prediction's anomaly score. Clusters and Anomaly Detection Use cases
  • 29.
    BigML, Inc. 29 Clusters andAnomaly Detection Statistical anomaly indicators ● Univariate-approach: Given a single variable, and assuming normal distribution (Gaussian). Compute the standard deviation and choose a multiple of it as threshold to define what's anomalous. ● Benford's law: In real-life numeric sets the small digits occur disproportionately often as leading significant digits.
  • 30.
    BigML, Inc. 30 Clusters andAnomaly Detection Isolation forests ● Train several random decision trees that over-fit data till each instance is completely isolated ● Use the medium depth of these trees as threshold to compute the anomaly score, a number from 0 to 1 where 0 is similar and 1 is dissimilar ● New instances are run through the trees and assigned an anomaly score according to the average depth they reach
  • 31.
    BigML, Inc. 31 Clusters andAnomaly Detection Anomaly Detector output ● Subset of instances that don’t comply with the general patterns in the dataset. ● Each anomalous instance has information about which fields makes it anomalous.
  • 32.
    BigML, Inc. 32 ● AssociationDiscovery is an unsupervised technique, like clustering and anomaly detection. ● Uses the “Magnum Opus” algorithm by Geoff Webb Association Discovery Poul Petersen Looking for “interesting” relations between variables date customer account auth class zip amount Mon Bob 3421 pin clothes 46140 135 Tue Bob 3421 sign food 46140 401 Tue Alice 2456 pin food 12222 234 Wed Sally 6788 pin gas 26339 94 Wed Bob 3421 pin tech 21350 2459 Wed Bob 3421 pin gas 46140 83 Tue Sally 6788 sign food 26339 51 {class = gas} amount < 100 {customer = Bob, account = 3421} zip = 46140 Antecedent Consequent
  • 33.
    BigML, Inc. 33 Association Discovery UseCases Market Basket Analysis Web usage patterns Intrusion detection Fraud detection Bioinformatics Medical risk factors
  • 34.
    BigML, Inc. 34 ● Veryhigh support patterns can be spurious ● Very infrequent patterns can be significant So the user selects the measure of interest System finds the top-k associations on that measure within constraints – Must be statistically significant interaction between antecedent and consequent – Every item in the antecedent must increase the strength of association Association Discovery It turns out that: Problems with frequent pattern mining ● Often results in too few or too many patterns ● Some high value patterns are infrequent, etc.
  • 35.
  • 36.
    BigML, Inc. 36 Association Discovery Output:meaningful relations and metrics
  • 37.
    BigML, Inc. 37 A documentcan be analyzed from different levels ● According to its terms (one or more words) ● According to its topics (distributions of terms ~ semantics) ● Documents are generated by repeatedly drawing a topic and a term in that topic at random ● Goal: To infer the topic distribution How? Dirichlet Process is used to model the term| topic, and topic|document distributions Latent Dirichlet Allocation Thinking of documents in terms of Topics Generative Models for documents
  • 38.
    BigML, Inc. 39 ● Topicscan reduce the feature space ● Are nicely interpretable ● Automatically tailored to the document ● Need to choose the number of topics ● Takes a lot of time to fit or do inference ● Takes a lot of text to make it meaningful ● Tends to focus on “meaningless minutiae” Latent Dirichlet Allocation Nice properties about topics Caveats
  • 39.
    BigML, Inc. 40 ● Setof topics detected in the training collection of documents ● Terms related to each topic and their probability distibution ● Topic distribution to classify documents Latent Dirichlet Allocation Topic Models outputs