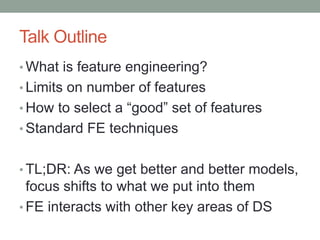
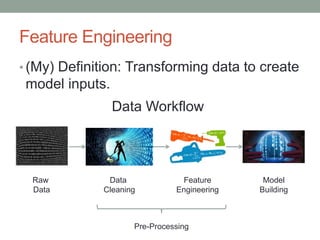
FEATURE
ENGINEERING
David Epstein
O P E N
D A T A
S C I E N C E
C O N F E R E N C E_
BOSTON 2015
@opendatasci
FEATURE
ENGINEERING
David Epstein
Senior Data Scientist, Socure
Open Data Science Conference, Boston, MA
May 30-31, 2015
#ODSC, @opendatasci
Talk Outline
• What is feature engineering?
• Limits on number of features
• How to select a “good” set of features
• Standard FE techniques
• TL;DR: As we get better and better models,
focus shifts to what we put into them
• FE interacts with other key areas of DS
Feature Engineering
• (My) Definition: Transforming data to create
model inputs.
Raw
Data
Data
Cleaning
Feature
Engineering
Model
Building
Pre-Processing
Data Workflow
Examples from Kaggle Competitions
Netflix
Titanic
Portuguese Taxis
How does it work?
Coefficients:
Estimate Std. Error t value Pr(>|t|)
(Intercept) 0.29879 0.48994 0.61 0.559
x -0.00923 0.10256 -0.09 0.930
x2 0.98803 0.03672 26.91 3.92e-09 ***
---
Residual standard error: 1.076 on 8 degrees of freedom
Multiple R-squared: 0.9891, Adjusted R-squared: 0.9863
F-statistic: 362 on 2 and 8 DF, p-value: 1.427e-08
Coefficients:
Estimate Std. Error t value Pr(>|t|)
(Intercept) 10.17912 2.92472 3.48 0.00693 **
x -0.00923 0.92488 -0.01 0.99225
---
Residual standard error: 9.7 on 9 degrees of freedom
Multiple R-squared: 1.107e-05, Adjusted R-squared: -0.11
F-statistic: 9.96e-05 on 1 and 9 DF, p-value: 0.9923
Features are engineered everywhere
Things to be explained/measured/predicted
Finance:
EBITDA
Baseball:
Batting Avg.
Politics:
Partisan Performance
The Big Questions
• Seen in this light, FE is ubiquitous (as all
truly important concepts are)
• Any time you construct an intermediate
variable, you’re doing FE
• Two questions naturally arise:
1. How do you construct “good” features?
2. What are the limits on this process?
• I’ll answer the second one first, because it’s
easier….
Limits on Feature Engineering
• In medical studies, social science, financial analysis, etc.,
two main problems emerge
• Eating up degrees of freedom: relatively small data sets
• # of respondents in survey
• # of patients in trial
• # of elections to Congress
• If your data lives in an NxK matrix, you want to make sure that K is
small relative to N
• Relevance to hypothesis testing, emphasis on explanation
• You generally start with an equation defining the relationship
between the key independent and dependent variables
• Other variables enter your model as controls, not really interested
in their functional form
Limits on Feature Engineering
• In most modern data science applications, neither is an
issue
• We start with lots of data, and
• Care more about prediction than explanation
• So why not add in lots of extra variables?
• Think of your data not as what goes into your model, but a starting
point for the creation of new variables, which can then be combined…
Limits on Feature Engineering
• First, adding many correlated predictors can decrease model
performance
• Adding an x4 term to above example actually reduces model fit:
• More variables make models less interpretable
• Models have to be generalizable to other data
• Too much feature engineering can lead to overfitting
• Close connection between feature engineering and cross-validation
Coefficients:
Estimate Std. Error t value Pr(>|t|)
(Intercept) 0.648123 0.628178 1.032 0.336513
x -0.009230 0.103740 -0.089 0.931593
x2 0.866738 0.139087 6.232 0.000432 ***
x4 0.004852 0.005361 0.905 0.395572
---
Residual standard error: 1.088 on 7 degrees of freedom
Multiple R-squared: 0.9902, Adjusted R-squared: 0.986
F-statistic: 236.1 on 3 and 7 DF, p-value: 2.15e-07
How To Select a “Good” Set of Features
• This is the open-ended question in the field
• Separate (but related to) the question of feature selection
– which variables to retain in a model.
• You can use some metrics to tell which features are
useful, one at a time, like Pearson correlation coefficient
• But this can’t tell you which set of features works best together
• This is an NP complete problem, clearly too computationally hard
• Many new data analysis services include automated
feature engineering as part of their packages
• But if there are features you want in your model, it’s best to add
them in explicitly, rather than depend on these generators.
A “Middle Theory” of FE
• Start with a reasonable-sized set of features
• Include features suggested by domain knowledge
• Test these out individually, build from the bottom up
• Number and type of features depend on model used
• Can include more features if models does some feature selection
• Lasso regression, e.g., logit with ||L1|| regularization (but not ||L2|| ridge)
• GBM with backward pruning (but not random forests)
• Stepwise regression, with either forward or backward feature selection
• Some models are invariant to monotonic variable transformations
• Tree-based approaches divide variables into two groups at each branch
• So, no perfect answer. But there are some standard
techniques every data scientist should have in their bag of
tricks.
Non-numeric to numeric
1. Count # of times each value appears
Zip Code Count
10024 4
63105 2
94304 1
06443 3
10024 4
63105 2
06443 3
10024 4
10024 4
06443 3
Non-numeric to numeric
2. One-hot encoding
Religion Catholic Protestant Jewish Muslim
Catholic 1 0 0 0
Muslim 0 0 0 1
Jewish 0 0 1 0
Protestant 0 1 0 0
Catholic 1 0 0 0
Catholic 1 0 0 0
Jewish 0 0 1 0
Protestant 0 1 0 0
Muslim 0 0 0 1
Protestant 0 1 0 0
Non-numeric to numeric
3. The “hash trick”
string h(string)
“The” 36
“quick” 8
“brown” 92
“fox” 14
“jumps” 75
“over” 25
“the” 36
“lazy” 44
“dog” 21
Non-numeric to numeric
4. Leave-one-out encoding
Single Variable Transformations
x
x2
Log(x)
scaling
x
Two-variable combinations
1. Add: Sum similar-scaled variables
Q1 Q2 Q3 Q4 Total
33 88 51 81 251
11 11 72 30 124
15 36 70 55 176
70 82 8 50 209
99 56 35 86 276
7 20 10 71 107
65 0 25 74 164
96 25 2 89 211
60 29 56 92 238
63 50 96 61 269
Two-variable combinations
2. Subtract: Difference relative to baseline
ViewerID MovieID Date Rating
Days Since
First Rating
44972004 8825 1/1/13 5 0
44972004 0471 2/1/13 4 31
44972004 3816 3/1/13 5 59
44972004 8243 4/1/13 3 90
44972004 2855 5/1/13 5 120
44972004 9923 6/1/13 2 151
44972004 1023 7/1/13 4 181
44972004 8306 8/1/13 3 212
44972004 2771 9/1/13 2 243
44972004 5281 10/1/13 2 273
Two-variable combinations
3. Multiply: Interactive effects
ViewerID Country Domestic DSFR Dom*DSFR
8825 US 1 38 38
0471 CA 0 277 0
3816 FR 0 187 0
8243 US 1 33 33
2855 US 1 87 87
9923 GB 0 42 0
1023 IT 0 192 0
8306 CA 0 365 0
2771 US 1 505 505
5281 FI 0 49 0
Two-variable combinations
4. Divide: Scaling/Normalizing
Country GDP Population
GDP/Capit
a
US 159849 275 581
CA 731812 111 6593
FR 826320 90 9181
IT 573494 80 7169
IR 609223 22 27692
GB 717673 60 11961
NE 605257 15 40350
MX 687944 124 5548
RU 203319 402 506
FI 744983 40 18625
Multivariate/Model-based Methods
1. PCA/Factor Analysis/Clustering: Dimension reduction
Multivariate/Model-based Methods
2. Model Stacking: Outputs of one model are inputs
to the next
• Do this, e.g., on half the data and use as input to the other
half, and vice-versa
(Figure from Owen Zhang)
Conclusion
• Data science grew over the last decade due to
improved modeling algorithms, better cross-
validation procedures
• Now we have a number of good models, can get
at problem from lots of different angles
• Most improvement will come from thinking
carefully about what we put into our models =
Feature Engineering
• This can be (semi-) automated, but it’s still one of
the true arts of the profession
• Domain knowledge remains very important in practice

Feature Engineering

  • 1.
    FEATURE ENGINEERING David Epstein O PE N D A T A S C I E N C E C O N F E R E N C E_ BOSTON 2015 @opendatasci
  • 2.
    FEATURE ENGINEERING David Epstein Senior DataScientist, Socure Open Data Science Conference, Boston, MA May 30-31, 2015 #ODSC, @opendatasci
  • 3.
    Talk Outline • Whatis feature engineering? • Limits on number of features • How to select a “good” set of features • Standard FE techniques • TL;DR: As we get better and better models, focus shifts to what we put into them • FE interacts with other key areas of DS
  • 4.
    Feature Engineering • (My)Definition: Transforming data to create model inputs. Raw Data Data Cleaning Feature Engineering Model Building Pre-Processing Data Workflow
  • 5.
    Examples from KaggleCompetitions Netflix Titanic Portuguese Taxis
  • 6.
    How does itwork? Coefficients: Estimate Std. Error t value Pr(>|t|) (Intercept) 0.29879 0.48994 0.61 0.559 x -0.00923 0.10256 -0.09 0.930 x2 0.98803 0.03672 26.91 3.92e-09 *** --- Residual standard error: 1.076 on 8 degrees of freedom Multiple R-squared: 0.9891, Adjusted R-squared: 0.9863 F-statistic: 362 on 2 and 8 DF, p-value: 1.427e-08 Coefficients: Estimate Std. Error t value Pr(>|t|) (Intercept) 10.17912 2.92472 3.48 0.00693 ** x -0.00923 0.92488 -0.01 0.99225 --- Residual standard error: 9.7 on 9 degrees of freedom Multiple R-squared: 1.107e-05, Adjusted R-squared: -0.11 F-statistic: 9.96e-05 on 1 and 9 DF, p-value: 0.9923
  • 7.
    Features are engineeredeverywhere Things to be explained/measured/predicted Finance: EBITDA Baseball: Batting Avg. Politics: Partisan Performance
  • 8.
    The Big Questions •Seen in this light, FE is ubiquitous (as all truly important concepts are) • Any time you construct an intermediate variable, you’re doing FE • Two questions naturally arise: 1. How do you construct “good” features? 2. What are the limits on this process? • I’ll answer the second one first, because it’s easier….
  • 9.
    Limits on FeatureEngineering • In medical studies, social science, financial analysis, etc., two main problems emerge • Eating up degrees of freedom: relatively small data sets • # of respondents in survey • # of patients in trial • # of elections to Congress • If your data lives in an NxK matrix, you want to make sure that K is small relative to N • Relevance to hypothesis testing, emphasis on explanation • You generally start with an equation defining the relationship between the key independent and dependent variables • Other variables enter your model as controls, not really interested in their functional form
  • 10.
    Limits on FeatureEngineering • In most modern data science applications, neither is an issue • We start with lots of data, and • Care more about prediction than explanation • So why not add in lots of extra variables? • Think of your data not as what goes into your model, but a starting point for the creation of new variables, which can then be combined…
  • 11.
    Limits on FeatureEngineering • First, adding many correlated predictors can decrease model performance • Adding an x4 term to above example actually reduces model fit: • More variables make models less interpretable • Models have to be generalizable to other data • Too much feature engineering can lead to overfitting • Close connection between feature engineering and cross-validation Coefficients: Estimate Std. Error t value Pr(>|t|) (Intercept) 0.648123 0.628178 1.032 0.336513 x -0.009230 0.103740 -0.089 0.931593 x2 0.866738 0.139087 6.232 0.000432 *** x4 0.004852 0.005361 0.905 0.395572 --- Residual standard error: 1.088 on 7 degrees of freedom Multiple R-squared: 0.9902, Adjusted R-squared: 0.986 F-statistic: 236.1 on 3 and 7 DF, p-value: 2.15e-07
  • 12.
    How To Selecta “Good” Set of Features • This is the open-ended question in the field • Separate (but related to) the question of feature selection – which variables to retain in a model. • You can use some metrics to tell which features are useful, one at a time, like Pearson correlation coefficient • But this can’t tell you which set of features works best together • This is an NP complete problem, clearly too computationally hard • Many new data analysis services include automated feature engineering as part of their packages • But if there are features you want in your model, it’s best to add them in explicitly, rather than depend on these generators.
  • 13.
    A “Middle Theory”of FE • Start with a reasonable-sized set of features • Include features suggested by domain knowledge • Test these out individually, build from the bottom up • Number and type of features depend on model used • Can include more features if models does some feature selection • Lasso regression, e.g., logit with ||L1|| regularization (but not ||L2|| ridge) • GBM with backward pruning (but not random forests) • Stepwise regression, with either forward or backward feature selection • Some models are invariant to monotonic variable transformations • Tree-based approaches divide variables into two groups at each branch • So, no perfect answer. But there are some standard techniques every data scientist should have in their bag of tricks.
  • 14.
    Non-numeric to numeric 1.Count # of times each value appears Zip Code Count 10024 4 63105 2 94304 1 06443 3 10024 4 63105 2 06443 3 10024 4 10024 4 06443 3
  • 15.
    Non-numeric to numeric 2.One-hot encoding Religion Catholic Protestant Jewish Muslim Catholic 1 0 0 0 Muslim 0 0 0 1 Jewish 0 0 1 0 Protestant 0 1 0 0 Catholic 1 0 0 0 Catholic 1 0 0 0 Jewish 0 0 1 0 Protestant 0 1 0 0 Muslim 0 0 0 1 Protestant 0 1 0 0
  • 16.
    Non-numeric to numeric 3.The “hash trick” string h(string) “The” 36 “quick” 8 “brown” 92 “fox” 14 “jumps” 75 “over” 25 “the” 36 “lazy” 44 “dog” 21
  • 17.
    Non-numeric to numeric 4.Leave-one-out encoding
  • 18.
  • 19.
    Two-variable combinations 1. Add:Sum similar-scaled variables Q1 Q2 Q3 Q4 Total 33 88 51 81 251 11 11 72 30 124 15 36 70 55 176 70 82 8 50 209 99 56 35 86 276 7 20 10 71 107 65 0 25 74 164 96 25 2 89 211 60 29 56 92 238 63 50 96 61 269
  • 20.
    Two-variable combinations 2. Subtract:Difference relative to baseline ViewerID MovieID Date Rating Days Since First Rating 44972004 8825 1/1/13 5 0 44972004 0471 2/1/13 4 31 44972004 3816 3/1/13 5 59 44972004 8243 4/1/13 3 90 44972004 2855 5/1/13 5 120 44972004 9923 6/1/13 2 151 44972004 1023 7/1/13 4 181 44972004 8306 8/1/13 3 212 44972004 2771 9/1/13 2 243 44972004 5281 10/1/13 2 273
  • 21.
    Two-variable combinations 3. Multiply:Interactive effects ViewerID Country Domestic DSFR Dom*DSFR 8825 US 1 38 38 0471 CA 0 277 0 3816 FR 0 187 0 8243 US 1 33 33 2855 US 1 87 87 9923 GB 0 42 0 1023 IT 0 192 0 8306 CA 0 365 0 2771 US 1 505 505 5281 FI 0 49 0
  • 22.
    Two-variable combinations 4. Divide:Scaling/Normalizing Country GDP Population GDP/Capit a US 159849 275 581 CA 731812 111 6593 FR 826320 90 9181 IT 573494 80 7169 IR 609223 22 27692 GB 717673 60 11961 NE 605257 15 40350 MX 687944 124 5548 RU 203319 402 506 FI 744983 40 18625
  • 23.
    Multivariate/Model-based Methods 1. PCA/FactorAnalysis/Clustering: Dimension reduction
  • 24.
    Multivariate/Model-based Methods 2. ModelStacking: Outputs of one model are inputs to the next • Do this, e.g., on half the data and use as input to the other half, and vice-versa (Figure from Owen Zhang)
  • 25.
    Conclusion • Data sciencegrew over the last decade due to improved modeling algorithms, better cross- validation procedures • Now we have a number of good models, can get at problem from lots of different angles • Most improvement will come from thinking carefully about what we put into our models = Feature Engineering • This can be (semi-) automated, but it’s still one of the true arts of the profession • Domain knowledge remains very important in practice

Editor's Notes

  • #8 Seen in this light, FE is ubiquitous (as all truly important concepts are) Any time you construct an intermediate variable, you’re doing FE