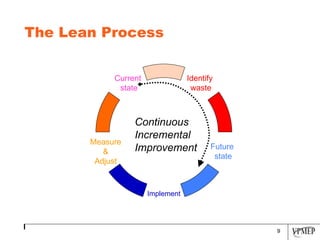
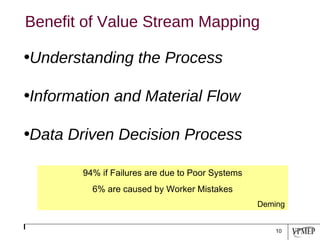
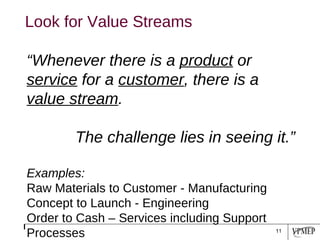
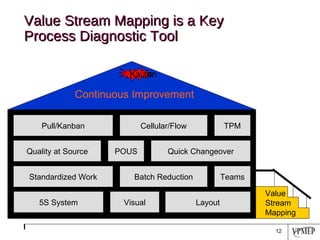
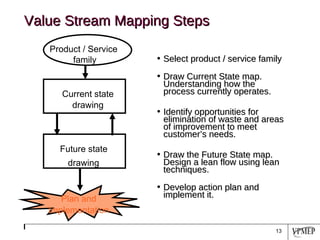
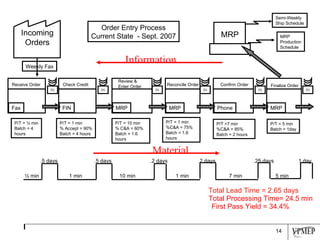
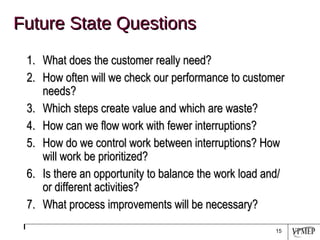
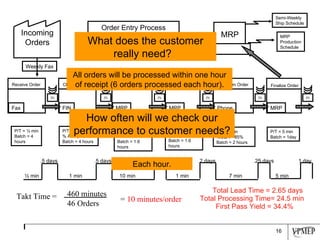
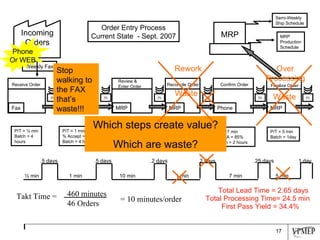
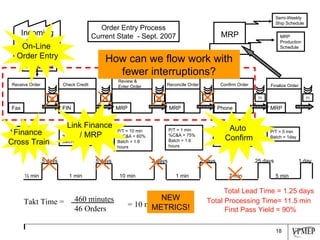
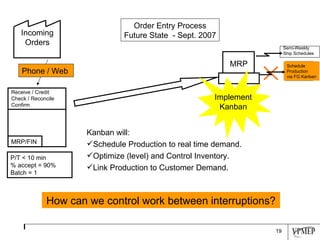
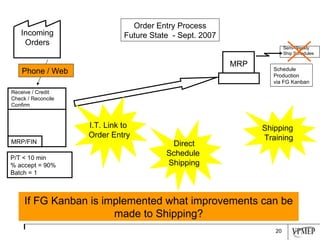
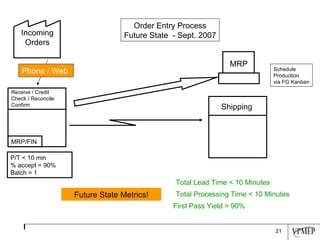
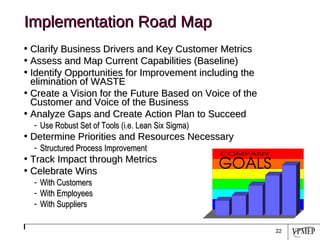
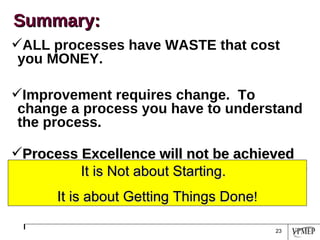
Value Stream Mapping – Gaining Traction, Getting Results
1 – Obstacle to Traction - WASTE 2  – Benefits of Value Stream Mapping 3  –  What is Value Stream Mapping? 4  –  A Road Map for Improvement Agenda
Obstacle of Traction:  Waste
What is WASTE? Any Activity that DOES NOT increase the Market Form or Function of the Product or Service based on the Critical Customer Requirements.   These are things the customer is NOT willing to pay for.
Definition of Value Added Value Added Any activity that increases the market form or function of the product or service.  (These are things the customer is willing to pay for.) Non-Value Added Any activity that does not add market form or function or is not necessary.  (These activities should be eliminated, simplified, reduced, or integrated.)
Lean = Eliminating the Wastes Value Added Typically 95% of all lead time is non-value added Non-Value Added D efects O verproduction W aiting N ot Utilizing Employees T ransportation I nventory M otion E xcess Processing
Where is the Waste? D efects – incomplete or incorrect information  O verproduction – releasing work before next  process can work on them, unbalanced work loads W aiting – unbalanced work loads, slow system response, incomplete information, approvals N ot Utilizing Employees – old guard thinking, politics, high turnover, low investment in training T ransportation – poor layout, poor flow I nventory – large batches, complexity to complete task M otion – poor organization, no standard work E xcess Processing – excess communication, lack of communication, unnecessary approvals, customer requirements are not clearly understood All processes have waste.
Without Change  There Can Be No Improvement “ The definition of insanity is doing the same thing over and over and expecting different results .” Albert Einstein
The Lean Process Identify waste Measure & Adjust Current state Future state Implement Continuous Incremental Improvement
Understanding the Process Information and Material Flow Data Driven Decision Process Benefit of Value Stream Mapping 94% if Failures are due to Poor Systems 6% are caused by Worker Mistakes Deming
“ Whenever there is a  product  or  service  for a  customer , there is a  value stream .  The challenge lies in seeing it.” Examples: Raw Materials to Customer - Manufacturing Concept to Launch - Engineering Order to Cash – Services including Support Processes  Look for Value Streams
Value Stream Mapping is a Key Process Diagnostic Tool Continuous Improvement Kaizen Quick Changeover Standardized Work Batch Reduction Teams Quality at Source 5S System Visual Layout POUS Cellular/Flow Pull/Kanban TPM Value Stream Mapping
Value Stream Mapping Steps Select product / service family Draw Current State map.  Understanding how the process currently operates.  Identify opportunities for elimination of waste and areas of improvement to meet customer’s needs. Draw the Future State map. Design a lean flow using lean techniques. Develop action plan and implement it. Product / Service  family Future state drawing drawing Current state Plan   and   Implementation
MRP Production Schedule Semi-Weekly Ship Schedule .5 days .5 days .2 days .2 days .25 days 1 day ½ min 1 min 10 min 1 min 7 min 5 min Total Lead Time = 2.65 days Total Processing Time= 24.5 min Order Entry Process Current State  - Sept. 2007 First Pass Yield = 34.4% Weekly Fax Incoming Orders Receive Order Fax Check Credit FIN Review & Enter Order MRP Reconcile Order MRP Confirm Order Phone Finalize Order MRP MRP P/T = ½ min Batch = 4 hours IN P/T = 1 min % Accept = 90% Batch = 4 hours IN P/T = 10 min % C&A = 60% Batch = 1.6 hours IN P/T = 1 min %C&A = 75% Batch = 1.6 hours IN P/T =7 min %C&A = 85% Batch = 2 hours IN P/T = 5 min Batch = 1day IN Information Material
Future State Questions What does the customer really need? How often will we check our performance to customer needs? Which steps create value and which are waste? How can we flow work with fewer interruptions? How do we control work between interruptions? How will work be prioritized? Is there an opportunity to balance the work load and/or different activities?  What process improvements will be necessary?
MRP Production Schedule Semi-Weekly Ship Schedule .5 days .5 days .2 days .2 days .25 days 1 day ½ min 1 min 10 min 1 min 7 min 5 min Total Lead Time = 2.65 days Total Processing Time= 24.5 min Order Entry Process Current State  - Sept. 2007 First Pass Yield = 34.4% Weekly Fax What does the customer really need?   How often will we check our performance to customer needs? All orders will be processed within one hour of receipt (6 orders processed each hour). Each hour. Incoming Orders Receive Order Fax Check Credit FIN Review & Enter Order MRP Reconcile Order MRP Confirm Order Phone Finalize Order MRP MRP P/T = ½ min Batch = 4 hours IN P/T = 1 min % Accept = 90% Batch = 4 hours IN P/T = 10 min % C&A = 60% Batch = 1.6 hours IN P/T = 1 min %C&A = 75% Batch = 1.6 hours IN P/T =7 min %C&A = 85% Batch = 2 hours IN P/T = 5 min Batch = 1day IN 460 minutes 46 Orders =  10 minutes/order Takt Time =
MRP Production Schedule Semi-Weekly Ship Schedule .5 days .5 days .2 days .2 days .25 days 1 day ½ min 1 min 10 min 1 min 7 min 5 min Total Lead Time = 2.65 days Total Processing Time= 24.5 min Order Entry Process Current State  - Sept. 2007 First Pass Yield = 34.4% Weekly Fax Stop walking to the FAX that’s waste!!! Which steps create value? Which are waste? Incoming Orders Receive Order Fax Check Credit FIN Review & Enter Order MRP Reconcile Order MRP Confirm Order Phone Finalize Order MRP MRP P/T = ½ min Batch = 4 hours IN P/T = 1 min % Accept = 90% Batch = 4 hours IN P/T = 10 min % C&A = 60% Batch = 1.6 hours IN P/T = 1 min %C&A = 75% Batch = 1.6 hours IN P/T =7 min %C&A = 85% Batch = 2 hours IN P/T = 5 min Batch = 1day IN Phone Or WEB Waste Over Processing Waste Rework 460 minutes 46 Orders = 10 minutes/order Takt Time =
MRP Production Schedule Semi-Weekly Ship Schedule .5 days .5 days .2 days .2 days .25 days 1 day ½ min 1 min 10 min 1 min 7 min 5 min Order Entry Process Current State  - Sept. 2007 Weekly Fax Finance Cross Train Link Finance / MRP On-Line  Order Entry How can we flow work with fewer interruptions? Total Lead Time = 1.25 days Total Processing Time= 11.5 min NEW METRICS! First Pass Yield = 90% 460 minutes 46 Orders = 10 minutes/order Takt Time =  Incoming Orders Receive Order Fax Check Credit FIN Review & Enter Order MRP Reconcile Order MRP Confirm Order Phone Finalize Order MRP MRP P/T = ½ min Batch = 4 hours IN P/T = 1 min % Accept = 90% Batch = 4 hours IN P/T = 10 min % C&A = 60% Batch = 1.6 hours IN P/T = 1 min %C&A = 75% Batch = 1.6 hours IN P/T =7 min %C&A = 85% Batch = 2 hours IN P/T = 5 min Batch = 1day IN Auto Confirm
Receive / Credit Check / Reconcile Confirm MRP/FIN MRP MRP Production Schedule P/T < 10 min % accept = 90% Batch = 1 Order Entry Process Future State  - Sept. 2007 Phone / Web Semi-Weekly Ship Schedules How can we control work between interruptions?   Schedule Production via FG Kanban Implement Kanban Kanban will: Schedule Production to real time demand. Optimize (level) and Control Inventory. Link Production to Customer Demand. Incoming Orders
Receive / Credit Check / Reconcile Confirm MRP/FIN MRP P/T < 10 min % accept = 90% Batch = 1 Order Entry Process Future State  - Sept. 2007 Phone / Web Semi-Weekly Ship Schedules Schedule Production via FG Kanban Shipping  Training Direct Schedule  Shipping If FG Kanban is implemented what improvements can be made to Shipping? I.T. Link to  Order Entry Incoming Orders
Receive / Credit Check / Reconcile Confirm MRP/FIN MRP P/T < 10 min % accept = 90% Batch = 1 Order Entry Process Future State  - Sept. 2007 Phone / Web Schedule Production via FG Kanban Total Lead Time < 10 Minutes Total Processing Time < 10 Minutes Future State Metrics! First Pass Yield > 90% Incoming Orders Shipping
Implementation Road Map Clarify Business Drivers and Key Customer Metrics Assess and Map Current Capabilities (Baseline) Identify Opportunities for Improvement including the elimination of WASTE Create a Vision for the Future Based on Voice of the Customer and Voice of the Business Analyze Gaps and Create Action Plan to Succeed Use Robust Set of Tools (i.e. Lean Six Sigma) Determine Priorities and Resources Necessary Structured Process Improvement Track Impact through Metrics Celebrate Wins With Customers With Employees With Suppliers
ALL processes have WASTE that cost you MONEY. Improvement requires change.  To change a process you have to understand the process. Process Excellence will not be achieved without involving people at all levels of the organization. Summary: It is Not about Starting.  It is about Getting Things Done !
Questions?
Parting Thought Learning is not compulsory …   neither is survival. Dr. Deming

Vpmep vsm gaining traction

  • 1.
    Value Stream Mapping– Gaining Traction, Getting Results
  • 2.
    1 – Obstacleto Traction - WASTE 2 – Benefits of Value Stream Mapping 3 – What is Value Stream Mapping? 4 – A Road Map for Improvement Agenda
  • 3.
  • 4.
    What is WASTE?Any Activity that DOES NOT increase the Market Form or Function of the Product or Service based on the Critical Customer Requirements. These are things the customer is NOT willing to pay for.
  • 5.
    Definition of ValueAdded Value Added Any activity that increases the market form or function of the product or service. (These are things the customer is willing to pay for.) Non-Value Added Any activity that does not add market form or function or is not necessary. (These activities should be eliminated, simplified, reduced, or integrated.)
  • 6.
    Lean = Eliminatingthe Wastes Value Added Typically 95% of all lead time is non-value added Non-Value Added D efects O verproduction W aiting N ot Utilizing Employees T ransportation I nventory M otion E xcess Processing
  • 7.
    Where is theWaste? D efects – incomplete or incorrect information O verproduction – releasing work before next process can work on them, unbalanced work loads W aiting – unbalanced work loads, slow system response, incomplete information, approvals N ot Utilizing Employees – old guard thinking, politics, high turnover, low investment in training T ransportation – poor layout, poor flow I nventory – large batches, complexity to complete task M otion – poor organization, no standard work E xcess Processing – excess communication, lack of communication, unnecessary approvals, customer requirements are not clearly understood All processes have waste.
  • 8.
    Without Change There Can Be No Improvement “ The definition of insanity is doing the same thing over and over and expecting different results .” Albert Einstein
  • 9.
    The Lean ProcessIdentify waste Measure & Adjust Current state Future state Implement Continuous Incremental Improvement
  • 10.
    Understanding the ProcessInformation and Material Flow Data Driven Decision Process Benefit of Value Stream Mapping 94% if Failures are due to Poor Systems 6% are caused by Worker Mistakes Deming
  • 11.
    “ Whenever thereis a product or service for a customer , there is a value stream . The challenge lies in seeing it.” Examples: Raw Materials to Customer - Manufacturing Concept to Launch - Engineering Order to Cash – Services including Support Processes Look for Value Streams
  • 12.
    Value Stream Mappingis a Key Process Diagnostic Tool Continuous Improvement Kaizen Quick Changeover Standardized Work Batch Reduction Teams Quality at Source 5S System Visual Layout POUS Cellular/Flow Pull/Kanban TPM Value Stream Mapping
  • 13.
    Value Stream MappingSteps Select product / service family Draw Current State map. Understanding how the process currently operates. Identify opportunities for elimination of waste and areas of improvement to meet customer’s needs. Draw the Future State map. Design a lean flow using lean techniques. Develop action plan and implement it. Product / Service family Future state drawing drawing Current state Plan and Implementation
  • 14.
    MRP Production ScheduleSemi-Weekly Ship Schedule .5 days .5 days .2 days .2 days .25 days 1 day ½ min 1 min 10 min 1 min 7 min 5 min Total Lead Time = 2.65 days Total Processing Time= 24.5 min Order Entry Process Current State - Sept. 2007 First Pass Yield = 34.4% Weekly Fax Incoming Orders Receive Order Fax Check Credit FIN Review & Enter Order MRP Reconcile Order MRP Confirm Order Phone Finalize Order MRP MRP P/T = ½ min Batch = 4 hours IN P/T = 1 min % Accept = 90% Batch = 4 hours IN P/T = 10 min % C&A = 60% Batch = 1.6 hours IN P/T = 1 min %C&A = 75% Batch = 1.6 hours IN P/T =7 min %C&A = 85% Batch = 2 hours IN P/T = 5 min Batch = 1day IN Information Material
  • 15.
    Future State QuestionsWhat does the customer really need? How often will we check our performance to customer needs? Which steps create value and which are waste? How can we flow work with fewer interruptions? How do we control work between interruptions? How will work be prioritized? Is there an opportunity to balance the work load and/or different activities? What process improvements will be necessary?
  • 16.
    MRP Production ScheduleSemi-Weekly Ship Schedule .5 days .5 days .2 days .2 days .25 days 1 day ½ min 1 min 10 min 1 min 7 min 5 min Total Lead Time = 2.65 days Total Processing Time= 24.5 min Order Entry Process Current State - Sept. 2007 First Pass Yield = 34.4% Weekly Fax What does the customer really need? How often will we check our performance to customer needs? All orders will be processed within one hour of receipt (6 orders processed each hour). Each hour. Incoming Orders Receive Order Fax Check Credit FIN Review & Enter Order MRP Reconcile Order MRP Confirm Order Phone Finalize Order MRP MRP P/T = ½ min Batch = 4 hours IN P/T = 1 min % Accept = 90% Batch = 4 hours IN P/T = 10 min % C&A = 60% Batch = 1.6 hours IN P/T = 1 min %C&A = 75% Batch = 1.6 hours IN P/T =7 min %C&A = 85% Batch = 2 hours IN P/T = 5 min Batch = 1day IN 460 minutes 46 Orders = 10 minutes/order Takt Time =
  • 17.
    MRP Production ScheduleSemi-Weekly Ship Schedule .5 days .5 days .2 days .2 days .25 days 1 day ½ min 1 min 10 min 1 min 7 min 5 min Total Lead Time = 2.65 days Total Processing Time= 24.5 min Order Entry Process Current State - Sept. 2007 First Pass Yield = 34.4% Weekly Fax Stop walking to the FAX that’s waste!!! Which steps create value? Which are waste? Incoming Orders Receive Order Fax Check Credit FIN Review & Enter Order MRP Reconcile Order MRP Confirm Order Phone Finalize Order MRP MRP P/T = ½ min Batch = 4 hours IN P/T = 1 min % Accept = 90% Batch = 4 hours IN P/T = 10 min % C&A = 60% Batch = 1.6 hours IN P/T = 1 min %C&A = 75% Batch = 1.6 hours IN P/T =7 min %C&A = 85% Batch = 2 hours IN P/T = 5 min Batch = 1day IN Phone Or WEB Waste Over Processing Waste Rework 460 minutes 46 Orders = 10 minutes/order Takt Time =
  • 18.
    MRP Production ScheduleSemi-Weekly Ship Schedule .5 days .5 days .2 days .2 days .25 days 1 day ½ min 1 min 10 min 1 min 7 min 5 min Order Entry Process Current State - Sept. 2007 Weekly Fax Finance Cross Train Link Finance / MRP On-Line Order Entry How can we flow work with fewer interruptions? Total Lead Time = 1.25 days Total Processing Time= 11.5 min NEW METRICS! First Pass Yield = 90% 460 minutes 46 Orders = 10 minutes/order Takt Time = Incoming Orders Receive Order Fax Check Credit FIN Review & Enter Order MRP Reconcile Order MRP Confirm Order Phone Finalize Order MRP MRP P/T = ½ min Batch = 4 hours IN P/T = 1 min % Accept = 90% Batch = 4 hours IN P/T = 10 min % C&A = 60% Batch = 1.6 hours IN P/T = 1 min %C&A = 75% Batch = 1.6 hours IN P/T =7 min %C&A = 85% Batch = 2 hours IN P/T = 5 min Batch = 1day IN Auto Confirm
  • 19.
    Receive / CreditCheck / Reconcile Confirm MRP/FIN MRP MRP Production Schedule P/T < 10 min % accept = 90% Batch = 1 Order Entry Process Future State - Sept. 2007 Phone / Web Semi-Weekly Ship Schedules How can we control work between interruptions? Schedule Production via FG Kanban Implement Kanban Kanban will: Schedule Production to real time demand. Optimize (level) and Control Inventory. Link Production to Customer Demand. Incoming Orders
  • 20.
    Receive / CreditCheck / Reconcile Confirm MRP/FIN MRP P/T < 10 min % accept = 90% Batch = 1 Order Entry Process Future State - Sept. 2007 Phone / Web Semi-Weekly Ship Schedules Schedule Production via FG Kanban Shipping Training Direct Schedule Shipping If FG Kanban is implemented what improvements can be made to Shipping? I.T. Link to Order Entry Incoming Orders
  • 21.
    Receive / CreditCheck / Reconcile Confirm MRP/FIN MRP P/T < 10 min % accept = 90% Batch = 1 Order Entry Process Future State - Sept. 2007 Phone / Web Schedule Production via FG Kanban Total Lead Time < 10 Minutes Total Processing Time < 10 Minutes Future State Metrics! First Pass Yield > 90% Incoming Orders Shipping
  • 22.
    Implementation Road MapClarify Business Drivers and Key Customer Metrics Assess and Map Current Capabilities (Baseline) Identify Opportunities for Improvement including the elimination of WASTE Create a Vision for the Future Based on Voice of the Customer and Voice of the Business Analyze Gaps and Create Action Plan to Succeed Use Robust Set of Tools (i.e. Lean Six Sigma) Determine Priorities and Resources Necessary Structured Process Improvement Track Impact through Metrics Celebrate Wins With Customers With Employees With Suppliers
  • 23.
    ALL processes haveWASTE that cost you MONEY. Improvement requires change. To change a process you have to understand the process. Process Excellence will not be achieved without involving people at all levels of the organization. Summary: It is Not about Starting. It is about Getting Things Done !
  • 24.
  • 25.
    Parting Thought Learningis not compulsory … neither is survival. Dr. Deming

Editor's Notes

  • #15 ________________________________________________________________________________________________________________________________________________________________________________________________________________________________________________________________________________________________________________________________________________________________________
  • #16 ________________________________________________________________________________________________________________________________________________________________________________________________________________________________________________________________________________________________________________________________________________________________________
  • #17 ________________________________________________________________________________________________________________________________________________________________________________________________________________________________________________________________________________________________________________________________________________________________________
  • #18 ________________________________________________________________________________________________________________________________________________________________________________________________________________________________________________________________________________________________________________________________________________________________________
  • #19 ________________________________________________________________________________________________________________________________________________________________________________________________________________________________________________________________________________________________________________________________________________________________________
  • #20 ________________________________________________________________________________________________________________________________________________________________________________________________________________________________________________________________________________________________________________________________________________________________________
  • #21 ________________________________________________________________________________________________________________________________________________________________________________________________________________________________________________________________________________________________________________________________________________________________________
  • #22 ________________________________________________________________________________________________________________________________________________________________________________________________________________________________________________________________________________________________________________________________________________________________________