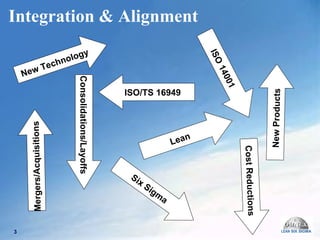
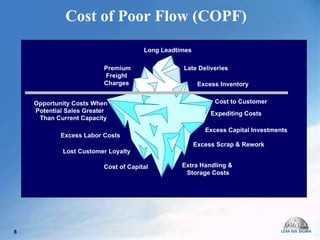
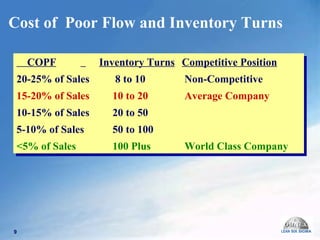
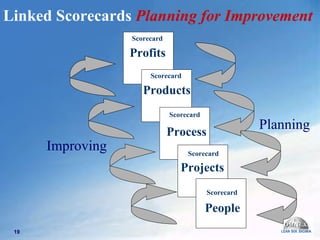
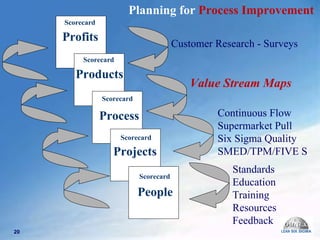
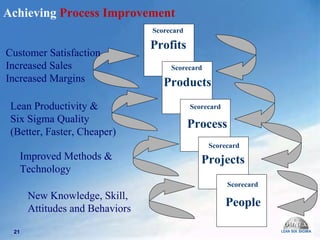
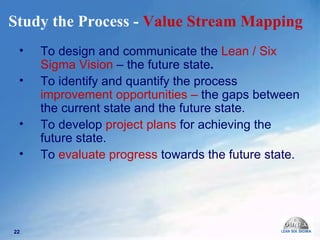
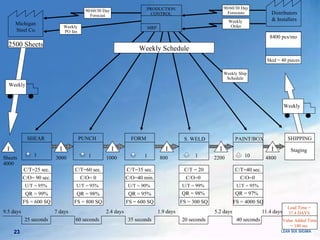
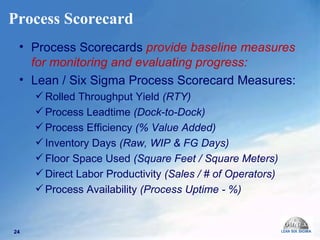
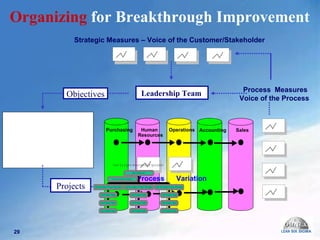
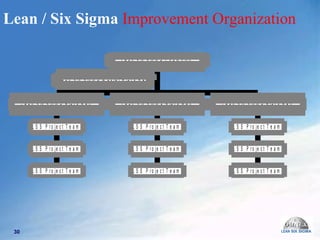
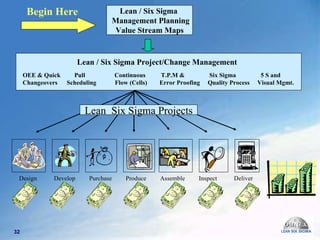
Integrating Lean & Six Sigma Using Value Stream Mapping and Linked Scorecards  to Achieve Breakthrough Improvements in  Quality, Productivity and Competitive Position Ron Mitchell  ASQ, Hamilton, Ontario – 3/10/04
Ron Mitchell Ron Mitchell is Director of Lean & Six Sigma Services at Omnex.  He is a trainer and consultant with twenty years experience-helping  clients understand and apply Lean Manufacturing and Quality Improvement Technologies.  Ron studied the Toyota Production System at NUMMI, the joint General Motors and Toyota Motors Corporation facility in Fremont, California; and, he was part of the team that helped launch Synchronous Manufacturing at General Motors. Ron received his training in Quality Management from Dr. W.E. Deming, Dorian Shainin and through The Crosby Quality College.  Ron is a Lean Manufacturing Master Black Belt and a Six Sigma Master Black Belt. Ron holds Bachelor’s and Master’s Degrees in Industrial and Organizational Psychology and a PhD – Abd in Behavioral Systems Analysis.
Integration & Alignment  Lean  Six Sigma ISO/TS 16949 New Products ISO 14001  Cost Reductions Mergers/Acquisitions Consolidations/Layoffs New Technology
Cost of Poor Quality and Sigma COPQ   Sigma   PPM Position 20-25% of Sales   2.0   308,537   Non Competitive   15-20% of Sales   3.0   66,807    Average Company   10-15% of Sales   4.0 6,210 5-10% of Sales   5.0   233 <5% of Sales     6.0  3.4  World Class
Quality engineering and administration Inspection/test (materials, equipment, labor) Expediting Scrap Rework Rejects Warranty claims Maintenance and service Cost to customers  Excess inventory Additional labor hours Longer cycle times Quality audits Vendor control Improvement program costs Process control Opportunity cost if sales greater than plant capacity Cost of Poor Quality (COPQ)  “ What about the greatest cost of all… the cost of a lost customer?”  Dr. W.E. Deming
Cost Savings from  Six Sigma General Electric  reported that Six Sigma produced in excess of  $2 Billion in savings in 1999 alone. Motorola  used Six Sigma to win the first Malcolm Baldrige National Quality Award and  reported cumulative  savings in excess of $14 Billion in the first ten years. Ford Motor Company  reported that Six Sigma projects saved over  $385 Million in 2002.
The Lean Enterprise* Lean companies use less of everything than do mass production companies: half the human effort in the factory, half the manufacturing space, half the investment in tools,  half the engineering hours to develop a new product in half the time, less than half the inventory  *From Womack, Jones, et.al.,  “ The Machine that Changed the World.”
Extra Handling &  Storage Costs Expediting Costs Premium Freight  Charges  Late Deliveries  Long Leadtimes Cost to Customer  Excess Inventory Excess Scrap & Rework Cost of Capital  Lost Customer Loyalty Excess Labor Costs Opportunity Costs When Potential Sales Greater  Than Current Capacity Cost of Poor Flow (COPF)  Excess Capital Investments
Cost of  Poor Flow and Inventory Turns COPF   Inventory Turns   Competitive Position   20-25% of Sales  8 to 10   Non-Competitive 15-20% of Sales 10 to 20   Average Company 10-15% of Sales 20 to 50 5-10% of Sales 50 to 100 <5% of Sales 100 Plus   World Class Company
World Class Processes  C – Combine L – Lean A – And S – Six  S – Sigma  Lean Productivity with Six Sigma Quality  equals  WORLD CLASS Performance. Better, Faster and Cheaper!
Toyota Production System
Toyota Today FY 2003 profit report - $12 Billion in pre-tax operating profits. More than the Ford, GM & Daimler/Chrysler... combined. Toyota has 11% share of the global market compared with over 60% for  The Detroit 3.   Toyota’s current market capitalization is $100 billion…. more than the market caps of the Detroit 3 combined.
Show Me the Money!!! Cost of Poor Flow  Cost of Poor Quality
Why  SO LITTLE  Progress? Lack of Commitment/Support From: Management  Supervision Workforce Union Suppliers Customers Lack of Direction / Focus. Lack of Resources: Time Budgets Skill
Managing Change -  the Key to Success
Change Management  As Competition Changes: Technology Must Adapt –  Manage the Technology Organization’s Must Adapt –  Manage the Culture Groups/Teams Must Adapt –  Manage the Group Dynamics Individuals Must Adapt –  Manage the Psychology
21 st  Century Management  Plan  - identify and prioritize improvement projects; Organize  – provide the resources to drive improvement;  Motivate  - manage the change process.
Balanced Scorecards  Performance measures must address the concerns of  ALL STAKEHOLDERS . You don’t want to optimize one measure at the expense of the others. Price Quality Delivery Technology Service Profit Margins Customer Satisfaction Employee Satisfaction
Profits Products Process Projects People Scorecard Scorecard Scorecard Scorecard Scorecard Linked Scorecards  Planning for Improvement   Planning Improving
Profits Products Process Projects People Scorecard Scorecard Scorecard Scorecard Scorecard Customer Research - Surveys  Value Stream Maps  Continuous Flow  Supermarket Pull Six Sigma Quality  SMED/TPM/FIVE S Standards Education Training Resources Feedback Planning for  Process Improvement
Profits Products Process Projects People Scorecard Scorecard Scorecard Scorecard Scorecard Achieving  Process Improvement New Knowledge, Skill,  Attitudes and Behaviors Improved Methods &  Technology  Lean Productivity &  Six Sigma Quality (Better, Faster, Cheaper)  Customer Satisfaction  Increased Sales  Increased Margins
Study the Process -  Value Stream Mapping   To design and communicate the  Lean / Six Sigma Vision  – the future state .   To identify and quantify the process  improvement opportunities –  the gaps   between the current state and the future state. To develop   project plans  for achieving the future state. To   evaluate progress  towards the future state.
8400 pcs/mo Skid = 40 pieces Distributors & Installers Weekly FS = 600 SQ FS = 800 SQ FS = 300 SQ FS = 4000 SQ 9.5 days 7 days 2.4 days 1.9 days 5.2 days 11.4 days 25 seconds 60 seconds 35 seconds 20 seconds 40 seconds Weekly Ship Schedule Weekly Schedule C/T=25 sec. C/O= 90 sec. U/T = 95%  QR = 99% SHEAR PUNCH C/T=60 sec. C/O= 0 U/T = 95%  QR = 98% FORM C/T=35 sec. C/O=40 min. U/T = 90%  QR = 95% 1 C/T = 20 C/O=0  U/T = 99%  1 FS = 600 SQ S. WELD QR = 98% QR = 97% PAINT/BOX 1 1 PRODUCTION CONTROL MRP Weekly PO fax 90/60/30 Day Forecast 90/60/30 Day Forecasts Weekly  Order Weekly I Sheets 4000  I 3000 I 1000 I 800 I 2200 I 4800 Lead Time =  37.4 DAYS  Value Added Time  = 180 sec  2500 Sheets Michigan  Steel Co. 10 C/T=40 sec. C/O=0  U/T = 95%  SHIPPING Staging
Process Scorecard Process Scorecards  provide baseline measures for monitoring and evaluating progress: Lean / Six Sigma Process Scorecard Measures: Rolled Throughput Yield  (RTY) Process Leadtime  (Dock-to-Dock)  Process Efficiency  (% Value Added) Inventory Days  (Raw, WIP & FG Days) Floor Space Used  (Square Feet / Square Meters) Direct Labor Productivity  (Sales / # of Operators) Process Availability  (Process Uptime - %)
Measure  Current State  Future State  Improvement   Raw Inventory Days WIP Inventory Days F.G. Inventory Days Process Leadtime Process Efficiency Rolled Throughput Yield  Floor Space  Labor Productivity Process Scorecard for: DSM Cabinet Body Mfg. 9. 5 Days 16. 5 Days 11. 4 Days 37. 4  Days 88% 2300 SQ Ft. * 105 / OP. * . 02% * Mfg. Only – excludes paint and assembly operation. Availability 90%
8400 pcs/mo Skid = 40 pieces Distributors & Installers Daily Daily  Ship  Schedule 2 Days  10 PAINT/BOX   Body Cell 2 Days  Daily  1 Future State Map DSM Cabinet Body Cell October 7, 2003 TT = 60 sec. U/T Cell Pull Supplier Develop PRODUCTION CONTROL MRP Daily PO fax 90/60/30 Day Forecast 90/60/30 Day Forecasts Daily  Order 500 Sheets Michigan  Steel Co. SHIPPING Staging 1 Day 40 40 100 C/T = 59 sec. C/O = 90 sec. Uptime = 99% FTQ = 99.9% FS = 875 FS = 4000 SQ C/T=40 sec. C/O=0  U/T = 95%  FTQ = 99.9%  FTQ FTQ C/O
Measure  Current State  Future State  Est. Savings Raw Inventory Days WIP Inventory Days F.G. Inventory Days Process Leadtime Process Efficiency Rolled Throughput Yield   Floor Space   Labor Productivity Availability  Process Scorecard for: ____________________ DSM Cabinet Body Mfg . 9. 5 Days  2 Days 16. 5 Days  1 Day 11. 4 Days  2 Days 37. 4  Days  5 Days 88%  99.9% 2300 SQ Ft. *  875 SQ Ft. * 105 / OP. *  420 / OP. * 90% 99.9% . 02%  . 07% * Mfg. only – excludes paint and assembly operation.
Measure  Current State  Future State  Savings   Raw Inventory Days WIP Inventory Days F.G. Inventory Days Process Leadtime Process Efficiency Rolled Throughput Yield  Floor Space  Labor Productivity Availability TOTAL SAVINGS  Process Scorecard for: ____________________ DSM Cabinet Body Mfg. 9. 5 Days  2 Days  $147,100* 16. 5 Days  1 Day  $313,404*   11. 4 Days  2 Days  $185,484*   37. 4  Days  5 Days  88%  99.9%   $2,387,045 2300 SQ Ft2  875 SQ Ft2  $28,500  105 / OP.  420 / OP.  $270,000 90%  99.9%  $1,034,208 $4,365,741 . 02%  . 07%   *Fixed cost savings from reduced inventory carrying costs… $3.2 Million in capital savings.
Accounting Human Resources Operations Purchasing Sales Strategic Measures – Voice of the Customer/Stakeholder  Process  Variation  Process  Measures Voice of the Process  Leadership Team Objectives Organizing  for Breakthrough Improvement  Projects
Lean / Six Sigma  Improvement Organization
Managing Change -  Motivating  Set High Expectations Communicate, Communicate, Communicate Remove the Roadblocks Accept Failure, Recognize Success The ONLY CONSTANT is Change
Lean / Six Sigma  Management Planning Value Stream Maps Lean / Six Sigma Project/Change Management  OEE & Quick  Pull  Continuous  T.P.M &  Six Sigma  5 S and  Changeovers  Scheduling  Flow (Cells)  Error Proofing  Quality Process  Visual Mgmt. Design  Develop  Purchase  Produce  Assemble  Inspect  Deliver Lean  Six Sigma Projects Begin Here
Questions & Answers

Asq int lss

  • 1.
    Integrating Lean &Six Sigma Using Value Stream Mapping and Linked Scorecards to Achieve Breakthrough Improvements in Quality, Productivity and Competitive Position Ron Mitchell ASQ, Hamilton, Ontario – 3/10/04
  • 2.
    Ron Mitchell RonMitchell is Director of Lean & Six Sigma Services at Omnex. He is a trainer and consultant with twenty years experience-helping clients understand and apply Lean Manufacturing and Quality Improvement Technologies. Ron studied the Toyota Production System at NUMMI, the joint General Motors and Toyota Motors Corporation facility in Fremont, California; and, he was part of the team that helped launch Synchronous Manufacturing at General Motors. Ron received his training in Quality Management from Dr. W.E. Deming, Dorian Shainin and through The Crosby Quality College. Ron is a Lean Manufacturing Master Black Belt and a Six Sigma Master Black Belt. Ron holds Bachelor’s and Master’s Degrees in Industrial and Organizational Psychology and a PhD – Abd in Behavioral Systems Analysis.
  • 3.
    Integration & Alignment Lean Six Sigma ISO/TS 16949 New Products ISO 14001 Cost Reductions Mergers/Acquisitions Consolidations/Layoffs New Technology
  • 4.
    Cost of PoorQuality and Sigma COPQ Sigma PPM Position 20-25% of Sales 2.0 308,537 Non Competitive 15-20% of Sales 3.0 66,807 Average Company 10-15% of Sales 4.0 6,210 5-10% of Sales 5.0 233 <5% of Sales 6.0 3.4 World Class
  • 5.
    Quality engineering andadministration Inspection/test (materials, equipment, labor) Expediting Scrap Rework Rejects Warranty claims Maintenance and service Cost to customers Excess inventory Additional labor hours Longer cycle times Quality audits Vendor control Improvement program costs Process control Opportunity cost if sales greater than plant capacity Cost of Poor Quality (COPQ) “ What about the greatest cost of all… the cost of a lost customer?” Dr. W.E. Deming
  • 6.
    Cost Savings from Six Sigma General Electric reported that Six Sigma produced in excess of $2 Billion in savings in 1999 alone. Motorola used Six Sigma to win the first Malcolm Baldrige National Quality Award and reported cumulative savings in excess of $14 Billion in the first ten years. Ford Motor Company reported that Six Sigma projects saved over $385 Million in 2002.
  • 7.
    The Lean Enterprise*Lean companies use less of everything than do mass production companies: half the human effort in the factory, half the manufacturing space, half the investment in tools, half the engineering hours to develop a new product in half the time, less than half the inventory *From Womack, Jones, et.al., “ The Machine that Changed the World.”
  • 8.
    Extra Handling & Storage Costs Expediting Costs Premium Freight Charges Late Deliveries Long Leadtimes Cost to Customer Excess Inventory Excess Scrap & Rework Cost of Capital Lost Customer Loyalty Excess Labor Costs Opportunity Costs When Potential Sales Greater Than Current Capacity Cost of Poor Flow (COPF) Excess Capital Investments
  • 9.
    Cost of Poor Flow and Inventory Turns COPF Inventory Turns Competitive Position 20-25% of Sales 8 to 10 Non-Competitive 15-20% of Sales 10 to 20 Average Company 10-15% of Sales 20 to 50 5-10% of Sales 50 to 100 <5% of Sales 100 Plus World Class Company
  • 10.
    World Class Processes C – Combine L – Lean A – And S – Six S – Sigma Lean Productivity with Six Sigma Quality equals WORLD CLASS Performance. Better, Faster and Cheaper!
  • 11.
  • 12.
    Toyota Today FY2003 profit report - $12 Billion in pre-tax operating profits. More than the Ford, GM & Daimler/Chrysler... combined. Toyota has 11% share of the global market compared with over 60% for The Detroit 3. Toyota’s current market capitalization is $100 billion…. more than the market caps of the Detroit 3 combined.
  • 13.
    Show Me theMoney!!! Cost of Poor Flow Cost of Poor Quality
  • 14.
    Why SOLITTLE Progress? Lack of Commitment/Support From: Management Supervision Workforce Union Suppliers Customers Lack of Direction / Focus. Lack of Resources: Time Budgets Skill
  • 15.
    Managing Change - the Key to Success
  • 16.
    Change Management As Competition Changes: Technology Must Adapt – Manage the Technology Organization’s Must Adapt – Manage the Culture Groups/Teams Must Adapt – Manage the Group Dynamics Individuals Must Adapt – Manage the Psychology
  • 17.
    21 st Century Management Plan - identify and prioritize improvement projects; Organize – provide the resources to drive improvement; Motivate - manage the change process.
  • 18.
    Balanced Scorecards Performance measures must address the concerns of ALL STAKEHOLDERS . You don’t want to optimize one measure at the expense of the others. Price Quality Delivery Technology Service Profit Margins Customer Satisfaction Employee Satisfaction
  • 19.
    Profits Products ProcessProjects People Scorecard Scorecard Scorecard Scorecard Scorecard Linked Scorecards Planning for Improvement Planning Improving
  • 20.
    Profits Products ProcessProjects People Scorecard Scorecard Scorecard Scorecard Scorecard Customer Research - Surveys Value Stream Maps Continuous Flow Supermarket Pull Six Sigma Quality SMED/TPM/FIVE S Standards Education Training Resources Feedback Planning for Process Improvement
  • 21.
    Profits Products ProcessProjects People Scorecard Scorecard Scorecard Scorecard Scorecard Achieving Process Improvement New Knowledge, Skill, Attitudes and Behaviors Improved Methods & Technology Lean Productivity & Six Sigma Quality (Better, Faster, Cheaper) Customer Satisfaction Increased Sales Increased Margins
  • 22.
    Study the Process- Value Stream Mapping To design and communicate the Lean / Six Sigma Vision – the future state . To identify and quantify the process improvement opportunities – the gaps between the current state and the future state. To develop project plans for achieving the future state. To evaluate progress towards the future state.
  • 23.
    8400 pcs/mo Skid= 40 pieces Distributors & Installers Weekly FS = 600 SQ FS = 800 SQ FS = 300 SQ FS = 4000 SQ 9.5 days 7 days 2.4 days 1.9 days 5.2 days 11.4 days 25 seconds 60 seconds 35 seconds 20 seconds 40 seconds Weekly Ship Schedule Weekly Schedule C/T=25 sec. C/O= 90 sec. U/T = 95% QR = 99% SHEAR PUNCH C/T=60 sec. C/O= 0 U/T = 95% QR = 98% FORM C/T=35 sec. C/O=40 min. U/T = 90% QR = 95% 1 C/T = 20 C/O=0 U/T = 99% 1 FS = 600 SQ S. WELD QR = 98% QR = 97% PAINT/BOX 1 1 PRODUCTION CONTROL MRP Weekly PO fax 90/60/30 Day Forecast 90/60/30 Day Forecasts Weekly Order Weekly I Sheets 4000 I 3000 I 1000 I 800 I 2200 I 4800 Lead Time = 37.4 DAYS Value Added Time = 180 sec 2500 Sheets Michigan Steel Co. 10 C/T=40 sec. C/O=0 U/T = 95% SHIPPING Staging
  • 24.
    Process Scorecard ProcessScorecards provide baseline measures for monitoring and evaluating progress: Lean / Six Sigma Process Scorecard Measures: Rolled Throughput Yield (RTY) Process Leadtime (Dock-to-Dock) Process Efficiency (% Value Added) Inventory Days (Raw, WIP & FG Days) Floor Space Used (Square Feet / Square Meters) Direct Labor Productivity (Sales / # of Operators) Process Availability (Process Uptime - %)
  • 25.
    Measure CurrentState Future State Improvement Raw Inventory Days WIP Inventory Days F.G. Inventory Days Process Leadtime Process Efficiency Rolled Throughput Yield Floor Space Labor Productivity Process Scorecard for: DSM Cabinet Body Mfg. 9. 5 Days 16. 5 Days 11. 4 Days 37. 4 Days 88% 2300 SQ Ft. * 105 / OP. * . 02% * Mfg. Only – excludes paint and assembly operation. Availability 90%
  • 26.
    8400 pcs/mo Skid= 40 pieces Distributors & Installers Daily Daily Ship Schedule 2 Days 10 PAINT/BOX   Body Cell 2 Days Daily  1 Future State Map DSM Cabinet Body Cell October 7, 2003 TT = 60 sec. U/T Cell Pull Supplier Develop PRODUCTION CONTROL MRP Daily PO fax 90/60/30 Day Forecast 90/60/30 Day Forecasts Daily Order 500 Sheets Michigan Steel Co. SHIPPING Staging 1 Day 40 40 100 C/T = 59 sec. C/O = 90 sec. Uptime = 99% FTQ = 99.9% FS = 875 FS = 4000 SQ C/T=40 sec. C/O=0 U/T = 95% FTQ = 99.9% FTQ FTQ C/O
  • 27.
    Measure CurrentState Future State Est. Savings Raw Inventory Days WIP Inventory Days F.G. Inventory Days Process Leadtime Process Efficiency Rolled Throughput Yield Floor Space Labor Productivity Availability Process Scorecard for: ____________________ DSM Cabinet Body Mfg . 9. 5 Days 2 Days 16. 5 Days 1 Day 11. 4 Days 2 Days 37. 4 Days 5 Days 88% 99.9% 2300 SQ Ft. * 875 SQ Ft. * 105 / OP. * 420 / OP. * 90% 99.9% . 02% . 07% * Mfg. only – excludes paint and assembly operation.
  • 28.
    Measure CurrentState Future State Savings Raw Inventory Days WIP Inventory Days F.G. Inventory Days Process Leadtime Process Efficiency Rolled Throughput Yield Floor Space Labor Productivity Availability TOTAL SAVINGS Process Scorecard for: ____________________ DSM Cabinet Body Mfg. 9. 5 Days 2 Days $147,100* 16. 5 Days 1 Day $313,404* 11. 4 Days 2 Days $185,484* 37. 4 Days 5 Days 88% 99.9% $2,387,045 2300 SQ Ft2 875 SQ Ft2 $28,500 105 / OP. 420 / OP. $270,000 90% 99.9% $1,034,208 $4,365,741 . 02% . 07% *Fixed cost savings from reduced inventory carrying costs… $3.2 Million in capital savings.
  • 29.
    Accounting Human ResourcesOperations Purchasing Sales Strategic Measures – Voice of the Customer/Stakeholder Process Variation Process Measures Voice of the Process Leadership Team Objectives Organizing for Breakthrough Improvement Projects
  • 30.
    Lean / SixSigma Improvement Organization
  • 31.
    Managing Change - Motivating Set High Expectations Communicate, Communicate, Communicate Remove the Roadblocks Accept Failure, Recognize Success The ONLY CONSTANT is Change
  • 32.
    Lean / SixSigma Management Planning Value Stream Maps Lean / Six Sigma Project/Change Management OEE & Quick Pull Continuous T.P.M & Six Sigma 5 S and Changeovers Scheduling Flow (Cells) Error Proofing Quality Process Visual Mgmt. Design Develop Purchase Produce Assemble Inspect Deliver Lean Six Sigma Projects Begin Here
  • 33.

Editor's Notes

  • #19 Balanced Scorecards
  • #21 Lean / Six Sigma Linked Scorecards
  • #23 Study the Process - Value Stream Mapping
  • #25 Process Scorecard
  • #30 Lean / Six Sigma Integrated with QOS
  • #31 The Lean / Six Sigma Improvement Organization