Download as PDF, PPTX

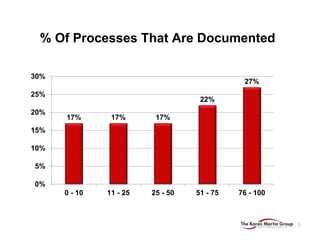
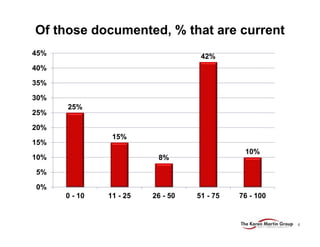
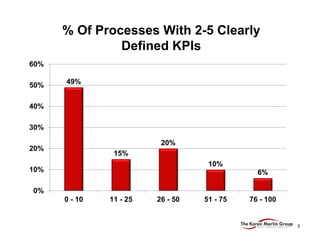
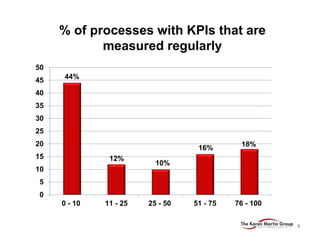
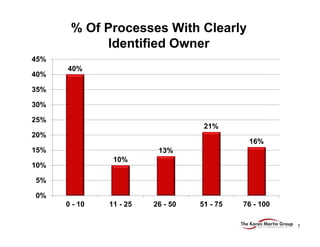
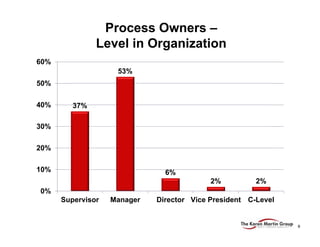

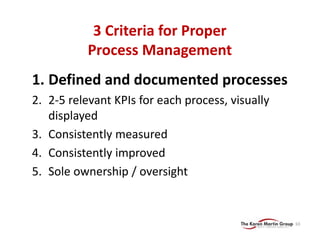
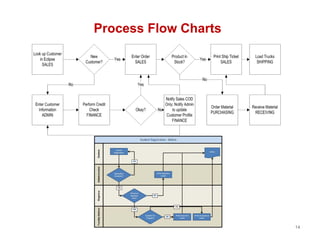
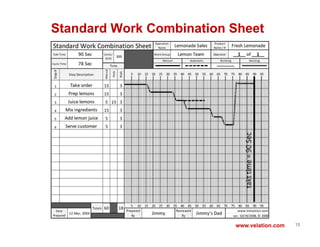
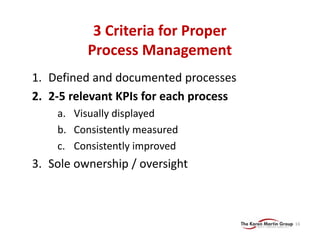
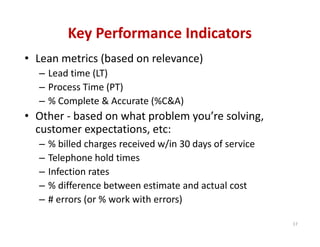
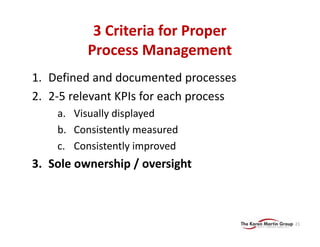

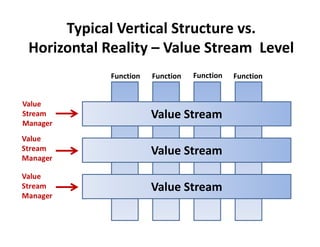
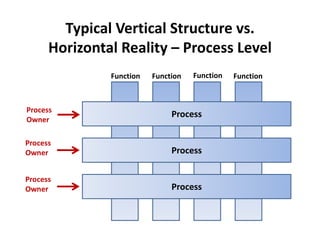
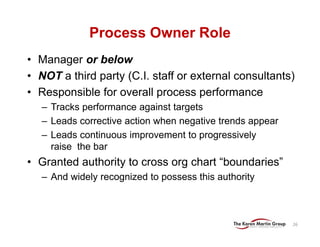


This document discusses process management and why many companies struggle with it. It provides data showing that most companies document few of their processes, and of those documented processes, most are not current. Additionally, few processes have clearly defined metrics or an identified owner. The document advocates for three criteria of proper process management: 1) defined and documented processes, 2) 2-5 relevant metrics that are visually displayed, consistently measured and improved, and 3) sole ownership and oversight of each process. It discusses how having process owners, rather than functional managers, leads to better process performance and continuous improvement.