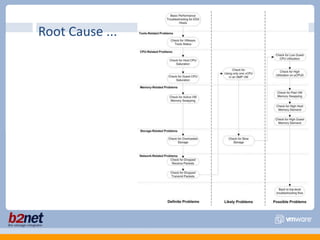
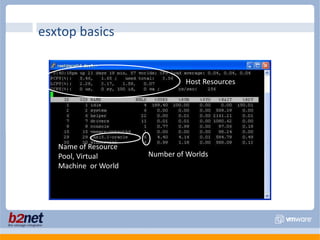
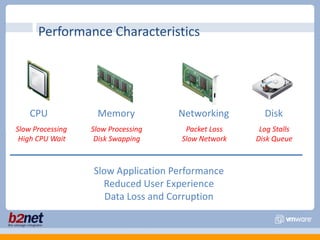
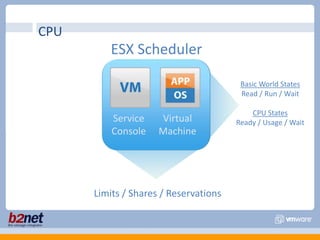
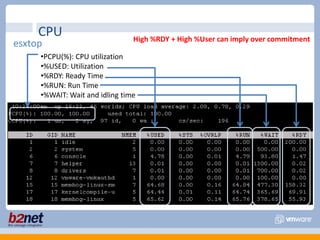
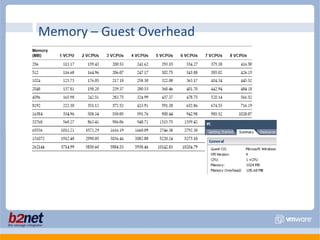
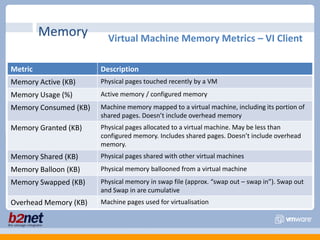
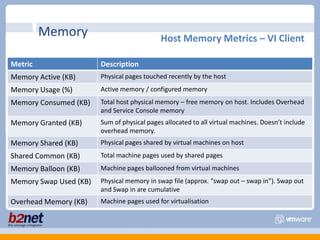
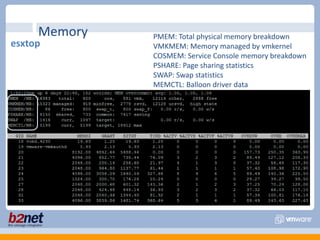
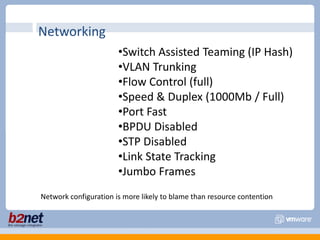
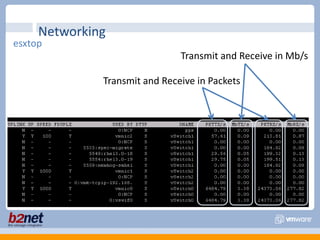
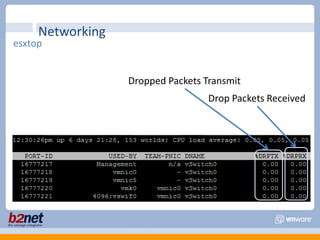
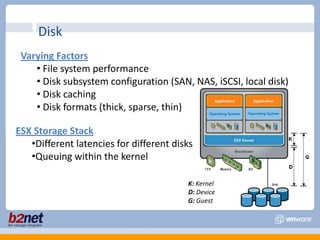
VMware Performance TroubleshootingPresented by Chris Kranz
Topics CoveredIntroductionRoot Cause AnalysisPerformance CharacteristicsCPUNetworkingMemoryDiskVirtual Machine optimisationESXTopvm-supportService ConsoleResource GroupsDesign GuidelinesCapacity Planner limitations and cautionsConclusionReference Articles
IntroductionMultiple layers of virtualisation are used to increase service levels, availability and manageabilityHowever, multiple layers of virtualisation often mask performance and configuration issues making it more of a challenge to troubleshoot and correctThe worst out come is that performance issues after a virtualisation project lead to the perception that VMware results in reduced performance and future confidence in VMware can be affected
Virtual Machine ResourcesCPUMemoryDiskNetworkingPerformance Basics
Resource Maximumshttp://www.vmware.com/pdf/vsphere4/r40/vsp_40_config_max.pdf
Typical HostTypical 3 VMs per core, 24VM’s per HostEach has 2GB of RAM = 48GB of RAM
Root Cause Analysishttp://www.vmware.com/resources/techresources/10066
Root Cause ...
Do not rely on guest tools, butCan show high CPU, & Memory UtilisationMeasurement of Latency & throughput of Disk & Network InterfacesUse the virtualisation layer, to diagnose cause:Guest is unaware of virtualisation workloadThe way in which guest OS’s account time is differentNo visibility of available resourcesMonitoring Performance
esxtop (service console only)resxtop (remote command line utilities)Performance graphs in vCentrePerformance Analysis Tools
esxtop can be run:Interactively Batch  (eg. esxtop -a -b > analysis.csv)Load batch into windows perfmon or MS ExcelTwo keys to rememberH : helpF : fields to displayesxtop
esxtop basicsHost ResourcesName of Resource Pool, Virtual Machine  or WorldNumber of Worlds
Performance CharacteristicsCPUNetworkingMemoryDiskSlow ProcessingHigh CPU WaitPacket LossSlow NetworkSlow ProcessingDisk SwappingLog StallsDisk QueueSlow Application PerformanceReduced User ExperienceData Loss and Corruption
CPUESX SchedulerBasic World StatesRead / Run / WaitCPU StatesReady / Usage / WaitServiceConsoleVirtualMachineLimits / Shares / Reservations
CPUHigh %RDY + High %User can imply over commitmentesxtopPCPU(%): CPU utilization
%USED: Utilization
%RDY: Ready Time
%RUN: Run Time
%WAIT: Wait and idling timeCPUVI-ClientUsed Time > Ready Time: Possible CPU over-committmentUsed TimeReady Time
CPUFurther Investigation%MLMTD shows this VM has been limited
CPUFurther InvestigationHigh ready time caused by CPU resource limit
VMware Memory Management Transparent Page Sharing
 VMware Tools Balloon Driver to force the VM to swap to disk
 Virtual Machine Page FileMemoryBallooning vs. SwappingBallooning driver causes the host to swap pages that it chooses to diskESX Swapping will swap any pages to disk.
Ballooning can be disabled (0 value) or controlled on a per Virtual Machine basis using:sched.mem.maxmemctlDefault is set to 65%, can be controlled at host level.Only is an issue in resource contention scenarios. (or VM’s with low latency eg Citrix)Memory
Memory - HostVI Client shows memory usage of the host. This is calculated as “consumed + overhead memory + Service Console”.Performance charts are a very good way of showing the Virtual Machine memory breakdown.  Consumed Memory
 Ballooned Memory
 Shared Memory
 Swapped MemoryMemory - GuestHost Memory = Consumed + Overhead MemoryGuest Memory = Active Memory for Guest OS
Memory – Guest Overhead
MemoryVirtual Machine Memory Metrics – VI Client
MemoryHost Memory Metrics – VI Client
MemoryPMEM: Total physical memory breakdownVMKMEM: Memory managed by vmkernelCOSMEM: Service Console memory breakdownPSHARE: Page sharing statisticsSWAP: Swap statisticsMEMCTL: Balloon driver dataesxtop
Memoryesxtop / VI Client metrics : Virtual Machines
Memoryesxtop / VI Client metrics : Host Usage
MemoryVI Client memory usage graph
MemoryTroubleshooting Memory usage issues
NetworkingSwitch Assisted Teaming (IP Hash)
VLAN Trunking
Flow Control (full)
Speed & Duplex (1000Mb / Full)
Port Fast
BPDU Disabled
STP Disabled
Link State Tracking
Jumbo FramesNetwork configuration is more likely to blame than resource contention
NetworkingesxtopTransmit and Receive in Mb/sTransmit and Receive in Packets
NetworkingesxtopDropped Packets TransmitDrop Packets Received
DiskVarying Factors File system performance
 Disk subsystem configuration (SAN, NAS, iSCSI, local disk)
 Disk caching
 Disk formats (thick, sparse, thin)ESX Storage StackDifferent latencies for different disks
Queuing within the kernelK: KernelD: DeviceG: Guest
DiskVI Client statisticsQuite Coarse Statistics Disk read / write rate (KB/s)

VMware Performance Troubleshooting