Downloaded 168 times
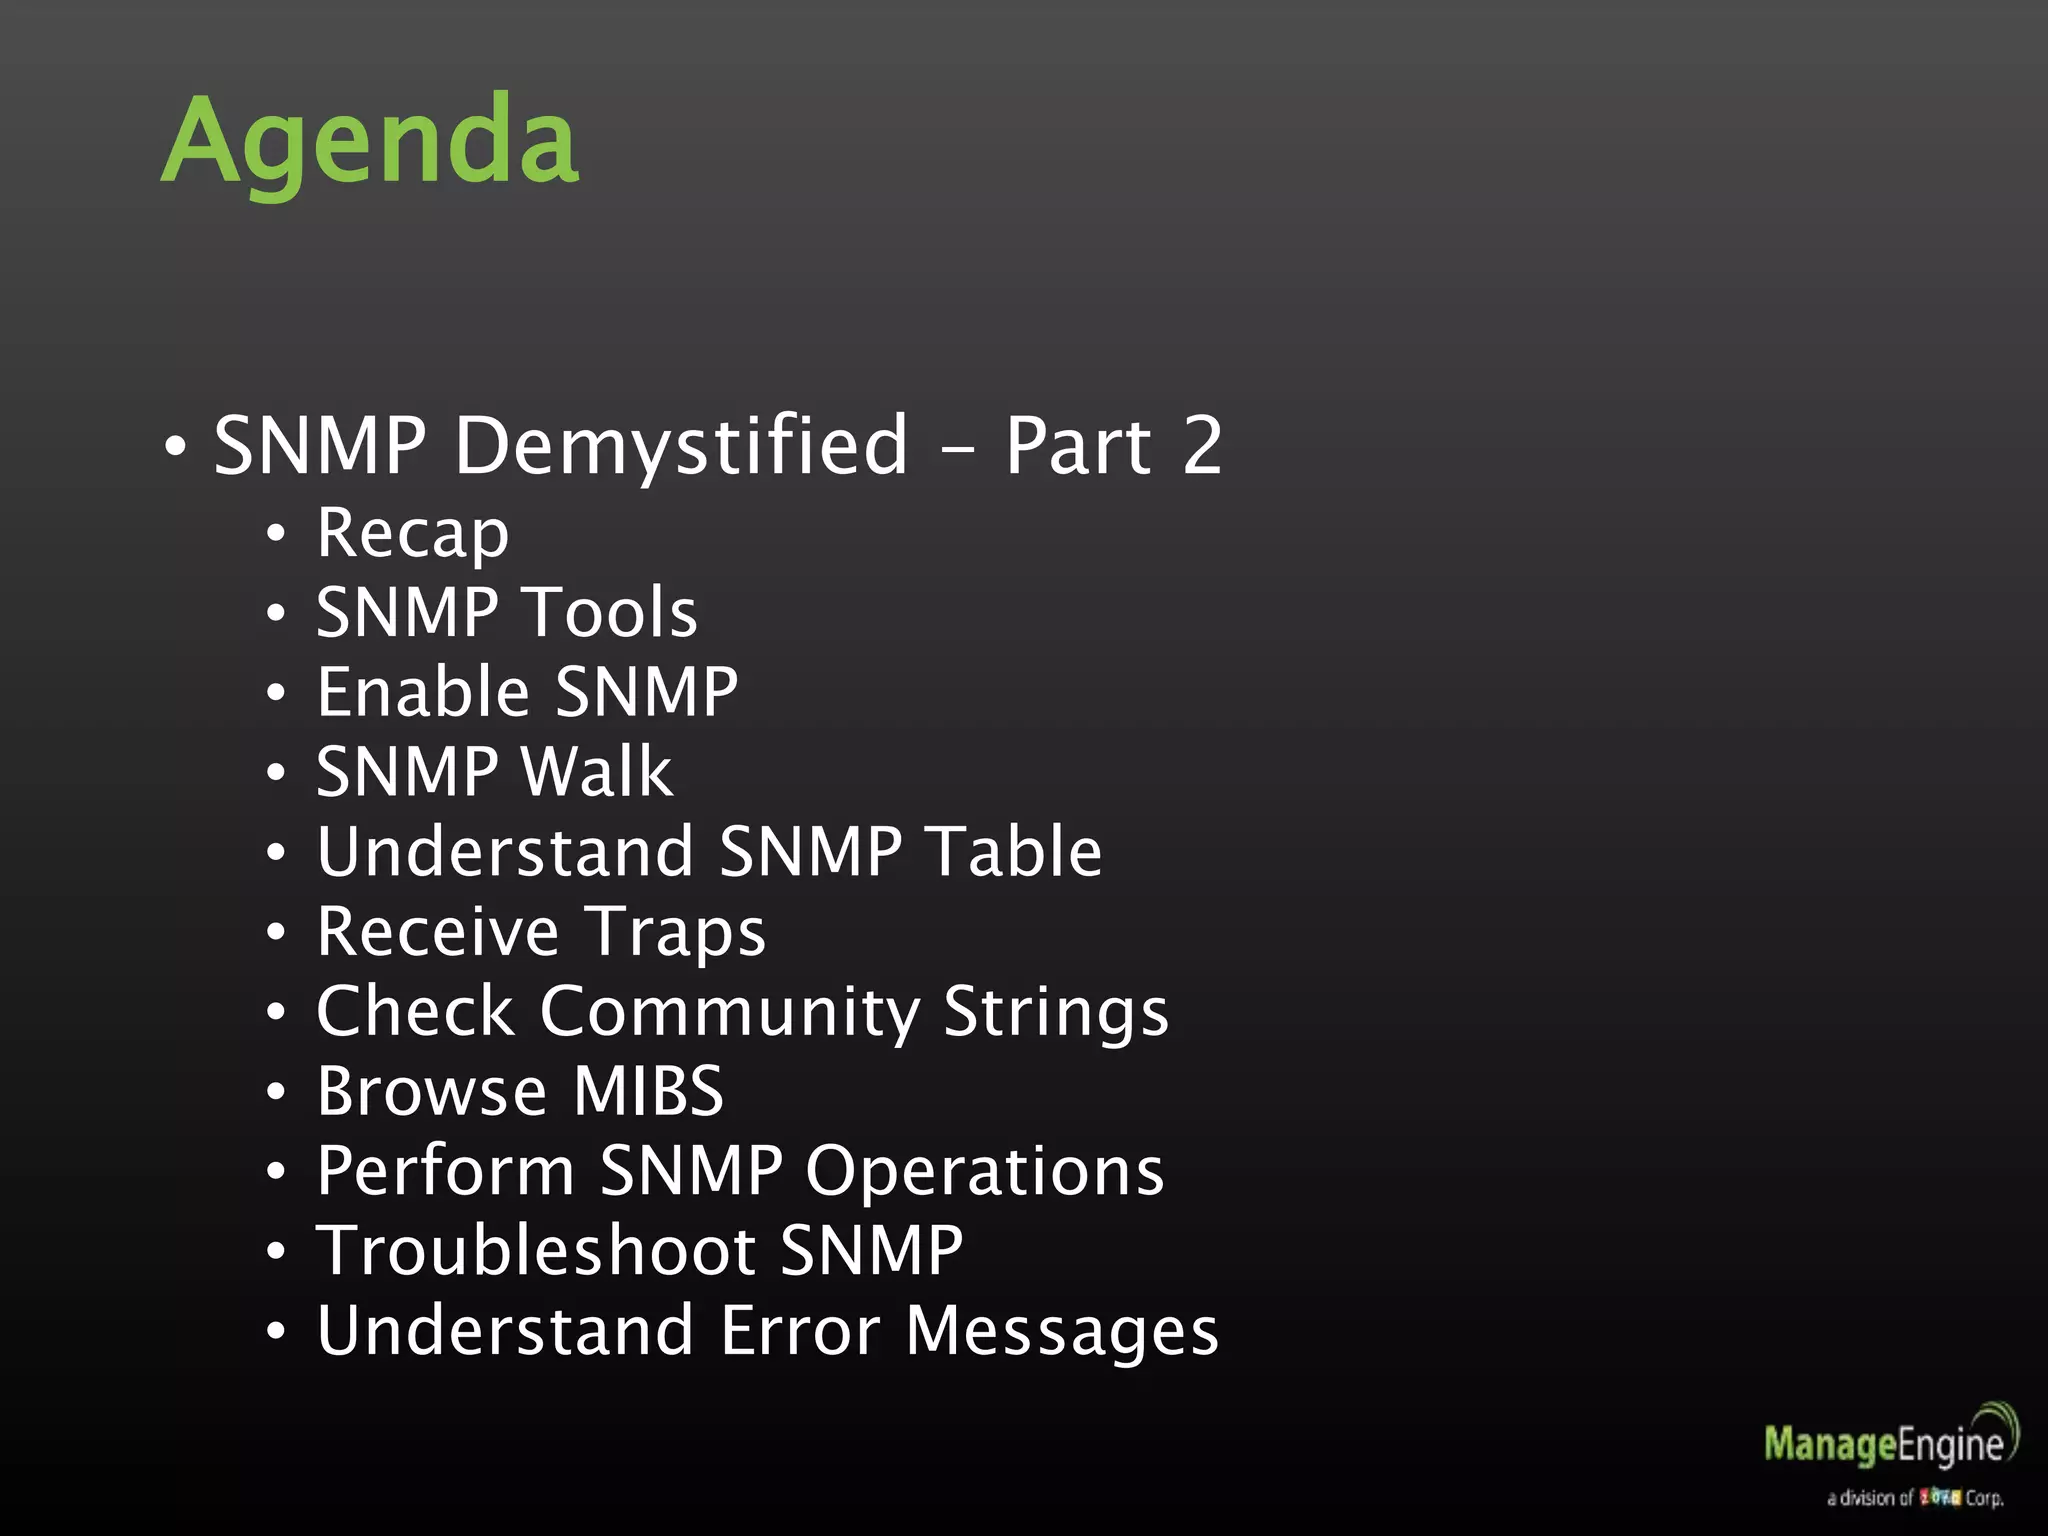
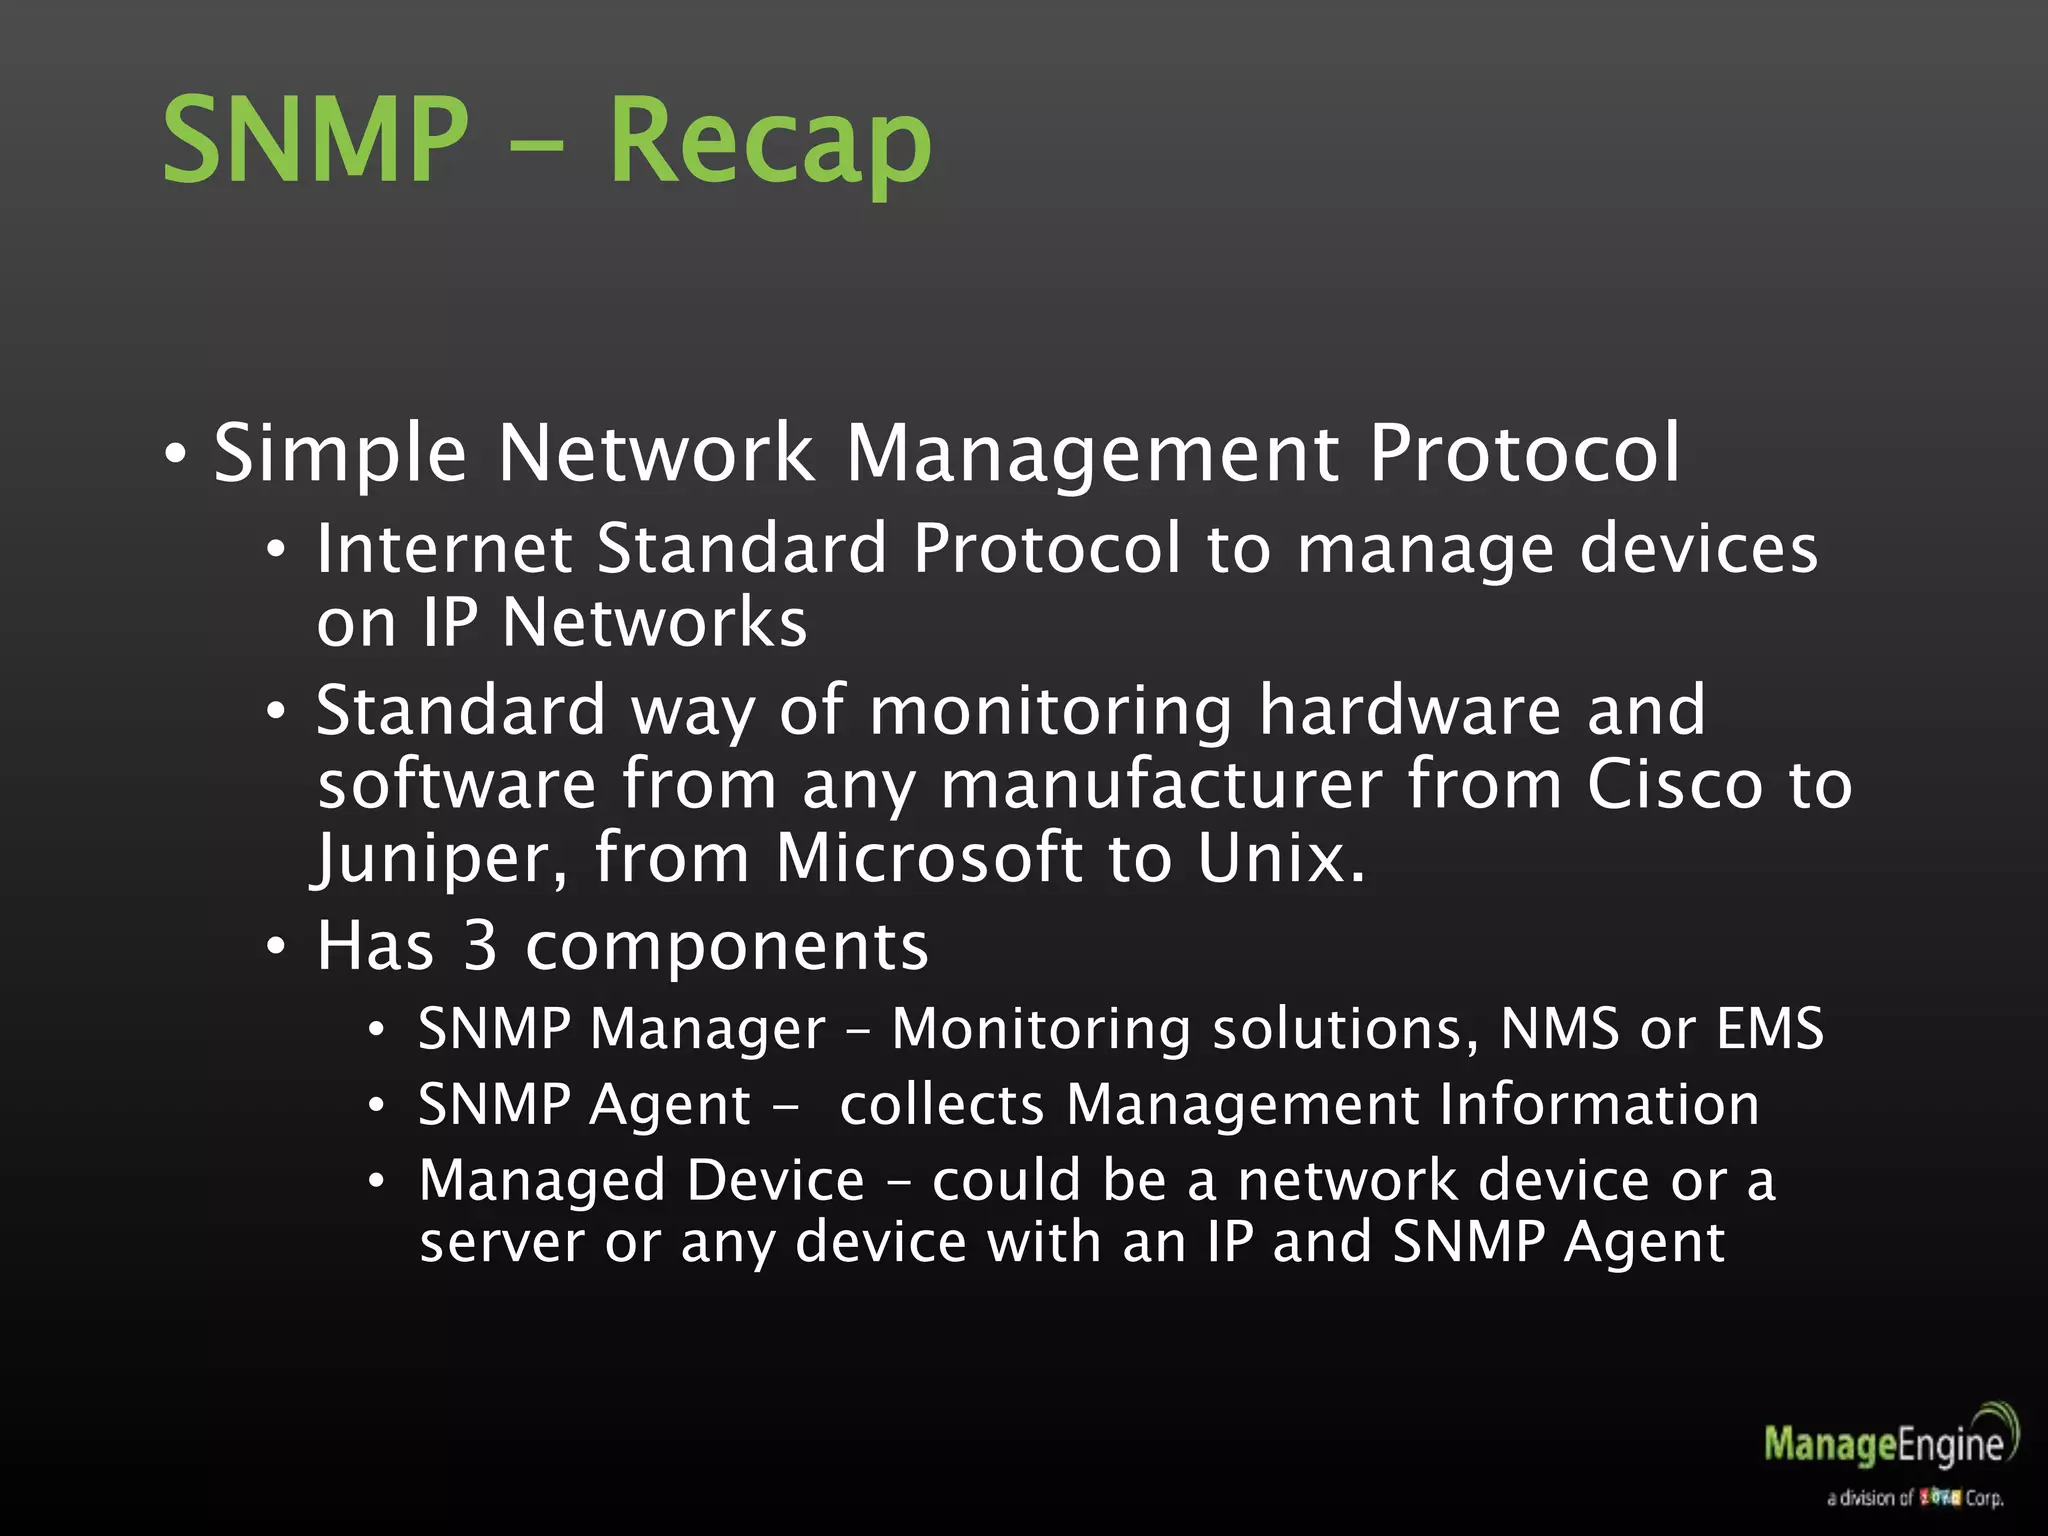
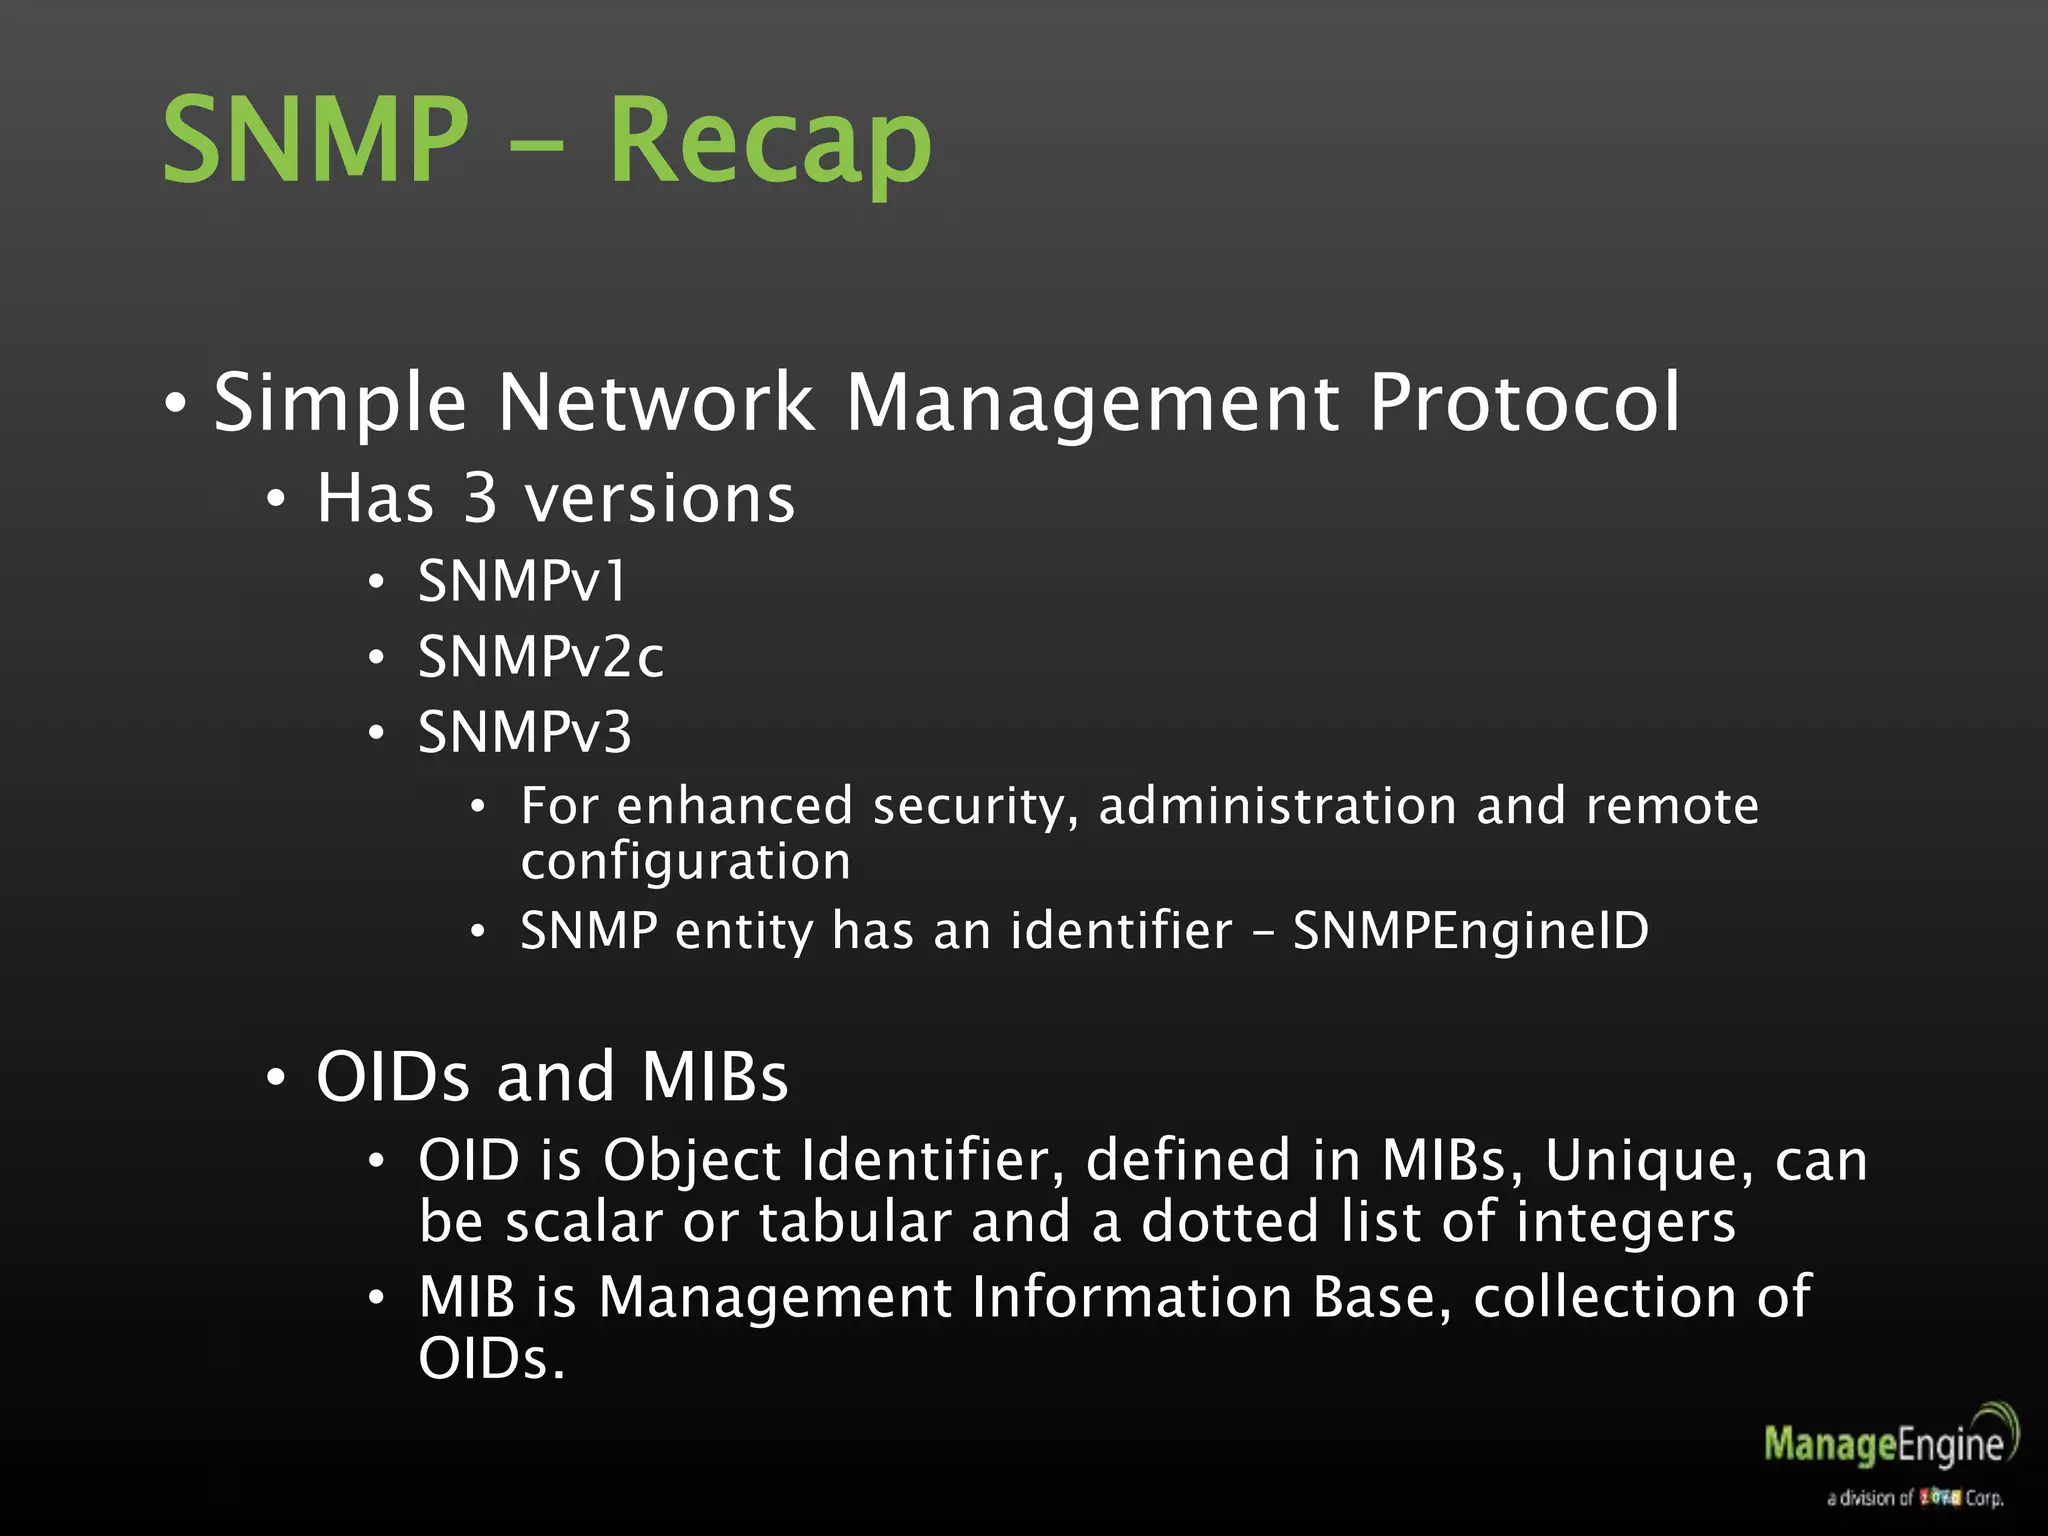
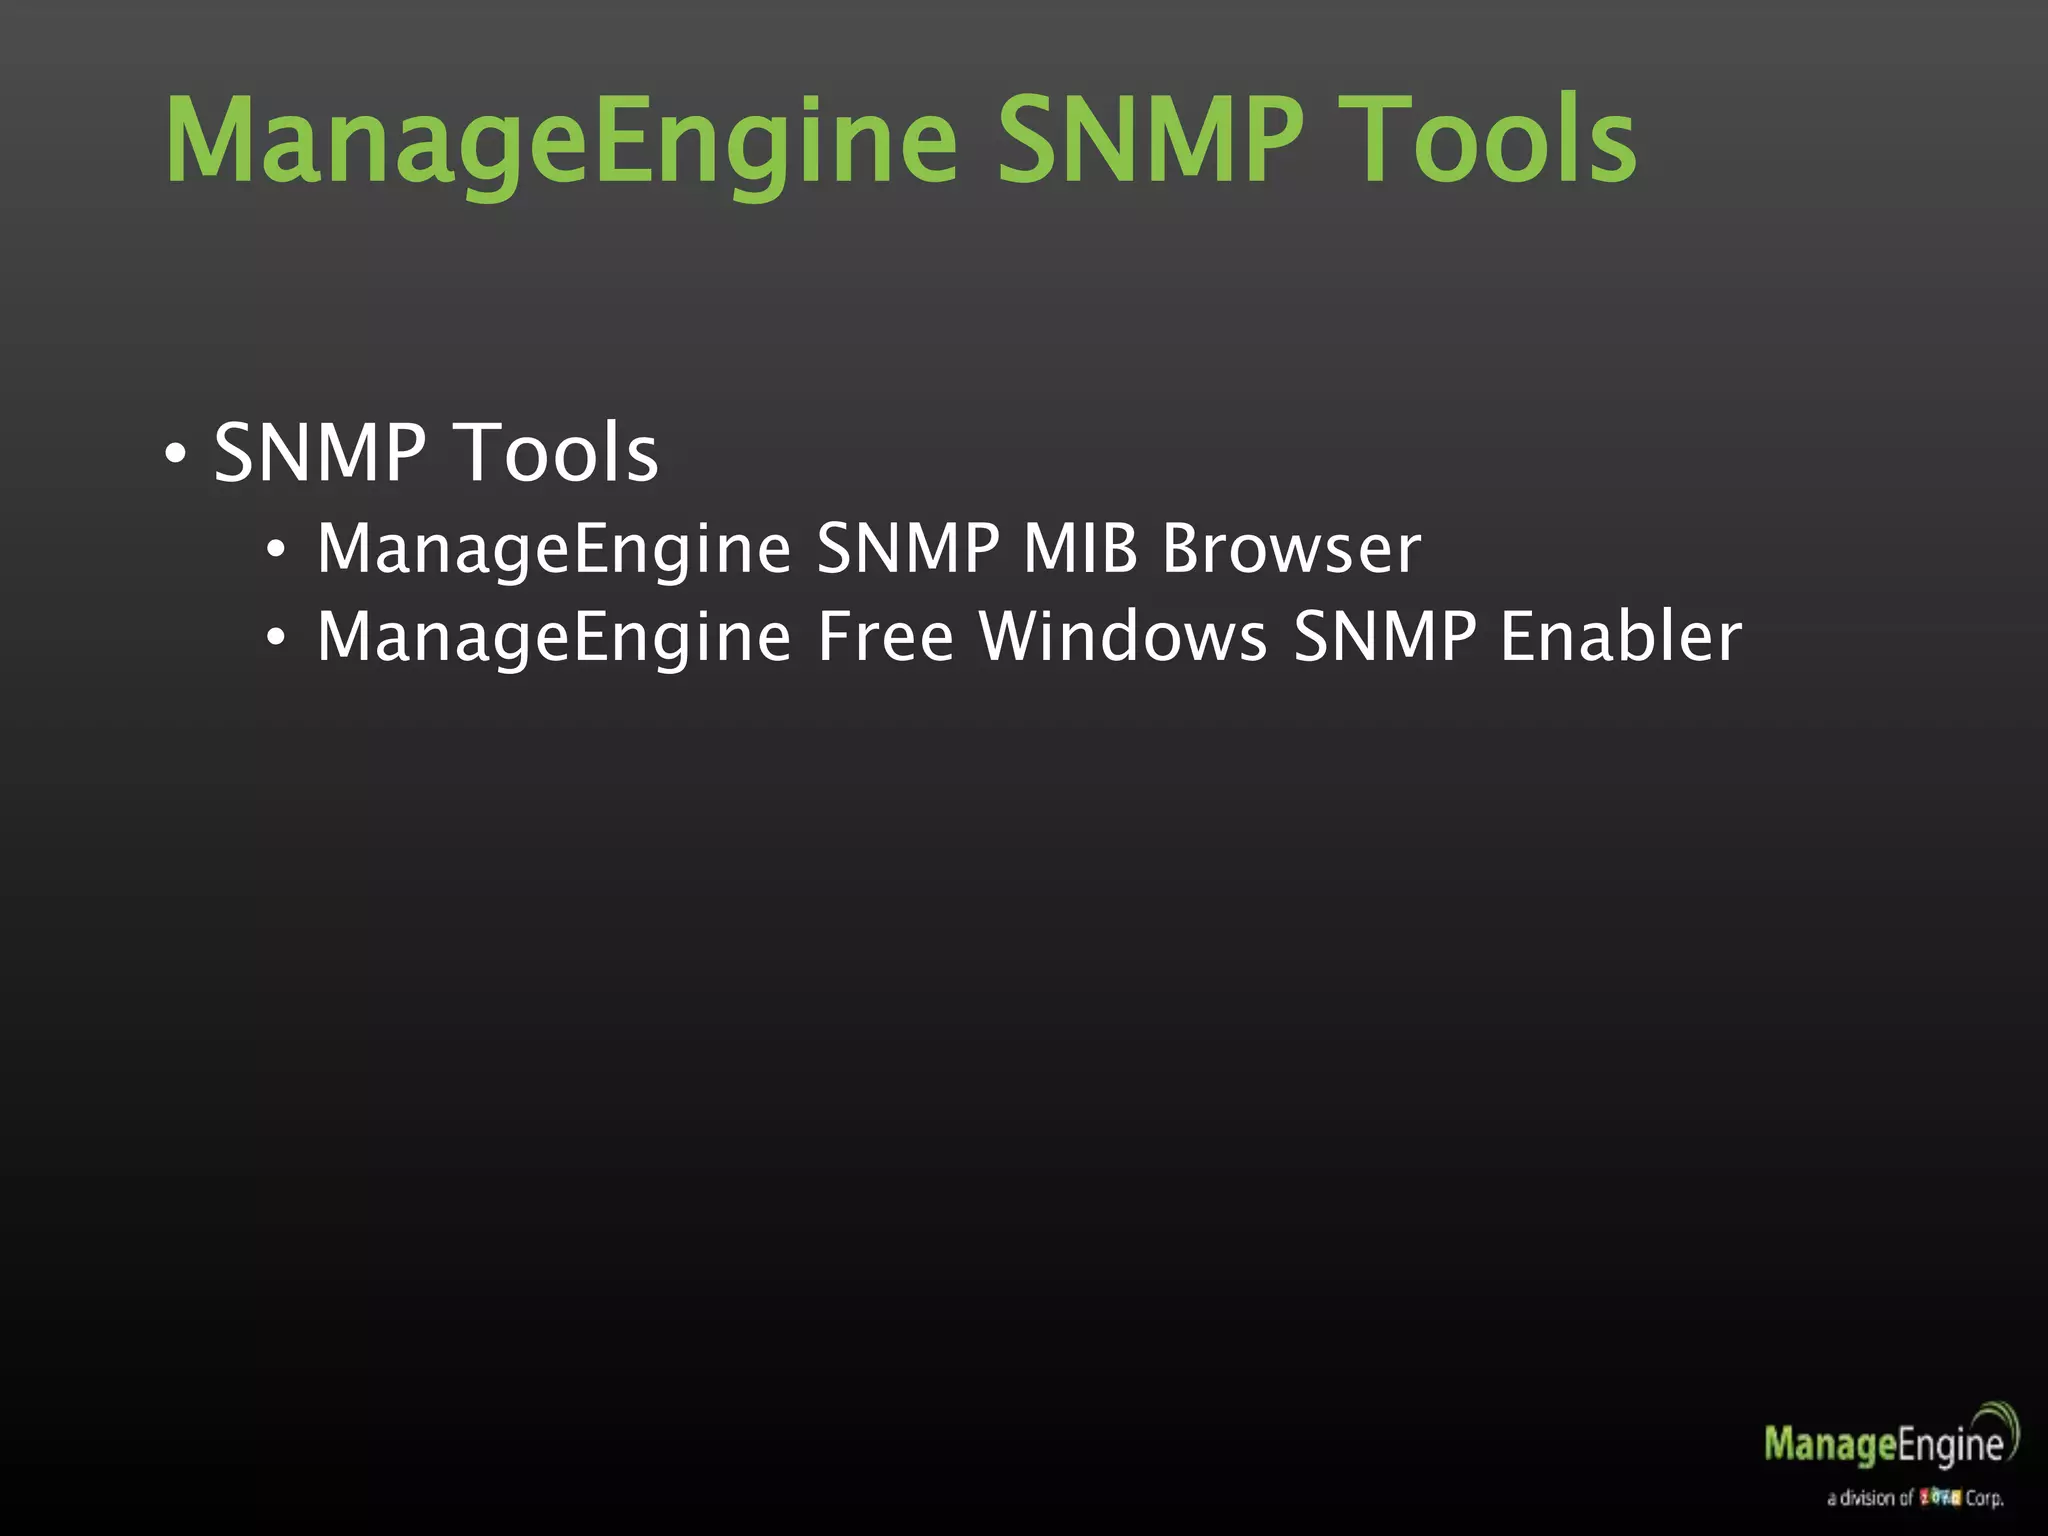
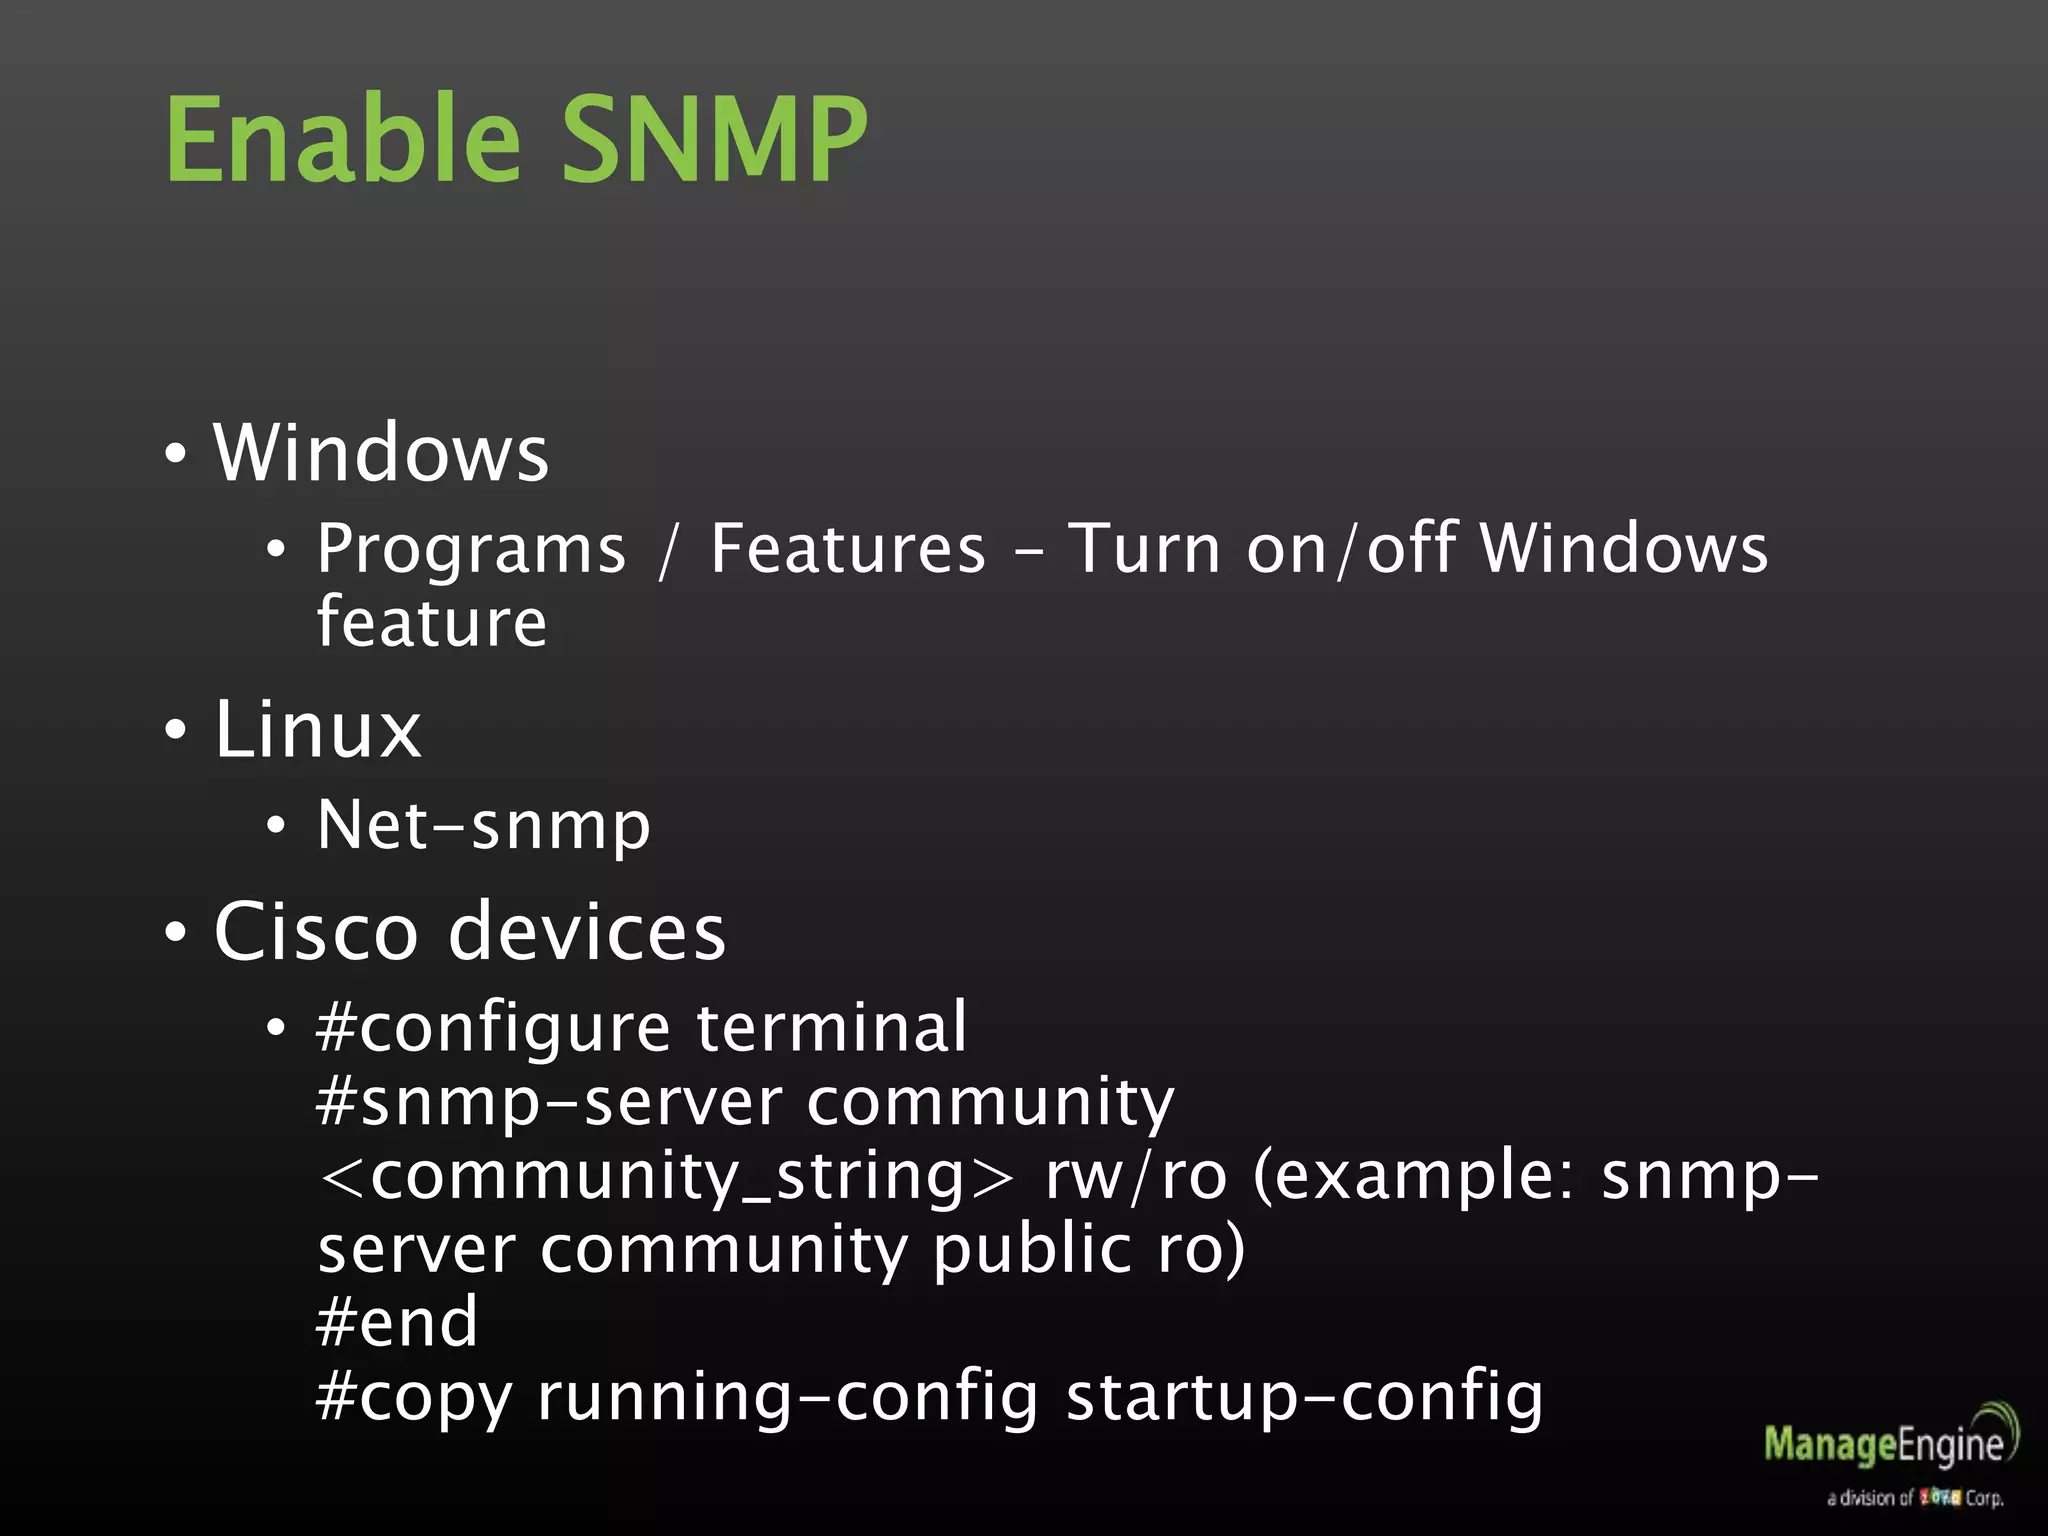
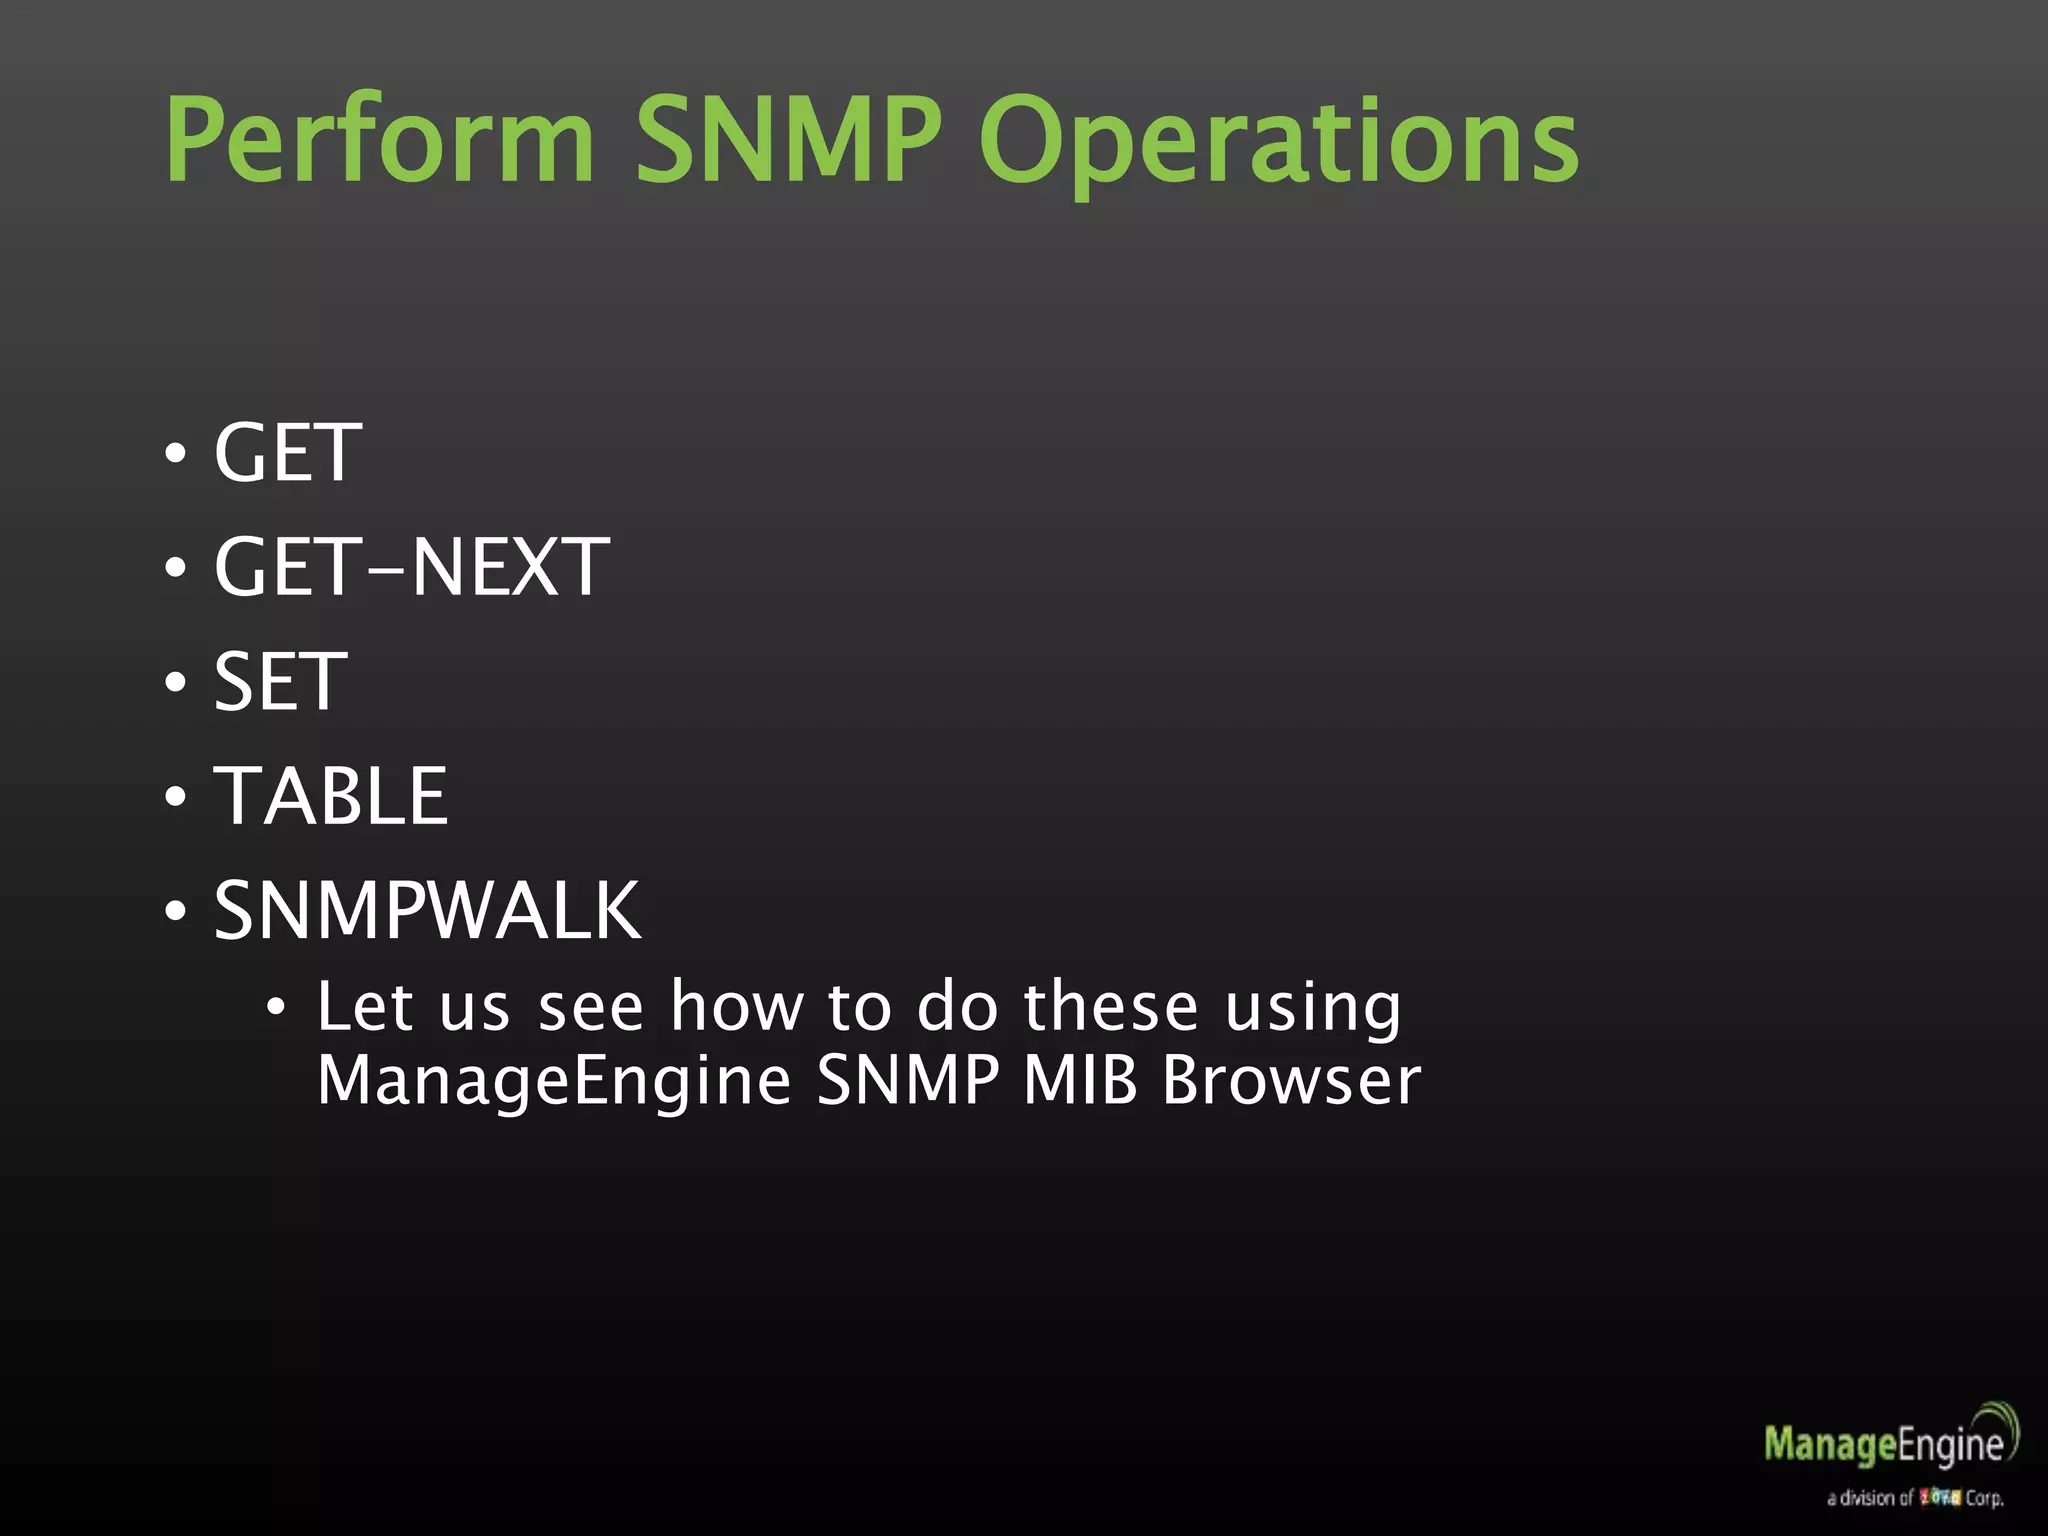
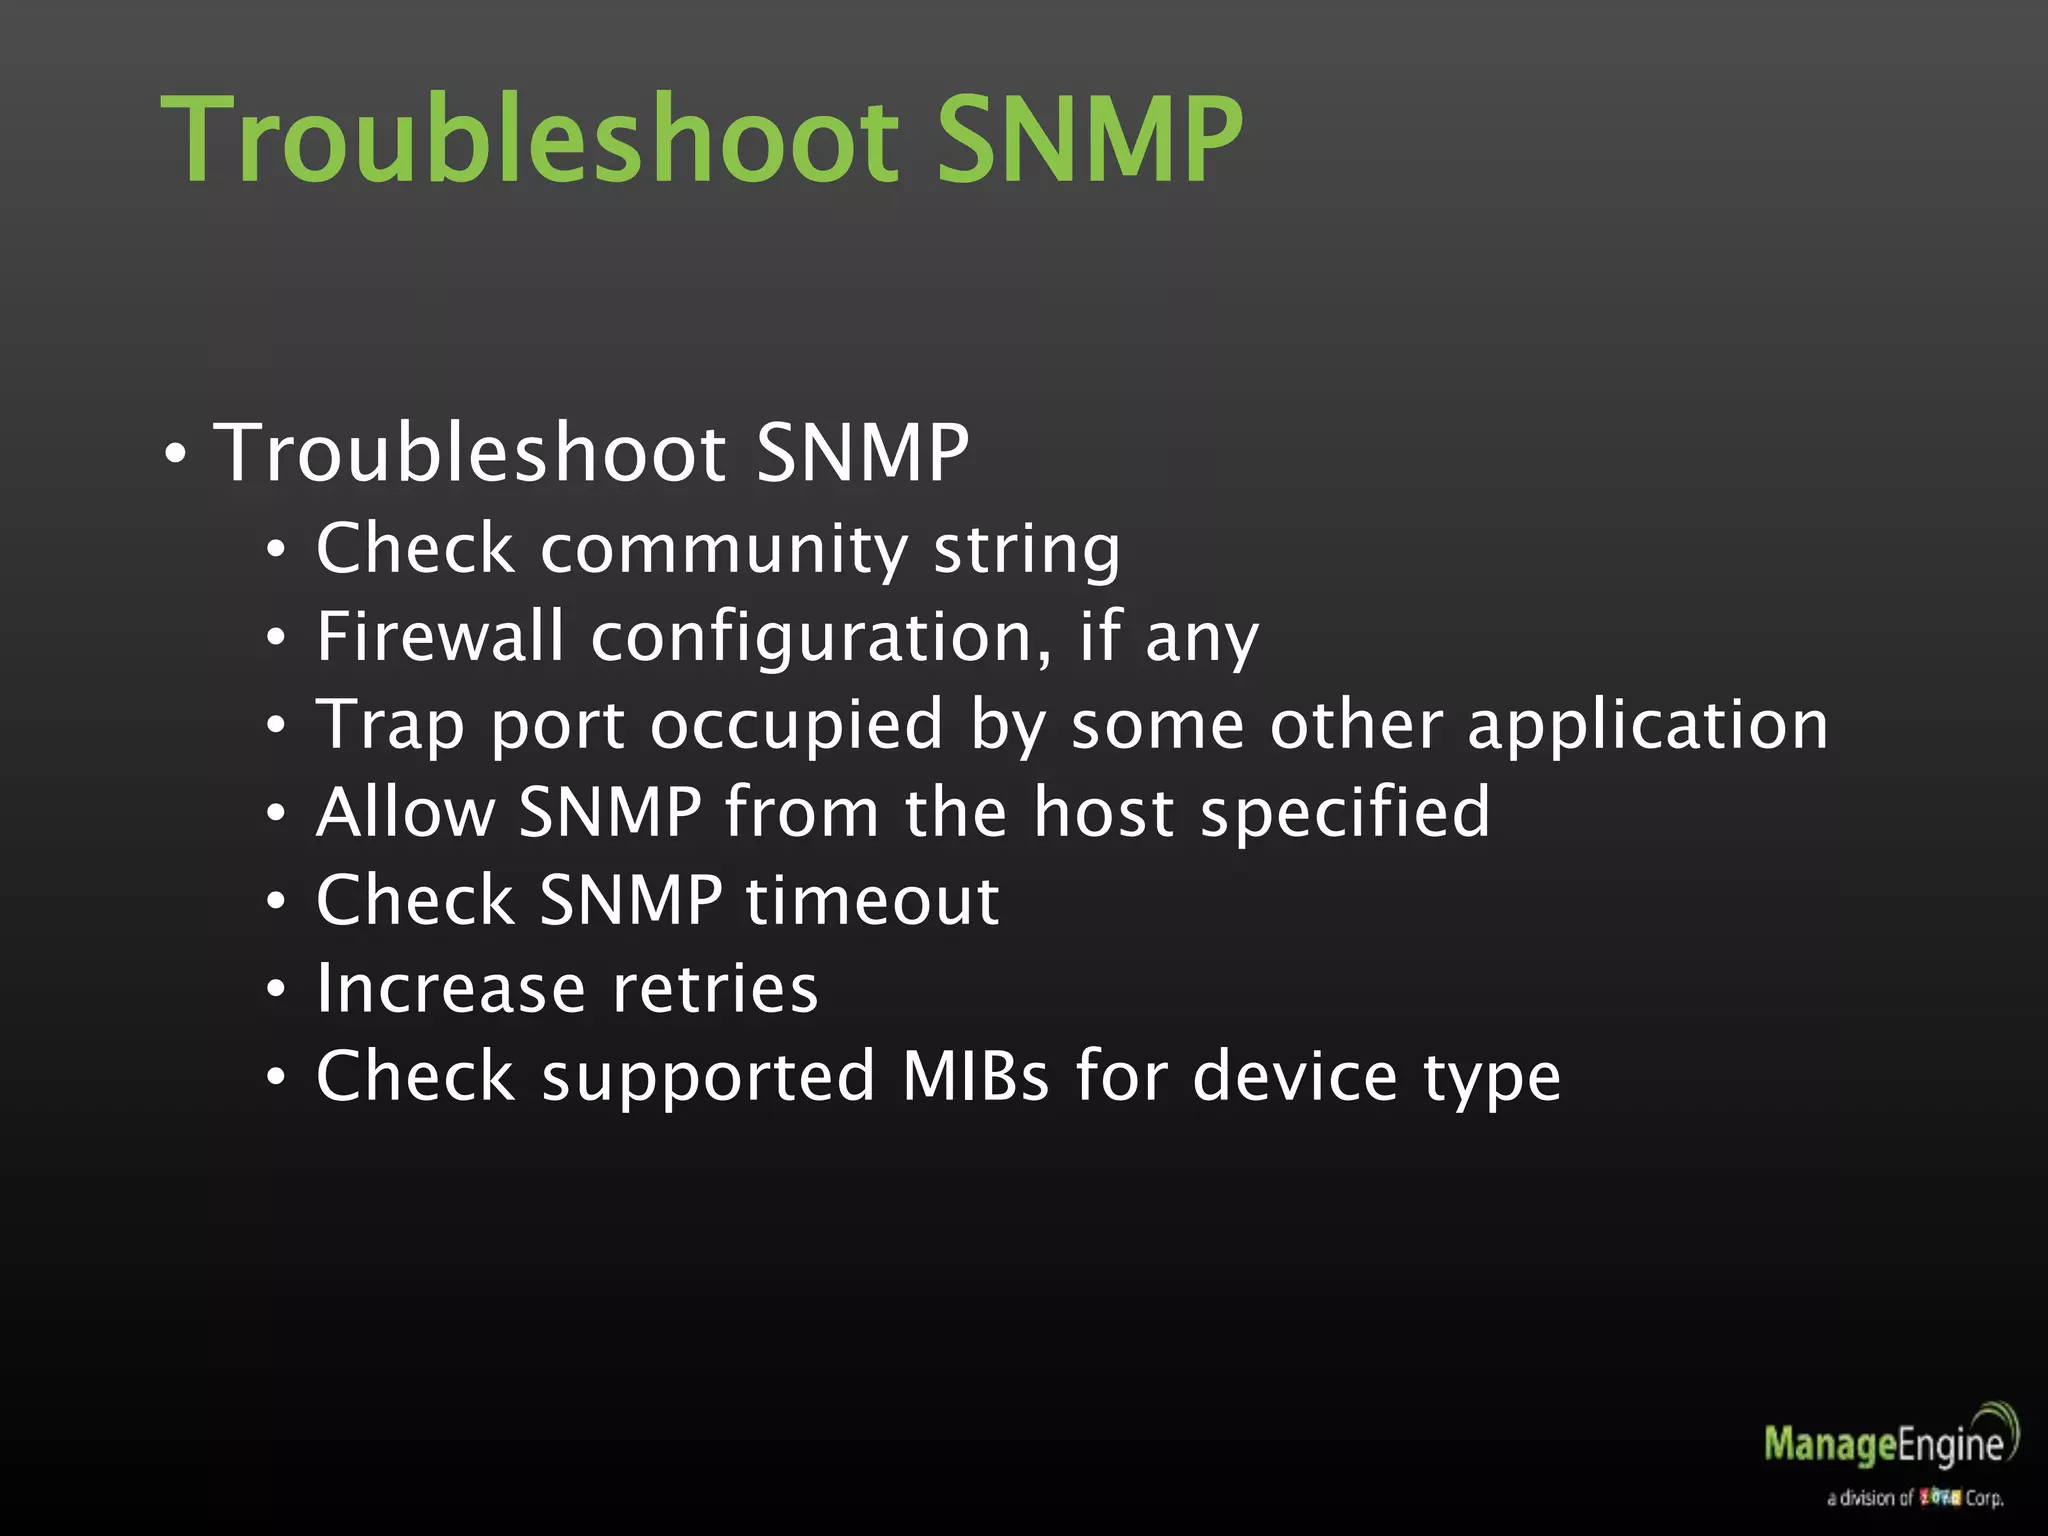

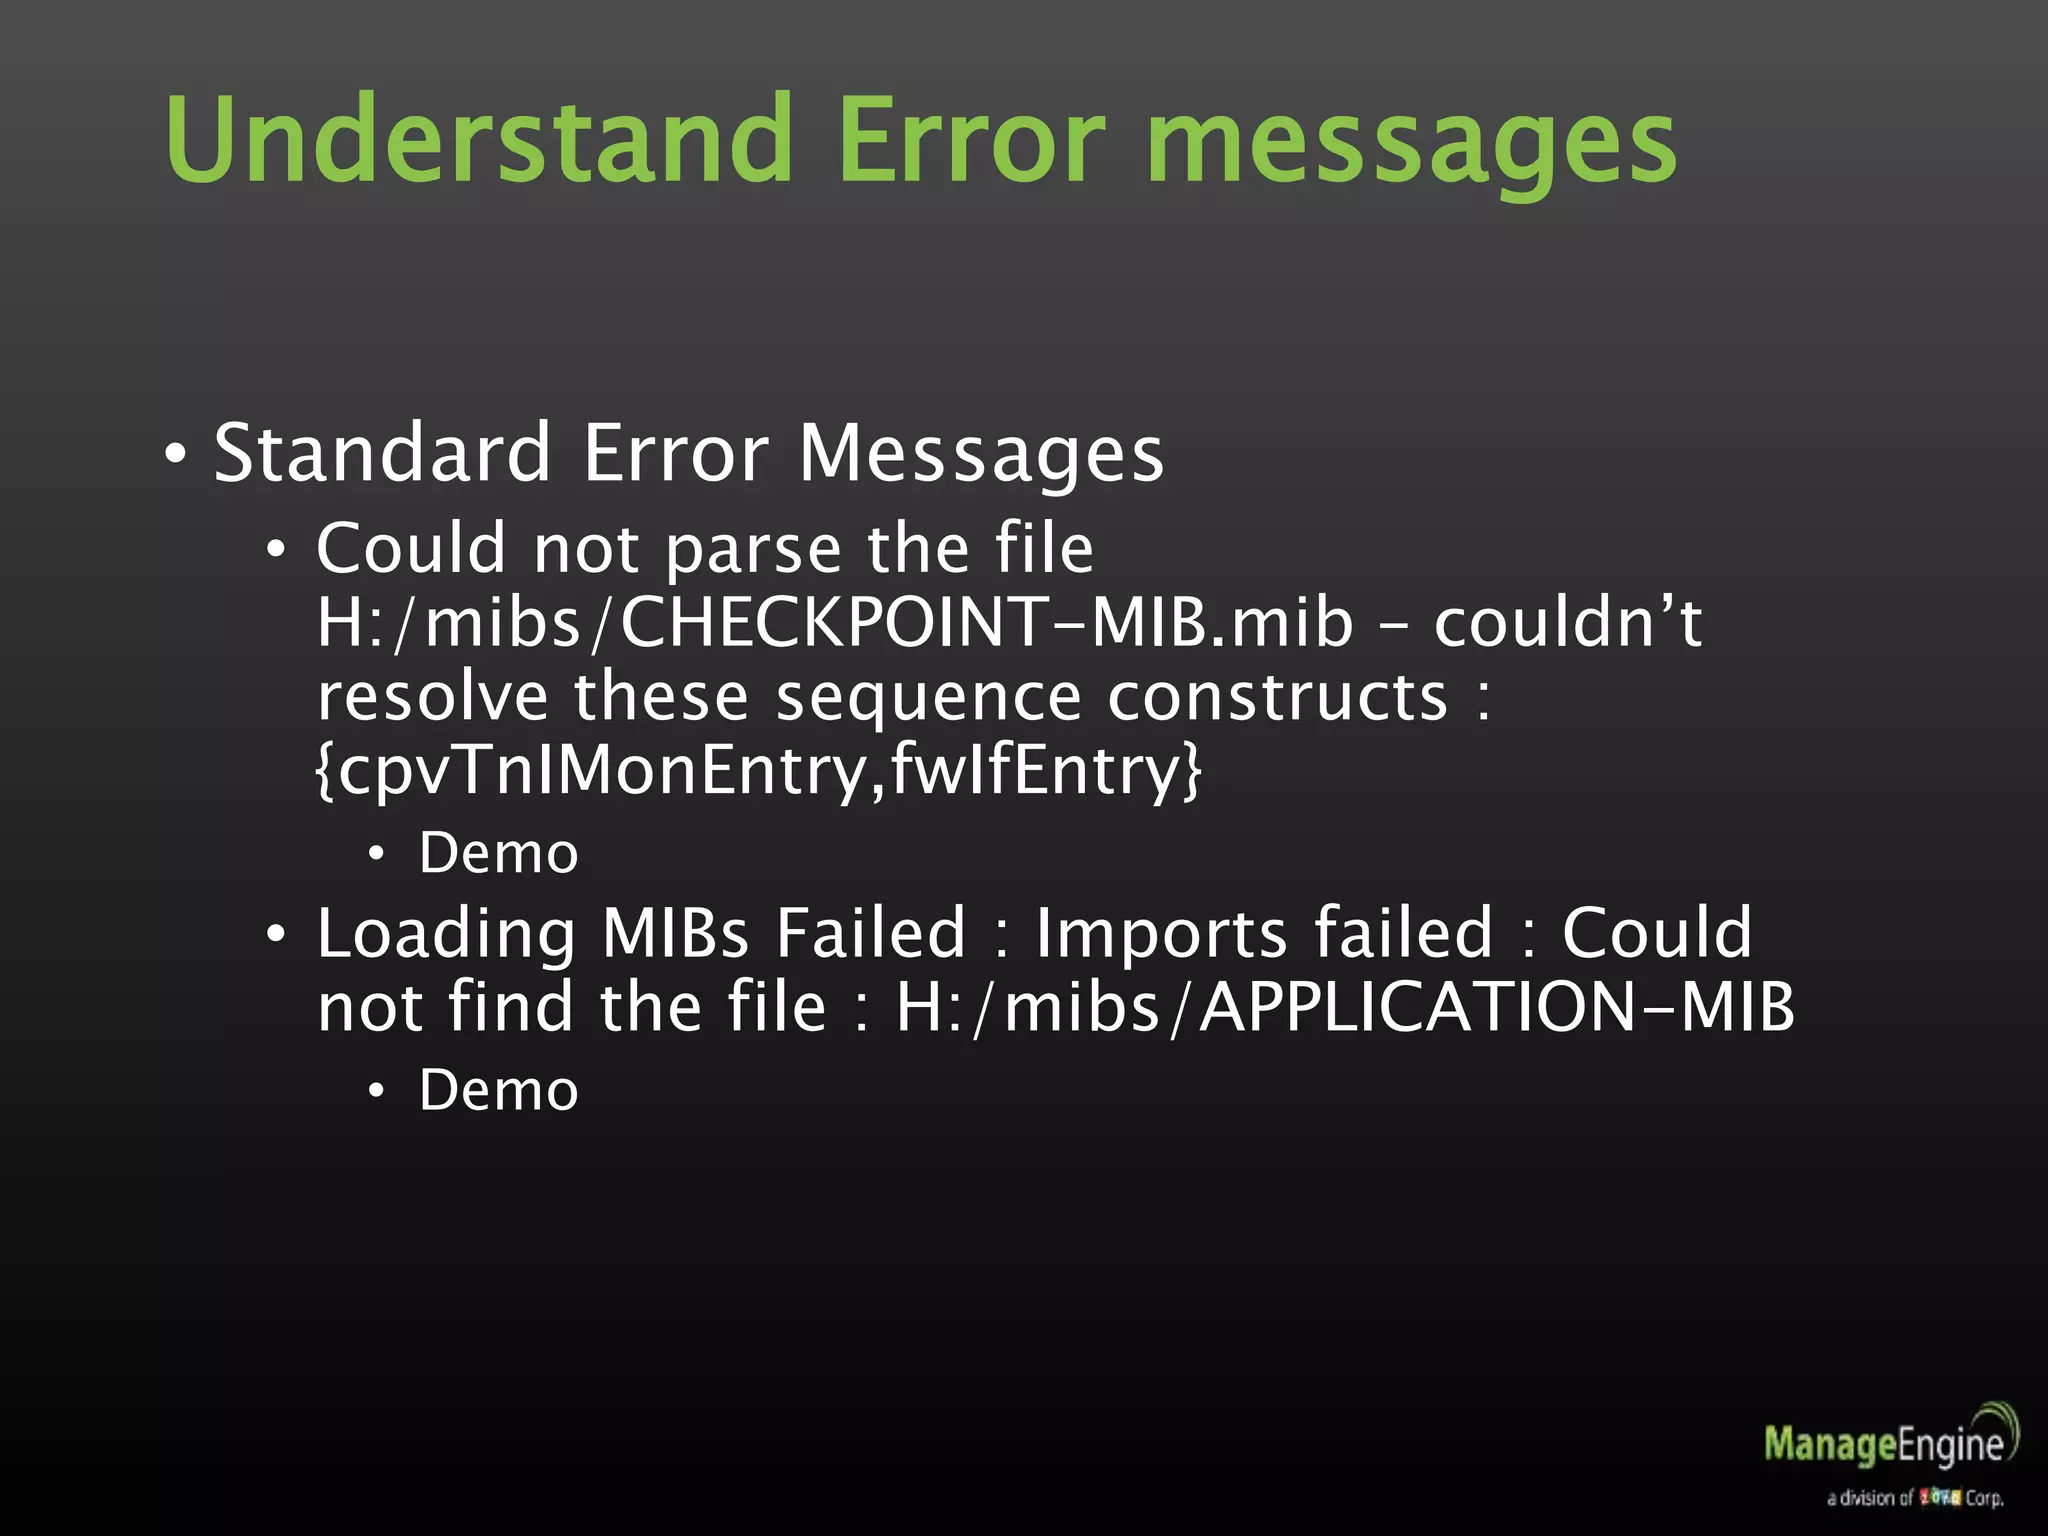
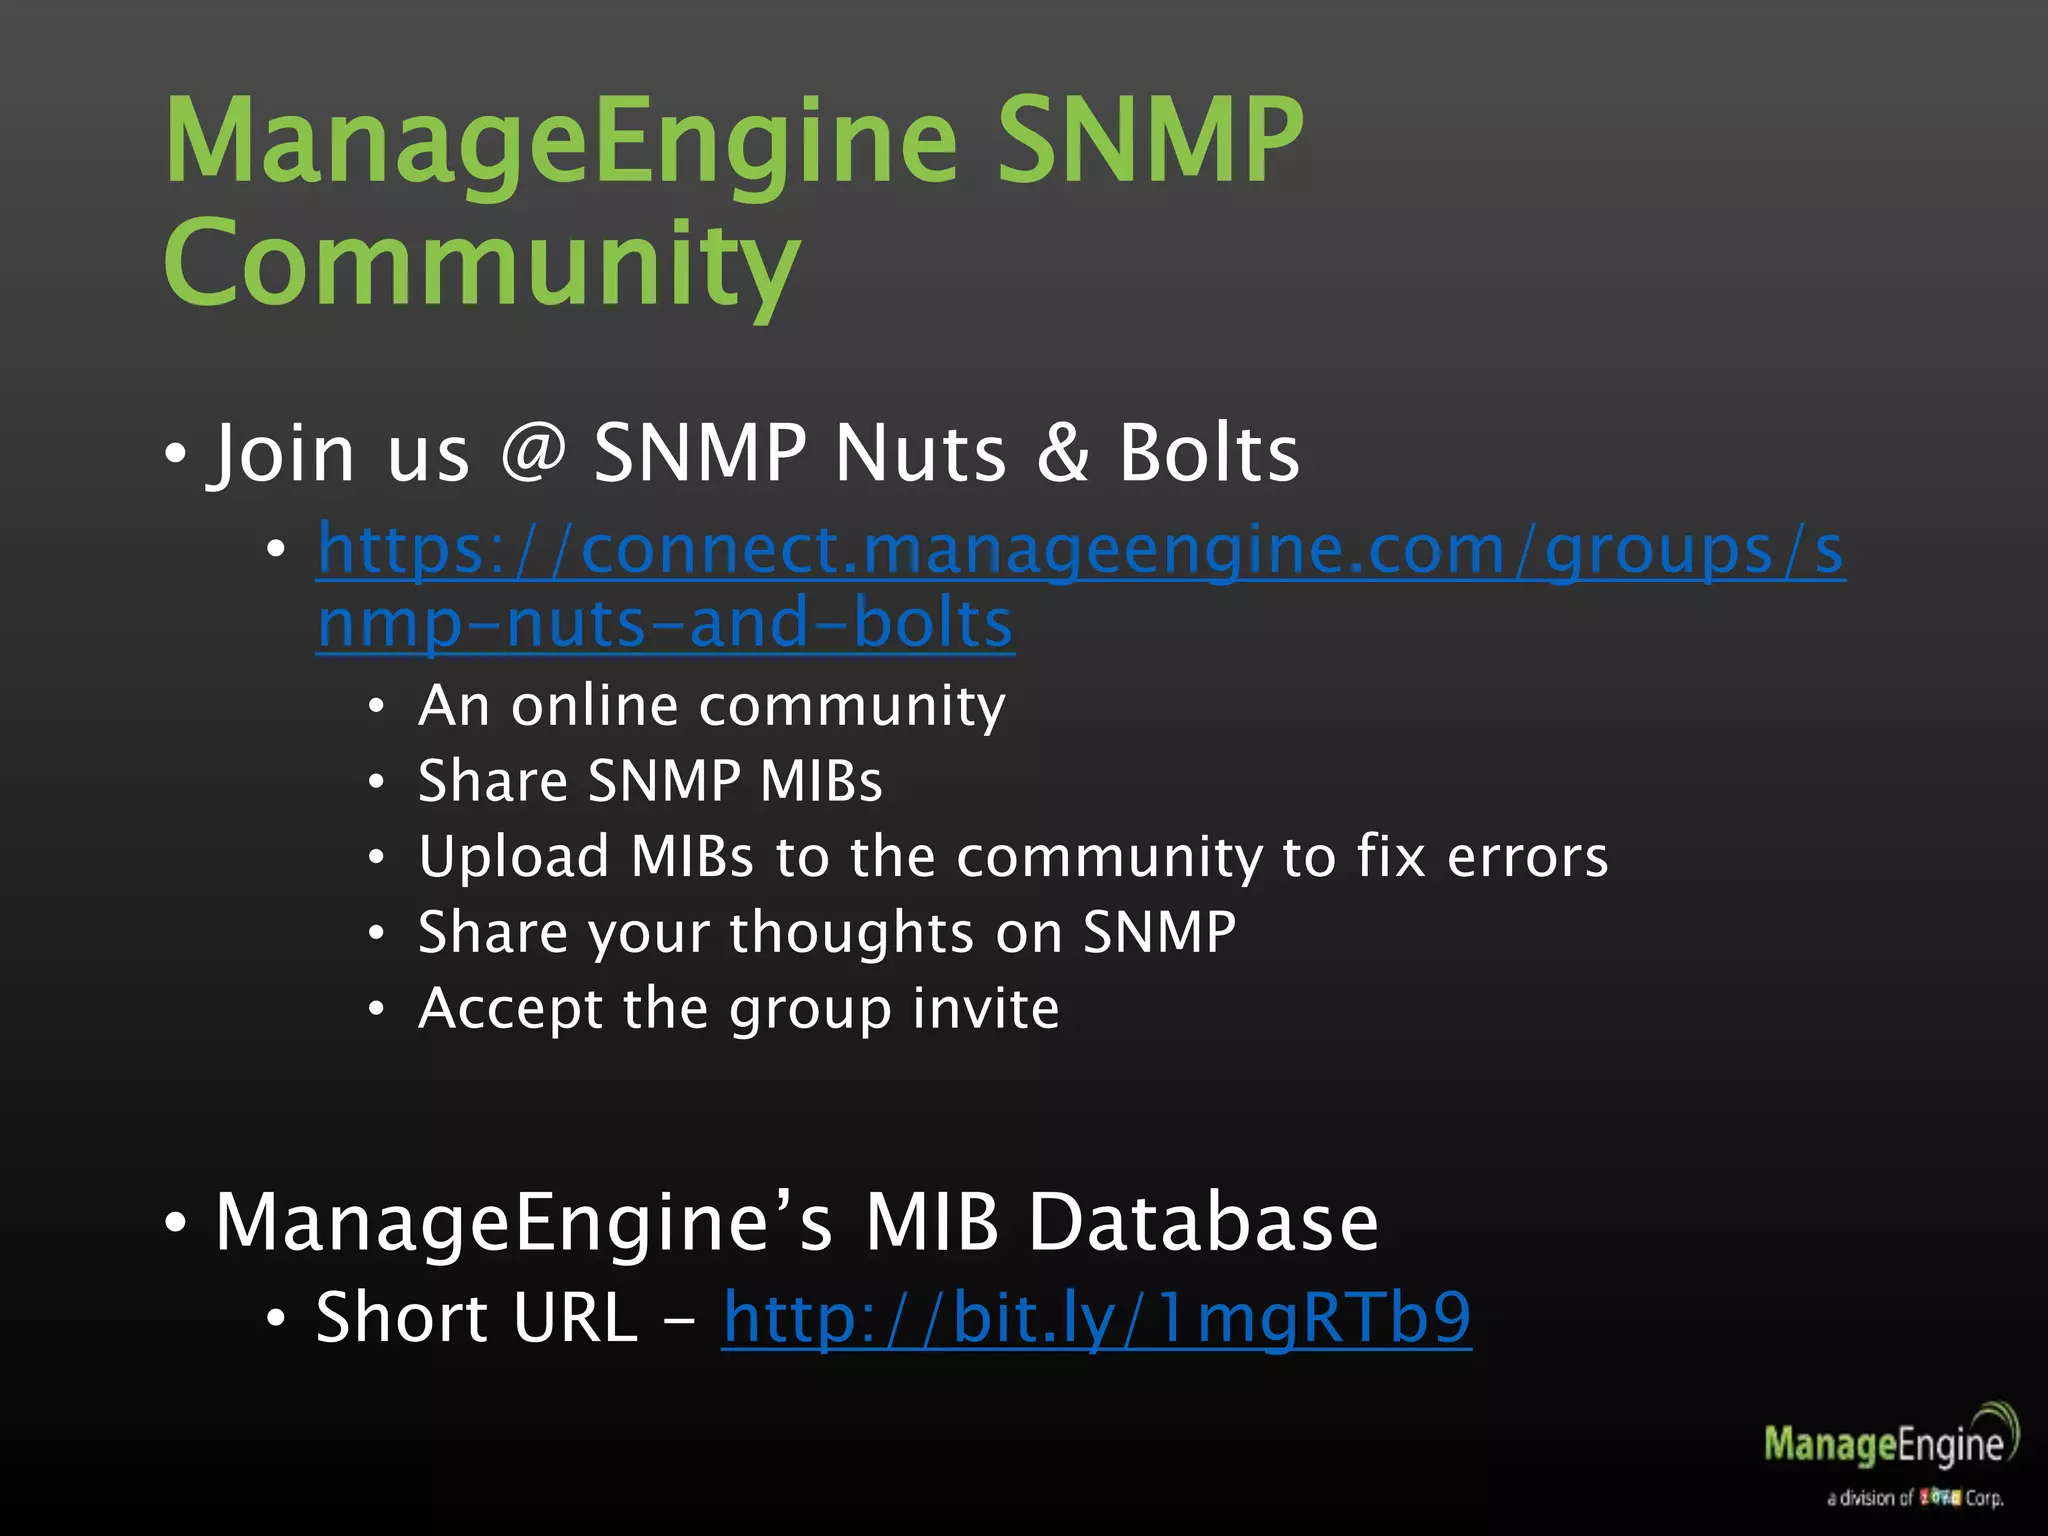


The document provides an overview of SNMP (Simple Network Management Protocol) and its management tools offered by ManageEngine, focusing on enabling SNMP, performing operations, and troubleshooting. It details the components of SNMP, including managers, agents, and managed devices, as well as the structure of OIDs and MIBs. Additionally, it highlights the functionalities of ManageEngine's SNMP MIB browser and encourages participation in an online community for SNMP-related discussions and resource sharing.

![Network Maps & Reporting [Free OpManager Training - Part 5]](https://cdn.slidesharecdn.com/ss_thumbnails/part5-custommapsandreports-180322091709-thumbnail.jpg?width=640&height=640&fit=bounds)


![[Free OpManager training] Part 4- Network fault-management & IT automation](https://cdn.slidesharecdn.com/ss_thumbnails/freeopmanagertraining-part4-fault-management-180314154708-thumbnail.jpg?width=640&height=640&fit=bounds)