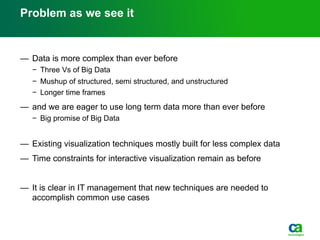
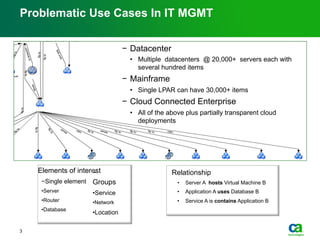
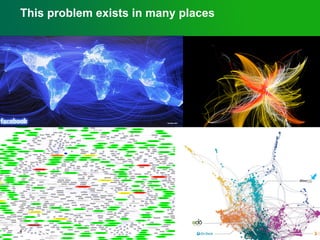
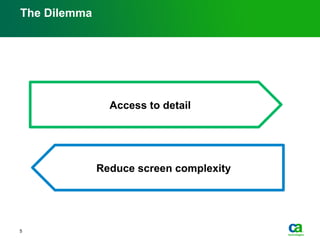
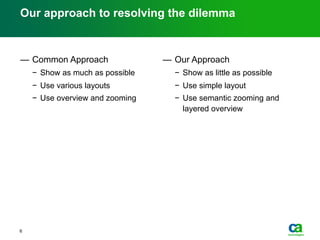
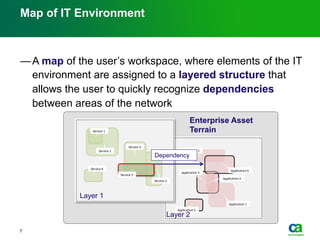
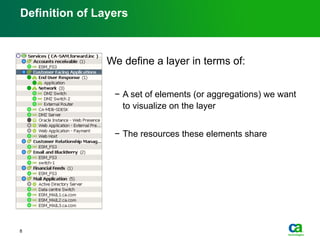
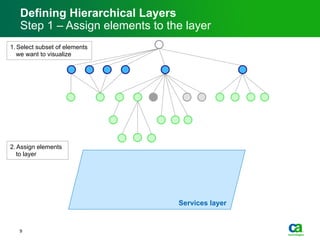
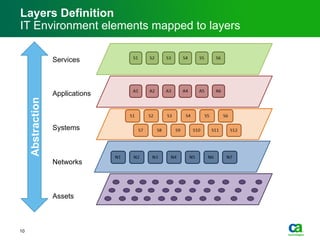
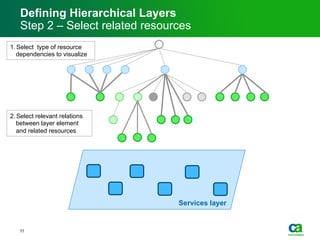
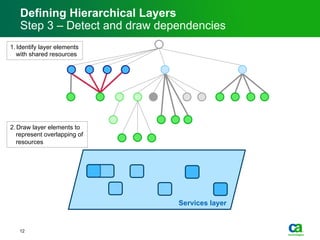
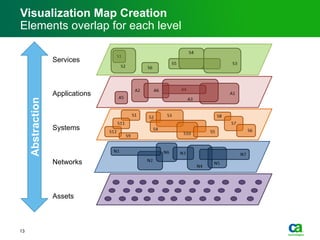
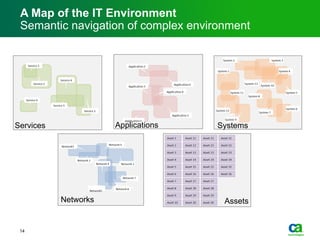
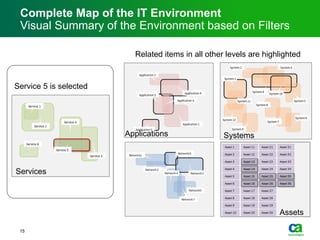
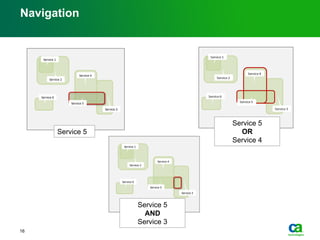
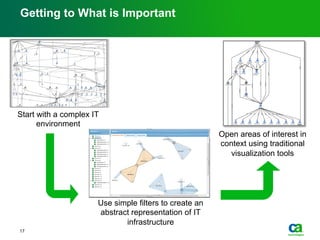
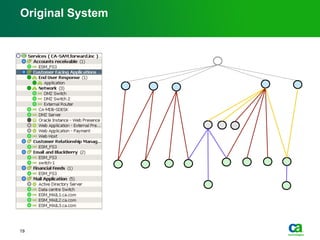
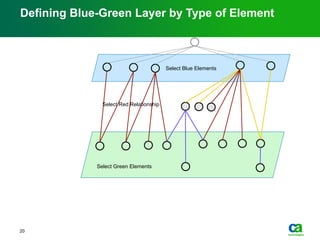
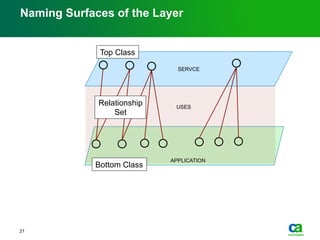
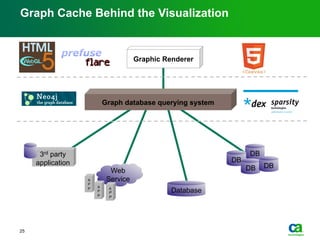
Serge Mankovski
CA Labs Research Staff Members
Big Data Visualization in IT
Management Environment
Problem as we see it
—  Data is more complex than ever before
−  Three Vs of Big Data
−  Mushup of structured, semi structured, and unstructured
−  Longer time frames
—  and we are eager to use long term data more than ever before
−  Big promise of Big Data
—  Existing visualization techniques mostly built for less complex data
—  Time constraints for interactive visualization remain as before
—  It is clear in IT management that new techniques are needed to
accomplish common use cases
Problematic Use Cases In IT MGMT
Elements of interest
− Single element
• Server
• Router
• Database
− 
Groups
• Service
• Network
• Location
Relationship
•  Server A hosts Virtual Machine B
•  Application A uses Database B
•  Service A is contains Application B
3
−  Datacenter
•  Multiple datacenters @ 20,000+ servers each with
several hundred items
−  Mainframe
•  Single LPAR can have 30,000+ items
−  Cloud Connected Enterprise
•  All of the above plus partially transparent cloud
deployments
4
This problem exists in many places
The Dilemma
5
Access to detail
Reduce screen complexity
6
Our approach to resolving the dilemma
—  Common Approach
−  Show as much as possible
−  Use various layouts
−  Use overview and zooming
—  Our Approach
−  Show as little as possible
−  Use simple layout
−  Use semantic zooming and
layered overview
Map of IT Environment
— A map of the user’s workspace, where elements of the IT
environment are assigned to a layered structure that
allows the user to quickly recognize dependencies
between areas of the network
7
Enterprise Asset
Terrain
Layer 1
Layer 2
Dependency
Definition of Layers
We define a layer in terms of:
−  A set of elements (or aggregations) we want
to visualize on the layer
−  The resources these elements share
8
Defining Hierarchical Layers
Step 1 – Assign elements to the layer
1. Select subset of elements
we want to visualize
2. Assign elements
to layer
Services layer
9
Layers Definition
IT Environment elements mapped to layers
Abstraction
Services
Applications
Systems
Networks
Assets
10
Defining Hierarchical Layers
Step 2 – Select related resources
1. Select type of resource
dependencies to visualize
2. Select relevant relations
between layer element
and related resources
Services layer
11
Defining Hierarchical Layers
Step 3 – Detect and draw dependencies
1. Identify layer elements
with shared resources
2. Draw layer elements to
represent overlapping of
resources
Services layer
12
Visualization Map Creation
Elements overlap for each level
Abstraction
Services
Applications
Systems
Networks
Assets
13
A Map of the IT Environment
Semantic navigation of complex environment
Services Applications Systems
AssetsNetworks
14
Complete Map of the IT Environment
Visual Summary of the Environment based on Filters
Service 5 is selected
Services
Related items in all other levels are highlighted
Applications Systems
Assets
15
Navigation
Service 5
Service 5
OR
Service 4
Service 5
AND
Service 3
16
Getting to What is Important
Start with a complex IT
environment
Use simple filters to create an
abstract representation of IT
infrastructure
Open areas of interest in
context using traditional
visualization tools
17
Semantic Aspects of Layer Formation
18Innovation by CA Labs Copyright © 2010 CA. All rights reserved. February 21st 2012
Original System
19
Select Green Elements
Select Blue Elements
Defining Blue-Green Layer by Type of Element
20
Select Red Relationship
Naming Surfaces of the Layer
21
APPLICATION
SERVCE
USES
Top Class
Bottom Class
Relationship
Set
Equivalence
22 CEWIT 2011 November 3rd, 2011
Equivalency in Top and Bottom
Classes
red = gray
yellow = green
Equivalency in Relationship Set
(yellow = green)
23 CEWIT 2011 November 3rd, 2011
Transitive Closure
3
5 64 7
1 2
98 10
3
54
1 2
98 10
1 -> 4 -> 8 => 1 -> 8
2 -> 4 -> 8 => 2 -> 8
2 -> 5 -> 9 => 2 -> 9
3 -> 5 -> 9 => 3 -> 9
3 -> 6 -> 8 => 3 -> 8
3 -> 7 -> 9 => 3 -> 9
Becomes
Storage behind visualization
24Innovation by CA Labs Copyright © 2010 CA. All rights reserved. February 21st 2012
Graph Cache Behind the Visualization
Graphic Renderer
Web
Service
Database
A
P
P A
P
P
A
P
P
DB
DB
DB DB
Graph database querying system
3rd party
application
25
Graph cache performance gains
26
27
Questions?

Big Data Visualization Problem in IT Management

  • 1.
    Serge Mankovski CA LabsResearch Staff Members Big Data Visualization in IT Management Environment
  • 2.
    Problem as wesee it —  Data is more complex than ever before −  Three Vs of Big Data −  Mushup of structured, semi structured, and unstructured −  Longer time frames —  and we are eager to use long term data more than ever before −  Big promise of Big Data —  Existing visualization techniques mostly built for less complex data —  Time constraints for interactive visualization remain as before —  It is clear in IT management that new techniques are needed to accomplish common use cases
  • 3.
    Problematic Use CasesIn IT MGMT Elements of interest − Single element • Server • Router • Database −  Groups • Service • Network • Location Relationship •  Server A hosts Virtual Machine B •  Application A uses Database B •  Service A is contains Application B 3 −  Datacenter •  Multiple datacenters @ 20,000+ servers each with several hundred items −  Mainframe •  Single LPAR can have 30,000+ items −  Cloud Connected Enterprise •  All of the above plus partially transparent cloud deployments
  • 4.
    4 This problem existsin many places
  • 5.
    The Dilemma 5 Access todetail Reduce screen complexity
  • 6.
    6 Our approach toresolving the dilemma —  Common Approach −  Show as much as possible −  Use various layouts −  Use overview and zooming —  Our Approach −  Show as little as possible −  Use simple layout −  Use semantic zooming and layered overview
  • 7.
    Map of ITEnvironment — A map of the user’s workspace, where elements of the IT environment are assigned to a layered structure that allows the user to quickly recognize dependencies between areas of the network 7 Enterprise Asset Terrain Layer 1 Layer 2 Dependency
  • 8.
    Definition of Layers Wedefine a layer in terms of: −  A set of elements (or aggregations) we want to visualize on the layer −  The resources these elements share 8
  • 9.
    Defining Hierarchical Layers Step1 – Assign elements to the layer 1. Select subset of elements we want to visualize 2. Assign elements to layer Services layer 9
  • 10.
    Layers Definition IT Environmentelements mapped to layers Abstraction Services Applications Systems Networks Assets 10
  • 11.
    Defining Hierarchical Layers Step2 – Select related resources 1. Select type of resource dependencies to visualize 2. Select relevant relations between layer element and related resources Services layer 11
  • 12.
    Defining Hierarchical Layers Step3 – Detect and draw dependencies 1. Identify layer elements with shared resources 2. Draw layer elements to represent overlapping of resources Services layer 12
  • 13.
    Visualization Map Creation Elementsoverlap for each level Abstraction Services Applications Systems Networks Assets 13
  • 14.
    A Map ofthe IT Environment Semantic navigation of complex environment Services Applications Systems AssetsNetworks 14
  • 15.
    Complete Map ofthe IT Environment Visual Summary of the Environment based on Filters Service 5 is selected Services Related items in all other levels are highlighted Applications Systems Assets 15
  • 16.
    Navigation Service 5 Service 5 OR Service4 Service 5 AND Service 3 16
  • 17.
    Getting to Whatis Important Start with a complex IT environment Use simple filters to create an abstract representation of IT infrastructure Open areas of interest in context using traditional visualization tools 17
  • 18.
    Semantic Aspects ofLayer Formation 18Innovation by CA Labs Copyright © 2010 CA. All rights reserved. February 21st 2012
  • 19.
  • 20.
    Select Green Elements SelectBlue Elements Defining Blue-Green Layer by Type of Element 20 Select Red Relationship
  • 21.
    Naming Surfaces ofthe Layer 21 APPLICATION SERVCE USES Top Class Bottom Class Relationship Set
  • 22.
    Equivalence 22 CEWIT 2011November 3rd, 2011 Equivalency in Top and Bottom Classes red = gray yellow = green Equivalency in Relationship Set (yellow = green)
  • 23.
    23 CEWIT 2011November 3rd, 2011 Transitive Closure 3 5 64 7 1 2 98 10 3 54 1 2 98 10 1 -> 4 -> 8 => 1 -> 8 2 -> 4 -> 8 => 2 -> 8 2 -> 5 -> 9 => 2 -> 9 3 -> 5 -> 9 => 3 -> 9 3 -> 6 -> 8 => 3 -> 8 3 -> 7 -> 9 => 3 -> 9 Becomes
  • 24.
    Storage behind visualization 24Innovationby CA Labs Copyright © 2010 CA. All rights reserved. February 21st 2012
  • 25.
    Graph Cache Behindthe Visualization Graphic Renderer Web Service Database A P P A P P A P P DB DB DB DB Graph database querying system 3rd party application 25
  • 26.
  • 27.